 Christine L. Sun1


- 1 Department of Microbiology, Cornell University, Ithaca, NY, USA
- 2 Department of Natural Resources, Cornell University, Ithaca, NY, USA
Fluctuating environmental conditions can promote diversity and control dominance in community composition. In addition to seasonal temperature and moisture changes, seasonal supply of metabolic substrates selects populations temporally. Here we demonstrate cascading effects in the supply of metabolic substrates on methanogenesis and community composition of anaerobic methanogenic archaea in three contrasting peatlands in upstate New York. Fresh samples of peat soils, collected about every 3 months for 20 months and incubated at 22 ± 2°C regardless of the in situ temperature, exhibited potential rates of methane (CH4) production of 0.02–0.2 mmol L−1 day−1 [380–3800 nmol g−1 (dry) day−1). The addition of acetate stimulated rates of CH4 production in a fen peatland soil, whereas addition of hydrogen (H2), and simultaneous inhibition of H2-consuming acetogenic bacteria with rifampicin, stimulated CH4 production in two acidic bog soils, especially, in autumn and winter. The methanogenic community structure was characterized using T-RFLP analyses of SSU rRNA genes. The E2 group of methanogens (Methanoregulaceae) dominated in the two acidic bog peatlands with relatively greater abundance in winter. In the fen peatland, the E1 group (Methanoregulaceae) and members of the Methanosaetaceae were co-dominant, with E1 having a high relative abundance in spring. Change in relative abundance profiles among methanogenic groups in response to added metabolic substrates was as predicted. The acetate-amendment increased abundance of Methanosarcinaceae, and H2-amendment enhanced abundance of E2 group in all peat soils studied, respectively. Additionally, addition of acetate increased abundance of Methanosaetaceae only in the bog soils. Variation in the supply of metabolic substrates helps explain the moderate diversity of methanogens in peatlands.
Introduction
The ecological literature has many examples in which fluctuating environmental conditions promote diversity in community composition (Chesson and Huntly, 1997). When temperature, moisture, and resources fluctuate, optimal conditions for a given population will vary throughout the year, and thus community dominance varies accordingly. For microorganisms, there are two mechanisms. One is dispersal from a larger source that facilitates immigration and rise in dominance when optimal environmental conditions occur. This is called the mass-effect (Mouquet and Loreau, 2002) in the ecological literature. The other mechanism is called species-sorting (Leibold, 1998) in which all members of the local community are present throughout the year, but their temporal niche varies in response to optimal conditions. Understanding mechanisms that control regional and local composition of microbial communities is imperative in light of on-going environmental changes.
In boreal and cool temperate peatlands, for example, microorganisms are subjected to long, cold winters and short summers with more permissive growing conditions. Microbial activity in summer in response to warm temperatures is not surprising. However, activity after the growing season benefits from input of senescent plant tissue that provides energy and nutrients, and microbial activity in soils in wintertime is well established (cf., McMahon et al., 2011). Therefore, the question is whether a seasonal supply of metabolic substrates is strong enough to control diversity in a microbial community (cf., Hiltunen et al., 2008).
Here we are particularly interested in saturated organic soils that provide habitat for anaerobic microorganisms. For example, CH4-producing methanogens are obligate anaerobes in the Euryarchaeota that produce CH4 from a limited number of substrates: acetate (aceticlastic methanogenesis), CO2 + H2 (hydrogenotrophic methanogenesis), formate, methanol, and a few methylamines (Zinder, 1993). Therefore, methanogens rely on other microorganisms that decompose organic matter to supply methanogenic substrates (Drake et al., 2009). In general decomposers in peatlands feed on two sources of organic matter. One source is associated with plant roots; either root litter, or soluble organic molecules exuded from roots to soil (Williams and Yavitt, 2010). Root-associated microbial activity should peak during the growing season in response to root activity. Leaf litter is the other source of soil organic matter. In this case, input of leaf litter to soil occurs at the end of the growing season, and thus we expect maximum activity after the peak in soil temperature.
Fresh organic matter from high plant production is thought to fuel aceticlastic methanogenesis rather than the hydrogenotrophic pathway (Kotsyurbenko, 2010). In contrast, hydrogenotrophic pathway dominates in less productive peatlands and in those dominated by Sphagnum mosses and heath shrubs (Galand et al., 2005; Keller and Bridgham, 2007). Therefore, the aceticlastic pathway should be more prevalent in the summer and autumn with input of the freshest plant material. In this regard, Yavitt et al. (1988) found maximal rates of CH4 production in peat samples from early spring and late autumn when measurements were made at a standard temperature of 20°C regardless of in situ peat temperature. Juottonen et al. (2008) found that CH4 production peaked in February when the supply of metabolic substrates peaked, whereas the diversity of methanogens varied only slightly throughout the year.
Here we examine rates of CH4 production in relation to the diversity and dynamics of methanogens in three peatlands with contrasting characteristics: McLean Bog, Chicago Bog, and Michigan Hollow (local names). McLean and Chicago are both acidic peat bogs (pH 3–4), whereas Michigan Hollow is a minerotrophic fen (pH 6–7). We added substrates to peat in short-term incubations of peat soil to examine substrate limitation of methanogenesis and also examine inducible shifts in populations in response to substrates. The three peatlands are isolated from each other and surrounded by a matrix of forest and agricultural land. Although dispersal of anaerobes occurs across inhospitable habitats (Yavitt et al., 2011), we found evidence for species-sorting and high diversity of the local community. Therefore, if climate changes in the future, the impact on peat CH4 production and methanogens is more complicated than simple temperature control.
Materials and Methods
Study Sites
The three sites were located within 40 km of Ithaca, NY, USA (42°26′N, 76°30′W). The region is characterized by kettle-kame topography formed during Wisconsin Age glaciation (McNamara et al., 1992). This part of the Appalachian upland consists of relatively un-deformed sedimentary rocks of Ordovician, Silurian, and Devonian age that dip southward less than 1°. The uppermost bedrock is upper Devonian shale and thin-bedded sandstone. Above this is glacial-fluvial stratified sand and gravel with a strongly calcareous matrix. Parts of the landscape are covered by 5–12 m thick glacial till. Mean annual precipitation is 932 mm, and mean annual temperature is 7.8°C. Precipitation was above average, 125% of normal, during the first 6 months of the study period (June to December 2004), whereas as it was closer to the average, 109% of normal, after that (January 2005 to February 2006).
Chicago Bog (42°34′N, 76°14′W) is a 0.05-km2 kettle hole. Sedge-derived peat accumulated initially until it was above the local water table, at which point Sphagnum-derived bog peat accumulated. Total peat depth is about 6.5 m. The bog has a ground cover of Sphagnum fuscum on elevated hummocks and S. magellenicum on recessed hollows. The drier hummocks also support the ericaceous shrub Chamaedaphne calyculata (leatherleaf). Peat soil pH is 4.1 at 15 cm depth. Water table level does not fluctuate in this site. Further site description is given in Dettling et al. (2007).
McLean Bog (42°55′N, 76°26′W) is a 0.004-km2 kettle hole. Total peat depth is 8 m. Sphagnum species include S. angustifolium and S. amgellanicum. Shrubs include C. calyculata and Vaccinium corymbosum (highbush blueberry). The sedge Eriophorum vaginatum (cotton sedge) also is common. Peat soil pH is 3.4–4.3 at 15 cm depth. Water table level is above the peat surface following snowmelt in spring, and it declines to about 25 cm below the peat surface by mid-summer. Further site description is given in Osvald (1970).
Michigan Hollow (42°19′N, 76°29′W) is a 0.24-km2 fen dominated by a single species of sedge, Carex lacustris (lake sedge) with patches of Typha latifolia (Common cattail) and Lythrum salicaria (Purple loosestrife). The maximum peat depth is about 1.2 m, consisting mostly of Carex sedge-derived peat. Peat soil pH is 6.7 at 15 cm depth. Water table level fluctuates about 10 cm between spring snowmelt and summer in this site. Further site description is given in Bernard and Macdonald (1974).
Peat Soil Collection
We obtained fresh soil samples on each sampling date by cutting through surface vegetation and peat soil to a depth roughly below the lowest water table level seasonally: about 10 cm deep in Chicago bog, 20 cm deep in Mclean bog, and 20 cm deep in Michigan Hollow. We assume this depth has the largest rate of methanogenesis because it is saturated throughout the study period. This assumption has been confirmed in previous studies at McLean Bog and Chicago Bog using samples collected in 2004 (Brauer, 2006).
For each collection, three separate portions of peat soil from 5 cm below the water table were collected directly into glass canning jars. Jars were sealed with an airtight lid while immersed in the peat to prevent O2 exposure to the sampled peat soil. The jars were taken within 2 h of sapling to the laboratory and placed in an anaerobic glove box (Coy Laboratory Products). Fresh samples were collected at 2–4 month intervals for a 12-month period between June 2004 and July 2005. We also collected small samples in November 2005 and in February 2006 when the peatland surface was partially frozen: these samples were used for analysis of community composition but not in vitro incubation for methanogenesis. Overall, the study lasted 20 months.
Soil Incubations
We followed methods described in Bräuer et al. (2004). Briefly, inside the anaerobic glove box one gram of peat (wet mass) and 9 mL of anaerobic de-ionized water was placed in 18 × 150 mm crimp-top tube (Bellco Glass Co., Vineland, NJ, USA). After crimping the tops, the tubes were flushed for 5 min with sterile O2-scrubbed N2/CO2 (70/30%). Four treatments were established in triplicate for soil from each site and for each sampling period. Final concentrations for each treatment was: (1) no additions, (2) sodium acetate (1 mM), (3) rifampicin (10 mg L−1), and sterile O2-scrubbed H2/CO2 (80/20%) plus rifampicin (10 mg L−1). The purpose of rifampicin was to inhibit acetogenic bacteria, carrying out the reaction 4H2 + 2CO2 → CH3COOH + 2H2O, which compete with H2-utilizing methanogens. Accumulation of acetic acid can acidify peat, which interferes with our ability to examine the effect of various environmental parameters on the presence of H2/CO2-utilizing methanogens in the peat. Rifampicin treatment is explained fully in Bräuer et al. (2004).
Tubes were incubated in the dark at 22 ± 2°C. Tubes with no additions and sodium acetate were incubated without shaking, whereas tubes with H2/CO2 were shaken to help mix gases between peat soil and headspace. Methane concentrations in each tube were determined at 2–3 day intervals by gas chromatography as in Bräuer et al. (2004). All of the samples exhibited a delay before the onset of increasing CH4 concentration. We report the length of the delay period before onset of CH4 production (in days) in order to distinguish from a true lag phase in microbial growth. Rates of potential CH4 production were determined from the linear increase in CH4 concentration for about 14 days following the onset of CH4 production. Rates of potential CH4 production are expressed as millimoles of CH4 produced per liter of wet peat soil per day. We recognize that rates are often expressed per gram of dry soil, which is standard in soil science since the wet mass of soil varies depending on soil moisture content. However, peat below the water table is essentially saturated, and thus volume is the correct unit. Moreover, volume is the convention in literature for aqueous systems and by microbiologists studying cultures. For comparison among units, the peat bulk density values are: 0.076 ± 0.024 (SD) Mg m−3 for McLean; 0.084 ± 0.022 Mg m−3 for Chicago; and, 0.105 ± 0.018 Mg m−3 for Michigan Hollow. We also determined pH values per sample.
SSU rRNA Gene Analysis
DNA was extracted from duplicate 0.5-g portions of fresh peat from each of the triplicate samples incubated per sites per sampling date. Briefly, DNA was extracted with the Power Soil™ DNA kit (MoBio) using manufacturer’s protocol, with some changes. After adding the C1 solution, 50 μL of a sterile 200 mM AlNH4(SO4)2 solution was added to decrease the amount of humic acid contamination. The solution was put in a bead beater (MiniBeadbeater) for 80 s set on “homogenize.” Quality of DNA was checked with agarose gel electrophoresis and spectrophotometer readings.
The primers used for PCR were 1AF (5′-TCY GKT TGA TCC YGS CRG AG-3′) and 1100R (5′-TGG GTC TCG CTC GTT G-3′; Hales et al., 1996). These primers target methanogens, although other archaeal groups may also be amplified. The 1100 reverse primer was labeled on its 5′ end with Carboxyfluorescein (5′-/6-FAM). The PCR mixture (35 μL for each reaction) contained the following components per μL: 1× Taq buffer with 1.5 mM MgCl2 (Eppendorf, USA), 0.2 mM dNTPs, 0.25 μM forward and reverse primers, 1.2 U of Taq Polymerase (Eppendorf), 0.2 μg BSA and 0.1–0.3 ng of extracted DNA. The PCR thermal cycler conditions are described by Hales et al. (1996), with 25 cycles. PCR products were examined by gel electrophoresis on 1% agarose for size verification (1100 bp).
The PCR was performed three times, and 30 μL from each run was pooled to achieve enough PCR product from the same sample using a low number of cycles and to prevent the probability of random PCR artifacts due to location on a thermocycler surface, pipetting, etc. (Although we did not rerun every sample systematically, random samples were redone and nearly identical relative composition of community composition from the same sample supports our confidence in T-RFLP reproducibility.) The final product was purified with Quick Step™ 2 PCR Purification Kit (Edge Biosystems). Then 70 ng of purified PCR products were digested with a mix of HhaI (15 U) and Sau96I (10 U) enzymes (New England Biolabs for 3 h at 37°C. Digested DNA was purified with the Performa® DTRV3 96-Well Short Plate Kit (Edge Biosystems) and concentrated in a vacuum centrifuge. The dehydrated products were then re-suspended with a mix of Hi Di-Formamide (volume μL/mL; Applied Biosystems) and Gene Scan 500-Liz marker (12 μL/mL; Applied Biosystems) to a final volume of 15 μL. Fragments were resolved with an Applied BioSystems 3730xl DNA Analyzer (BRC, Cornell University).
T-RF sequence length, peak height, and area were analyzed using the GeneScan Analysis Software (Applied Biosystems, 2000). The raw data used to image these T-RFLP results on an electropherogram was exported in order to standardize the profile for each sample. With a Java program (Culman et al., 2009), the relative fluorescent units (RFU) of peaks with sizes between 50 and 500 bp were combined by height and normalized to 100 total RFU units. The standardization allowed the comparison of relative abundances from sample to sample.
We used T-RFLP analysis to obtain a description of the dominant groups in the archaeal community accessible through our primer set. The 1Af-1100R primers have been thoroughly tested previously in T-RFLP analysis with minimal ambiguous identification. The T-RFLP protocol, using two restriction enzymes (HhaI and Sau96I), was designed by performing multiple in silico sequence analyses of published sequences and clone libraries, and confirming the predicted fragment size by amplifying and T-RFLP analysis clones. Cadillo-Quiroz et al. (2006) presents the identity match and predicted terminal restriction fragment (T-RF) size from the in silico digestion.
The T-RFLP analysis was repeated on peat soils following in vitro incubation for CH4 production potential. The analysis was performed 35 days after incubation for soils treated with rifampicin and rifampicin plus H2, and 70 days after incubation for the un-amended soils and for those treated with acetate.
Statistical Analyses
Values presented below are mean (N = 3). We analyzed seasonal differences in methanogenesis and community composition using analysis of variance (ANOVA). The T-RFLP values were square root-transformed before analysis, whereas rates of potential CH4 production were log-transformed.
Results
Rates of potential CH4 production
All of the peat soil samples exhibited a delay between the time we initiated incubation and the onset of CH4 production (Table 1). There was no consistent seasonal pattern in delay time (P > 0.05 for sampling date); however, the average delay time was shorter for peat soil from Michigan Hollow (9 days) than from Chicago (11 days) and McLean (14 days). For each of the three sites, rates of potential CH4 production (measured at a consistent incubation temperature of 21°C) varied 3- to 5-fold among sampling dates. In general, the slowest rates occurred for soil collected in October from Chicago and Michigan Hollow versus April for soil from McLean. The fastest rates occurred for samples collect in July for all three sites (Table 2).
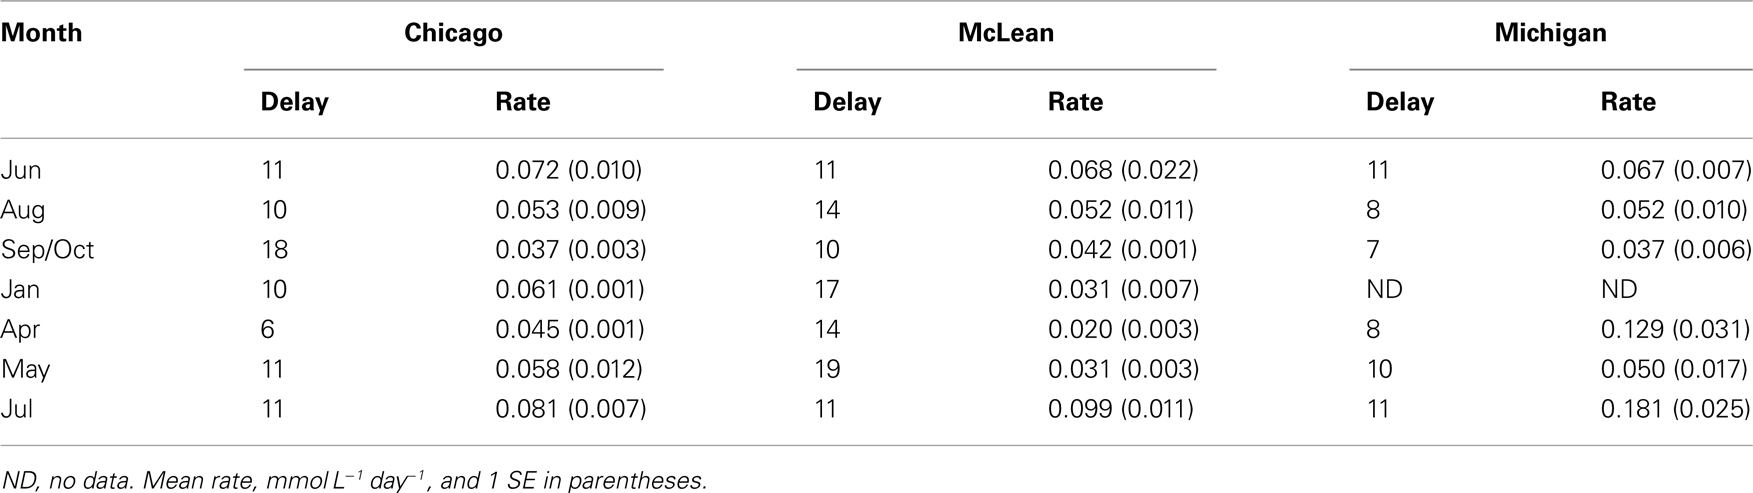
Table 1. Delay (days) before onset of CH4 production and rates of potential CH4 production in peat soils with no added substrates.
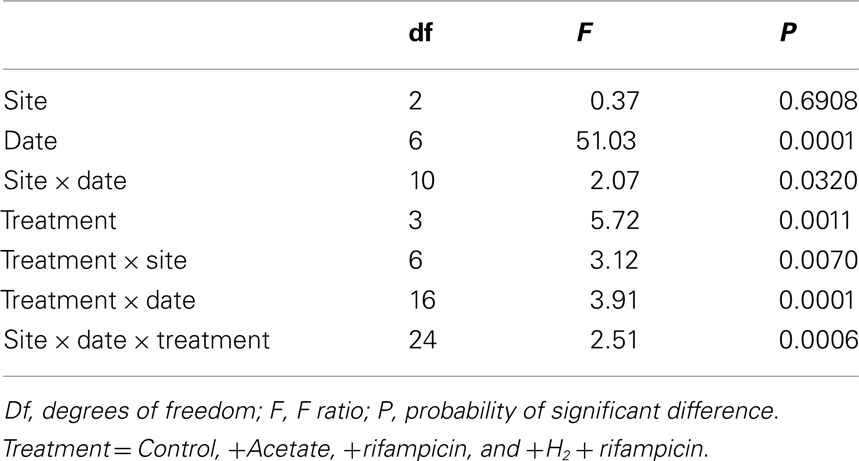
Table 2. Analysis of variance for rates of CH4 production.
Rates of potential CH4 production in peat soils from the three sites exhibited some degree of substrate limitation among sampling dates (Table 3). The addition of acetate to peat soils from Chicago and McLean increased rates by 30% to nearly 4-fold, with slightly greater response for McLean than for Chicago, in particular, for soil collected in October. Added acetate had the largest effect on peat soil from Michigan Hollow. Notably, the addition of rifampicin often decreased rates of potential CH4 production by as much as 60%. However, the addition of rifampicin + H2 stimulated potential CH4 production, especially, in January for peat from Chicago and October for McLean.
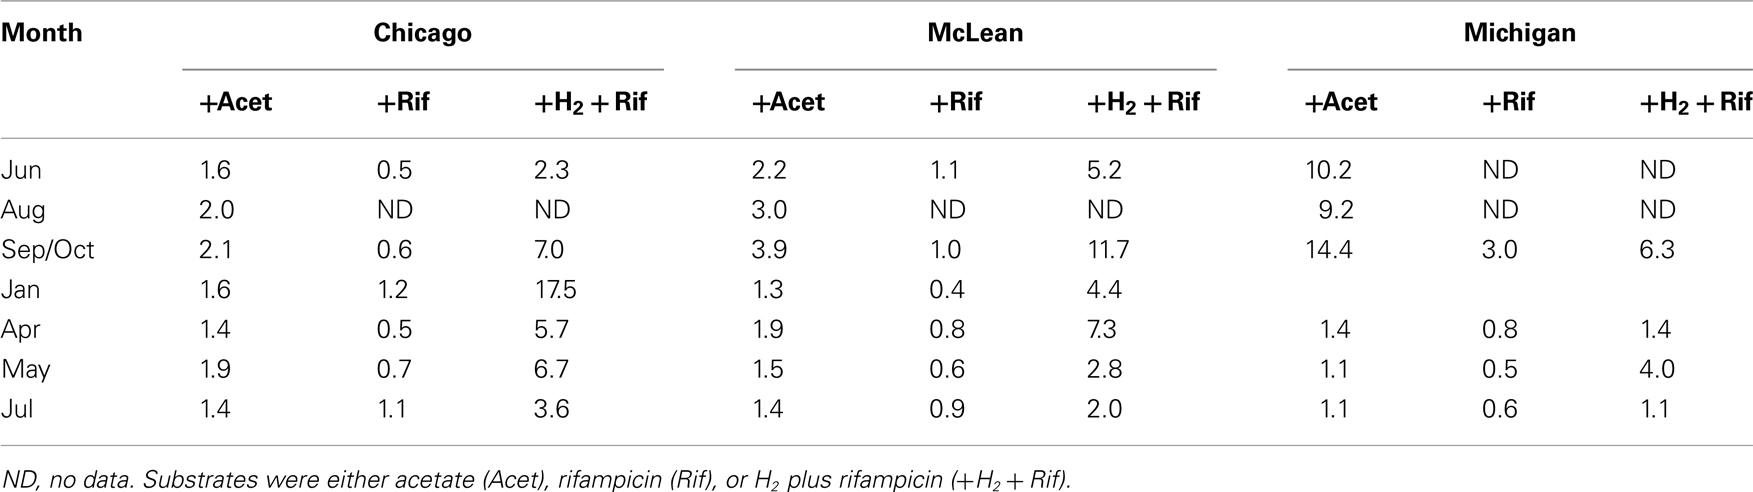
Table 3. Ratio for the rate of CH4 production with added substrate versus un-amended control.
Methanogen Community Structure
The labeling of the 1Af-1100R primer set combined with a double digestion with the HhaI/Sau96I restriction enzymes resolved most of the euryarchaeal groups in which each T-RF could be associated with a single group. This was confirmed by digestion of multiple clones and pure cultures as given in Cadillo-Quiroz et al. (2006), including Methanosarcinaceae (MS), Methanosaetaceae (MT), and Methanobacteriaceae (MB), as well as recently cultured groups, such as group E2′ (E2) and group E1′ (E1) in the order Methanomicrobiales, and rice cluster-I (RC-I) in the novel order Methanocellales. We also identified fragments associated with as yet uncultured euryarchaeal and crenarchaeal groups, including RC-II, group 1.3b and 1.1c.
We rely on PCR and T-RFLP analysis because our primary goal was presence or absence of different methanogen groups at different times of the year. We realize that qPCR is necessary for accurate assessment of abundance. Notwithstanding, the dominant group in peat soil from McLean was E2 (Figure 1). The relative abundance of E2 changed significantly (P < 0.01 for sampling date) during the study period, with relatively greater abundance in the coldest months versus less abundance in June and July. Similarly, the MS group had greater abundance (P < 0.01 for sampling date) in colder than in warmer months, with E1 having slightly higher relative abundance in those months. The E2 group also was the dominant group in peat soil from Chicago with proportionally greater abundance in coldest months. However in contrast to McLean, the MS group had greater abundance in warmer than in colder months in Chicago (P < 0.01 for sampling date).
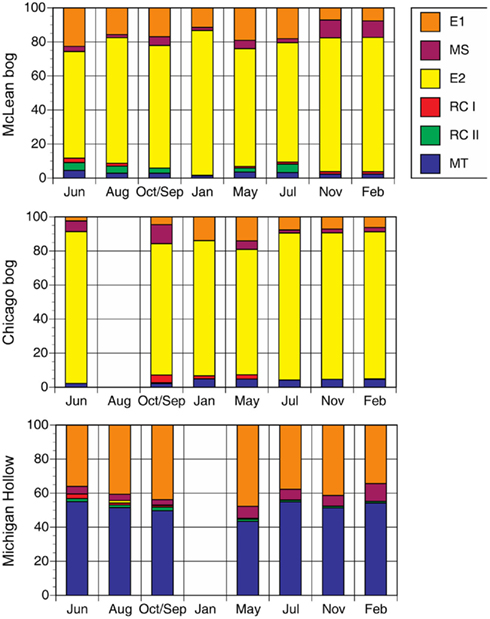
Figure 1. Proportion of major methanogen groups determined by T-RFLP of SSU rRNA gene sequences for soil samples from three peatlands (no addition treatment). Legend indicates groups: E2′ (E2) and E1′ (E1) in the order Methanomicrobiales; rice cluster-I (RC-I) in the novel order Methanocellales; uncultivated RC-II; and, Methanosarcinaceae (MS) and Methanosaetaceae (MT) in the Methanosarcinales.
In peat soil from Michigan Hollow, MT and E1 were the dominant groups. The relative abundance of E1 is greatest in May, whereas MT were the dominant group in other sampling times (P < 0.01 for sampling date). The group E2 was in Michigan Hollow only once in August. Overall, there were significant differences in the abundance of phylogenetic groups among the three sites. Relative abundance of MT (P < 0.001 for site), E2 (P < 0.001 for site), MS (P < 0.01 for site), and E1 (P < 0.01 for site) are all highly significantly different in all sites, with a corrected P level of 0.0028.
The addition of substrates changed the relative abundance of methanogenic groups in predictable ways (Figure 2). In peat from Mclean and Chicago, for instance, the addition of acetate led to increase relative abundance of MS and MT at the expense of E1 and E2. With added rifampicin, E1, MS, and E2 were dominant, whereas added rifampicin plus H2 led to almost 100% E2. In contrast, in peat soil from Michigan Hollow, E1 and MT had substantial presence in all treatments, with MS increasing with added acetate versus E2 increasing with added rifampicin and H2.
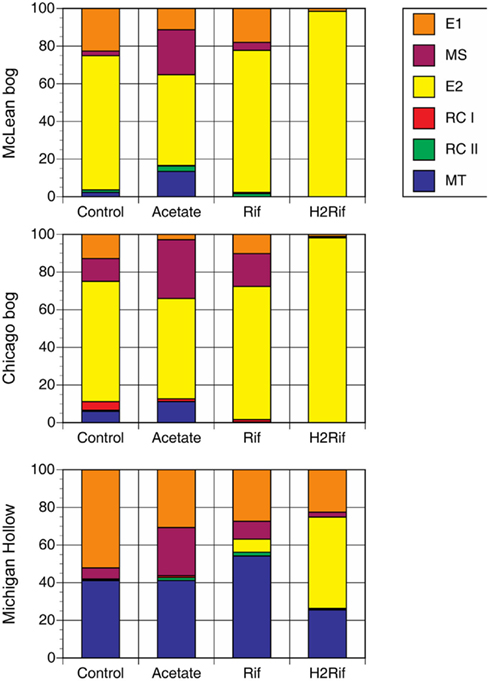
Figure 2. Proportion of major methanogen groups determined by T-RFLP of SSU rRNA gene sequences for soil samples from three peatlands. Analysis was performed after in vitro incubation with one of four treatments: Control with no addition; Acetate with added acetate (1 mM); Rif with added rifampicin; and H2Rif with added H2 and rifampicin. Legend indicates groups: E2′ (E2) and E1′ (E1) in the order Methanomicrobiales; rice cluster-I (RC-I) in the novel order Methanocellales; uncultivated RC-II; and, Methanosarcinaceae (MS) and Methanosaetaceae (MT) in the Methanosarcinales.
Discussion
Rates of Potential CH4 Production
In this study we incubated samples of peat soil at one temperature regardless of the in situ temperature on the date of soil collection. Our rationale for one temperature follows the well-known phenomenon that low temperatures, <12°C, constrain rates of CH4 production in peat soils (Yavitt et al., 1988; Juottonen et al., 2008). Therefore, measuring very low production rates in winter does not provide much insight into the seasonal nature of the methanogenic community. By incubating peat soils at the same temperature year-round we could gain insight into seasonal dynamics of methanogenic community without temperature constraint.
The larger mean rate of potential CH4 production in peat soil from Michigan Hollow (0.086 mmol L−1 day−1) correlates with the near neutral pH and sedge vegetation, whereas lower CH4 production potential occurred in acidic peat soil derived from relatively un-decomposable moss and shrub vegetation at the other two sites. The larger CH4 production potential in soil from Chicago (0.059 mmol L−1 day−1) versus that at McLean (0.031 μmol L−1 day−1) is notable. Chicago is a relatively dry peatland with water table 20 cm below the surface, whereas McLean is a relatively wet peatland in which the water table is closer to the surface. In addition, Chicago has a fen-to-bog transition about 0.6-m below the peatland surface, whereas fen peat is buried much deeper in McLean. We deduce that fen peat provides nutrients for microbial growth (Dettling et al., 2007) and reduces the delay time before the onset of methanogenesis, despite the drier condition in Chicago than in McLean.
Methanogenesis in soil cannot be measured directly in the field very easily, but rather we must rely on measurements made in vitro. Therefore, rates of potential CH4 production depend upon soil collection and storage as well as procedures used in the laboratory. For example, although methanogens are obligate anaerobes, some strains can tolerate short-term exposure to O2 (Jarrell, 1985), whereas others cannot. Consumption of methanogenic substrates can occur during storage and delay onset of CH4 production. Here we collect peat soil just below the water table level, which should have the greatest rate of CH4 production within the depth profile (Sundh et al., 1994). Also, we had minimal storage of soil samples between collection and incubation (<2 days), and we prepared all of the incubations in an anaerobic glove box to prevent exposure to O2. Nevertheless, every soil sample exhibited a delay phase before the onset of CH4 production.
A delay implies either a small population size of methanogens, methanogenesis inhibited by another anaerobic process, or by the lack of methanogenic substrates. Although these peat soils contain a relatively large viable population of methanogens (Cadillo-Quiroz et al., 2006), we suspect that a delay results from the high in vitro dilution that reduced effective population size. We cannot rule out that the delay also was a period of low activity per cell, as methanogens are known to vary activity per cell during incubation (Krüger et al., 2005). Regardless, there was no significant seasonal pattern in the length of the delay period, suggesting the local condition just prior to sampling can influence delay time.
The fastest rates of potential CH4 production in all three sites occurred in July. This coincides with maximum plant growth, which suggests that plant root activity, and organic compounds released from plant roots fuels the greatest CH4 production potential. This might be true at Mclean, which showed a low rate outside the growing season, presumably supplemented by root-derived compounds in the growing season. Moreover, some of the plants may harbor distinct subsets of methanogens, i.e., different from those in the bulk peat, as was found in McLean Bog (Cadillo-Quiroz et al., 2010). However, at Chicago, a moderate high CH4 production potential in January may possibly indicate that root activity is less influential, or perhaps indicates that significant root activity is present in January, due to the abundance of evergreen shrubs. In contrast, although grasses dominate the vegetation at Michigan Hollow, and grass roots are known to release organic compounds, methanogenic activity utilizes dead plant material throughout the year in Michigan Hollow (Williams and Yavitt, 2010).
Few studies have addressed year-round patterns in CH4 production in soils, independent of in situ temperature regime (although see Yavitt et al., 1988). One such study is by Juottonen et al. (2008) that reported maximum CH4 production potential in samples of peat soils collected in winter from a boreal fen. The explanation was that low temperatures in late autumn and winter constrained CH4 production to a greater degree than hydrolysis and fermentation, thereby allowing methanogenic substrates to accumulate. When the cold temperature limitation was relaxed in the laboratory, rates of methanogenic activity responded. However, our sites occur in a temperate climate, and cold wintertime temperatures occur for no more than 4 months. For example, during our study soil temperature was 20–25°C in October, 4°C in December, and it had rebounded to 10°C by March. Therefore, low rates of potential CH4 production that we observed in September/October are notable because in situ temperature was permissible, which suggests a substrate limitation or competition with other anaerobic bacteria.
Some studies have suggested that substrate availability does not limit anaerobic activity because substrates exuded from plant roots fuel activity during the growing season, whereas anaerobes decompose dead plant material in the fall and wintertime (Lipson et al., 2002). Although plant roots do release organic compounds to soil, anaerobic metabolism in plants produces only ethanol and/or lactate (Good and Muench, 1993), neither of which are methanogenic substrates. However, the oxidation of these compounds produces acetate, so aceticlastic methanogenesis could be linked indirectly to plant root activity. However, added acetate had the greatest impact on CH4 production in August through October, which is after maximum root growth. The larger impact in Michigan Hollow than in the other two sites is consistent with grass derived organic matter, which decomposes more readily than moss or shrub litter and supports aceticlastic methanogens. This is supported by an increase in abundance of fragment lengths affiliated with Methanosaeta spp., known acetate-utilizing methanogens. It is logical that stimulation with acetate would produce higher rates of CH4 production. In contrast, the greater response to added H2 + rifampicin in Chicago and McLean is consistent with the methanogenic community dominated by E2, which is an H2-utilizing methanogen.
The stimulation of CH4 production by added methanogenic substrates suggests a competition for substrates with other anaerobic pathways. For example both acetate and H2 are utilized by anaerobes that carry our respiration with electron acceptors other than O2. However, in other studies we have shown that the addition of electron acceptors, such as ferric iron (Fe3+) and sulfate did not inhibit methanogenesis completely (Dettling et al., 2006). Indeed, in some cases, the addition of Fe3+ stimulated CH4 production, suggesting that iron is an essential nutrient of methanogens, and it is short supply, which is not surprising in these relatively nutrient poor soils. Thus what processes compete with methanogens for available acetate and H2 is still not clear.
Methanogenic Community
Previous work with methanogens in peat soils, in particular those studies based on SSU rRNA gene sequences, has suggested that community composition can be quite diverse (cf., Basiliko et al., 2003; Juottonen et al., 2008; Kotsyurbenko, 2010; Yavitt et al., 2011). It is well-known, however, that SSU rRNA genes target total community composition, including active and inactive cells (Logue and Lindström, 2010), and thus the approach has been criticized for having a biased estimate of community diversity. Notwithstanding, inactive cells at the time of soil sampling can become active during other times of the year in response to optimal environmental conditions (Lennon and Jones, 2011), resulting in a temporal niche (Loreau, 1989). Indeed, the second part of our study (see below) with in vitro incubations of portions of peat soil provides a unique opportunity to examine the temporal niche via species-sorting for methanogens in isolated peatlands.
The prevalence of E2 in McLean and Chicago is consistent with the evidence that H2-utilizing methanogens, especially members of Methanomicrobiales dominate in acidic peat soils (Galand et al., 2005; Yavitt et al., 2011). The small fraction of RC-I agrees with the notion that RC-I prefers substrate-rich habitats, such as root surfaces (Cadillo-Quiroz et al., 2010). In contrast, the E2 group appears to be adapted to low-nutrient environments, such as the bulk peat and pore water of acidic bogs. In fact, the first strain of this group, “Candidatus Methanoregula boonei,” was isolated using a low-nutrient low-ionic-strength medium (Bräuer et al., 2006). Therefore, the relative dominance of E2 in both bog sites is not surprising.
The peak in relatively dominance of E2 in January in McLean versus in June in Chicago might imply no consistent seasonal pattern in relative dominance of E2 in acidic bogs. However, peak dominance in both sites correlated with a relatively small impact of added H2 (+rifampicin) on potential CH4 production (Table 3). The small impact suggests an adequate supply of substrates for methanogenesis, and thus E2 might assume a greater role when metabolic substrates are plentiful. When the relative proportion of E2 did decrease in both sites, the difference was due mostly to an increase in the proportion of E1. The E1 group also relies on H2/CO2 for CH4 production (Cadillo-Quiroz et al., 2008). However, more experimental studies are needed to verify whether E1 favors substrate-limited conditions, whereas E2 favors substrate-rich conditions.
The prevalence of MT in Michigan Hollow is consistent with the evidence that acetate-utilizing methanogens dominate in neutral, sedge-dominated fens (Galand et al., 2005). All known members of MT make CH4 by splitting acetate (Liu and Whitman, 2008). Moreover, they do so at concentrations of acetate as low as 5–70 μM (Jetten et al., 1992), suggesting that low concentrations of acetate occur in peat pore water in Michigan Hollow. Moreover, MT is able to outcompete MS at low acetate concentrations (Galand et al., 2005). Thus, finding MS and RC-I in all three sites is interesting because they have been shown to rely on relatively large substrate concentrations for CH4 production: MS at acetate concentrations between 0.2 and 1.2 mM (Jetten et al., 1992); and, RC-I at high H2 concentrations (Conrad et al., 2006). Indeed, our studies in other peatlands have shown the co-occurrence of MS and RC-I, associated with high substrate conditions (Yavitt et al., 2007). Although MS can make CH4 from H2/CO2, we did find that in vitro incubations of peat soil with added acetate led to a large increase in MS dominance, which suggests that, at least, some of the in situ members find high acetate concentrations in order to make CH4. Interestingly, the E1 group increased relative dominance in the springtime in Michigan Hollow, whereas MT decreased in abundance at the same time. Thus, the springtime appears to be a time of increased acetate supply, favoring MS over MT, with low H2 or formate for E2 growth.
Species-sorting is suggested by change in relative dominance of methanogen groups following addition of metabolic substrates to portions of peat soil maintained in the laboratory. This was demonstrated most impressively by the increase in E2 in peat soil from Michigan Hollow, going from <1% relative dominance in situ to 45% relative dominance following in vitro incubation with added H2+ rifampicin. Likewise added acetate led to large increase in relative dominance of MS and MT in peat from the two acidic bogs. Hence experiments in the laboratory can provide insight into hidden microbial diversity in situ (cf., Meier et al., 2008). Our data collectively shows that these peatlands harbor diverse populations of methanogens even though not all populations are active continuously. Rather we suggest that the availability of substrates is an important cue for population growth. This extends the species-sorting concept to isolated peatlands, as demonstrated for bacterial communities in isolated lakes (cf., Jones and McMahon, 2008). This does not rule out the mass-effect and dispersal for peatland methanogens (cf., Yavitt et al., 2011), but species-sorting might be an important mechanism for maintaining diversity on a seasonal basis.
Now, we need to know how substrate supply varies temporally in peatlands. Control on variation in substrate supply adds another dimension to global environmental change (Trumbore, 1997). For example, we need to know whether temperature and moisture regimes alone are the controlling mechanism, or whether more complex controls exist, such as via plant community composition (Hiltunen et al., 2008; Williams and Yavitt, 2010).
Conflict of Interest Statement
The authors declare that the research was conducted in the absence of any commercial or financial relationships that could be construed as a potential conflict of interest.
References
Basiliko, N., Yavitt, J. B., Dees, P. M., and Merkel, S. M. (2003). Methane biogeochemistry and methanogen communities in two northern peatland ecosystems, New York State. Geomicrobiol. J. 20, 563–577.
Bernard, J. M., and Macdonald, J. G. Jr. (1974). Primary production and life history of Carex lacustris. Can. J. Bot. 52, 117–123.
Brauer, S. L. (2006). Methanogenesis and Methanogens in Peat-Forming Wetlands in Central New York State. Ph.D. dissertation, Cornell University.
Bräuer, S. L., Yashiro, E., Cadillo Quiroz, H., Yavitt, J. B., and Zinder, S. H. (2006). Isolation of a novel acidiphilic methanogen from an acidic peat bog. Nature 442, 192–194.
Bräuer, S. L., Yavitt, J. B., and Zinder, S. H. (2004). Methanogenesis in McLean Bog, an acidic peat bog in upstate New York: stimulation by H2/CO2 in the presence of rifampicin, or by low concentrations of acetate. Geomicrobiol. J. 21, 433–443.
Cadillo-Quiroz, H., Brauer, S., Yashiro, E., Sun, C., Yavitt, J., and Zinder, S. (2006). Vertical profiles of methanogenesis and methanogens in two contrasting acidic peatlands in central New York State, USA. Environ. Microbiol. 8, 1428–1440.
Cadillo-Quiroz, H., Yashiro, E., Yavitt, J. B., and Zinder, S. H. (2008). Characterization of the archaeal community in a minerotrophic fen and terminal restriction fragment length polymorphism-directed isolation of a novel hydrogenotrophic methanogen. Appl. Environ. Microbiol. 74, 2059–2068.
Cadillo-Quiroz, H., Yavitt, J., Zinder, S., and Thies, J. (2010). Diversity and community structure of archaea inhabiting the rhizoplane of two contrasting plants from an acidic bog. Microb. Ecol. 59, 757–767.
Chesson, P., and Huntly, N. (1997). The roles of harsh and fluctuating conditions in the dynamics of ecological communities. Am. Nat. 150, 519–553.
Conrad, R., Erkel, C., and Liesack, W. (2006). Rice cluster I methanogens, an important group of archaea producing greenhouse gas in soil. Curr. Opin. Biotechnol. 17, 262–267.
Culman, S. W., Bukowski, R., Gauch, H. G., Cadillo-Quiroz, H., and Buckley, D. H. (2009). T-REX: software for the processing and analysis of T-RFLP data. BMC Bioinformatics 10, 171.
Dettling, M. D., Yavitt, J. B., Cadillo-Quiroz, H., Sun, C., and Zinder, S. H. (2007). Soil-methanogen interactions in two peatlands (bog, fen) in central New York State. Geomicrobiol. J. 24, 247–259.
Dettling, M. D., Yavitt, J. B., and Zinder, S. H. (2006). Control of organic carbon mineralization by alternative electron acceptors in four peatlands, Central New York State, USA. Wetlands 26, 917–927.
Drake, H. L., Horn, M. A., and Wüst, P. K. (2009). Intermediary ecosystem metabolism as a main driver of methanogenesis in acidic wetland soil. Environ. Microbiol. Rep. 1, 307–318.
Galand, P. E., Fritze, H., Conrad, R., and Yrjälä, K. (2005). Pathways for methanogenesis and diversity of methanogenic archaea in three boreal peatland ecosystems. Appl. Environ. Microbiol. 71, 2195–2198.
Good, A. G., and Muench, D. G. (1993). Long-term anaerobic metabolism in root tissue: metabolic products of pyruvate metabolism. Plant Physiol. 101, 1163–1168.
Hales, B. A., Edwards, C., Ritchie, D. A., Hall, G., Pickup, R. W., and Saunders, J. R. (1996). Isolation and identification of methanogen-specific DNA from blanket bog peat by PCR amplification and sequence analysis. Appl. Environ. Microbiol. 62, 668–675.
Hiltunen, T., Laakso, J., Kaitala, V., Suomalainen, L.-R., and Pekkonen, M. (2008). Temporal variability in detritus resource maintains diversity of bacterial communities. Acta Oecologia 33, 291–299.
Jarrell, K. F. (1985). Extreme oxygen sensitivity in methanogenic archaebacteria. Bioscience 35, 298–302.
Jetten, M. S. M., Stams, A. J. M., and Zehnder, A. J. B. (1992). Methanogenesis from acetate – a comparison of the acetate metabolism in Methanothrix soehngenii and Methanosarcina spp. FEMS Microbiol. Rev. 88, 181–197.
Jones, S. E., and McMahon, K. D. (2008). Species-sorting may explain an apparent minimal effect of immigration on freshwater bacterial community dynamics. Environ. Microbiol. 11, 905–913.
Juottonen, H., Tuittila, E. S., Juutinen, S., Fritze, H., and Yrjala, K. (2008). Seasonality of rDNA- and rRNA-derived archaeal communities and methanogenic potential in a boreal mire. ISME J. 2, 1157–1168.
Keller, J. K., and Bridgham, S. D. (2007). Pathways of anaerobic carbon cycling across an ombrotrophic-minerotrophic peatland gradient. Limnol. Oceanogr. 52, 96–107.
Kotsyurbenko, O. R. (2010). “Soil, wetlands, peat,” in The Handbook of Hydrocarbon and Lipid Microbiology, ed. K. N. Timmis (Berlin: Springer-Verlag), 626–634.
Krüger, M., Frenzel, P., Kemnitz, D., and Conrad, R. (2005). Activity, structure and dynamics of the methanogenic archaeal community in a flooded Italian rice field. FEMS Microbiol. Ecol. 51, 323–331.
Leibold, M. A. (1998). Similarity and local co-existence of species in regional biotas. Evol. Ecol. 12, 95–110.
Lennon, J. T., and Jones, S. E. (2011). Microbial seed banks: the ecological and evolutionary implications of dormancy. Nat. Rev. Microbiol. 9, 119–130.
Lipson, D. A., Schadt, C. W., and Schmidt, S. K. (2002). Changes in microbial community structure and function in an alpine dry meadow following spring snow melt. Microb. Ecol. 43, 307–314.
Liu, Y., and Whitman, W. B. (2008). Metabolic, phylogenetic, and ecological diversity of the methanogenic archaea. Ann. N. Y. Acad. Sci. 1125, 171–189.
Logue, J. B., and Lindström, E. S. (2010). Species sorting affects bacterioplankton community composition as determined by 16S rDNA and 16S rRNA fingerprints. ISME J. 4, 729–738.
Loreau, M. (1989). On testing temporal niche differentiation in carabid beetles. Oecologia 81, 89–96.
McMahon, S. K., Wallenstein, M. D., and Schimel, J. P. (2011). A cross-seasonal comparison of active and total bacterial community composition in Arctic tundra soil using bromodeoxyuridine labeling. Soil Biol. Biochem. 43, 287–295.
McNamara, J. P., Siegel, D. I., Glaser, P. H., and Beck, R. M. (1992). Hydrogeologic controls on peatland development in the Malloryville Wetland, New York (USA). J. Hydrol. 140, 279–296.
Meier, C., Wehrli, B., and van der Meer, J. R. (2008). Seasonal fluctuations of bacterial community diversity in agricultural soil and experimental validation by laboratory disturbance experiments. Microb. Ecol. 56, 210–222.
Mouquet, N., and Loreau, M. (2002). Coexistence in metacommunities: the regional similarity hypothesis. Am. Nat. 159, 420–426.
Osvald, H. (1970). Vegetation and Stratigraphy of Peatlands in North America. Uppsala: Vetenskapssocieteten, 96.
Sundh, I., Nilsson, M., Granberg, G., and Svensson, B. H. (1994). Depth distribution of microbial production and oxidation of methane in northern boreal peatlands. Microb. Ecol. 27, 253–265.
Trumbore, S. E. (1997). Potential responses of soil organic carbon to global environmental change. Proc. Natl. Acad. Sci. U.S.A. 94, 8284–8291.
Williams, C. J., and Yavitt, J. B. (2010). Temperate wetland methanogenesis: the importance of vegetation type and root ethanol production. Soil Sci. Soc. Am. J. 74, 317–325.
Yavitt, J. B., Basiliko, N., Turetsky, M. R., and Hay, A. G. (2007). Methanogenesis and methanogen diversity in three peatland types of the discontinuous permafrost zone, boreal western continental Canada. Geomicrobiol. J. 23, 641–651.
Yavitt, J. B., Lang, G. E., and Downey, D. M. (1988). Potential methane production and methane oxidation rates in peatland ecosystems of the Appalachian Mountains, United States. Global Biogeochem. Cycles 2, 253–268.
Keywords: metabolic substrate, methane production, methanogenic archaea, peatland, SSU rRNA gene, temporal niche
Citation: Sun CL, Brauer SL, Cadillo-Quiroz H, Zinder SH and Yavitt JB (2012) Seasonal changes in methanogenesis and methanogenic community in three peatlands, New York State. Front. Microbio. 3:81. doi: 10.3389/fmicb.2012.00081
Received: 25 November 2011; Accepted: 17 February 2012;
Published online: 06 March 2012.
Edited by:
Svetlana N. Dedysh, Russian Academy of Sciences, RussiaReviewed by:
Kuk-Jeong (Kuki) Chin, Georgia State University, USAHannu Fritze, Finnish Forest Research Institute, Finland
Copyright: © 2012 Sun, Brauer, Cadillo-Quiroz, Zinder and Yavitt. This is an open-access article distributed under the terms of the Creative Commons Attribution Non Commercial License, which permits non-commercial use, distribution, and reproduction in other forums, provided the original authors and source are credited.
*Correspondence: Joseph B. Yavitt, Department of Natural Resources, Bruckner Laboratory, Cornell University, Ithaca, NY 14853-3001, USA. e-mail:amJ5MUBjb3JuZWxsLmVkdQ==