

- Department of Biochemistry and Molecular Biology, The Pennsylvania State University, University Park, PA, USA
The unicellular, euryhaline cyanobacterium Synechococcus sp. strain PCC 7002 is a model organism for laboratory-based studies of cyanobacterial metabolism and is a potential platform for biotechnological applications. Two of its most notable properties are its exceptional tolerance of high-light intensity and very rapid growth under optimal conditions. In this study, transcription profiling by RNAseq has been used to perform an integrated study of global changes in transcript levels in cells subjected to limitation for the major nutrients CO2, nitrogen, sulfate, phosphate, and iron. Transcriptional patterns for cells grown on nitrate, ammonia, and urea were also studied. Nutrient limitation caused strong decreases of transcript levels of the genes encoding major metabolic pathways, especially for components of the photosynthetic apparatus, CO2 fixation, and protein biosynthesis. Uptake mechanisms for the respective nutrients were strongly up-regulated. The transcription data further suggest that major changes in the composition of the NADH dehydrogenase complex occur upon nutrient limitation. Transcripts for flavoproteins increased strongly when CO2 was limiting. Genes involved in protection from oxidative stress generally showed high, constitutive transcript levels, which possibly explains the high-light tolerance of this organism. The transcriptomes of cells grown with ammonia or urea as nitrogen source showed increased transcript levels for components of the CO2 fixation machinery compared to cells grown with nitrate, but in general transcription differences in cells grown on different N-sources exhibited surprisingly minor differences.
Introduction
Synechococcus sp. strain PCC 7002 (hereafter Synechococcus 7002), a euryhaline, unicellular cyanobacterium, is capable of growth over a wide range of NaCl concentrations, and is extremely tolerant of high-light intensities (Batterton and Van Baalen, 1971; Nomura et al., 2006b). When grown under optimal conditions [38°C, 1% (v/v) CO2 in air, at saturating light intensity, ∼250 μmol photons m−2 s−1] with a reduced nitrogen source or nitrate, its doubling times of 2.6 and 4 h, respectively, are the shortest currently reported for any cyanobacterium (although two closely related strains can grow ∼10% faster; G. Shen and D. A. Bryant, unpublished). Synechococcus 7002 is easily and naturally transformable (Stevens and Porter, 1980; Frigaard et al., 2004), its complete genomic sequence is available (see http://www.ncbi.nlm.nih.gov/), and a system for complementation of mutations, and overproduction of proteins is available (Xu et al., 2011). The organism is relatively easy to handle and has become a laboratory model organism for transcriptome, proteome, and metabolome studies (Baran et al., 2010; Bennette et al., 2011; Ludwig and Bryant, 2011; Zhang and Bryant, 2011). All of these traits make Synechococcus 7002 an excellent platform for the production of biofuels as well as other biotechnological applications.
Most cyanobacteria are photolithoautotrophs, which means that sunlight serves as the primary energy source, electrons are obtained from an inorganic source (i.e., water), and CO2 is the sole carbon source. Like other organisms, cyanobacteria additionally require sources of N, S, and P for the production of new biomass. Because many Fe–S proteins and cytochromes are found in the photosynthetic apparatus (Cramer et al., 2005; Fromme and Grotjohann, 2008), cyanobacteria additionally require relatively large quantities of Fe for optimal growth. Thus, studies have shown that cyanobacteria regulate transcription in response to changes in light as well as these essential nutrients; this has been demonstrated in transcriptomic studies in several cyanobacterial strains (Hihara et al., 2001; Gill et al., 2002; Singh et al., 2003; Wang et al., 2004; Nodop et al., 2008; Zhang et al., 2008; Ludwig and Bryant, 2011).
Like other autotrophs, cyanobacteria take up carbon in its inorganic forms as CO2 and/or bicarbonate. Cyanobacteria produce carboxysomes, specialized bacterial microcompartments (Yeates et al., 2008; Kinney et al., 2011), which contain ribulose bisphosphate carboxylase/oxygenase (RuBisCO), the key enzyme of the CO2 reduction pathway (Tabita, 1994). Furthermore, cyanobacterial cells have multiple mechanisms for CO2 and bicarbonate uptake as well as mechanisms to increase the local intracellular CO2 concentration within the carboxysome (Badger and Price, 2003; Yeates et al., 2008; Cannon et al., 2010). Some cyanobacteria can additionally use a few simple organic compounds, sugars, or alcohols as carbon and/or energy sources (Bottomley and van Baalen, 1978; Anderson and McIntosh, 1991; Eiler, 2006). Synechococcus 7002 can grow on glycerol as its carbon and energy source (Lambert and Stevens, 1986).
Most cyanobacteria can use nitrate, nitrite, and ammonia as primary N-sources, although urea and organic N-compounds can also be used in some cases (Flores and Herrero, 1994). Some cyanobacteria, mainly filamentous heterocystous strains, are additionally able to reduce dinitrogen to ammonia via nitrogenase (Berman-Frank et al., 2003; Seefeldt et al., 2009). Although Synechococcus 7002 does not produce nitrogenase, it has been reported to use a wide variety of organic compounds as sole nitrogen source (Kapp et al., 1975). Most if not all cyanobacteria can use sulfate as sole S-source. Because the sulfate concentration of seawater is much higher than in typical freshwater habitats (Holmer and Storkholm, 2001; Giordano et al., 2005), sulfate is rarely a limiting nutrient in marine habitats. On the other hand, P- and N-levels are often growth-rate limiting for cyanobacteria in freshwater habitats but are often less problematic in marine environments (Guildford and Hecky, 2000). Fe is often growth-limiting in marine environments (Veldhuis and de Baar, 2005), but Synechococcus 7002 produces a family of siderophores, synechobactins A–C (Ito and Butler, 2005) to facilitate Fe acquisition. The genes for the synthesis of synechobactin are encoded on plasmid pAQ7 along with other proteins for Fe uptake (see GenBank Accession NC_010474.1). The Synechococcus 7002 genome also encodes various transport systems for uptake of phosphate, sulfate, and various N-sources.
Cyanobacteria must acclimate to changes in their energy supply (provided by light), and they must also have mechanisms to cope with fluctuations in nutrient availability that occur in their natural environments. In a previous study that focused on the effects of light and oxygen on transcription, we demonstrated that global transcription profiling in Synechococcus 7002 can effectively be performed by cDNA sequencing (a technique now often referred to as RNAseq). This method provides sufficient sequencing depth to detect changes in genes that are only rarely transcribed, even at moderate sequencing depth and without using methods to deplete ribosomal RNA (Ludwig and Bryant, 2011). In this study we present an integrated global transcriptome study of Synechococcus 7002 that compares the specific cellular responses to limitation for each macronutrient. Specifically, we present the global transcription profiles of this model cyanobacterium in response to limitation for carbon, nitrogen, sulfur, phosphorus, and iron. Previous global transcriptome studies on the effects of nutrient limitation were performed by microarray analyses in isolated studies from various laboratories in the freshwater organism Synechocystis sp. PCC 6803 for carbon (Eisenhut et al., 2007), nitrogen (Osanai et al., 2006), sulfur (Zhang et al., 2008), and iron (Singh et al., 2003; Shcolnick et al., 2009). Most previous studies on the effects of nitrogen limitation in cyanobacteria have been performed in the heterocystous freshwater/soil strains Nostoc (Anabaena) sp. PCC 7120 and Nostoc punctiforme PCC 73102, which differentiate heterocysts and are capable of fixing dinitrogen (Ehira et al., 2003; Sato et al., 2004; Campbell et al., 2007; Christman et al., 2011). Iron limitation has also been studied in the freshwater strain Synechococcus elongatus PCC 7942 (Nodop et al., 2008) and the marine Prochlorococcus strains MED4 and MIT9313 (Thompson et al., 2011). The effect of phosphate limitation on the global transcriptome, however, has only been studied in the marine strains Synechococcus sp. WH8102 (Tetu et al., 2009; Ostrowski et al., 2010) and Prochlorococcus strain MED4 (Steglich et al., 2008). No single global transcriptomic study is available that compares data from cells limited for all macronutrients for one cyanobacterial strain cultivated under identical and well-defined conditions. This information is a prerequisite for the development of comprehensive metabolic models for a specific organism. We additionally compared the transcription profiles of cells grown with reduced nitrogen sources (ammonia and urea) to those of cells grown with nitrate. In addition to identifying many nutrient-specific acclimation processes, these comparisons identified some general acclimation responses that occur in Synechococcus 7002 cells experiencing nutrient limitation.
Materials and Methods
Sample Preparation
Synechococcus 7002 cultures were grown in tubes containing medium A (25-mL) supplemented with 1 mg of NaNO3 mL-1 (designated as medium A+; Stevens and Porter, 1980; Ludwig and Bryant, 2011). The cultures were grown at 38°C with continuous illumination at 250 μmol photons m-2 s-1 and were sparged with 1% (v/v) CO2 in air (These optimal growth conditions are defined as “standard conditions.”). The reference cultures grown under “standard” conditions were grown to OD730 nm = 0.7 (Ludwig and Bryant, 2011). Growth under low CO2 was performed in A+ medium under standard temperature and light intensity, but cultures were sparged with air [0.035% (v/v) CO2]. The cultures used for N-, S-, and P-limitation studies were grown under “standard” conditions in complete A+ medium containing all nutrients to an OD730 nm of ∼0.6–0.7 (i.e., prior to the onset of light limitation). Cells were then harvested by centrifugation, washed twice in a modified medium A (lacking the specified nutrient), and were resuspended in medium A without the specified nutrient: in medium A (lacking nitrate); in sulfate-free medium A+ that contained MgCl2 × 6 H2O instead of 20.3 mM MgSO4 × 7 H2O; or in phosphate-free medium A+. The resuspended cultures were adjusted to an initial OD730 nm of 0.35 (for N- and S-limitation) or 0.25 (for P-limitation). The resulting cell suspensions were incubated under standard temperature, light intensity, and aeration and were harvested when OD730 nm reached 0.7. This procedure allowed at least one doubling to occur under nutrient-limiting conditions. Preliminary growth experiments (see Figure S1 in Supplementary Material) showed that, by initiating the growth limitation at the OD730 nm values specified above, the cultures could still grow to the same final OD730 nm (i.e., 0.7) as cells harvested from standard conditions. Furthermore, the RNA yields obtained from such cultures were sufficient for the preparation of high-quality cDNA libraries.
Fe-limitation was induced by adding an Fe-binding chelator to the growth medium instead of medium exchange (Shcolnick et al., 2009). Preliminary growth experiments with Synechococcus 7002 cultures showed that a 50-fold excess of deferoxamine mesylate B was required to induce Fe-limitation, and that cells could continue to grow for ∼1 more doubling under these conditions (Figure S2 in Supplementary Material). At OD730 nm = 0.35, a final concentration of 720 μM deferoxamine mesylate B was added to a culture in A+ medium (containing 14.4 μM iron), which was grown under standard conditions until OD730 nm = 0.7.
Growth with different N-sources was performed in modified, HEPES-buffered medium A, in which 25 mM HEPES, pH 8.0 replaced 8.3 mM Tris–HCl, pH 8.2. The medium was supplemented with 1 μM NiSO4 to avoid Ni-limitation (see Sakamoto and Bryant, 2001). Apart from these modifications, all other components were the same and had the same concentrations as medium A. NaNO3 (12 mM), NH4Cl (10 mM), or urea (10 mM) were added as N-sources. The cultures were grown under standard conditions as described above to a final OD730 nm of 0.7.
RNA Extraction
Cells were rapidly harvested by centrifugation (5 min, 5000 × g, 4°C), and the cell pellets were frozen in liquid nitrogen and stored at −80°C until required. RNA samples for subsequent cDNA library construction were prepared from frozen cell pellets resulting from 20 to 30 mL liquid cultures.
For RNA purification, cells were resuspended in 10 mM Tris–HCl, pH 8.0 (400 μL); lysozyme was added (4.5 mg mL−1 final concentration); and the sample was incubated for 2 min at room temperature. The sample was dispensed into two 1.5-mL reaction tubes and acidic phenol–chloroform solution [400 μL; 1:1 (v/v), pH 4.3] and BugBuster Protein Extraction Reagent (400 μL; Novagen) were added to each reaction tube for cell lysis and protein denaturation; the samples were vortexed two times for 1 min and stored on ice between treatments. After cell lysis, the samples were centrifuged (2 min, 10,000 × g, 22°C), the aqueous phase was extracted once more with phenol–chloroform solution, and the combined extracts were finally extracted once with chloroform–isoamyl alcohol (24:1, v/v). The RNA was precipitated from the aqueous phase by adding one-tenth volume of 3.0 M sodium acetate, pH 5.2 and 2.5 volumes of ethanol, and the precipitated RNA was washed twice with 70% (v/v) ethanol. The RNA was further processed using the High Pure RNA Isolation Kit (Roche) according to the recommendations of the manufacturer. The RNA pellet was resuspended in DNase incubation buffer (460 μL), and RNasin (4 μL, Promega), and DNase I (60 μL) were added to the samples, which were incubated for 1 h at 22°C. After DNase I treatment, the RNA was purified by size exclusion chromatography on the provided spin-columns; this step removed RNA species smaller than ∼300 nucleotides, including tRNAs and 5S rRNA.
RNA concentrations were determined using a NanoDrop ND-1000 Spectrophotometer (Thermo Scientific), and a Qubit System (Invitrogen) was also used to determine DNA concentration separately. The quality of the RNA samples was analyzed using a 2100 Bioanalyzer (Agilent).
cDNA Library Construction, SOLiD™ Sequencing and Data Analyses
Construction of cDNA libraries and SOLiD™ sequencing was performed in the Genomics Core Facility at The Pennsylvania State University (University Park, PA, USA). The cDNA libraries were constructed from 0.5 μg RNA sample using SOLiD™ Whole Transcriptome Analysis Kit (Applied Biosystems) and were barcoded by using the SOLiD™ Transcriptome Multiplexing Kit (Applied Biosystems). In brief, reverse transcription and library preparation included the following steps: fragmentation of RNA using RNase III, ligation of the resulting RNA fragments (∼150 bases in average) to adaptors via RNA Ligase 2, reverse transcription, and amplification of cDNA (both starting from adaptor sequences). SOLiD™ ePCR Kit and SOLiD™ Bead Enrichment Kit (both Applied Biosystems) were used for processing the samples for sequencing, and either the SOLiD™ 3 or 3 Plus protocol (Applied Biosystems) was used for sequencing.
The sequence data have been submitted to the NCBI Sequence Read Archive (SRA) under accession number SRP007372.
The 50-bp cDNA sequences obtained were mapped against the Synechococcus 7002 genome by using the Burrows–Wheeler algorithm (Li and Durbin, 2009), allowing four mismatches (≥92% sequence identity). Sequences mapping to regions coding for ribosomal RNAs, and reads that did not map to unique positions, were removed from the resulting mapped sequence files. Counting of sequences covering each open reading frame (ORF), calculations of the relative transcript abundance for each ORF and comparisons of the relative transcript abundances between different conditions/data sets were performed as described previously (Ludwig and Bryant, 2011). The relative transcript abundances for cells grown under “standard” conditions were obtained from a previous study (Ludwig and Bryant, 2011). Those reference values were obtained by using the same experimental procedures as described here, and those cultures were grown during the same time period. The “standard” values were average values determined from three independently grown cultures. Statistical analyzes were performed as described (Ludwig and Bryant, 2011).
Results and Discussion
Nutrient Limitation Causes Lower Expression of Genes Encoding the Protein Biosynthesis Machinery and Enzymes of Major Metabolic Pathways
Transcript profiles of cells experiencing nutrient limitation (C, N, S, P, or Fe) or grown with alterative N-sources were determined. As shown in Table 1, ∼10–17 million reads obtained from SOLiDTM sequencing were mapped for each growth condition. The sequences mapping to genes other than those for the rRNA operons varied from 5.5 to 17.4% of the total mapped reads. The relative transcript abundances for each annotated protein-coding ORF of the genome were calculated from these data. Transcript levels for all genes under all conditions of this study are provided in Table S1 in Supplementary Material.
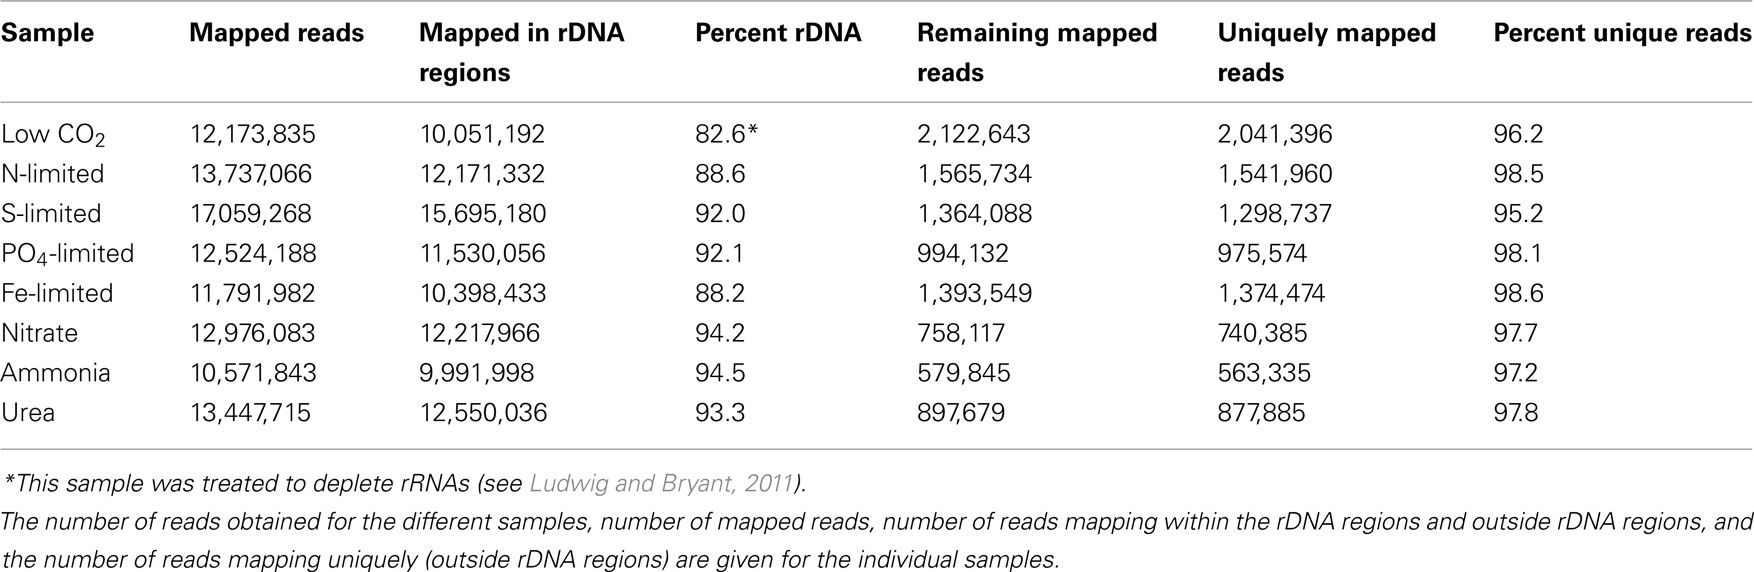
Table 1. Number of sequences obtained by SOLiD™ sequencing for the samples analyzed in this study.
Limiting the supply of any essential nutrient will impair cellular metabolism and will inevitably result in slower growth. Moreover, initially that slower growth is characteristically linear rather than exponential (see Sakamoto and Bryant, 1998). In order to monitor changes in the global transcriptome, transcript abundances obtained for cells subjected to nutrient limitation were compared to those of cells grown under nutrient-replete, “standard conditions.” Gene-by-gene comparisons for all conditions presented in this study, which also provide p-values for the statistical significance of each result, are provided in Table S2 in Supplementary Material. Figure 1 shows scatter plots for the relative transcript abundances of all ORFs in cells subjected to different nutrient limitation conditions compared to those under “standard” (replete) conditions. The parallel gray lines in each panel demarcate 2-fold changes, and many genes clearly showed greater increases or decreases. It is obvious from these plots that the response to P-limitation (Figure 1D) was much more limited than the responses to limitation for other nutrients. The perturbations caused by these limitations had a much greater impact on the overall transcript pattern than was previously observed for high irradiance or dark treatments of Synechococcus 7002, in which only the combined effects of changing two parameters (switching from light to dark and from oxic to anoxic conditions) caused a comparably severe change in the global transcript pattern (Ludwig and Bryant, 2011).
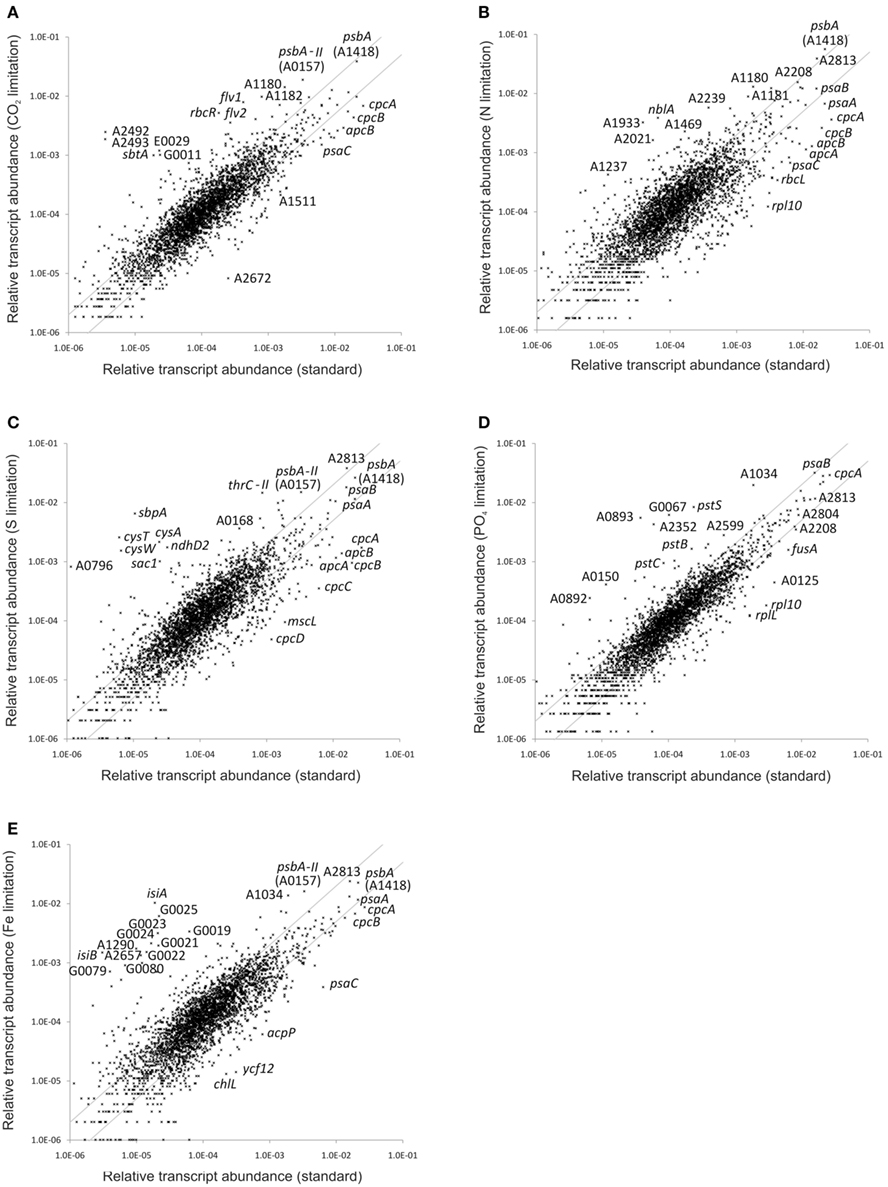
Figure 1. Changes in the relative transcript abundance upon nutrient limitation. The scatter plots show the relative transcript abundances (A) when grown with low CO2 supply and after (B) nitrogen, (C) sulfur, (D) phosphate, and (E) iron deprivation compared to that for “standard” growth conditions (mean of three biological replicates). The gray lines give 2-fold changes in either direction. Selected genes are identified by name/locus tag number.
Figure 2 summarizes graphically the changes in transcript levels of genes involved in major metabolic pathways and nutrient uptake mechanisms under different nutrient limitations compared to “standard” growth conditions. A detailed listing of the comparisons (showing exact values and p-values for all comparisons) for all genes coding for components of the respective pathways or cell components is given in Table S3 in Supplementary Material. The impairment of cell growth during nutrient limitation was revealed by large decreases in transcript levels for genes encoding ribosomal protein subunits and for genes coding for major metabolic functions (i.e., reductant and energy production by PSII, PSI, and the light harvesting complexes; ATP synthesis by the ATP synthase; and CO2 fixation; Figure 2). Furthermore, transcript levels for genes coding for enzymes involved in heme and chlorophyll biosynthesis decreased (Table S3 in Supplementary Material). These results generally agree with observations reported for microarray studies in other cyanobacteria during C-, N-, S-, P-, and Fe-limitation (Singh et al., 2003; Wang et al., 2004; Osanai et al., 2006; Zhang et al., 2008; Tetu et al., 2009; Schwarz et al., 2011). However, in contrast to cyanobacterial strains that perform dinitrogen fixation, Synechococcus 7002 experiences the full effect of N-limitation when nitrate is removed from the growth medium. Transcript levels for genes encoding other components of the photosynthetic electron transport chain (cytochrome b6 f complex, cytochrome c6, ferredoxin, and ferredoxin–NADP+ reductase) were relatively unaltered (Figure 2). It has been reported that genes encoding the cytochrome b6 f complex in Synechocystis sp. PCC 6803 have lower transcript levels during S-, Fe-, or CO2-limitation (Singh et al., 2003; Wang et al., 2004; Zhang et al., 2008). However, transcript levels for these genes decreased only slightly under nutrient limitation conditions in Synechococcus 7002. The situation with the psbA gene family (encoding the D1 protein of PSII) as well as a few phycobilisome-related genes is more complex and showed differences from the above-mentioned general trend (lower transcript levels when a nutrient was limiting; see Text S1 in Supplementary Material).
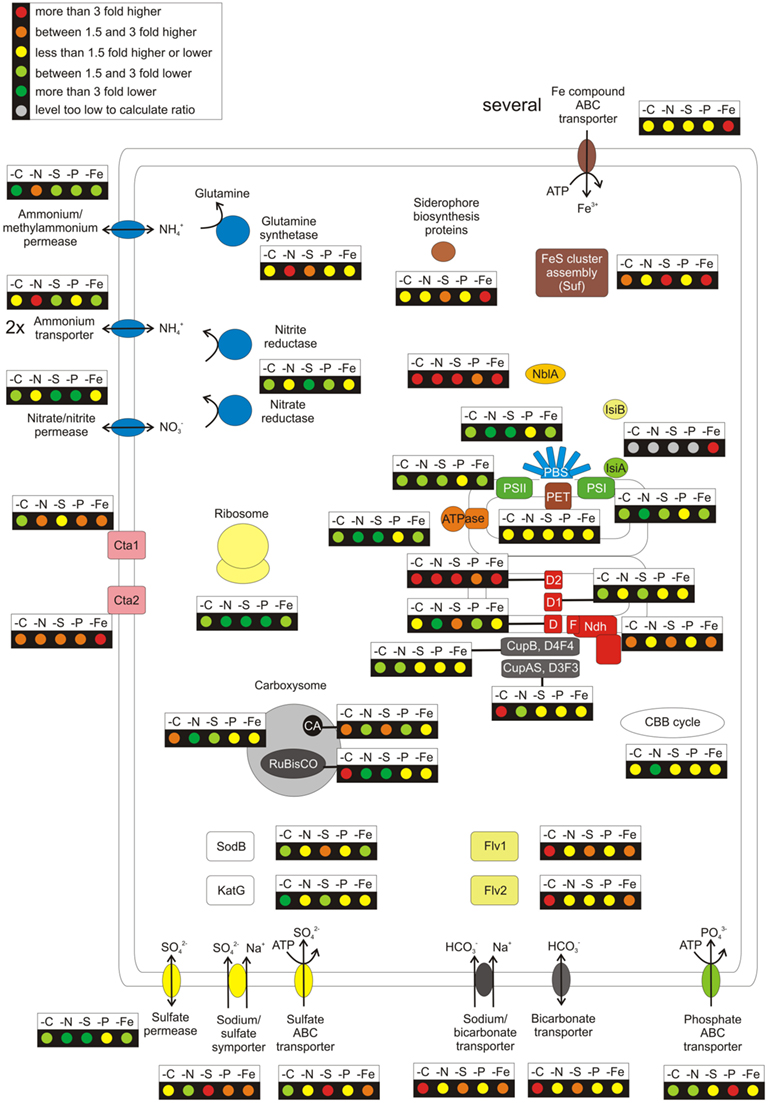
Figure 2. Overview over the regulation pattern in response to nutrient limitations for a selection of cellular components. The figure summarizes the general regulation pattern in response to limitation of CO2, nitrogen, sulfur, phosphorus, and iron. The changes of the relative mRNA levels under the respective nutrient limitation are compared to “standard” growth conditions. These ratios are displayed for genes coding for a selection of cellular functions, among these the photosystems (PSI, PSII; for PSII the three psbA genes were disregarded since they replace each other in response to different conditions), phycobilisomes, the phycobilisome degradation protein NblA, components of the photosynthetic electron transport chain, the carboxysome, the Calvin–Benson–Bassham cycle, the NADH dehydrogenase complex, the F0F1 type ATP synthase, the terminal oxidases, and the ribosome. Further, the genes coding for uptake systems for ammonia, nitrate, sulfate, phosphate (pstABCS), and iron (all genes listed in Table S3 in Supplementary Material except those for regulation, siderophore biosynthesis, and Fe–S cluster assembly) are shown. The nitrate and nitrite reductases and the glutamine synthetases (glnA, glnN), the siderophore biosynthesis (SYNPCC7002_G0019-G0023), and Fe–S cluster assembly (sufBCDS) are highlighted. Finally, the changes in the transcript levels of two flavoproteins, the superoxide dismutase, and catalase are given.
Transcript levels for nblA, which encodes a small protein that potentiates the degradation of phycobiliproteins by Clp protease (Baier et al., 2004; Barker-Astrom et al., 2005; Bienert et al., 2006; Karradt et al., 2008), showed very large increases upon nutrient deprivation (Figure 2). Transcript levels for nblA increased ∼60-fold under N-limitation (Figure 1B); limitation for other nutrients also resulted in large increases in nblA transcript levels: ∼10-fold in cells grown under low CO2 or S-limitation; and 2- and 3-fold increases under P- and Fe-limitation, respectively (Table S3 in Supplementary Material). In general, the nblA transcription patterns observed here for Synechococcus 7002 were similar to the patterns of phycobiliprotein degradation observed for Synechococcus sp. PCC 7942 (Collier and Grossman, 1992, 1994). However, in a study with Synechocystis sp. PCC 6803, it was shown that NblA-mediated bleaching was most severe upon N- and Fe-limitation; S-limitation did not cause a large increase of nblA transcripts, and cells correspondingly did not undergo subsequent bleaching (Singh and Sherman, 2000; Richaud et al., 2001).
Transcriptional Regulation of CO2 Fixation
The reducing equivalents and ATP generated by the activities of the photosystems are mostly channeled into CO2 fixation via the Calvin–Benson–Bassham (CBB) cycle in cyanobacteria. Ribulose 1,5-bisphosphate carboxylase/oxygenase (RuBisCO) is the key enzyme of the CBB cycle and is encoded by the rbcL and rbcS genes (Badger and Bek, 2008; Tang et al., 2011). Transcripts for the rbcLS genes decreased sharply upon N- (∼10-fold) and S-limitation (3- to 5-fold), but were only slightly lower under Fe-limitation and were largely unaffected by P-limitation (Figure 2). When cells were grown with limiting CO2, (i.e., the cultures were sparged with air instead of 1% (v/v) CO2-enriched air), transcript levels for the rbcLS genes increased 2- to 4-fold. RuBisCO is enclosed in sub-cellular microcompartments called carboxysomes, which also harbor a carbonic anhydrase encoded by icfA (Yeates et al., 2008; Cannon et al., 2010; Espie and Kimber, 2011). Similar to the rbcLS genes, CO2-limitation also caused transcript levels of the ccm genes, encoding structural subunits of the carboxysomes (ccmK, ccmL, ccmM, ccmN), and icfA to increase up to 5-fold. N-limitation resulted in a very dramatic decrease (up to 20-fold) in mRNA levels for ccm genes, whereas the transcript levels for these genes were slightly lower in cells subjected to S- and P-limitation or at about standard level after Fe-limitation. Interestingly, transcript levels for icfA were only slightly lower (2-fold) during N- and P-limitation but were slightly higher (less than 2-fold) when cells were S- or Fe-limited (Table S3 in Supplementary Material). Transcript levels for other genes encoding enzymes of the CBB cycle also changed during nutrient limitation. Under N-limitation mRNA levels decreased up to 10-fold, but the impact of limitation for other nutrients, in particular CO2, was less significant (mRNA levels decreased 2- to 3-fold at most; Figure 2). The generally lower transcript levels for genes encoding enzymes of the CBB cycle are consistent with a general decrease in biosynthetic activities in nutrient-limited cells compared to cells growing under optimal conditions (see above). A slight decrease of transcript levels of CBB cycle genes under low CO2 might indicate that cells only require increased levels of the rate-limiting enzyme, RuBisCO, which directly interacts with CO2. Adequate levels of the other enzymes may already exist to meet the biosynthetic demand under CO2-limited growth conditions.
Impact of Nutrient Limitation on Carbohydrate Degradation
Transcript levels for genes encoding enzymes of carbohydrate metabolism also changed in response to nutrient limitation. Fructose-bisphosphate aldolase (class I), which is encoded by fbaB (SYNPCC7002_A0010) and which showed higher transcript levels in the dark (Ludwig and Bryant, 2011), probably encodes the enzyme involved in carbohydrate catabolism. Transcript levels for this gene were higher under all nutrient limitation conditions (see Table S3 in Supplementary Material). However, the transcript levels for most other genes involved in carbohydrate degradation pathways did not change very much. Interestingly, transcript levels for phosphoenolpyruvate synthase (ppsA), which increased more than 100-fold in cells exposed to darkness (Ludwig and Bryant, 2011), had 2-fold higher transcript levels in cells grown under CO2-limitation and 5-fold higher transcript levels in P-limited cells. When cultures were S- or Fe-limited, the mRNA levels of ppsA were ∼2-fold lower compared than that of cells grown under standard conditions. Transcript levels for the pyk gene, encoding the pyruvate kinase, were lower under all nutrient limitation conditions (Table S3 in Supplementary Material), and those for the pyruvate dehydrogenase complex and the pyruvate:ferredoxin oxidoreductase were unchanged or decreased up to 3-fold. These differences suggest that the increase in ppsA transcripts during P-limitation is probably a specific, acclimative response (phosphate is one of the substrates of PpsA). Transcript levels for genes encoding for components of fermentative metabolism, D-lactate dehydrogenase (ldhA), and hydrogenase, were generally lower in nutrient-limited cells. When cells were P-limited, however, transcript levels for the bidirectional hydrogenase, especially the diaphorase subunits (hoxE, hoxF, and hoxU), increased up to 3-fold. Transcript levels for these three genes also specifically increased in cells exposed to dark anoxic conditions (Ludwig and Bryant, 2011). In contrast to anabolic reactions generally, carbohydrate catabolism remains relatively unchanged when cells are subjected to nutrient limitation. This probably reflects the necessity to maintain these elements of central metabolism under less favorable conditions.
Acclimation of the NADH Dehydrogenase Complex and of Terminal Oxidases
The Type-I NADH dehydrogenase complex (complex 1; Ndh complex) is involved in feeding reducing equivalents into the respiratory chain and in cyclic electron flow around PS I (Ogawa and Mi, 2007; Battchikova et al., 2010). The transcript levels for genes encoding subunits of the Ndh complex changed significantly when cells were subjected to various nutrient limitations (Figure 2; Table S3 in Supplementary Material). The Ndh complex in cyanobacteria (and in Synechococcus 7002) consists of 15 subunits (NdhA-O); several paralogous genes occur in cyanobacterial genomes for the NdhD and NdhF subunits (Ogawa and Mi, 2007). In Synechococcus 7002 these are ndhD, ndhD1, ndhD2, ndhD3, and ndhD4, and ndhF, ndhF3, and ndhF4. NdhD3/NdhD4 and NdhF3/NdhF4 are components of CO2 uptake and concentrating complexes that convert CO2 into bicarbonate (Battchikova et al., 2010). Transcription profiles of the genes for these variants of the Ndh complex are listed separately (see below). Growth with limiting CO2 caused up to a 6-fold increase in mRNA levels for the ndh genes (ndhA–C, ndhE–O). Transcript levels for these genes also increased up to 4-fold during S- and Fe-limitation, but little or no change was observed upon N- or P-limitation. An exception was the transcript level for ndhL, which encodes a subunit involved in inorganic carbon transport; its mRNA level increased 5-fold under N-limitation and also increased 3- to 4-fold when cells were grown under CO2-limitation, S-limitation, or Fe-limitation, but did not increase under P-limitation (Table S3 in Supplementary Material). Synechococcus 7002 has only one ndhF paralog (SYNPCC7002_ A0854) that is not involved in CO2 uptake (ndhF3, ndhF4; see below), but it has three paralogous ndhD genes (annotated as ndhD, ndhD1, ndhD2) that do not encode subunits of the complexes involved in CO2 uptake (ndhD3, ndhD4; see below). Transcript levels for ndhD and ndhD1 generally did not change dramatically (Figure 2). However, transcript levels for ndhD2 were higher under all nutrient limitation conditions: 2.5-fold under P-limitation; 6-fold under N-limitation; and 17- to 18-fold under CO2-limitation and Fe-limitation. The transcript level for the ndhD2 gene exhibited one of the largest of all increases, 54-fold, under S-limitation (see Figure 1C). The mRNA level of ndhD2 increased 16-fold when Synechococcus 7002 cells were exposed to high-light (Ludwig and Bryant, 2011). These data suggest that NdhD2 may replace other paralogous NdhD subunits under several stress conditions, when reducing equivalents cannot be efficiently transferred to terminal electron acceptors (mainly CO2, but also ). Because the NdhD subunit is located within the hydrophobic, membrane-intrinsic domain of the complex and is involved in proton pumping (Battchikova et al., 2010; Efremov and Sazanov, 2011), a role in adjusting the ratio of protons translocated to electrons transported has been suggested to be the reason for exchanging paralogous NdhD subunits (Ludwig and Bryant, 2011). The general increase of transcripts for all NADH dehydrogenase genes under some stress conditions implies that cyclic electron transport, involving PS I and the Ndh complex, may become more important during nutrient stress. Transcription changes that could lead to modification of the subunit composition of the Ndh complexes presumably produce different and specialized properties, but this possibility must be experimentally verified.
The Synechococcus 7002 genome encodes two cytochrome oxidases, and it has been suggested that cytochrome oxidase-I serves as the principal terminal oxidase of the respiratory chain, whereas cytochrome oxidase-II has been suggested to play a role as signal transducer to measure the redox balance and trigger oxidative stress responses (Nomura et al., 2006a,b). Transcript levels of the cta-I genes were generally 1.5- to 3-fold higher during N-, P-, and Fe- limitation (Figure 2; Table S3 in Supplementary Material), but were 1.5- to 3-fold lower in CO2-limited cells. Transcript levels for the cta-II genes increased moderately under all nutrient limitation conditions presented in this study.
Facing Oxidative Stress: Superoxide Dismutase, Catalase, and Flavoproteins
Alternative reductive pathways (CO2, nitrate, and sulfate reduction) could serve as sinks for excess electrons under some nutrient-limiting conditions. Transcription data, however, do not support the possibility that electrons are directed to other reductive pathways when a major nutrient is limiting (see Text S2 in Supplementary Material). The inability of nutrient-limited cells to transfer reducing equivalents generated by the photosystems into anabolic reactions could result in over-reduction of the plastoquinone pool, which can contribute to the formation of reactive oxygen and nitrogen species (ROS/RNS; Latifi et al., 2009; Kornas et al., 2010). Principal components of the response to oxidative stress in cyanobacteria include superoxide dismutase (sodB, SYNPCC7002_A0242), catalase (katG, SYNPCC7002_A2422), various peroxidases (SYNPCC7002_A0117, SYNPCC7002_A0970), cyanoglobin (glbN, SYNPCC7002_A1621; Scott et al., 2010), and methionine sulfoxide reductases (msrA, SYNPCC7002_A0215 and msrB, SYNPCC7002_A0672), which inactivate or repair the damage caused by these toxic species. Surprisingly, although transcript levels for a few of these genes increased modestly under some stress conditions, the transcript levels for these genes were relatively constant overall (Table S3 in Supplementary Material). Under standard growth conditions, the relative transcript level of sodB was similar to that for rbcL and rbcS, and the transcript levels of most other genes involved in the oxidative stress response were at least 10% of those for rbcLS (see Table S1 in Supplementary Material). We have reported previously that transcripts for some genes encoding enzymes involved in carotenoid biosynthesis in Synechococcus 7002 increased during nutrient limitation and other stress conditions (Zhu et al., 2010). These observations are consistent with the hypothesis that Synechococcus 7002 constitutively expresses a high level of enzymes to cope with oxidative stress, which might explain the natural tolerance of this organism to conditions that cause severe or even lethal oxidative stress in other cyanobacteria.
Besides superoxide dismutase, peroxidases, and catalase, cyanobacteria synthesize flavoproteins that transfer electrons to dioxygen, producing water, and thereby relieving the electron surplus that leads to the formation of ROS/RNS (Helman et al., 2003; Hackenberg et al., 2009). The Synechococcus 7002 genome encodes two flavoproteins (flv1, SYNPCC7002_A1321 and flv2, SYNPCC7002_A1743), and the transcript levels of these genes did not change in response to N- and P-limitation (Figure 2). S- and Fe-limitation, however, caused a slight increase of flv2 transcripts (∼1.5- to 2-fold) and flv1 transcripts increased nearly 3-fold. The largest increase in flv1 and flv2 transcripts was observed when cells were CO2-limited. The flv2 transcripts increased 13-fold, and flv1 transcripts increased 19-fold. These two genes were among those exhibiting the largest increases in transcript abundance for all genes in CO2-limited cells (Figure 1A). These results suggest that Flv1 and Flv2 relieve over-reduction of the quinone pool by transferring electrons to O2 when CO2 is limiting. Interestingly, in cells exposed to high-light intensity for 1 h, which produced some of the transcription changes characteristic of CO2-limitation, a concerted up-regulation of flv1 and flv2 mRNAs was not observed (Ludwig and Bryant, 2011). Thus, these flavoproteins appear to play a more important role in cells subjected to chronic CO2-limitation than in cells transiently exposed to high-light.
Transcriptional Up-Regulation of Alternative Electron Carriers and Other (Putative) Genes
The Synechococcus 7002 genome has several genes annotated as encoding “universal stress proteins” and also has genes for several molecular chaperones (e.g., groEL, groES, dnaK, dnaJ) and heat-shock proteins (e.g., hspA, grpE, htpG). Transcript levels for these genes, however, were largely unaffected under the nutrient limitation conditions tested here (see Text S3 in Supplementary Material). Although its role in electron transfer is not completely clear (Shuvalov et al., 2001), cytochrome cM is a membrane-associated c-type cytochrome, whose expression is enhanced under low-temperature and high-light stress in Synechocystis sp. PCC 6803 (Malakhov et al., 1999). Transcript levels for cytM in Synechococcus 7002 were 14- to 24-fold higher under N-, S-, and Fe-limitation (Table S3 in Supplementary Material) but decreased 2-fold under P-limitation. The transcript level for cytM increased 6-fold after a 1-h exposure to high-light (Ludwig and Bryant, 2011). These data suggest that Cyt cM may be involved in electron transfer under several stress conditions in cyanobacteria. There are two genes annotated as cytochrome c6 (petJ): SYNPCC7002_A0167 and SYNPCC7002_A2391. Transcript levels of both were generally lower under nutrient-limiting conditions (3-fold or less); however, slight increases of mRNA (∼2-fold) were observed for SYNPCC7002_A2391 under Fe- and S-limitation. The exchange of a soluble c-cytochrome for a membrane-anchored cytochrome could reflect changes in the periplasmic space or outer membrane that might affect the functionality of soluble Cyt c6 (PetJ).
Transcript levels for two adjacent genes, SYNPCC7002_A1476 (“high-light inducible protein”) and SYNPCC7002_A1477 (conserved hypothetical protein), increased 43- and 47-fold respectively, which were among the largest increases observed in response to N-limitation (Figure 1B). BlastP analyses indicate that SYNPCC7002_A1476 encodes a high-light-inducible protein of the CAB/ELIP/HLIP family, proteins that are known to increase in cells in response to high-light and nutrient stress (He et al., 2001; Kilian et al., 2008). SYNPCC7002_A1477 encodes a protein homologous to Arabidopsis thaliana protein PGR5, which is a small, highly conserved protein required for ferredoxin:plastoquinone reductase-dependent, cyclic electron transport (Munekage et al., 2002; Takabayashi et al., 2005; Yeremenko et al., 2005). Transcript levels for these two genes also increased markedly under Fe-limitation (15- and 13-fold), CO2-limitation (4- and 10-fold), and S-limitation (3.5- and 9-fold), and their transcript levels likewise increased 3.5- to 5-fold after cells were exposed to high-light for 1 h (Ludwig and Bryant, 2011). CAB/ELIP/HLIP proteins may bind chlorophyll(s) and/or carotenoid(s) and play a role in binding these molecules while cells acclimate to stress by altering the composition of their photosynthetic apparatus (Montane and Kloppstech, 2000; Havaux et al., 2003). Besides SYNPCC7002_A1476 there are three additional genes annotated as high-light-inducible proteins: SYNPCC7002_A0186, SYNPCC7002_A0602, and SYNPCC7002_A0858, and transcript levels for all of them increased when cells were exposed to high-light for 1 h (Ludwig and Bryant, 2011). CO2-, N-, S-, and Fe-limitation resulted in 3- to 20-fold increases in transcript levels for SYNPCC7002_A0186 and SYNPCC7002_A0602, whereas transcripts for SYNPCC7002_A0858 only increased ∼2.5-fold in CO2- and S-limited cells (Table S3 in Supplementary Material).
SYNPCC7002_A2492 and SYNPCC7002_A2493 are adjacent genes that showed the largest increases in transcript levels when cells were grown with limiting CO2 (690- and 530-fold, respectively; Figure 1A; Table S3 in Supplementary Material). Transcript levels for these genes were also elevated in N-, S-, and Fe-limited cells (4- to 13-fold). P-limitation resulted in a lower mRNA level for SYNPCC7002_A2492 and a higher level for SYNPCC7002_A2493. However, because the number of mapped reads for these genes was low, the p-values for these particular comparisons are low and, thus the quality of the calculated ratio values is uncertain (see Tables S1 and S2 in Supplementary Material). Transcript levels for these two genes also increased after a 1-h exposure to high-light or darkness (Ludwig and Bryant, 2011). A conserved domain analysis showed that SYNPCC7002_A2492 is an integral membrane protein with a PsiE (Phosphate-starvation-inducible E) domain. The expression of psiE in E. coli increased upon phosphate limitation and carbon starvation (Kim et al., 2000); however, the function of this protein is unknown. SYNPCC7002_A2493 has sequence similarity to a C-terminal domain of Mo-nitrogenase and contains several highly conserved Cys residues. The transcriptome data obtained here and in our previous study (Ludwig and Bryant, 2011) show that C-limitation caused the largest changes in transcription for SYNPCC7002_A2492 and SYNPCC7002_A2493, which is similar to results observed in E. coli upon carbon limitation for psiE (Kim et al., 2000). Unlike E. coli, phosphate does not appear to be regulator of SYNPCC7002_A2492 and SYNPCC7002_A2493 in Synechococcus 7002.
Specific Responses of Genes Coding for Uptake Systems
Although some transcription changes were observed during limitation for multiple nutrients, many transcription changes were highly specific for limitation for a specific nutrient. Figure 2 summarizes changes of transcript levels for CO2-concentrating complexes, for different transporters (bicarbonate, ammonia, nitrate/nitrite, sulfate, phosphorus, and Fe compounds), for genes involved in siderophore biosynthesis and in Fe–S cluster assembly. Generally, limitation of a given nutrient results in strongly increased mRNA levels for genes encoding related nutrient uptake systems; a more detailed description is given in the Section “Text S4 in Supplementary Material.” In some cases there are several uptake mechanisms for specific nutrients showing different regulation patterns. Synechococcus 7002, as cyanobacteria in general, harbors two CO2-concentrating complexes, which are derivatives of the NADH dehydrogenase complex (Battchikova et al., 2010), a constitutive CO2-concentrating complex (ndhD4, ndhF4, and cupB) showing slightly lower transcript levels upon CO2-limitation and an inducible CO2-concentrating complex (ndhD3, ndhF3, cupA and cupS), whose mRNA levels increased strongly (9- to 16-fold) when cells are grown with a limiting CO2 supply (Figure 2; Table S3 in Supplementary Material). As found in some other cyanobacteria, the Synechococcus 7002 genome encodes different types of sulfate uptake systems (Kertesz, 2001). A gene cluster for a sulfate ABC transporter (sbpA, cysT, cysW, cysA, and an additional ORF SYNPCC7002_A0796, see Text S5 in Supplementary Material) and a sodium/sulfate symporter (sac1) showed strong increases in transcript levels under S-limitation (Figure 1C), whereas the transcript level of a sulfate permease (SYNPCC7002_A2424) was about 4-fold lower upon S-limitation. These data suggest that at high sulfate concentrations, a sulfate permease imports sulfate into cells, whereas at low sulfate concentrations an ATP-driven system with higher binding affinity and a sodium/sulfate symporter take over this role. Furthermore, the data show that the more energy-consuming ABC transporter is strongly down-regulated when sulfate is available in the medium at a sufficient level. This finding is surprising in a way, because Synechococcus 7002 is considered to be a marine cyanobacterium and sulfate is usually not limiting in marine environments. Therefore, these transcription data suggest that Synechococcus 7002 has the ability to easily acclimate to freshwater habitats, in which S-limitation is more common, by inducing a high-affinity uptake system. This may contribute to the cosmopolitan distribution of this organism, which has been found in temperate climates around the world (Van Baalen, 1962; Rippka et al., 1979).
Transcription Profiles of Cells Growing on Reduced Nitrogen Sources
Synechococcus 7002 can utilize a variety of organic and inorganic nitrogen compounds as N-sources in addition to nitrate (Kapp et al., 1975), but it cannot reduce dinitrogen. Synechococcus 7002 cells were grown with nitrate, ammonia, or urea as N-sources, and the global transcriptomes of these cells were compared. Urea is hydrolyzed by the nickel-containing enzyme, urease, yielding ammonia and CO2 (Sakamoto and Bryant, 2001). Ammonia is the common end product of both nitrate/nitrite reduction and the hydrolysis of urea, and it is the substrate for glutamine formation by glutamine synthetase, which catalyzes the major step in ammonia assimilation by cells (Eisenberg et al., 2000). Compared to the large changes observed upon nutrient limitation, differences in global transcription patterns were surprisingly minimal when Synechococcus 7002 was grown with different N-sources. An inspection of scatter plots for these comparisons (Figure 3) reveals that transcript levels for only a few genes changed more than 2-fold. This very high similarity between ammonia- and nitrate-grown cells is surprising. For example, it has been reported for Synechococcus sp. WH 8102 that more than 300 genes were differentially expressed when cells were grown with ammonia or nitrate as N-source (Su et al., 2006). Transcript abundances for cells grown with urea and with ammonia were strikingly similar (Figure 3C). The mRNA levels of genes encoding components of the photosystems, phycobilisomes, heme/chlorophyll biosynthesis pathway, and the photosynthetic electron transport chain, which comprise a very large proportion of the total mRNA pool, did not change as a function of the N-source (Table S3 in Supplementary Material). However, transcript levels for nblA decreased 3-fold when cells were grown with ammonia (Figure 4); this suggests that cells growing on ammonia probably have a slightly higher phycobiliprotein content than cells growing on nitrate. This is consistent with studies suggesting that phycobiliproteins can be used as a storage material for reduced carbon and nitrogen in cyanobacteria (Boussiba and Richmond, 1980).
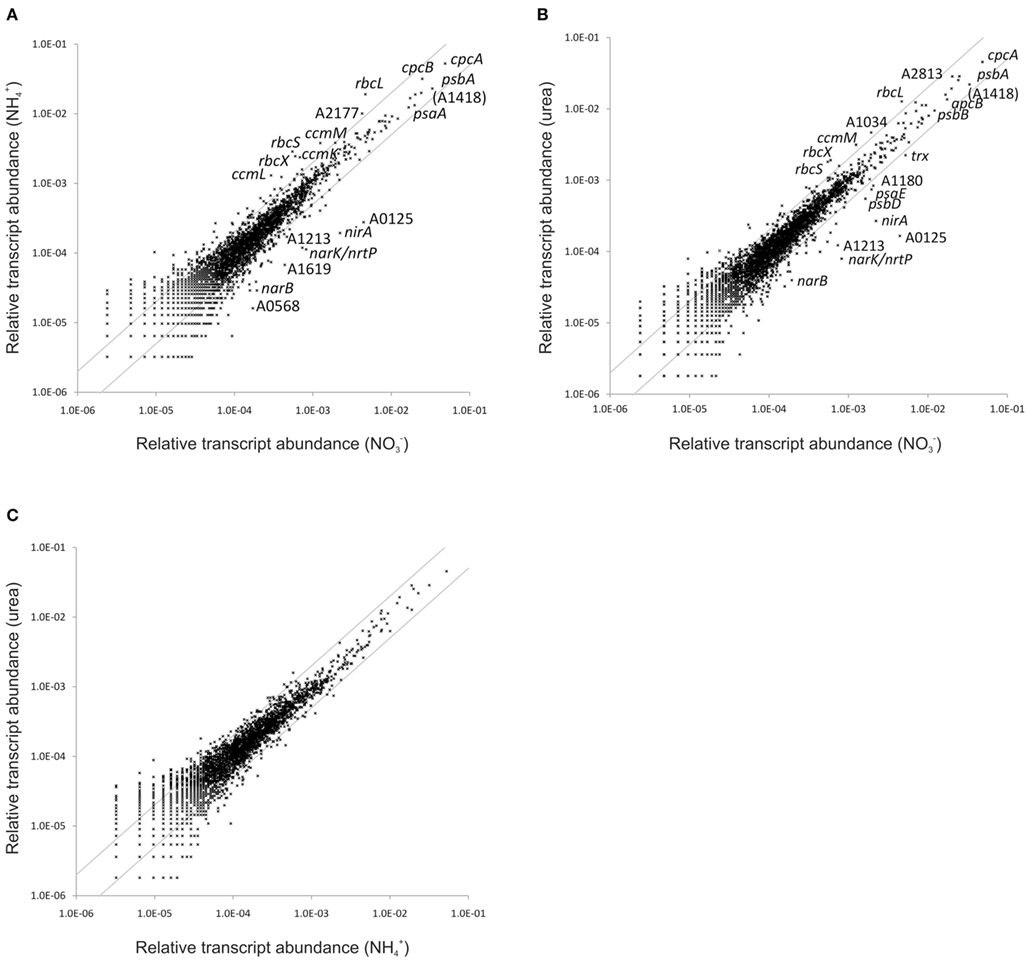
Figure 3. Differences in the relative transcript abundance in cultures grown with different nitrogen sources. The scatter plots show the relative transcript abundances of a culture grown with (A) ammonia and (B) urea as nitrogen source compared to a culture grown with nitrogen. (C) Shows a comparison of the relative transcript levels in a culture grown with urea as nitrogen source compared to ammonia. The gray lines give 2-fold changes in either direction. Selected genes are identified by name/locus tag number.
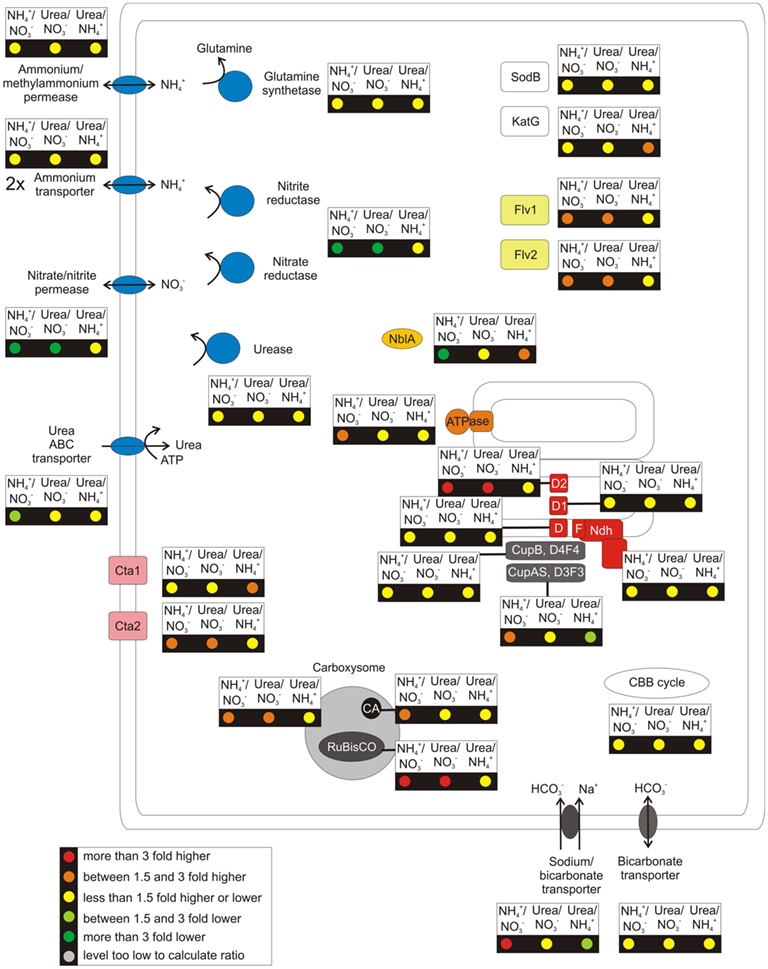
Figure 4. Overview over the regulation pattern for a selection of cellular components when the culture was grown on different nitrogen sources. This figure gives an overview of the transcription pattern in response to growth with nitrate, ammonia, and urea as nitrogen source. The changes of the relative mRNA levels are comparisons of ammonia or urea-grown cultures to a nitrate-grown culture and of a urea-grown culture compared to a culture grown with ammonia as nitrogen source. These ratios are displayed for genes coding for a selection of cellular functions, see Figure 2.
As expected, major changes in transcript levels were observed for genes involved in N-uptake and metabolism (summarized in Figure 4). When cells were grown with a reduced N-source, the transcript levels for the genes for nitrate/nitrite permease (nrtP), nitrate reductase (narB), and nitrite reductase (nirA) decreased 5- to 11-fold (see also Figures 3A,B). In contrast, transcript levels of (methyl-) ammonium transporters (SYNPCC7002_A1070, SYNPCC7002_A2754, SYNPCC7002_A2208) and a high-affinity urea transporter (urtA, urtB, urtC, urtD, urtE/SYNPCC7002_A0395-A0398, SYNPCC7002_A1627; M. Romine and M. Serres, personal communication) did not change strongly as a function of N-source (Table S3 in Supplementary Material). These results are consistent with the known preference of cyanobacteria and other organisms for reduced N-sources (Flores and Herrero, 1994). Nitrate reduction is energetically expensive, and this eight-electron process can consume up to 30% of the reducing equivalents produced by the photosynthetic light reactions (Flores et al., 1983; Ohashi et al., 2011). Using reduced N-sources allows cells to channel these valuable reducing equivalents to CO2 reduction and other reductive processes. The mRNA levels of both glutamine synthetase genes (glnA and glnN), which catalyze the fixation of ammonia by formation of glutamine from glutamate, were unaffected by changing N-sources (Figure 4); N-limitation, however, resulted in strongly increased mRNA levels of those genes (Figure 2). The transcript abundances of the genes encoding urease were nearly constant (Table S3 in Supplementary Material), which indicates that urease is constitutively present in Synechococcus 7002 cells.
Compared to nitrate-grown cells, transcript levels for the CO2 concentration and fixation mechanisms increased several-fold when a reduced N-source was provided (Figures 3 and 4). Transcripts for the rbcLS genes increased 3- to 5-fold, and the genes encoding the structural subunits of the carboxysomes and the carbonic anhydrase increased 1.5- to 4-fold, but transcript levels for genes encoding other enzymes of the CBB cycle were essentially constant. Transcripts for the inducible CO2-concentrating complex (ndhD3, ndhD4, cupA, and cupS) and the sodium-dependent bicarbonate transporter (sbtA) increased up to 3-fold in cells grown with ammonia rather than nitrate. When cells were grown with urea, however, only a slight increase in transcript level was observed for sbtA, and transcript levels for the genes encoding the inducible CO2-concentrating mechanism were essentially unchanged. When transcript levels of urea-grown cells were directly compared to levels in ammonium-grown cells, transcript levels for rbcLS, the CO2-concentrating mechanism and sbtA decreased ∼1.5- to 2.5-fold. These results indicate that cells grown with urea have a lower requirement for CO2 and bicarbonate uptake compared to cells grown with ammonium. An obvious explanation is that the CO2 produced internally during the hydrolysis of urea lessens the requirement for uptake of external CO2/bicarbonate (Mobley et al., 1995). Increased mRNA levels were also observed for ndhD2 (ca. 4-fold) and for the two genes encoding flavoproteins (1.5- to 2-fold) when cells were grown with reduced N-sources. This could be a result of excess electrons in those cells compared to a culture grown with nitrate, similar to observations described above for cells grown with limited CO2 supply.
Conclusion
Global transcription profiles of Synechococcus 7002 in this integrated study showed that this cyanobacterium has a common response to limitation for all macronutrients (C, N, S, P, Fe). Cells experiencing nutrient limitation globally reduce transcript levels for the photosynthetic apparatus (i.e., photosystems, phycobiliproteins, electron transport components, and pigments), CO2 concentration and fixation, and the protein synthesis machinery. This general strategy for acclimation to nutrient limitation is probably widely conserved among cyanobacteria (Schwarz and Forchhammer, 2005). Nutrient-specific acclimation of the Synechococcus 7002 transcriptome was also observed. In general, these responses increase the uptake machineries for the limiting nutrient in order to enhance the supply of that nutrient. The transcription data suggest that the subunit composition of the Type-I NADH dehydrogenase complex changes during nutrient limitation; this change could alter the ratio of protons translocated to the periplasm/thylakoid lumen per pair of electrons transferred from NADH to plastoquinone. Increased transcript levels for two flavoproteins under CO2-limiting conditions suggest that oxygen may be used as an alternative electron acceptor to relieve over-reduction of photosynthetic electron transport components, especially when CO2 is limiting. Transcripts for enzymes that cope with ROS/RNS and its affects were present at relatively high levels under standard growth conditions and did not increase during nutrient limitation or high-light stress. The transcription profiles for cells grown on different N-sources agreed well with observations based on previous growth studies (Kapp et al., 1975; Sakamoto et al., 1998). Reduced nitrogen sources support growth rates that are significantly faster than those for nitrate (doubling times of 2.6 versus 4 h). Synechococcus 7002 exhibited an increased demand for CO2 when grown on reduced N-sources compared to nitrate, and the demand for CO2 was higher when ammonia was supplied as N-source rather than urea, which provides CO2 upon hydrolysis.
Conflict of Interest Statement
The authors declare that the research was conducted in the absence of any commercial or financial relationships that could be construed as a potential conflict of interest.
Acknowledgments
This study was supported by the Air Force Office of Scientific Research (MURI Grant FA9550-05-1-0365). The research was further supported by the Genomic Science Program (GSP) of the U.S. Department of Energy (DOE), Office of Biological and Environmental Research (BER). This contribution originates from the GSP Foundational Scientific Focus Area (FSFA), and Biofuels Scientific Focus Area (BSFA) of the Pacific Northwest National Laboratory. We greatly acknowledge Dr. Craig Praul and Candace Price for advice and oversight of cDNA sequencing in the Genomics Core Facility (Huck Institutes for the Life Sciences, Penn State University), and Dr. Zhenfeng Liu helpful discussions concerning the data processing pipeline.
Supplementary Material
The Supplementary Material for this article can be found online at: http://www.frontiersin.org/Microbial_Physiology_and_Metabolism/10.3389/fmicb.2012.00145/abstract
References
Anderson, S. L., and McIntosh, L. (1991). Light-activated hetero-trophic growth of the cyanobacterium Synechocystis sp. strain PCC 6803: a blue-light-requiring process. J. Bacteriol. 173, 2761–2767.
Badger, M. R., and Bek, E. J. (2008). Multiple Rubisco forms in Proteobacteria: their functional significance in relation to CO2 acquisition by the CBB cycle. J. Exp. Bot. 59, 1525–1541.
Badger, M. R., and Price, G. D. (2003). CO2 concentrating mechanisms in cyanobacteria: molecular components, their diversity and evolution. J. Exp. Bot. 54, 609–622.
Baier, K., Lehmann, H., Stephan, D. P., and Lockau, W. (2004). NblA is essential for phycobilisome degradation in Anabaena sp. strain PCC 7120 but not for development of functional heterocysts. Microbiology 150, 2739–2749.
Baran, R., Bowen, B. P., Bouskill, N. J., Brodie, E. L., Yannone, S. M., and Northen, T. R. (2010). Metabolite identification in Synechococcus sp. PCC 7002 using untargeted stable isotope assisted metabolite profiling. Anal. Chem. 82, 9034–9042.
Barker-Astrom, K., Schelin, J., Gustafsson, P., Clarke, A. K., and Campbell, D. A. (2005). Chlorosis during nitrogen starvation is altered by carbon dioxide and temperature status and is mediated by the ClpP1 protease in Synechococcus elongatus. Arch. Microbiol. 183, 66–69.
Battchikova, N., Eisenhut, M., and Aro, E. M. (2010). Cyanobacterial NDH-1 complexes: novel insights and remaining puzzles. Biochim. Biophys. Acta. 1807, 935–944.
Batterton, J. C. Jr., and Van Baalen, C. (1971). Growth responses of blue-green algae to sodium chloride concentration. Arch. Mikrobiol. 76, 151–165.
Bennette, N. B., Eng, J. F., and Dismukes, G. C. (2011). An LC-MS-based chemical and analytical method for targeted metabolite quantification in the model cyanobacterium Synechococcus sp. PCC 7002. Anal. Chem. 83, 3808–3816.
Berman-Frank, I., Lundgren, P., and Falkowski, P. (2003). Nitrogen fixation and photosynthetic oxygen evolution in cyanobacteria. Res. Microbiol. 154, 157–164.
Bienert, R., Baier, K., Volkmer, R., Lockau, W., and Heinemann, U. (2006). Crystal structure of NblA from Anabaena sp. PCC 7120, a small protein playing a key role in phycobilisome degradation. J. Biol. Chem. 281, 5216–5223.
Bottomley, P. J., and van Baalen, C. (1978). Dark hexose metabolism by photoautotrophically and heterotrophically grown cells of the blue-green alga (cyanobacterium) Nostoc sp. strain Mac. J. Bacteriol. 135, 888–894.
Boussiba, S., and Richmond, A. E. (1980). C-Phycocyanin as a storage protein in the blue-green alga Spirulina platensis. Arch. Microbiol. 125, 143–147.
Campbell, E. L., Summers, M. L., Christman, H., Martin, M. E., and Meeks, J. C. (2007). Global gene expression patterns of Nostoc punctiforme in steady-state dinitrogen-grown heterocyst-containing cultures and at single time points during the differentiation of akinetes and hormogonia. J. Bacteriol. 189, 5247–5256.
Cannon, G. C., Heinhorst, S., and Kerfeld, C. A. (2010). Carboxysomal carbonic anhydrases: structure and role in microbial CO2 fixation. Biochim. Biophys. Acta 1804, 382–392.
Christman, H. D., Campbell, E. L., and Meeks, J. C. (2011). Global transcription profiles of the nitrogen stress response resulting in heterocyst or hormogonium development in Nostoc punctiforme. J. Bacteriol. 193, 6874–6886.
Collier, J. L., and Grossman, A. R. (1992). Chlorosis induced by nutrient deprivation in Synechococcus sp. strain PCC 7942: not all bleaching is the same. J. Bacteriol. 174, 4718–4726.
Collier, J. L., and Grossman, A. R. (1994). A small polypeptide triggers complete degradation of light-harvesting phycobiliproteins in nutrient-deprived cyanobacteria. EMBO J. 13, 1039–1047.
Cramer, W. A., Yan, J., Zhang, H., Kurisu, G., and Smith, J. L. (2005). Structure of the cytochrome b6 f complex: new prosthetic groups, Q-space, and the ‘hors d’oeuvres hypothesis’ for assembly of the complex. Photosyn. Res. 85, 133–143.
Efremov, R. G., and Sazanov, L. A. (2011). Respiratory complex I: ‘steam engine’ of the cell? Curr. Opin. Struct. Biol. 21, 532–540.
Ehira, S., Ohmori, M., and Sato, N. (2003). Genome-wide expression analysis of the responses to nitrogen deprivation in the heterocyst-forming cyanobacterium Anabaena sp. strain PCC 7120. DNA Res. 10, 97–113.
Eiler, A. (2006). Evidence for the ubiquity of mixotrophic bacteria in the upper ocean: implications and consequences. Appl. Environ. Microbiol. 72, 7431–7437.
Eisenberg, D., Gill, H. S., Pfluegl, G. M., and Rotstein, S. H. (2000). Structure-function relationships of glutamine synthetases. Biochim. Biophys. Acta 1477, 122–145.
Eisenhut, M., Von Wobeser, E. A., Jonas, L., Schubert, H., Ibelings, B. W., Bauwe, H., Matthijs, H. C., and Hagemann, M. (2007). Long-term response toward inorganic carbon limitation in wild type and glycolate turnover mutants of the cyanobacterium Synechocystis sp. strain PCC 6803. Plant Physiol. 144, 1946–1959.
Espie, G. S., and Kimber, M. S. (2011). Carboxysomes: cyanobacterial RubisCO comes in small packages. Photosyn. Res. 109, 7–20.
Flores, E., Guerrero, M. G., and Losada, M. (1983). Photosynthetic nature of nitrate uptake and reduction in the cyanobacterium Anacystis nidulans. Biochim. Biophys. Acta 722, 408–416.
Flores, E., and Herrero, A. (1994). “Assimilatory nitrogen metabolism and its regulation,” in The Molecular Biology of Cyanobacteria, ed. D. A. Bryant (Dordrecht: Kluwer Academic Publishers), 487–517.
Frigaard, N. U., Sakuragi, Y., and Bryant, D. A. (2004). Gene inactivation in the cyanobacterium Synechococcus sp. PCC 7002 and the green sulfur bacterium Chlorobium tepidum using in vitro-made DNA constructs and natural transformation. Methods Mol. Biol. 274, 325–340.
Fromme, P., and Grotjohann, I. (2008). Structure of photosystems I and II. Results Probl. Cell Differ. 45, 33–72.
Gill, R. T., Katsoulakis, E., Schmitt, W., Taroncher-Oldenburg, G., Misra, J., and Stephanopoulos, G. (2002). Genome-wide dynamic transcriptional profiling of the light-to-dark transition in Synechocystis sp. strain PCC 6803. J. Bacteriol. 184, 3671–3681.
Giordano, M., Norici, A., and Hell, R. (2005). Sulfur and phytoplankton: acquisition, metabolism and impact on the environment. New Phytol. 166, 371–382.
Guildford, S. J., and Hecky, R. E. (2000). Total nitrogen, total phosphorus, and nutrient limitation in lakes and oceans: is there a common relationship? Limnol. Oceanogr. 45, 1213–1223.
Hackenberg, C., Engelhardt, A., Matthijs, H. C., Wittink, F., Bauwe, H., Kaplan, A., and Hagemann, M. (2009). Photorespiratory 2-phosphoglycolate metabolism and photoreduction of O2 cooperate in high-light acclimation of Synechocystis sp. strain PCC 6803. Planta 230, 625–637.
Havaux, M., Guedeney, G., He, Q., and Grossman, A. R. (2003). Elimination of high-light-inducible polypeptides related to eukaryotic chlorophyll a/b-binding proteins results in aberrant photoacclimation in Synechocystis PCC6803. Biochim. Biophys. Acta 1557, 21–33.
He, Q., Dolganov, N., Bjorkman, O., and Grossman, A. R. (2001). The high light-inducible polypeptides in Synechocystis PCC6803. Expression and function in high light. J. Biol. Chem. 276, 306–314.
Helman, Y., Tchernov, D., Reinhold, L., Shibata, M., Ogawa, T., Schwarz, R., Ohad, I., and Kaplan, A. (2003). Genes encoding A-type flavoproteins are essential for photoreduction of O2 in cyanobacteria. Curr. Biol. 13, 230–235.
Hihara, Y., Kamei, A., Kanehisa, M., Kaplan, A., and Ikeuchi, M. (2001). DNA microarray analysis of cyanobacterial gene expression during acclimation to high light. Plant Cell 13, 793–806.
Holmer, M., and Storkholm, P. (2001). Sulphate reduction and sulphur cycling in lake sediments: a review. Freshw. Biol. 46, 431–451.
Ito, Y., and Butler, A. (2005). Structure of synechobactins, new siderophores of the marine cyanobacterium Synechococcus sp. PCC 7002. Limnol. Oceanogr. 50, 1918–1923.
Kapp, R., Stevens, S. E. Jr., and Fox, J. L. (1975). A survey of available nitrogen sources for growth of the blue-green alga, Agmenellum quadruplicatum. Arch. Microbiol. 104, 135–138.
Karradt, A., Sobanski, J., Mattow, J., Lockau, W., and Baier, K. (2008). NblA, a key protein of phycobilisome degradation, interacts with ClpC, a HSP100 chaperone partner of a cyanobacterial Clp protease. J. Biol. Chem. 283, 32394–32403.
Kertesz, M. A. (2001). Bacterial transporters for sulfate and organosulfur compounds. Res. Microbiol. 152, 279–290.
Kilian, O., Steunou, A. S., Grossman, A. R., and Bhaya, D. (2008). A novel two domain-fusion protein in cyanobacteria with similarity to the CAB/ELIP/HLIP superfamily: evolutionary implications and regulation. Mol. Plant 1, 155–166.
Kim, S. K., Kimura, S., Shinagawa, H., Nakata, A., Lee, K. S., Wanner, B. L., and Makino, K. (2000). Dual transcriptional regulation of the Escherichia coli phosphate-starvation-inducible psiE gene of the phosphate regulon by PhoB and the cyclic AMP (cAMP)-cAMP receptor protein complex. J. Bacteriol. 182, 5596–5599.
Kinney, J. N., Axen, S. D., and Kerfeld, C. A. (2011). Comparative analysis of carboxysome shell proteins. Photosyn. Res. 109, 21–32.
Kornas, A., Kuzniak, E., Slesak, I., and Miszalski, Z. (2010). The key role of the redox status in regulation of metabolism in photosynthesizing organisms. Acta Biochim. Pol. 57, 143–151.
Lambert, D. H., and Stevens, S. E. Jr. (1986). Photoheterotrophic growth of Agmenellum quadruplicatum PR-6. J. Bacteriol. 165, 654–656.
Latifi, A., Ruiz, M., and Zhang, C. C. (2009). Oxidative stress in cyanobacteria. FEMS Microbiol. Rev. 33, 258–278.
Li, H., and Durbin, R. (2009). Fast and accurate short read alignment with Burrows-Wheeler transform. Bioinformatics 25, 1754–1760.
Ludwig, M., and Bryant, D. A. (2011). Transcription profiling of the model cyanobacterium Synechococcus sp. strain PCC 7002 by NextGen (SOLiD™) sequencing of cDNA. Front. Microbiol. 2:41. doi:10.3389/fmicb.2011.00041
Malakhov, M. P., Malakhova, O. A., and Murata, N. (1999). Balanced regulation of expression of the gene for cytochrome cM and that of genes for plastocyanin and cytochrome c6 in Synechocystis. FEBS Lett. 444, 281–284.
Mobley, H. L., Island, M. D., and Hausinger, R. P. (1995). Molecular biology of microbial ureases. Microbiol. Rev. 59, 451–480.
Montane, M. H., and Kloppstech, K. (2000). The family of light-harvesting-related proteins (LHCs, ELIPs, HLIPs): was the harvesting of light their primary function? Gene 258, 1–8.
Munekage, Y., Hojo, M., Meurer, J., Endo, T., Tasaka, M., and Shikanai, T. (2002). PGR5 is involved in cyclic electron flow around photosystem I and is essential for photoprotection in Arabidopsis. Cell 110, 361–371.
Nodop, A., Pietsch, D., Hocker, R., Becker, A., Pistorius, E. K., Forchhammer, K., and Michel, K. P. (2008). Transcript profiling reveals new insights into the acclimation of the mesophilic fresh-water cyanobacterium Synechococcus elongatus PCC 7942 to iron starvation. Plant Physiol. 147, 747–763.
Nomura, C. T., Persson, S., Shen, G., Inoue-Sakamoto, K., and Bryant, D. A. (2006a). Characterization of two cytochrome oxidase operons in the marine cyanobacterium Synechococcus sp. PCC 7002: inactivation of ctaDI affects the PS I:PS II ratio. Photosyn. Res. 87, 215–228.
Nomura, C. T., Sakamoto, T., and Bryant, D. A. (2006b). Roles for heme-copper oxidases in extreme high-light and oxidative stress response in the cyanobacterium Synechococcus sp. PCC 7002. Arch. Microbiol. 185, 471–479.
Ogawa, T., and Mi, H. (2007). Cyanobacterial NADPH dehydrogenase complexes. Photosyn. Res. 93, 69–77.
Ohashi, Y., Shi, W., Takatani, N., Aichi, M., Maeda, S., Watanabe, S., Yoshikawa, H., and Omata, T. (2011). Regulation of nitrate assimilation in cyanobacteria. J. Exp. Bot. 62, 1411–1424.
Osanai, T., Imamura, S., Asayama, M., Shirai, M., Suzuki, I., Murata, N., and Tanaka, K. (2006). Nitrogen induction of sugar catabolic gene expression in Synechocystis sp. PCC 6803. DNA Res. 13, 185–195.
Ostrowski, M., Mazard, S., Tetu, S. G., Phillippy, K., Johnson, A., Palenik, B., Paulsen, I. T., and Scanlan, D. J. (2010). PtrA is required for coordinate regulation of gene expression during phosphate stress in a marine Synechococcus. ISME J. 4, 908–921.
Richaud, C., Zabulon, G., Joder, A., and Thomas, J. C. (2001). Nitrogen or sulfur starvation differentially affects phycobilisome degradation and expression of the nblA gene in Synechocystis strain PCC 6803. J. Bacteriol. 183, 2989–2994.
Rippka, R., Deruelles, J., Waterbury, J. B., Herdman, M., and Stanier, R. Y. (1979). Generic assignments, strain histories and properties of pure cultures of cyanobacteria. J. Gen. Microbiol. 111, 1.
Sakamoto, T., and Bryant, D. A. (1998). Growth at low temperature causes nitrogen limitation in the cyanobacterium Synechococcus sp. PCC 7002. Arch. Microbiol. 169, 10–19.
Sakamoto, T., and Bryant, D. A. (2001). Requirement of nickel as an essential micronutrient for the utilization of urea in the marine cyanobacterium Synechococcus sp. PCC 7002. Microbes Environ. 16, 177–184.
Sakamoto, T., Delgaizo, V. B., and Bryant, D. A. (1998). Growth on urea can trigger death and peroxidation of the cyanobacterium Synechococcus sp. strain PCC 7002. Appl. Environ. Microbiol. 64, 2361–2366.
Sato, N., Ohmori, M., Ikeuchi, M., Tashiro, K., Wolk, C. P., Kaneko, T., Okada, K., Tsuzuki, M., Ehira, S., Katoh, H., Okamoto, S., Yoshimura, H., Fujisawa, T., Kamei, A., Yoshihara, S., Narikawa, R., Hamano, T., Tabata, S., and Kuhara, S. (2004). Use of segment-based microarray in the analysis of global gene expression in response to various environmental stresses in the cyanobacterium Anabaena sp. PCC 7120. J. Gen. Appl. Microbiol. 50, 1–8.
Schwarz, D., Nodop, A., Huge, J., Purfurst, S., Forchhammer, K., Michel, K. P., Bauwe, H., Kopka, J., and Hagemann, M. (2011). Metabolic and transcriptomic phenotyping of inorganic carbon acclimation in the cyanobacterium Synechococcus elongatus PCC 7942. Plant Physiol. 155, 1640–1655.
Schwarz, R., and Forchhammer, K. (2005). Acclimation of unicellular cyanobacteria to macronutrient deficiency: emergence of a complex network of cellular responses. Microbiology 151, 2503–2514.
Scott, N. L., Xu, Y., Shen, G., Vuletich, D. A., Falzone, C. J., Li, Z., Ludwig, M., Pond, M. P., Preimesberger, M. R., Bryant, D. A., and Lecomte, J. T. (2010). Functional and structural characterization of the 2/2 hemoglobin from Synechococcus sp. PCC 7002. Biochemistry 49, 7000–7011.
Seefeldt, L. C., Hoffman, B. M., and Dean, D. R. (2009). Mechanism of Mo-dependent nitrogenase. Annu. Rev. Biochem. 78, 701–722.
Shcolnick, S., Summerfield, T. C., Reytman, L., Sherman, L. A., and Keren, N. (2009). The mechanism of iron homeostasis in the unicellular cyanobacterium Synechocystis sp. PCC 6803 and its relationship to oxidative stress. Plant Physiol 150, 2045–2056.
Shuvalov, V. A., Allakhverdiev, S. I., Sakamoto, A., Malakhov, M., and Murata, N. (2001). Optical study of cytochrome cM formation in Synechocystis. IUBMB Life 51, 93–97.
Singh, A. K., Mcintyre, L. M., and Sherman, L. A. (2003). Microarray analysis of the genome-wide response to iron deficiency and iron reconstitution in the cyanobacterium Synechocystis sp. PCC 6803. Plant Physiol. 132, 1825–1839.
Singh, A. K., and Sherman, L. A. (2000). Identification of iron-responsive, differential gene expression in the cyanobacterium Synechocystis sp. strain PCC 6803 with a customized amplification library. J. Bacteriol. 182, 3536–3543.
Steglich, C., Futschik, M. E., Lindell, D., Voss, B., Chisholm, S. W., and Hess, W. R. (2008). The challenge of regulation in a minimal photoautotroph: non-coding RNAs in Prochlorococcus. PLoS Genet. 4, e1000173. doi:10.1371/journal.pgen.1000173
Stevens, S. E., and Porter, R. D. (1980). Transformation in Agmenellum quadruplicatum. Proc. Natl. Acad. Sci. U.S.A. 77, 6052–6056.
Su, Z., Mao, F., Dam, P., Wu, H., Olman, V., Paulsen, I. T., Palenik, B., and Xu, Y. (2006). Computational inference and experimental validation of the nitrogen assimilation regulatory network in cyanobacterium Synechococcus sp. WH 8102. Nucleic Acids Res. 34, 1050–1065.
Tabita, F. R. (1994). “The biochemistry and molecular regulation of carbon dioxide metabolism in cyanobacteria,” in The Molecular Biology of Cyanobacteria, ed. D. A. Bryant (Dordrecht: Kluwer Academic Publishers), 437–467.
Takabayashi, A., Kishine, M., Asada, K., Endo, T., and Sato, F. (2005). Differential use of two cyclic electron flows around photosystem I for driving CO2-concentration mechanism in C4 photosynthesis. Proc. Natl. Acad. Sci. U.S.A. 102, 16898–16903.
Tang, K. H., Tang, Y. J., and Blankenship, R. E. (2011). Carbon metabolic pathways in phototrophic bacteria and their broader evolutionary implications. Front. Microbiol. 2:165. doi:10.3389/fmicb.2011.00165
Tetu, S. G., Brahamsha, B., Johnson, D. A., Tai, V., Phillippy, K., Palenik, B., and Paulsen, I. T. (2009). Microarray analysis of phosphate regulation in the marine cyanobacterium Synechococcus sp. WH8102. ISME J. 3, 835–849.
Thompson, A. W., Huang, K., Saito, M. A., and Chisholm, S. W. (2011). Transcriptome response of high-and low-light-adapted Prochlorococcus strains to changing iron availability. ISME J. 5, 1580–1594.
Veldhuis, M., and de Baar, H. J. W. (2005). Iron resources and oceanic nutrients: advancement of global environment simulations. J. Sea Res. 53, 1–6.
Wang, H. L., Postier, B. L., and Burnap, R. L. (2004). Alterations in global patterns of gene expression in Synechocystis sp. PCC 6803 in response to inorganic carbon limitation and the inactivation of ndhR, a LysR family regulator. J. Biol. Chem. 279, 5739–5751.
Xu, Y., Alvey, R. M., Byrne, P. O., Graham, J. E., Shen, G., and Bryant, D. A. (2011). Expression of genes in cyanobacteria: adaptation of endogenous plasmids as platforms for high-level gene expression in Synechococcus sp. PCC 7002. Methods Mol. Biol. 684, 273–293.
Yeates, T. O., Kerfeld, C. A., Heinhorst, S., Cannon, G. C., and Shively, J. M. (2008). Protein-based organelles in bacteria: carboxysomes and related microcompartments. Nat. Rev. Microbiol. 6, 681–691.
Yeremenko, N., Jeanjean, R., Prommeenate, P., Krasikov, V., Nixon, P. J., Vermaas, W. F., Havaux, M., and Matthijs, H. C. (2005). Open reading frame ssr2016 is required for antimycin A-sensitive photosystem I-driven cyclic electron flow in the cyanobacterium Synechocystis sp. PCC 6803. Plant Cell Physiol. 46, 1433–1436.
Zhang, S., and Bryant, D. A. (2011). The tricarboxylic acid cycle in cyanobacteria. Science 334, 1551–1553.
Zhang, Z., Pendse, N. D., Phillips, K. N., Cotner, J. B., and Khodursky, A. (2008). Gene expression patterns of sulfur starvation in Synechocystis sp. PCC 6803. BMC Genomics 9, 344. doi:10.1186/1471-2164-9-344
Keywords: cyanobacteria, transcription profiling, RNAseq, nitrogen source, nutrient limitation, photosynthesis
Citation: Ludwig M and Bryant DA (2012) Acclimation of the global transcriptome of the cyanobacterium Synechococcus sp. strain PCC 7002 to nutrient limitations and different nitrogen sources. Front. Microbio. 3:145. doi: 10.3389/fmicb.2012.00145
Received: 14 February 2012; Paper pending published: 02 March 2012;
Accepted: 26 March 2012; Published online: 11 April 2012.
Edited by:
Martin G. Klotz, University of North Carolina at Charlotte, USAReviewed by:
Jason Warren Cooley, University of Missouri, USAElizabeth Karr, University of Oklahoma, USA
Copyright: © 2012 Ludwig and Bryant. This is an open-access article distributed under the terms of the Creative Commons Attribution Non Commercial License, which permits non-commercial use, distribution, and reproduction in other forums, provided the original authors and source are credited.
*Correspondence: Donald A. Bryant, Department of Biochemistry and Molecular Biology, The Pennsylvania State University, University Park, 108 Althouse Laboratory, PA 16802, USA. e-mail:ZGFiMTRAcHN1LmVkdQ==