
- INRA, CNRS, Ecologie Microbienne (UMR 5557, USC 1193), Université Lyon 1, Université de Lyon, Villeurbanne, France
Genetic diversity of phylogenetic or functional markers is widely used as a proxy of microbial diversity. However, it remains unclear to what extent functional diversity (FD), gene sequence diversity and community functioning are linked. For a range of denitrifying bacteria, we analyzed the relationships between (i) the similarity of functional traits evaluated from metabolic profiles (BIOLOG plates) or from N2O accumulation patterns on different carbon sources and (ii) the similarity of phylogenetic (16S rRNA gene) or functional (nir gene) markers. We also calculated different proxies for the diversity of denitrifier community based on taxa richness, phylogenetic (16S rRNA gene) or functional similarities (based either on metabolic profiles or N2O accumulation patterns), and evaluated their performance in inferring the functioning of assembled denitrifying communities. For individual strains, the variation in the 16S rRNA gene sequence was weakly correlated with the variation in metabolic patterns (ρ = 0.35) and was not related to N2O accumulation. The latter was correlated with the similarity of nitrite reductase residues. When nir genes were analyzed separately, the similarity in amino acids coded by the nirS genes was highly correlated with the observed patterns of N2O accumulation (ρ = 0.62), whereas nirK amino acid residues were unrelated to N2O accumulation. For bacterial assemblages, phylogenetic diversity (average similarity among species in a community) and mean community dissimilarity (average distance between species) calculated using 16S rRNA gene sequences, and FD measures associated with metabolic profiles, poorly predicted the variation in the functioning of assembled communities (≤15%). In contrast, the proxies of FD based on N2O accumulation patterns performed better and explained from 23 to 42% of the variation in denitrification. Amongst those, community niche was the best metric, indicating the importance of complementarity for resources in the context of bacterial community functioning.
Introduction
As biodiversity is threatened by global changes, understanding the relationship between diversity and the functioning of ecosystems or biological communities has received increasing attention (Hooper et al., 2005). Microbial communities are key drivers of soil ecosystem processes. Yet, as 10 g of soil might contain 104–106 distinct taxa (Torsvik and Ovreas, 2002; Gans et al., 2005), a complete understanding of microbial diversity is still a challenge. Despite this overwhelming prokaryotic diversity, the potential loss of diversity at the microbial scale is also of concern. In this context, it remains unclear to what extent microbial community structure, especially when based on the 16S rRNA gene as phylogenetic marker, can be used to explain differences in ecosystem processes related to carbon and nitrogen cycles (Wertz et al., 2006; Fierer et al., 2007; Le Roux et al., 2008; Philippot et al., 2010). Overall, from a biodiversity-ecosystem functioning point of view, it remains unclear the extent to which microbial community composition can be used to predict its impact on ecosystem processes and how community composition should be characterized in this context.
Given the high degree of redundancy observed for microorganisms, changes in microbial community structure might not lead to changes microbial community function. Functional redundancy is indeed commonplace and especially for broad functions such as those associated with carbon metabolism, community composition may not influence community functioning (Wohl et al., 2004; Wertz et al., 2006). In contrast, it has been recently shown that differences in microbial community structure led to changes in mineralization rates (Strickland et al., 2009). Contradictory results have also been observed for other less broad functions, such as denitrification in soils (Cavigelli and Robertson, 2000; Wertz et al., 2006; Salles et al., 2009). This inconsistency in results might be due to differences in the methodological approaches and genes targeted to predict the effect of community structure on ecosystem functioning. For some processes, the genetic diversity of the phylogenetic marker is not related to the functional traits that influence the functioning of the ecosystem (Jones et al., 2008; Baelum et al., 2010). In that case, taxa identity might not provide enough information on whether an organism is able to carry out a given process, at what rates or under which environmental conditions. For instance, physiological studies have shown that the enzymatic activities among species from different bacterial classes might be more comparable than between species belonging to the same genus (Carlson and Ingraham, 1983) whereas very similar taxa can strongly differ from a functional point of view (Salles et al., 2009). Therefore, in order to better predict community functioning, it is crucial to understand the relationship between microbial phylogeny and physiology (Allison and Martiny, 2008).
In the context of bacteria associated with the nitrogen cycle, the congruence between taxonomic phylogenies, which are mostly based on 16S rRNA gene sequences, and the phylogenies based on functional gene sequences is process-dependent. For instance, ammonium oxidation is carried out by a relatively small number of prokaryotic taxa and experimental evidence suggests a congruence in the phylogeny of ribosomal (16S rRNA) and amo genes for both bacterial and archaeal ammonia oxidizers (Prosser and Nicol, 2008). Among denitrifiers, the enzyme nitrite reductase, which mediates the reduction of nitrite to nitric oxide, is present in all denitrifying bacterial species. Furthermore, two functionally redundant but structurally distinct nitrite reductases are found among denitrifiers: a copper (Cu-Nir) and a cytochrome cd1 (Cd-Nir) nitrite reductase, coded by the nirK and nirS genes, respectively. In contrast to nitrifiers, denitrifying bacteria are phylogenetic diverse and are distributed over 60 genera (Zumft, 1997). When comparing the phylogeny of the nir genes with the 16S rRNA gene, it was shown that only the nirS and 16S rRNA gene phylogeny was congruent, suggesting that nirK might have been mainly acquired through horizontal gene transfer (Heylen et al., 2006).
The use of either phylogenetic or functional genes has improved our knowledge about the ecology of microbial functional groups. For instance, a good congruence seems to exist between the phylogeny (at the genus level) and functional traits of bacterial nitrite oxidizers (Attard et al., 2010). In the case of denitrification, the use of functional genes might provide evidence that nirK- and nirS-harboring bacteria are ecologically distinct. For instance, a study focusing on a short-term restoration chronosequence indicated that the abundance of the major nirS populations vary similarly with time after disturbance, since sites that were restored at the same time shared higher similarities in nirS communities. Conversely, nirK populations were characterized by three independent response groups, suggesting higher sensitivity to environmental gradients (Smith and Ogram, 2008). Furthermore, it has been proposed that nirK denitrifiers respond to a range of environmental parameters, whereas denitrifiers harboring nirS are mainly driven by nitrate availability (Jones and Hallin, 2010). The ecologically distinct role of nirK and nirS communities has been also observed in the rhizosphere of grain legumes where nirK and not nirS gene transcripts could be detected (Sharma et al., 2005), and in cropping systems where changes in denitrification were related to the abundance of nirK- rather than nirS-harboring bacteria (Attard et al., 2011).
Despite our increasing knowledge about the ecological distribution of these functional groups and the mechanisms underlying community assembly, an issue that remains open is to what extent the information based on the genetic diversity of phylogenetic or functional markers reflect the diversity of traits among functional groups, and furthermore, how both these markers ultimately influence ecosystem functioning. In this study we used denitrifiers as a model group to address these relationships. We focused on denitrification because it is a function performed by taxonomically diverse species, whose activity is regulated in particular by the quality and quantity of organic compounds. Moreover, the two key functional genes coding for nitrite reductase (nirK and nirS) could provide different results due to their different functionalities and to the importance of horizontal transfer for nirK. In order to test the extent to which functional similarity (similarity of functional traits) is linked to the variation in the sequence of phylogenetic or functional marker genes, we analyzed a set of 29 denitrifying strains according to the following attributes. Genetic diversity was calculated for the phylogenetic (16S rRNA) and functional markers (nir). Additionally, functional trait diversity was determined according to the metabolic profiles of the strains by measuring their activity over a range of 95 carbon sources under denitrifying conditions and measuring their N2O accumulation patterns in presence of six different carbon sources. We then assessed to what extent the genetic similarities (16S rRNA gene or nir genes) could be used to infer the similarity in functional traits. In this context, we hypothesize that the 16S rRNA phylogenetic marker would be weakly correlated with the similarity in metabolic profiles, but not correlated with the N2O accumulation patterns. Moreover, we predict that the genetic diversity of the functional markers (nir genes) would correlate with the N2O accumulation patterns. Under this hypothesis, we also predicted that this correlation could be weaker for genes highly submitted to horizontal transfer, such as nirK.
In addition, to examine the link between bacterial diversity and denitrification, we calculated a range of diversity proxies widely used in general ecology (Heemsbergen et al., 2004; Petchey and Gaston, 2006; Cadotte et al., 2009; Petchey et al., 2009; Mouchet et al., 2010). We also determined which diversity proxies, based on taxa richness, phylogenetic (16S rRNA gene) or functional similarities (based either on metabolic profiles or N2O accumulation patterns), were more relevant for predicting the effect of bacterial diversity on denitrification. For that, we used recently published data (Salles et al., 2009) on denitrification rates for a range of assembled denitrifying bacterial communities. We hypothesize that diversity proxies that take into account functional attributes would be the best predictors of community functioning. The observed relationships between the functional traits and phylogenetic/genetic relatedness and a range of diversity proxies widely used in microbial ecology are discussed in the context of predicting the effect of bacterial diversity on community functioning.
Materials and Methods
Taxonomic Affiliation of Strains
A set of 29 denitrifying bacterial strains commonly occurring in the soil or plant rhizosphere were chosen (Table 1). The taxonomic identity of the strains was verified by amplifying 16S rRNA gene with primer set pA (5′ AGA GTT TGA TCC TGG CTC AG 3′) and pH (5′ AAG GAG GTG ATC CAG CCG CA 3′), which amplifies a fragment of approximately 1500 bp, corresponding to almost full-length gene sequence (Bruce et al., 1992). Details on the amplification procedure of the 16S rRNA gene are given as Appendix.
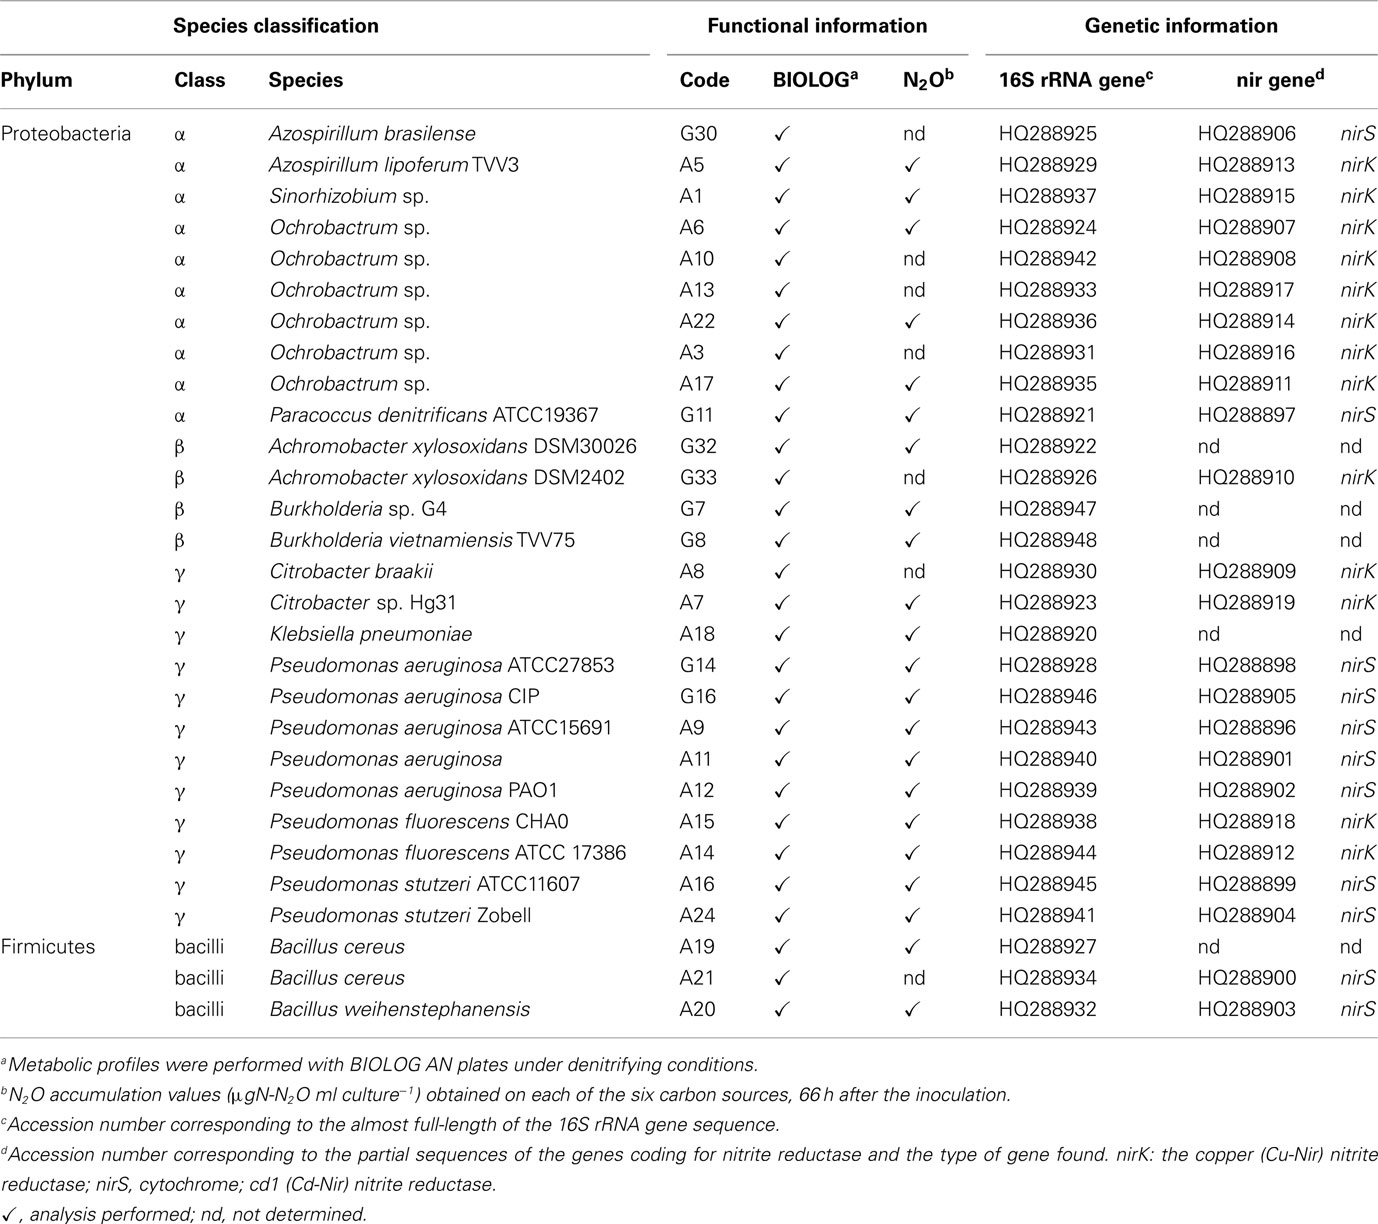
Table 1. List of the denitrifying strains used in this work, indicating which functional and genetic aspects were investigated for each one.
PCR products were purified using a PCR purification kit (Macherey Nagel, Düren, Germany) and cloned into the pGEM T-Easy vector system (Promega Ltd., Southampton, UK) and inserted in JM109 supercompetent E. coli cells (Stratagene Inc., Maidstone, UK). Clones were sequenced by LGC genomics using ABI 3730-XL Sequencer (LGC genomics, Berlin, Germany). The taxonomic affiliation of the strains was assigned by comparing the obtained sequences against public databases (Blastn, NCBI)1. The similarity between the 16S rRNA gene sequences was determined by creating a pairwise distance matrix based on the Jukes and Cantor substitution model (Ribosomal database project, release 10; Jukes and Cantor, 1969; Cole et al., 2007).
Characterization of the Nitrite Reductase Identity
Partial sequences of the genes nirK and nirS, coding for the copper (Cu-Nir) or cytochrome cd1 (Cd-Nir) nitrite reductase respectively, were amplified from the denitrifying bacterial strains. The nirK genes were amplified using the primers Copper 583F and Copper 909R (Liu et al., 2003), generating a fragment of 358 bp. A 425-bp fragment from the nirS gene was amplified by using the primers cd3aF and R3cd (Throback et al., 2004). Details on amplification procedure for nirK and nirS genes are given as Appendix. Both nirK and nirS fragments were cloned and sequenced as described above for 16S rRNA gene.
The nucleotide sequences were aligned and translated to amino acid sequences using BioEdit2. Differences among amino acid residues between pairs of nirK or nirS denitrifying bacterial strains were measured between pairs of nirK- or nirS-harboring denitrifying bacterial strains, using Gonnet matrix (Gonnet et al., 1992) implemented in the software DNASTAR (Madison, USA).
Determination of Metabolic Profiles
BIOLOG AN plates (AES Chemunex, Bruz, France) were inoculated with strains listed on Table 1. Cultures representing the pre-inoculum were grown under anaerobic conditions on NB medium containing 20 mM KNO3 for 3 days at 28°C and 200 rpm. Cells from pre-inoculum were harvested by centrifugation at 15°C for 15 min at 10,000 g, and resuspended in fresh NB medium containing 20 mM KNO3 to obtain OD560 = 0.1. These fresh cell suspensions that represented the inocula were grown for 5 h under the same conditions mentioned above. After this period, cells were harvested by centrifugation as previously described, washed twice in PBS and starved for 2 h at room temperature. The inocula were then centrifuged and resuspended in PBS containing 20 mM KNO3. Cell density was adjusted to OD560 = 0.2 and 150 μl of cell suspension was transferred to each well of BIOLOG AN plates (AES Chemunex, Bruz, France). Plates were placed in anaerobic incubation bags (Merck, Fontenay-sous-Bois, France). The atmosphere inside the bags was replaced by N2 and the bags were sealed with two anaeroclips (Merck). Anaerotest strip (Merck) was used as an indicator for the absence of O2 inside the bags. Plates were incubated at 28°C for 2 days and subsequently analyzed with a spectrophotometer (Xenius, SAFAS, Monaco) at 550 nm. The data were normalized by dividing the absorbance of each well by the total absorbance of the plate. The whole analysis was performed in duplicate, meaning that two individual colonies from each strain were used to inoculate two separate pre-inocula.
A matrix representing the metabolic profiles (relative activity values on each of the 95 carbon sources) of the denitrifying strains was used to calculate the functional trait similarity among strains. We used either Euclidean distance model or Bray Curtis similarity (square root transformed data), implemented in the software PRIMER (version 6, PRIMER-E Ltd., Plymouth, UK). Two distance measures were used to evaluate to what extend strain relatedness would be dependent on the distance applied to calculate functional trait similarity.
Quantifying N2O Production in Presence of Different Carbon Sources
N2O accumulation patterns on individual carbon sources were measured for a set of 22 bacterial strains (Table 1). Six out of the 95 carbon sources found in the BIOLOG plates were chosen, according to their ability to discriminate the selected strains (Salles et al., 2009) and their common occurrence in bulk or rhizosphere soil. Bacterial cells were inoculated in microcosms consisting of 150-ml plasma flasks sealed with rubber stoppers and containing 50 ml of minimal medium M9 (Sambrook et al., 1989) supplemented with 0.02 M KNO3 and one carbon source (1.6 mg C L−1): D-cellobiose, maltose, L-fucose, L-malic acid, L-glutamine, or fumaric acid. We replaced the atmosphere of the flasks by a 90:10 mixture of He-C2H2 to provide anaerobic conditions for denitrification and to inhibit of N2O-reductase activity, allowing us to quantify the amount of N2O produced by the bacterial strains. Flasks were incubated at 28°C and 160 rpm. The bacterial inoculum consisted of cells at the exponential growth phase, growing anaerobically on the same medium containing all six carbon sources (each source was present at 0.27 mg C L−1). Before inoculation, cells were harvested by centrifugation, washed with sterile PBS buffer and let to starvation for 2 h at room temperature on PBS. Bacteria were inoculated in the microcosms to obtain a final cell density of OD560 = 0.002.
In order to quantify N2O accumulation, the head space of the flasks was sampled 10 times during a period of 3 days (0, 11, 15, 19, 23, 37, 43, 46, 61, and 66 h after inoculation) and immediately analyzed by injecting 100 μl of collected gas directly in a gas chromatograph (P200 MicroGC, Agilent technology, Massy, France).
This experiment was carried out in duplicate. The N2O production by each individual strain was determined as microgram N-N2O per milliliter 66 h after inoculation, when all the strains had attained the lag phase. For each culture, the number of cells was measured by flow cytometry as detailed in the Section “Appendix.” A matrix containing the average N2O accumulation patterns (μgN-N2O ml culture−1) for each source and each strain was used to determine the functional similarity among strains, as previously indicated for metabolic profiles, using Euclidean distance model. We analyzed both raw data and data normalized by dividing each value by the sum of values obtained on each of the six carbon sources for a given strain.
Computation of Diversity Proxies for Bacterial Assemblages
The communities described by Salles et al. (2009) refer to a set of 16 denitrifying bacterial strains that were assembled in different levels of richness (S), varying from 1 to 8. For each richness level, community composition also varied, ranging from 24 communities with two strains, 12 communities of four strains and 8 communities with eight strains. All 16 strains were also grown in monocultures, in duplicates.
Phylogenetic diversity (PD) was calculated using similarity distances based on 16S rRNA gene sequences. Briefly, PD was calculated for each one of the bacterial communities mentioned above, by taking into account all possible pairwise combinations among strains in a given community and averaging the computed similarity distances (Jukes and Cantor substitution model). Considering that PD is dependent on species richness, we also used another diversity proxy, mean community dissimilarity (Diss) that is less affected by the number of species in a community. Thus, the 16S rRNA gene was used to calculate Diss, defined as the average distance between species (Heemsbergen et al., 2004; Jousset et al., 2011). Distances were calculated using the Maximum Composite Likelihood model, implemented in MEGA (version 5.2).
Functional diversity (FD) proxies based on physiological data were calculated using similarities obtained from metabolic profiles (BIOLOG) or N2O accumulation patterns. Two methods were applied to infer FD: one based on distance measures and another on dendrograms. For the distance-based method, we used the measure of Functional Attribute Distance (FAD; Walker et al., 1999; Mouchet et al., 2010), which represents the mean distance between species present in a community (Cadotte et al., 2009; Petchey et al., 2009). The dendrogram-based method relies on the FD measure (Petchey and Gaston, 2002) and corresponds to the total branch length from a functional dendrogram, which connects members of a given community together (Cadotte et al., 2009; Petchey et al., 2009). FAD was determined by using Euclidean distance to calculate the pairwise distance between species. FD was generated using the functions “dist(),” “hclust(),” and “Xtree()” implemented in R (version 2.13.0; Petchey and Gaston, 2002).
We also used the measure Community Niche (CN) measure (Salles et al., 2009), which is based on the performance (N2O accumulation) of individual species when they are growing on single carbon sources. Briefly, given a community of several strains growing on a mixture of n C sources, CN aggregates the best performances (here highest N2O accumulation) observed on individual C sources (Salles et al., 2009). Suppose a community composed of denitrifying species A and B, growing on a mixture of resources 1, 2, and 3. When growing on individual resources, species A has higher denitrification rate than species B for resource 1 (DA1 > DB1). For the other two resources, species B performs better (DA2 < DB2; DA3 < DB3) Thus, the CN of this two-species community represents the sum of the highest performance on each resource (CNAB = DA1 + DB2 + DB3).
Data Analysis
Principal components analyses (PCA) and redundancy analysis (RDA) based on the metabolic profiles or N2O accumulation patterns were performed with CANOCO software (version 4.52, Wageningen, The Netherlands).
The relationships between functional and (phylo)genetic similarities were tested using a non-parametric form of Mantel test (RELATE), implemented in PRIMER-E software package (version 6). The similarity matrices obtained based on metabolic profiles or N2O production patterns were compared against the matrices based on genetic information (16S rRNA gene sequence or nitrite reductase identity) using a rank correlation coefficient (here Spearman coefficient) and significance level obtained by a permutation test (5000 permutations).
Standard regressions were used to test for relationships between community functioning (N2O accumulation) and different diversity proxies. The strength, the form and significance of the relationships were assessed by regression, implemented on the SPSS software (release 16.0.2).
In order to compare strains in terms of their functional traits, we used similarity metrics based on Euclidean distance because they provide the distance between strains in a n-dimensional space (n = 95 or 6, for metabolic profiles and N2O accumulation, respectively). Since the choice of the similarity coefficient is likely to influence our results, we also computed the similarities using the Bray Curtis coefficient. Although the correlation coefficient values varied according to the similarity measure used, the overall patterns were the same and our conclusions still hold (data not shown).
Results
Metabolic Profiles
The analyses of the metabolic profiles of the 29 denitrifying bacterial strains, determined with BIOLOG plates under denitrifying conditions, showed that strains varied mainly in their ability to utilize aromatic compounds, carbohydrates, carboxylic acids, amino acids, and alcohols (Figure 1). Redundancy analyses performed with the same data set indicated that all classes of substrates had a significant effect (P < 0.006) on the metabolic profiles, except for amines (P = 0.054) and polymers (P = 0.066). In order to determine the relative contribution of each class of substrates, we used variance partitioning to control for the effect of individual classes when all other classes are defined as covariables in a constrained analysis (Leps and Smilauer, 2003). From the amount of variability explained by the ordination model when all classes are considered (63.5%), 29% could be assigned to the classes of substrates, as follows: aromatic compounds, 5.9%; carbohydrates, 5.1%; organic acids, 4.7%; amino acids, 4.2%; alcohol, 3.6%; amines, 3.1%; polymers, 2.4%, whereas the remaining variation was attributed to the variance shared between individual substrates.
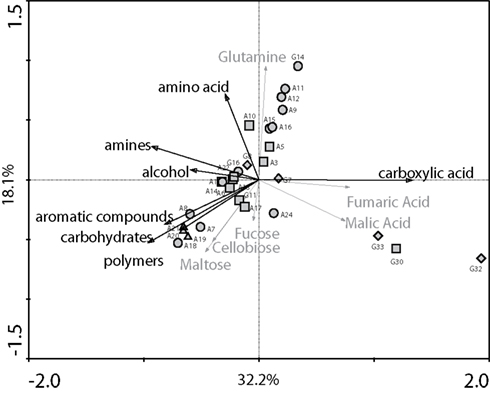
Figure 1. Principal components analysis showing the metabolic diversity of 29 denitrifying bacterial strains, as determined by metabolic profiles using BIOLOG AN plates under denitrifying conditions. For each strain, the label corresponds to the code provided in Table 1. Symbols correspond to the phylogenetic groups of bacterial strains studied. Squares: α-proteobacteria; circles: Γ-proteobacteria; diamonds: β-proteobacteria; triangles: Bacilli. Black arrows indicate the classes of carbon substrates found in the BIOLOG; gray arrows indicate the six selected individual carbons substrates used in the microcosm experiments.
When considering each phylogenetic class separately (Figure 1), the Γ-proteobacteria were functionally diverse, with representatives having very different metabolic profiles. All but two pseudomonads were able to utilize organic acid compounds. The non-pseudomonads strains differed from the other class member by their ability to use aromatic compounds, carbohydrates, and polymers and by their low metabolic activity on organic acids. The α-proteobacteria clustered closely together, except for strain G30, which showed the most divergent metabolic profiles together with two strains from the Achromobacter xylosoxidans (β-proteobacteria class). Species belonging to the genus Ochrobactrum showed a wide variety of profiles, the only widespread characteristic being their low efficiency in using organic acids. The two representatives of the genus Azospirillum were quite distinct in their metabolic profiles, varying mainly in the use of amino and organic acids. The two genera belonging to the β-proteobacteria class differed greatly among each other, mainly regarding the use of sources belonging to the carboxylic acid class. The three representatives of the Bacilli class clustered very close together and could be identified by their ability to use aromatic compounds, carbohydrates, and polymers.
N2O Accumulation Patterns
The effect of individual carbon sources on the N2O accumulation patterns by individual strains was characterized by PCA analysis. As seen on Figure 2 (top), when using normalized values, closely related strains tended to exhibit similar patterns with a number of exceptions. More specifically, P. aeruginosa strains showed similar N2O accumulation when growing on glutamine but varied in their ability to produce N2O using one of the carboxylic acids (malic acid). Similarly, the two Burkholderia species varied mainly in their response to malic acid and glutamine. The functioning of P. fluorescens and P. stutzeri strains was alike, with N2O accumulation varying mainly in relation to fucose and cellobiose, except for one strain of P. fluorescens that used glutamine. Fumaric acid and cellobiose induced the largest variation in the N2O accumulation observed between the Bacilli species. The metabolic profiles of the three Ochrobactrum strains were different, varying mainly in the use of glutamine and malic acid. In particular, these strains varied in the absolute values of N2O production (Figure 2, bottom). The majority of P. aeruginosa strains showed high N2O production. The highest N2O accumulation values were observed for one strain of Ochrobactrum and for Paracoccus denitrificans.
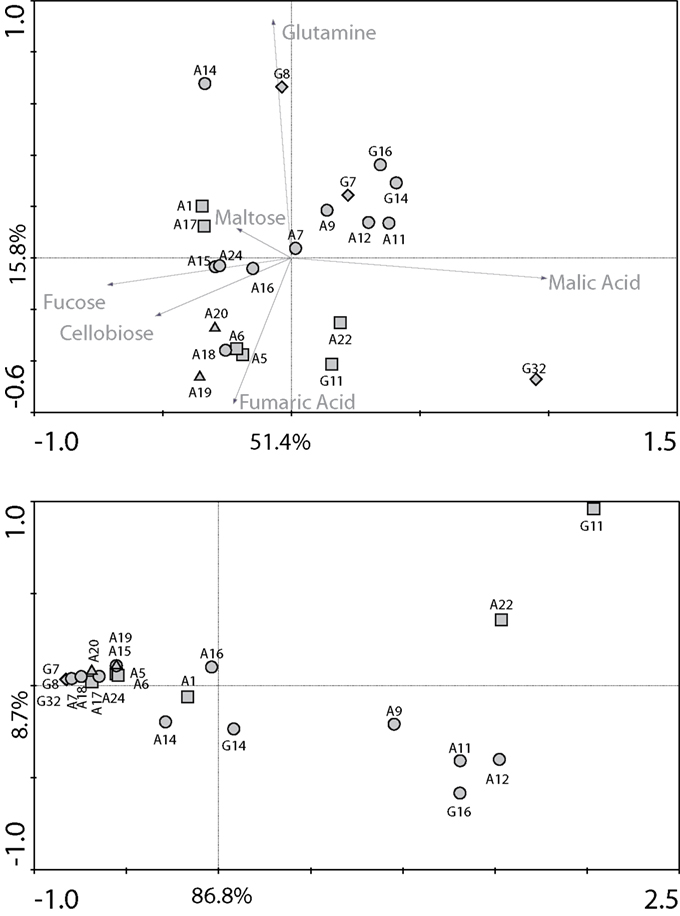
Figure 2. Principal components analyses performed on (top) normalized and (bottom) non-normalized N2O accumulation values (μgN-N2O ml culture−1) obtained for each strain on each carbon source, 66 h after the inoculation. Normalized data (for each strain, each accumulation value is divided by the sum of accumulation values observed on the six carbon sources) emphasize differences in patterns of resource use utilization whereas raw data enhance the differences in actual levels of N2O accumulation. Data were obtained from 22 denitrifying bacterial strains. Symbols as in Figure 1.
Relationship between the Similarity of Metabolic Profiles and Similarity of Patterns of N2O Accumulation and (Phylo)Genetic Relatedness
A significant correlation was observed between the metabolic profiles and phylogenetic relatedness between strains (Figure 3). The similarity of 16S rRNA gene sequence computed using the Euclidian distance model explained a significant but modest fraction of the variability observed in the metabolic profiles obtained on BIOLOG (ρ = 0.35; P = 0.002). Interestingly, when focusing on bacterial classes, higher correlations were observed between the genetic distance based on the 16S rRNA gene sequences and the percentage of the variation in metabolic profiles (ρ = 0.48, P = 0.005 and ρ = 0.71, P = 0.003 for Γ-proteobacteria and α-proteobacteria, respectively; Table 2). Considering that the metabolic profiles showed an uneven response across strains, we performed the same analysis using a matrix based on Bray Curtis coefficient instead of Euclidian distance. Although the Spearman correlation coefficients changed slightly, the conclusions were the same (all strains: ρ = 0.35, P = 0.001; Γ-proteobacteria: ρ = 0.57, P = 0.004; α-proteobacteria: ρ = 0.69, P = 0.003).
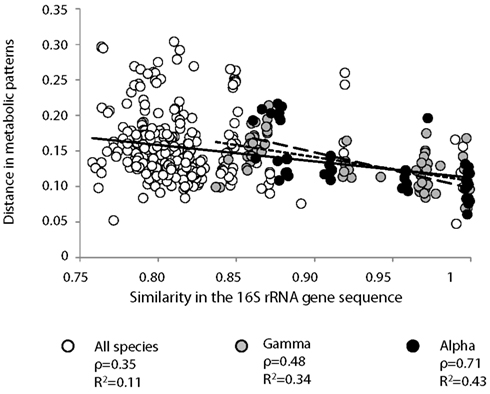
Figure 3. Pairwise comparisons of the distance in metabolic patterns and similarity between 16S rRNA gene sequence for ( ) the 29 denitrifying bacterial strains, and among denitrifying bacteria from (
 ) α- and (
 ) Γ-proteobacteria classes. Metabolic profiles were determined based on carbon utilization patterns on 95 carbon sources under denitrifying conditions (BIOLOG). Comparisons were performed using a non-parametric form of Mantel test and Spearman coefficient (ρ). Significance level was checked using a permutation test (5000 permutations). Linear regression lines are also indicated on the graph with associated r2 values. All correlations were significant (P < 0.005).
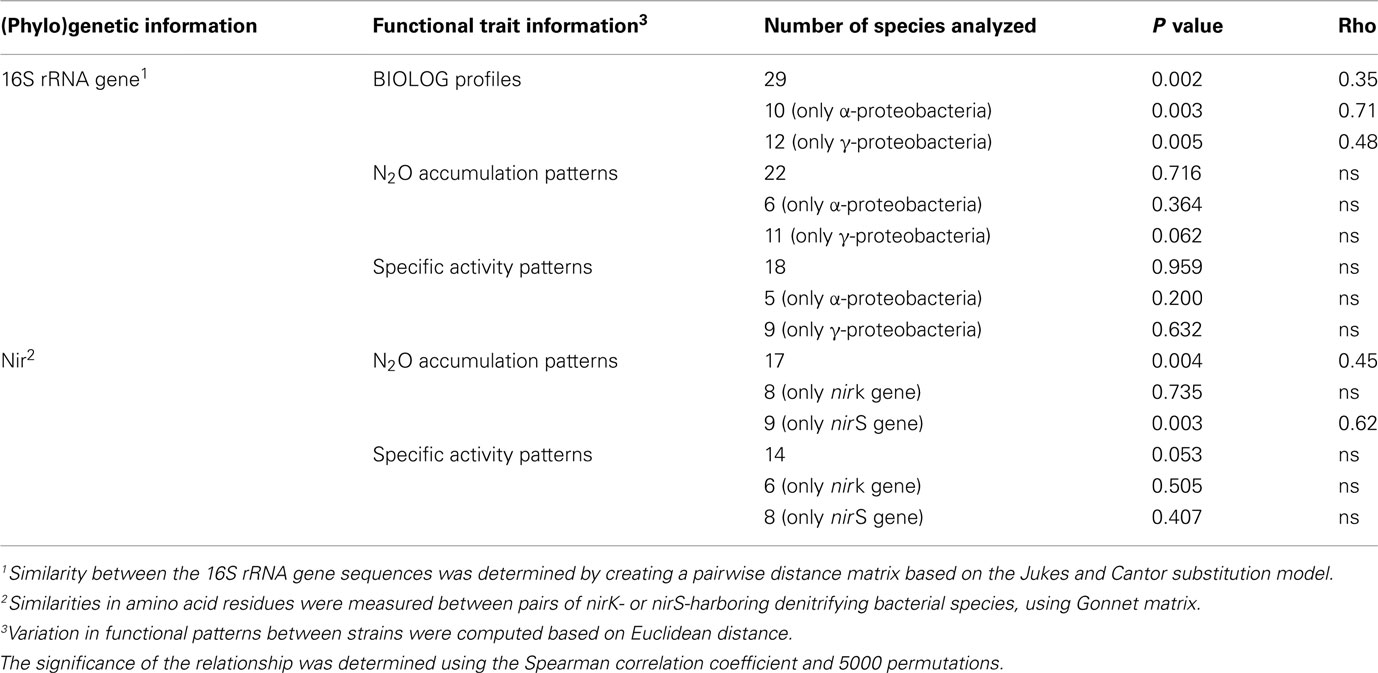
Table 2. Relationship between (phylo) genetic similarity and functional trait distances among denitrifying strains, as determined by Mantel test.
The similarity of N2O accumulation patterns among strains could not be explained by the similarity of the 16S rRNA gene, even when considering α-and Γ-proteobacterial classes separately (Figure 4A). Computing the pattern in the N2O accumulation per cell (i.e., patterns of specific activity) led to similar results, as no significant relationships were observed (Figure 4B; Table 2). In contrast, the identity of the nitrite reductase residues was significantly correlated with the patterns of N2O accumulation among all strains (ρ = 0.45, P = 0.004; Table 2; Figure 5A). When considering the identity of amino acid residues obtained from the two genes coding for nitrite reductase (nirK and nirS) separately, the similarity in amino acids coded by the nirS genes was highly correlated with the observed pattern of N2O accumulation (ρ = 0.62, P = 0.003; Table 2), whereas that associated with nirK gene was unrelated to N2O accumulation pattern (P = 0.735; Table 2; Figure 5B). The similarity of the patterns of N2O production per cell and the identity of the nitrite reductase residues was just above the significance level (P = 0.053; Table 2). However, when analyzing the nirK and nirS residues separately, no correlation was found between the patterns of N2O production per cell and the identity of each type of nir residues (PnirK = 0.505 and PnirS = 0.407; Table 2).
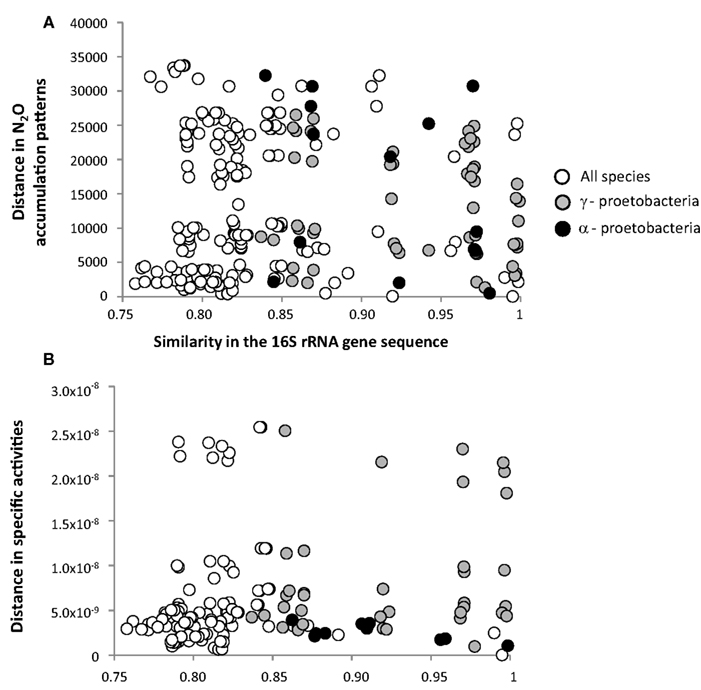
Figure 4. Pairwise comparisons of the distance between N2O accumulation patterns (A) or between specific activity patterns (B) and similarity between 16S rRNA gene sequences () among the set of 22 denitrifying bacterial strains, and among denitrifying bacteria from () α- and () Γ-proteobacteria classes. Comparisons were performed using a non-parametric form of Mantel test and Spearman coefficient (ρ). Significance level was checked using a permutation test (5000 permutations). Linear regression lines are also indicated on the graph with associated r2 values. All correlations were non-significant (see Table 2 for P values).
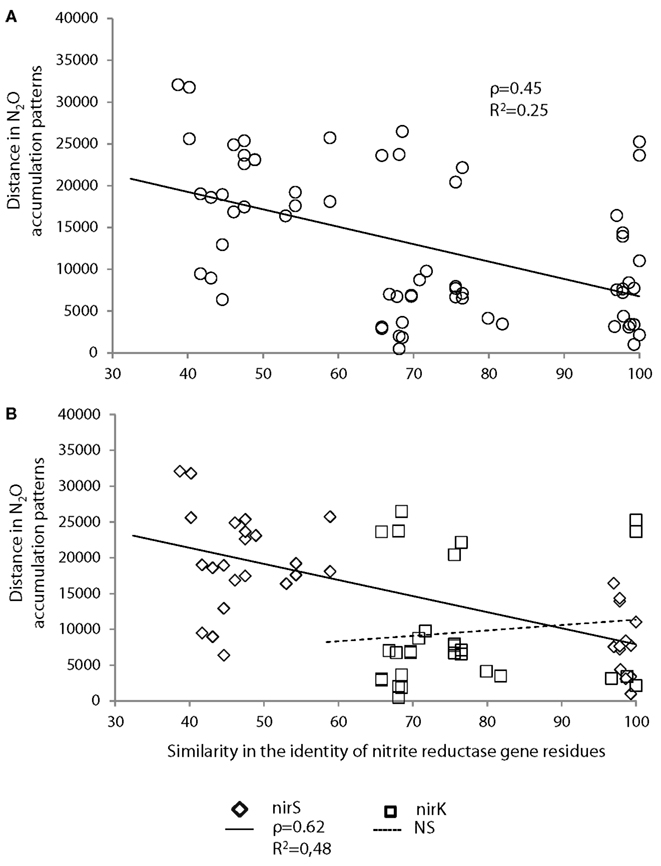
Figure 5. Pairwise comparisons of the distance between N2O accumulation patterns and the similarity in the identity of nitrite reductase residues (A) considering nirK- and nirS-harboring bacteria simultaneously or (B) distinguishing nirK- and nirS-harboring bacteria. Comparisons were performed using a non-parametric form of Mantel test and Spearman coefficient (ρ). Significance level was checked using a permutation test (5000 permutations). The correlations were significant (P = 0.004) when considering both genes simultaneously or only nirS (P = 0.003), but non-significant when considering only nirK (P = 0.735). Linear regression lines are also indicated on the graph with associated r2 values (correlations were significant except for nirK for which P = 0.690).
Relationships between Diversity Proxies and Functioning for Bacterial Assemblages
Species richness, PD and phylogenetic dissimilarity (Diss) explained similar, low percentages of variation in community functioning (from 10 to 14%; Figures 6A–C). FD measures associated with metabolic diversity either lead to non-significant relationships with community functioning (FDBIOLOG, Figure 6D) or explained a similar percentage of variation in functioning as measures associated with the phylogenetic marker (FADBIOLOG, Figure 6E). FD measures associated with N2O production both had a better explanatory power (23–26%) of the variation in community functioning than measures based on metabolic diversity or phylogenetic marker (Figures 6F,G). Amongst all the diversity proxies, the CN index, which accounts for complementary effects among strains rather than diversity per se, was the best predictor of community functioning and explained 42% of the variation in N2O production (Figure 6H).
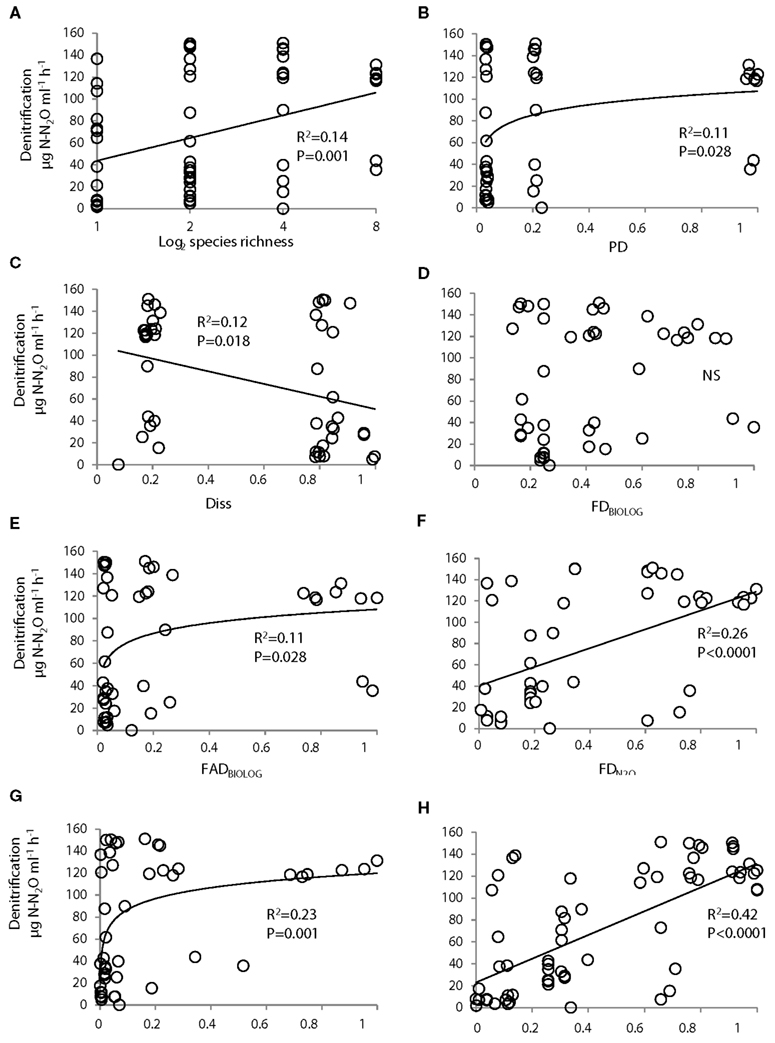
Figure 6. Relationship between denitrifier community functioning (N2O production) and indexes of community diversity. The diversity measures were based on the number of species in the community [species richness (A)]; the diversity of 16S rRNA gene sequences [phylogenetic diversity, PD (B)]; dissimilarity in 16S rRNA gene sequences [Diss (C)]; the functional diversity based on metabolic profiles [FDBIOLOG(D)]; the functional attribute diversity based on metabolic profiles [FADBIOLOG (E)]; the functional diversity based on patterns of N2O accumulation [ (F)]; the functional attribute diversity based on patterns of N2O accumulation [, (G)]; and the functional niche occupied by each community [CN (H)]. (A,H) were drawn from Salles et al. (2009). All relationships were significant, except for FDBIOLOG (D). PD, FADs, FDs, and community niche were standardized by dividing them by the maximum values observed across all communities. Diss, CN, and FD represent linear regressions; the remaining figures show a logarithmic regression. S, Species richness; PD, phylogenetic diversity; Diss, Dissimilarity; CN, Community niche; FAD, Functional Attribute diversity; FD, functional diversity
Discussion
Many studies evaluating the effects of biodiversity on ecosystem functioning have focused on species richness, despite the fact that ecosystem functioning is not governed by the phylogenetic content of its organisms but rather by the functional traits of the individuals present, the distribution and abundance of these individuals, and their biological activity (Hooper et al., 2002; Naeem and Wright, 2003; Giller et al., 2004; Salles et al., 2009). In this context, the choice of relevant functional traits for macro-organisms has been compared to the search for the holy grail (Lavorel and Garnier, 2002). When considering microorganisms, one could argue that this search for appropriate functional traits represents a more feasible task, as the functional genes coding for the well-studied functions such as denitrification are mostly known (Philippot and Hallin, 2005; Philippot et al., 2007). Defining the groups involved in each process sets a good foundation toward the quest for the functional “micro grail,” even though the sheer microbial diversity might still limit this quest. Indeed such an approach has been extensively used in microbial ecology, and the diversity within functional groups has been assessed by quantifying the genetic diversity of either phylogenetic markers such as 16S rRNA gene (e.g., Stephen et al., 1996) or functional markers such as key functional genes involved in the process of interest (e.g., Poly et al., 2008). Despite the usefulness of these approaches, the issues that remain open are (i) to what extent does the genetic variation observed for phylogenetic or functional markers correspond to the variation of functional traits within microbial groups, and (ii) what effect does this genetic variation, functional or phylogenetic, and diversity of functional traits have on community and ecosystem functioning. We have addressed these issues for a range of denitrifying bacteria using two approaches. Firstly, by looking at the relationship between the similarity of functional traits evaluated from metabolic profiles that were obtained on BIOLOG plates or from N2O accumulation patterns on different C sources, and the similarity of phylogenetic (16S rRNA gene) or functional (nir gene) markers. Secondly, we computed proxies of phylogenetic diversity and FD among denitrifying bacterial assemblages, which were then used to assess how well they could explain the functioning (denitrification) of assembled communities.
Phylogenetic Signal and Physiological Traits
The relationship between ecological and phylogenetic similarities defines the phylogenetic signal (Losos, 2008), and this notion was supported in our metabolic profile data: closely related strains were able to utilize carbon substrates in a similar fashion, whereas distantly related strains exhibited a greater variation in their metabolic resemblance. However, the strength of the phylogenetic signal to explain metabolic profiles was low, as the Mantel test exhibited a ρ = 0.35 when considering the whole set of strains. In fact, in some cases, unrelated strains shared higher similarities in their metabolic profiles (as shown by smaller Euclidean distances) than closely related ones. Similar conclusions have been recently reported for natural soil microbial communities, from which 39% of the catabolic profiles could be explained by the phylogenetic content of the communities, when considering two sites (Fierer et al., 2012). Interestingly, our findings indicate a higher consistency in terms of metabolic profiles among members of the α-proteobacteria class, which showed higher phylogenetic signal in metabolic profiles when compared to Γ-proteobacteria class. This is consistent with previous results reporting that there is an ecological coherence of bacterial groups at deeper branches of bacterial taxonomy, such as bacterial classes (Fierer et al., 2007; Philippot et al., 2010). For instance, the comparison between the metabolic plasticity of soil bacterial communities facing addition of different C compounds and their phylogeny suggests that closely related species do not always use resources in a similar manner, although some bacterial families seem to be more consistent in their carbon metabolism (Goldfarb et al., 2011). Our results are consistent with the conclusion of Cohan (2006) who stated that bacterial systematics fails to provide species labels allowing predictions about the biology of the members of a given bacterial species, given the great diversity in the metabolic capabilities of closely related strains. Actually, our results indicate that the use of phylogeny to infer bacterial community composition or diversity might not be meaningful from an ecosystem function perspective.
This conclusion is even stronger if phylogenetic traits are used to infer denitrification (here, N2O production), a process known to be weakly related to phylogeny (Philippot and Hallin, 2005, see section below). Indeed, we observed no phylogenetic signal when evaluating the patterns of N2O production, even after correcting these values for the number of cells (an indication of specific activity).
Functional Markers and N2O Production
In order to evaluate the diversity of denitrifying bacterial strains in environmental sample, most studies use the genetic diversity of sequences of key genes involved in the denitrification step of interest, rather than phylogenetic markers (Patra et al., 2005; Sharma et al., 2005; Heylen et al., 2006; Smith and Ogram, 2008; Hallin et al., 2009). In our study, the patterns of N2O accumulations (for a range of carbon sources) did not show a phylogenetic signal but were highly correlated with the identity of nitrite reductase residues. Interestingly, the patterns differed among nitrite reductase genes. The variation in the identity of the partial NirS protein was highly correlated with the variation observed for N2O accumulation profiles for nirS-harboring bacteria; in contrast, the variation observed for N2O accumulation profiles was not significantly correlated with variation in the identity of the NirK protein for nirK-harboring bacteria. It has been suggested that the nirS gene is less prone to horizontal gene transfer than nirK (Heylen et al., 2006; Jones et al., 2008), which could explain the higher congruency observed between functional gene sequence similarity and functional trait similarity for nirS-harboring bacteria. These findings have great implications for studies that use nitrite reductase genes to link community composition and denitrification rates, indicating that although the genetic diversity associated with both nirK and nirS can be used to study shifts in the composition of denitrifying communities, the changes in the genetic structure of nirK-harboring denitrifier communities are not well related to changes in functional traits relevant for denitrification.
In our study we have opted for focusing on nir genes, since those are present in all denitrifying species (Mahne and Tiedje, 1995). One could argue that our analyses were performed on partial amino acid sequences from both proteins (116 and 143 amino acid residues from NirK and NirS, respectively) and that the use of the whole protein could partly influence our results. Nevertheless, the stretch of DNA coding for nitrite reductase used here corresponds to those commonly used to study the diversity of denitrifiers (Heylen et al., 2006; Smith and Ogram, 2008; Hallin et al., 2009). Additionally, considering that other genes involved in the denitrification processes do not always explain denitrification patterns in a similar fashion as nir gene (Kandeler et al., 2006; Hallin et al., 2009) it would be interesting to determine how the identity of genes such as nar, nor, or nos, would predict denitrification rates. These comparisons might indicate the most appropriate functional marker to describe the structure of denitrifying communities. Moreover, our results show that the regulation mechanisms of targeted functions and the evolutionary history of bacterial taxa have to be accounted for to steer us towards our quest for the functional grail in microbial ecology.
Characterizing Denitrifier Diversity from a Functional Perspective
The quest to understand and predict the effects of biodiversity on ecosystem functioning has led to the development of a range of diversity measures. These have been used to quantify the extent to which the different aspects of biodiversity, such as species richness, phylogenetic distance or FD, influence ecosystem processes, and services (Petchey and Gaston, 2002; Petchey, 2004; Mouillot, 2007; Cadotte et al., 2009; Mouchet et al., 2010). Likewise, the need to predict microbial-mediated ecosystem processes has spurred on the development of a range of methodological approaches that focus on the genetic information contained on phylogenetic or functional gene markers, and also on physiological trait like metabolic patterns, substrate induced respiration, and enzyme activities, to mention a few. However, a range of proxies is rarely systematically studied, especially for a range of bacterial species that can then be examined as assembled communities. This limits our ability to infer which diversity proxies are the most useful to explain community functioning.
We tackled these issues by calculating indexes based on phylogenetic and functional diversity that are often used to predict the effect of the diversity of higher organisms on ecosystem processes (Petchey and Gaston, 2002; Petchey, 2004; Cadotte et al., 2009) for a range of denitrifying bacterial strains. Furthermore, we inferred how valuable each one of them was for predicting community functioning (denitrification), by relating these indexes to the level of community functioning reported by Salles et al. (2009) for denitrifying bacterial assemblages.
Despite the fact that diversity metrics based on phylogenetic distance or the number of species in a given community are often poorly related to community functioning in general (Hooper et al., 2005) and microbial (Salles et al., 2009) ecology, they are often used to assess microbial diversity in environmental samples. When used to predict the functioning of denitrifying bacterial assemblages, both the metrics based on phylogenetic marker (PD and Diss) and on species richness (S) performed poorly. Considering the issues discussed in the previous section, the results observed for PD were not surprising, and probably reflect the low phylogenetic signal associated with denitrification. The weak predictive power of species richness should be carefully considered, especially in experiments addressing the relationship between microbial diversity and functioning, in which species richness is often the explanatory variable considered (Bärlocher and Corkum, 2003; Setäla and McLean, 2004; Wohl et al., 2004; Bell et al., 2005; Tiunov and Scheu, 2005; Jiang, 2007).
Contrary to measures based on phylogenetic distance or species richness, measures associated with functional traits are more meaningful in the biodiversity-ecosystem functioning context, as they integrate organismal traits that directly influence a given process. We therefore determined functional diversity for two types of traits, metabolic diversity and N2O production patterns, each one quantifying a different aspect of denitrifier functionality. For both trait types, we used different metrics based on multivariate strategy, FAD and FD, and compared their ability to predict denitrification to the one of CN (Salles et al., 2009). Interestingly, the diversity measures based on metabolic diversity explained no or little variation in denitrification, whereas those based on N2O production patterns performed better. This suggests that both the choice of traits and diversity metric(s) are important to properly infer community functioning. More specifically, a diversity measure based on overall carbon metabolism (FADBIOLOG) poorly predicted denitrification, whereas applying the same diversity metric but based on N2O production patterns doubled its explanatory power, highlighting the importance of selecting for the appropriate traits. Functional Diversity metrics also differ in their explanatory power. For instance, multivariate diversity measures based on N2O production patterns explained the denitrification rates equally well, which could be partially explained by the degree of correlation between them (R = 0.63). However, their performance remained inferior to CN. This could be attributed to the fact that CN reflects the complementarity effect among strains (accounting for the performance of each strain on single carbon sources, it considers the sum of the highest performance on each individual carbon source possible for a given community) rather than diversity per se, as calculated for and Thus, the superior performance of CN as compared to the other proxies presented here supports previous evidence (Hooper et al., 2005) of the importance of complementarity for resource use among taxa in the context of bacterial community functioning.
The information retained in the phylogenetic marker might be ecologically meaningful for studies focusing on microbial community composition and distribution. However, our results confirm the often cited hypothesis that, for broad functions such as denitrification, the diversity of functional gene sequences are better predictors of functioning than the diversity of sequences of phylogenetic markers (Philippot and Hallin, 2005). Moreover, our results suggest that characterizing the genetic diversity of nir gene fragments, as is often done to analyze the relationship between the diversity and functioning of denitrifiers, might be more meaningful for nirS- than nirK-harboring communities. Further studies focusing on the whole denitrification machinery and considering full gene sequences are necessary to confirm our hypothesis. Nevertheless, we provide evidence that findings based on the relationship between nirK genetic diversity and denitrification rates should be considered with caution. More generally, our results show that when analyzing the link between the diversity and functioning of microbial communities, indexes based on the diversity of phylogenetic or functional marker genes, or on functional trait diversity, might be useful. But they might remain inferior to indexes that more explicitly reflect complementarity effects among populations rather than the diversity per se. Overall, our results spur the use of diversity indexes based on relevant functional traits and the development of diversity proxies that integrate complementarity effect.
Conflict of Interest Statement
The authors declare that the research was conducted in the absence of any commercial or financial relationships that could be construed as a potential conflict of interest.
Acknowledgments
We thank G. Mouchiroud and Michèle Weiss (UMR 5534) for use of the flow cytometer, and the graduate students who helped in the characterization of specific activities. Joana Falcão Salles was supported by a post-doctoral grant from the Institute National de la Recherche Agronomique (INRA).
Footnotes
References
Allison, S. D., and Martiny, J. B. H. (2008). Resistance, resilience, and redundancy in microbial communities. Proc. Natl. Acad. Sci. U.S.A. 105, 11512–11519.
Attard, E., Poly, F., Commeaux, C., Laurent, F., Terada, A., Smets, B. F., Recous, S., and Le Roux, X. (2010). Shifts between Nitrospira and Nitrobacter-like nitrite oxidizers underlie the response of soil potential nitrite oxidation to changes in tillage practices. Environ. Microbiol. 12, 315–326.
Attard, E., Recous, S., Chabbi, A., De Berranger, C., Guillaumaud, N., Labreuche, J., Philippot, L., Schmid, B., and Le Roux, X. (2011). Soil environmental conditions rather than denitrifier abundance and diversity drive potential denitrification after changes in land-uses. Glob. Chang. Biol. 17, 1975–1989.
Baelum, J., Jacobsen, C. S., and Holben, W. E. (2010). Comparison of 16S rRNA gene phylogeny and functional tfdA gene distribution in thirty-one different 2,4-dichlorophenoxyacetic acid and 4-chloro-2-methylphenoxyacetic acid degraders. Syst. Appl. Microbiol. 33, 67–70.
Bärlocher, F., and Corkum, M. (2003). Nutrient enrichment overwhelms diversity effects in leaf decomposition by stream fungi. Oikos 101, 247–252.
Bell, T., Newman, J. A., Silverman, B. W., Turner, S. L., and Lilley, A. K. (2005). The contribution of species richness and composition to bacterial services. Nature 436, 1157–1160.
Bruce, K. D., Hiorns, W. D., Hobman, J. L., Osborn, A. M., Strike, P., and Ritchie, D. A. (1992). Amplification of DNA from native populations of soil bacteria by using the polymerase chain reaction. Appl. Environ. Microbiol. 58, 3413–3416.
Cadotte, M. W., Cavender-Bares, J., Tilman, D., and Oakley, T. H. (2009). Using phylogenetic, functional and trait diversity to understand patterns of plant community productivity. PLoS ONE 4, e5695. doi:10.1371/journal.pone.0005695
Carlson, C. A., and Ingraham, J. L. (1983). Comparison of denitrification by Pseudomonas stutzeri, Pseudomonas aeruginosa, and Paracoccus denitrificans. Appl. Environ. Microbiol. 45, 1247–1253.
Cavigelli, M. A., and Robertson, G. P. (2000). The functional significance of denitrifier community composition in a terrestrial ecosystem. Ecology 81, 1402–1414.
Cohan, F. M. (2006). Towards a conceptual and operational union of bacterial systematics, ecology, and evolution. Philos. Trans. R. Soc. Lond. B Biol. Sci. 361, 1985–1996.
Cole, J. R., Chai, B., Farris, R. J., Wang, Q., Kulam-Syed-Mohideen, A. S., McGarrell, D. M., Bandela, A. M., Cardenas, E., Garrity, G. M., and Tiedje, J. M. (2007). The ribosomal database project (RDP-II): introducing myRDP space and quality controlled public data. Nucleic Acids Res. 35, D169–D172.
Fierer, N., Bradford, M. A., and Jackson, R. B. (2007). Toward and ecological classification of soil bacteria. Ecology 88, 1354–1364.
Fierer, N., Lauber, C., Ramirez, K. S., Zaneveld, J., Bradford, M. A., and Knight, R. (2012). Comparative metagenomic, phylogenetic and physiological analyses of soil microbial communities across nitrogen gradients. ISME J. 6, 1007–1017.
Gans, J., Wolinsky, M., and Dunbar, J. (2005). Computational improvements reveal great bacterial diversity and high metal toxicity in soil. Science 309, 1387–1390.
Giller, P. S., Hillebrand, H., Berninger, U.-G., Gessner, M. O., Hawkins, S., Inchausti, P., Inglis, C., Leslie, H., Malmqvist, B., Monaghan, M. T., Morin, P. J., and O’Mullan, G. (2004). Biodiversity effects on ecosystem functioning: emerging issues and their experimental test in aquatic environments. Oikos 104, 423–436.
Goldfarb, K. C., Karaoz, U., Hanson, C. A., Santee, C. A., Bradford, M. A., Treseder, K. K., Wallenstein, M. D., and Brodiie, E. L. (2011). Differential growth responses of soil bacterial taxa to carbon substrates of varying chemical recalcitrance. Front. Microbiol. 2:94. doi:10.3389/fmicb.2011.00094
Gonnet, G. H., Cohen, M. A., and Benner, S. A. (1992). Exhaustive matching of the entire protein sequence database. Science 256, 1443–1445.
Hallin, S., Jones, C. M., Schloter, M., and Philippot, L. (2009). Relationship between N-cycling communities and ecosystem functioning in a 50-year-old fertilization experiment. ISME J. 3, 597–605.
Heemsbergen, D. A., Berg, M. P., Verhoef, H. A., van Hal, J. R., Faber, J. H., and Loreau, M. (2004). Biodiversity effects on soil processes explained by interspecific functional dissimilarity. Science 306, 1019–1020.
Heylen, K., Gevers, D., Vanparys, B., Wittebolle, L., Geets, J., Boon, N., and De Vos, P. (2006). The incidence of nirS and nirK and their genetic heterogeneity in cultivated denitrifiers. Environ. Microbiol. 8, 2012–2021.
Hooper, D. U., Chapin, F. S. III, Ewel, J. J., Hector, A., Schmid, B., Inchausti, P., Lavorel, S., Lawton, J. H., Lodge, D. M., Loreau, M., Naeem, S., Setäla, H., Symstad, A. J., Vandermeer, J., and Wardle, D. A. (2005). Effects of biodiversity on ecosystem functioning: a consensus of current knowledge. Ecol. Monogr. 75, 3–35.
Hooper, D. U., Solan, M., Symstad, A. J., Diaz, S., Gessner, M. O., Buchmann, N., Degrange, V., Grime, P., Hulot, F., Mermillod-Blondin, F., Roy, J., Sphen, E., and van Peer, L. (2002). “Species diversity, functional diversity, and ecosystem functioning,” in Biodiversity and Ecosystem Functioning: Synthesis and Perspectives, eds M. Loreau, S. Naeem, and P. Inchausti (Oxford: Oxford University Press), 195–208.
Jiang, L. (2007). Negative selection effects suppress relationships between bacterial diversity and ecosystem fucntioning. Ecology 88, 1075–1085.
Jones, C. M., and Hallin, S. (2010). Ecological and evolutionary factors underlying global and local assembly of denitrifier communities. ISME J. 4, 633–641.
Jones, C. M., Stres, B., Rosenquist, M., and Hallin, S. (2008). Phylogenetic analysis of nitrite, nitric oxide, and nitrous oxide respiratory enzymes reveal a complex evolutionary history for denitrification. Mol. Biol. Evol. 25, 1955–1966.
Jousset, A., Schmid, B., Scheu, S., and Eisenhauer, N. (2011). Genotypic richness and dissimilarity opposingly affect ecosystem functioning. Ecol. Lett. 14, 537–545.
Jukes, T. H., and Cantor, C. R. (1969). “Evolution of protein molecules,” in Mammalian Protein Metabolism, ed. H. N. Munro (New York, NY: Academic Press), 21–132.
Kandeler, E., Deiglmayr, K., Tscherko, D., Bru, D., and Philippot, L. (2006). Abundance of narG, nirS, nirK, and nosZ genes of denitrifying bacteria during primary successions of a Glacier Foreland. Appl. Environ. Microbiol. 72, 5957–5962.
Lavorel, S., and Garnier, E. (2002). Predicting changes in community composition and ecosystem functioning from plant traits: revisiting the Holy Grail. Funct. Ecol. 16, 545–556.
Le Roux, X., Poly, F., Currey, P., Commeaux, C., Hai, B., Nicol, G. W., Prosser, J. I., Schloter, M., Attard, E., and Klumpp, K. (2008). Effects of aboveground grazing on coupling among nitrifier activity, abundance and community structure. ISME J. 2, 221–232.
Leps, J., and Smilauer, P. (2003). Multivariate Analysis of Ecologicla Data Using CANOCO. Cambridge: Cambridge University Press.
Liu, X. D., Tiquia, S. M., Holguin, G., Wu, L. Y., Nold, S. C., Devol, A. H., Luo, K., Palumbo, A. V., Tiedje, J. M., and Zhou, J. Z. (2003). Molecular diversity of denitrifying genes in continental margin sediments within the oxygen-deficient zone off the Pacific coast of Mexico. Appl. Environ. Microbiol. 69, 3549–3560.
Losos, J. B. (2008). Phylogenetic niche conservatism, phylogenetic signal and the relationship between phylogenetic relatedness and ecological similarity among species. Ecol. Lett. 11, 995–1007.
Mahne, I., and Tiedje, J. M. (1995). Criteria and methodology for identifying respiratory denitrifiers. Appl. Environ. Microbiol. 61, 1110–1115.
Mouchet, M. A., Villéger, S., Mason, N. W. H., and Mouillot, D. (2010). Functional diversity measures: an overview of their redundancy and their ability to discriminate community assembly rules. Funct. Ecol. 24, 867–876.
Mouillot, D. (2007). Niche-assembly vs. dispersal-assembly rules in coastal fish metacommunities: implications for management of biodiversity in brackish lagoons. J. Appl. Ecol. 44, 760–767.
Naeem, S., and Wright, J. P. (2003). Disentangling biodiversity effects on ecosystem functioning: deriving solutions to a seemingly insurmountable problem. Ecol. Lett. 6, 567–579.
Patra, A. K., Abbadie, L., Clays-Josserand, A., Degrange, V., Grayston, S. J., Loiseau, P., Louault, F., Mahmood, S., Nazaret, S., Philippot, L., Poly, F., Prosser, J. I., Richaume, A., and Le Roux, X. (2005). Effects of grazing on microbial functional groups involved in soils dynamics. Ecol. Monogr. 75, 65–80.
Petchey, O. L. (2004). On the statistical significance of functional diversity effects. Funct. Ecol. 18, 297–303.
Petchey, O. L., and Gaston, K. J. (2002). Functional diversity (FD), species richness and community composition. Ecol. Lett. 5, 402–411.
Petchey, O. L., and Gaston, K. J. (2006). Functional diversity: back to basics and looking forward. Ecol. Lett. 9, 741–758.
Petchey, O. L., O’Gorman, E. J., and Flynn, D. F. B. (2009). “A functional guide to functional diversity measures,” in Biodiversity, Ecosystem Functioning, and Human Wellbeing: An Ecological and Economic Perspective, eds S. Naeem, D. E. Bunker, A. Hector, M. Loreau, and C. Perrings (Great Britain: Oxford University Press), 49–59.
Philippot, L., Andersson, S. G. E., Battin, T. J., Prosser, J. I., Schimel, J. P., Whitman, W. B., and Hallin, S. (2010). The ecological coherence of high bacterial taxonomic ranks. Nat. Rev. Microbiol. 8, 523–529.
Philippot, L., and Hallin, S. (2005). Finding the missing link between diversity and activity using denitrifying bacteria as a model functional community. Curr. Opin. Microbiol. 8, 234–239.
Philippot, L., Hallin, S., and Schloter, M. (2007). Ecology of denitrifying prokaryotes in agricultural soil. Adv. Agron. 96, 249–305.
Poly, F., Wertz, S., Brothier, E., and Degrange, V. (2008). First exploration of Nitrobacter diversity in soils by a PCR cloning-sequencing approach targeting functional gene nxrA. FEMS Microbiol. Ecol. 63, 132–140.
Prosser, J. I., and Nicol, G. W. (2008). Relative contributions of archaea and bacteria to aerobic ammonia oxidation in the environment. Environ. Microbiol. 10, 2931–2941.
Sambrook, J., Fritisch, E. F., and Maniatis, T. (1989). Molecular Cloning: A Laboratory Manual. Second Edn. New York: Cold Spring Harbor Laboratory Press.
Salles, J. F., Poly, F., Schmid, B., and Le Roux, X. (2009). Community niche predicts the functioning of denitrifying bacterial assemblages. Ecology 90, 3324–3332.
Setäla, H., and McLean, M. A. (2004). Decomposition rate of organic substrates in relation to the species diversity of soil saprophytic fungi. Oecologia 139, 98–107.
Sharma, S., Aneja, M. K., Mayer, J., Munch, J. C., and Schloter, M. (2005). Diversity of transcripts of nitrite reductase genes (nirK and nirS) in rhizospheres of grain legumes. Appl. Environ. Microbiol. 71, 2001–2007.
Smith, J. M., and Ogram, A. (2008). Genetic and functional variation in denitrifier populations along a short-term restoration chronosequence. Appl. Environ. Microbiol. 74, 5615–5620.
Stephen, J. R., McCaig, A. E., Smith, Z., Prosser, J. I., and Embley, T. M. (1996). Molecular diversity of soil and marine 16S rRNA gene sequences related to beta-subgroup ammonia-oxidizing bacteria. Appl. Environ. Microbiol. 62, 4147–4154.
Strickland, M. S., Lauber, C., Fierer, N., and Bradford, M. A. (2009). Testing the functional significance of microbial community composition. Ecology 90, 441–451.
Throback, I. N., Enwall, K., Jarvis, A., and Hallin, S. (2004). Reassessing PCR primers targeting nirS, nirK and nosZ genes for community surveys of denitrifying bacteria with DGGE. FEMS Microbiol. Ecol. 49, 401–417.
Tiunov, A. V., and Scheu, S. (2005). Facilitative interactions rather than resource partitioning drive diversity-functioning relationships in laboratory fungal communities. Ecol. Lett. 8, 618–625.
Torsvik, V., and Ovreas, L. (2002). Microbial diversity and function in soil: from genes to ecosystems. Curr. Opin. Microbiol. 5, 240–245.
Walker, B., Kinzig, A., and Langridge, J. (1999). Plant attribute diversity, resilience, and ecosystem function: the nature and significance of dominant and minor species. Ecosystems 2, 95–113.
Wertz, S., Degrange, V., Prosser, J. I., Poly, F., Commeaux, C., Freitag, T., Guillaumaud, N., and Le Roux, X. (2006). Maintenance of soil functioning following erosion of microbial diversity. Environ. Microbiol. 8, 2162–2169.
Wohl, D. L., Arora, S., and Gladstone, J. R. (2004). Functional redundancy supports biodiversity and ecosystem function in a closed and constant environment. Ecology 85, 1534–1540.
Zumft, W. G. (1997). Cell biology and molecular basis of denitrification. Microbiol. Mol. Biol. Rev. 61, 533–616.
Appendix
Materials and Methods
Characterization of taxonomic affiliation of strains
In order to amplify the 16S rRNA gene, genomic DNA was isolated from the strains using the DNeasy Tissue Kit (QIAGEN, Courtaboeuf, France), following the manufacturer instructions. One microliter of genomic DNA was used as template in a 20-μl-PCR reaction containing 200 μM dNTP, 0.5 μM of each primer, 0.5 U Phusion hot start high fidelity DNA polymerase (Ozyme, St Quentin en Yvelines, France) and 1 × Phusion GC buffer (1.5 mM MgCl2). PCR program consisted of 30 s at 98°C, followed by 30 cycles at 98°C for 10 s, annealing at 68°C for 15 s, and elongation at 72°C for 45 s. Additionally, a final elongation step at 72°C for 7 min was performed.
Characterization of nitrite reductase identity
The nirK genes were amplified using the primers Copper 583F and Copper 909R (Liu et al., 2003), generating a fragment of 358 bp, in a 20-μl-PCR reaction mix containing 1 μl of genomic DNA as template, consisting of 200 μM dNTP, 0.5 μM of each primer, 0.5 U Phusion hot start high fidelity DNA polymerase (Ozyme, St Quentin en Yvelines, France) and 1 × Phusion HF buffer (1.5 mM MgCl2). An initial denaturation step of 30 s at 98°C was used, followed by 30 cycles of 98°C for 10 s, annealing at 62°C for 15 s, and elongation at 72°C for 15 s. The final elongation step was extended for 7 min at 72°C.
For nirS gene, amplification was carried out in a 50-μl-PCR reaction mix containing 1 μl of genomic DNA as template, consisting of 200 μM dNTP, 0.5 μM of each primer, 10 ng/μl of T4 gene protein (Qbiogene, Carlsbad, USA), 1.5 mM MgCl2, 1 U of Platinum Taq DNA Polymerase High Fidelity (Invitrogen, Cergy Pontoise, France) and 1 × buffer. Amplification was carried out with an initial denaturation step of 2 min at 94°C, followed by 35 cycles of 94°C for 30 s, annealing at 57°C for 60 s, and elongation at 72°C for 60 s. The final elongation step was extended for 10 min at 72°C.
Determining the cell density for denitrifying bacterial strains
In order to count the number of cells, 100 μl of the cultures were harvested immediately after collecting gas samples (see Materials and Methods). Cells were fixed by mixing with equal volume of 98% ethanol, and stored at −20°C. For counting, 15–30 μl of cells were mixed with PBS buffer containing 0.1% BSA to obtain a final volume of 300 μl. The cell suspension was sonicated for 10 s to limit cell aggregates and 6 μl of fluorescent beads (AlignFlow, Fisher Scientific, Illkirch, France) were added. The cell suspensions were then counted using a flow cytometer (BD FACSCalibur, Becton–Dickinson, San Jose, CA, USA). Two measurements were performed for each cell suspension. As mentioned in Materials and Methods, this experiment was carried out in duplicate. Cell counts were performed for 18 strains, up to 46 h after inoculation, when all the strains were in exponential phase.
Keywords: biodiversity proxies, carbon sources, denitrification, functional traits, phylogenetic diversity
Citation: Salles JF, Le Roux X and Poly F (2012) Relating phylogenetic and functional diversity among denitrifiers and quantifying their capacity to predict community functioning. Front. Microbio. 3:209. doi: 10.3389/fmicb.2012.00209
Received: 28 February 2012; Accepted: 22 May 2012;
Published online: 12 June 2012.
Edited by:
Diana Reid Nemergut, University of Colorado, Boulder, USAReviewed by:
Matthew Wallenstein, Colorado State University, USAJonathan Winston Leff, University of Colorado at Boulder, USA
Copyright: © 2012 Salles, Roux and Poly. This is an open-access article distributed under the terms of the Creative Commons Attribution Non Commercial License, which permits non-commercial use, distribution, and reproduction in other forums, provided the original authors and source are credited.
*Correspondence: Joana Falcão Salles, Department of Microbial Ecology, Centre for Life Sciences, University of Groningen, P.O. Box 11103, 9700 CC Groningen, Netherland. e-mail:ai5mYWxjYW8uc2FsbGVzQHJ1Zy5ubA==