 Julia Hillung1

- 1 Instituto de Biología Molecular y Celular de Plantas, Consejo Superior de Investigaciones Científicas-Universidad Politécnica de Valencia, Valencia, Spain
- 2 The Santa Fe Institute, Santa Fe, NM, USA
The use of high-throughput transcript profiling techniques has opened the possibility of identifying, in a single experiment, multiple host mRNAs whose levels of accumulation are altered in response to virus infection. Several studies have used this approach to analyze the response of Arabidopsis thaliana to the infection by different RNA and DNA viruses. However, the possible differences in response of genetically heterogeneous ecotypes of the plant to the same virus have never been addressed before. Here we have used a strain of Tobacco etch potyvirus (TEV) experimentally adapted to A. thaliana ecotype Ler-0 and a set of seven plant ecotypes to tackle this question. Each ecotype was inoculated with the same amount of the virus and the outcome of infection characterized phenotypically (i.e., virus infectivity, accumulation, and symptoms development). Using commercial microarrays containing probes for more than 43,000 A. thaliana transcripts, we explored the effect of viral infection on the plant transcriptome. In general, we found that ecotypes differ in the way they perceive and respond to the virus. Some ecotypes developed strong symptoms and accumulated large amounts of viral genomes, while others only developed mild symptoms and accumulated less virus. At the transcriptomic level, ecotypes could be classified into two groups according to the particular genes whose expression was altered upon infection. Moreover, a functional enrichment analyses showed that the two groups differed in the nature of the altered biological processes. For the group constituted by ecotypes developing milder symptoms and allowing for lower virus accumulation, genes involved in abiotic stresses and in the construction of new tissues tend to be up-regulated. For those ecotypes in which infection was more severe and productive, defense genes tend to be up-regulated, deviating the necessary resources from building new tissues.
Introduction
Plant viruses are obligate intracellular parasites that typically alter host physiology, diverting metabolites from their normal uses and directing them toward the production of virus-specific components. To do so, viral constituents (both nucleic acids and encoded proteins) must establish multiple and complex interactions among them and with a myriad of host factors (Whitham and Wang, 2004; Bailer and Haas, 2009). As a response to viral infection, cells may compensate by over- or down-regulating certain metabolic pathways, including specific and general antiviral responses [e.g., cytokines, systemic-acquired resistance (SAR), or the RNA silencing pathway]. In the case of plant viruses, in the absence of a hypersensitive response (i.e., apoptotic cell death), those cells that have supported viral replication do not die but accumulate large amounts of viral particles while the infection spreads out through the plasmodesmata to neighboring cells until reaching the vascular system and colonizing distant susceptible tissues. The outcome of all these interactions may either be the plant controlling the spread of viral infection or the virus overcoming the defenses and establishing a productive infection that may or may not be associated with the development of symptoms (Whitham et al., 2006; Dodds and Rathjen, 2010). Actually, this outcome varies widely even for a given pair plant-virus species and depends on the particular plant and virus genotypes, and of course, on environmental variables.
Historically, much effort has gone into identifying individual cellular traits whose patterns of expression change as a direct or indirect consequence of viral infection (Carrington and Whitham, 1998; Maule et al., 2002). With the advent of microarray technologies for high-throughput gene expression profiling, it is feasible to comprehensively examine gene expression networks during plant defense response triggered by infection with viral pathogens (Rowland and Jones, 2001; Whitham et al., 2003, 2006; Wise et al., 2007). Although some studies have analyzed changes in global mRNA profiling resulting from virus infection of natural hosts, Arabidopsis thaliana has been the main model host used in combination with viruses from different taxonomic families (reviewed by Elena et al., 2011), regardless of whether this plant was a natural host for them. Direct comparisons across experiments are not straightforward because differences in profiling techniques and platforms, plant ecotypes, sampling schemes, inoculation conditions, and dosages, growth environmental variables, and statistical normalization methods may all exert unpredictable effects on the expression pattern of multiple genes. Nonetheless, some genes are pervasively altered upon infection with different viruses, including transcription factors, heat-shock proteins, and antioxidants, defense-regulated genes, phytohormone biosynthesis, and signaling, a variety of kinases and phosphatases, many different metabolic enzymes, proteases and other genes involved in protein turnover, and genes relevant for chloroplast functions (Whitham et al., 2003, 2006; Elena et al., 2011). Another remarkable coincidence among viruses is that, in general, genes whose expression is altered after viral infection tend to be highly connected and central in the transcriptional regulatory and protein–protein interaction networks of the plant (Elena et al., 2011; Rodrigo et al., 2012), suggesting viruses may preferentially manipulate central hub genes.
Gan et al. (2011) found extensive genomic, proteomic, and transcriptomic differences among A. thaliana ecotypes. Not surprisingly, at the level of gene expression, ecotypes differed in their response to biotic and abiotic factors, including defenses against pathogens and herbivores. The genetic determinants of A. thaliana susceptibility to viral infection have been thoroughly studied, even before the omics era (Carr and Whitham, 2007). One of such resistance systems is the Restricted TEV Movement (RTM) multigenic complex composed of the RTM1 (At1g05760), RTM2(At5g04890), and RTM3(At3g58350) loci (Mahajan et al., 1998; Whitham et al., 1999, 2000; Chisholm et al., 2000, 2001). The presence of dominant alleles in all three loci is necessary for blocking TEV systemic movement, while homozygous recessive mutations at any of the three loci result in systemic infection (Chisholm et al., 2000, 2001). RTM1 encodes a jacalin-like lectin protein with sequence similarities to several myrosinase-binding proteins involved in the defense response (Chisholm et al., 2000). RTM2 encodes a protein whose N-terminal region is similar to plant small heat-shock proteins, whereas the C-terminal region has a transmembrane domain (Whitham et al., 2000). Finally, RTM3 encodes a protein with a meprin and TRAF homology (MATH) domain in its N-terminal region and a coiled-coil domain at its C-terminal end (Cosson et al., 2010a). RTM1 and RTM3 proteins form a multimeric complex (Cosson et al., 2010b). The mechanisms by which these proteins restrict TEV long-distance movement are yet unclear, although they may cooperate in preventing TEV entry into, transport through or exit from the phloem. A. thaliana ecotypes vary in their susceptibility to TEV infection (Mahajan et al., 1998). While some ecotypes allow long-distance movement of the virus from inoculated rosette leaves to non-inoculated inflorescence tissues, many ecotypes support replication in inoculated leaves but do not allow systemic movement (Mahajan et al., 1998). This susceptibility of certain ecotypes was due to mutations at any of the three RTM loci (Whitham et al., 1999).
To test the hypothesis that virus adaptation to a new host is concomitant to changes in the host’s gene expression profile, Agudelo-Romero et al. (2008b) performed an evolution experiment in which TEV was adapted to the susceptible ecotype Ler-0 (rtm1/rtm1 RTM2/RTM2 RTM3/RTM3). The ancestral TEV was able of systemically infect Ler-0 plants, although the infection progressed asymptomatically. After 17 serial undiluted passages, the resulting virus (denoted as TEV-At17) had fixed six point mutations, improved its accumulation by three logs and induced visible and more severe symptoms, including stunting, etching, and leaf malformation. The set of up- and down-regulated genes upon infection with TEV-At17 was almost three times larger than those altered by the ancestral TEV (Agudelo-Romero et al., 2008a). An analysis of the enriched biological processes whose expression was altered revealed that almost all processes down-regulated by TEV were also down-regulated by TEV-At17, which in addition suppressed additional developmental and metabolic processes. Functions up-regulated by both viruses were related to plant responses to different abiotic and biotic stresses, although genes related to innate immune responses and response to infection were less common for TEV-At17 than for the ancestral virus. This observation led Agudelo-Romero et al. (2008b) to hypothesize that the virus increased its fitness by acquiring the ability to block the activation of plant defenses. Both viruses also differentially affected the expression of master transcription factors and highly connected proteins, although the evolved virus regulates more central and highly connected elements (Rodrigo et al., 2012). These results supported the hypothesis that by adapting to a new host, viruses should change and improve the way they interact with the components of the host cell regulatory network. More recently, Lalic et al. (2010) have shown that TEV-At17 was also able of systemically colonize some ecotypes that were resistant to the ancestral TEV virus (i.e., had wild-type alleles at the three RTMloci). Furthermore, the infectivity, accumulation, and severity of symptoms also varied among ecotypes (Lalic et al., 2010). These three traits were correlated: those ecotypes in which accumulation was larger were also more susceptible and showed stronger symptoms (Lalic et al., 2010).
Following up on Lalic et al. (2010) work, here we sought to determine whether the observed differences among ecotypes in susceptibility to TEV-At17, virus accumulation, and severity of symptoms might also find a parallelism at the level of transcriptomic profile. In other words, we want to explore whether more productive and more severe infections also show stronger alterations in the transcriptomic profile than milder and less productive infections. For this, we have infected A. thaliana ecotypes Col-0, Di-2, Ei-2 (rtm1/rtm1), Ler-0 (rtm1/rtm1), Oy-0, St-0 (rtm3/rtm3), and Wt-1 with isolate TEV-At17b. Twenty-one days post-inoculation (dpi), we compared the transcriptome of infected and mock-inoculated plants from the same ecotype using Agilent microarrays. We found that some gene categories involved in response to TEV-At17b infection were ecotype-specific, whereas others were shared by different ecotypes. We could classify the six ecotypes into two groups according to the lists of altered genes in common. These common factors could be responsible for the differential efficiency of TEV in infecting and propagating in each ecotype. The two groups of ecotypes also differed in the nature of the up- and down-regulated biological processes.
Materials and Methods
Starting Viral Population
A. thaliana ecotype Ler-0 frozen infected material from passage 16 of the experimental evolution protocol (Agudelo-Romero et al., 2008b) was used to prepare a sap. Fifty 21-days-old plants of A. thaliana Ler-0were rub-inoculated (two leaves per plant) with 4 μL of sap containing 10% Carborundum. Plants were maintained in a BSL-2 greenhouse at 16:8 h light:dark and 24:20°C day:night temperature until sample collection on 21 dpi. Plants showing symptoms were collected, inoculated leaves were removed and the rest was ground into fine powder, split into aliquots and stored at −80°C. The infection was confirmed by RT-PCR as described in Lalic et al. (2010). The consensus sequence for the whole genome of the viral population was obtained as previously described (Agudelo-Romero et al., 2008b). The sequences were analyzed with DNASTAR software. The resulting genomic sequence was identical to the one previously described for TEV-At17 (Agudelo-Romero et al., 2008b) with the only difference of an additional non-synonymous mutation G6816A (M2224I) in the NIa-Pro cistron. Therefore, we named this new isolate as TEV-At17b.
Inoculation of A. thaliana Ecotypes
In order to inoculate each of the seven A. thaliana ecotypes (Col-0, Di-2, Ei-2, Ler-0, Oy-0, St-0, andWt-1), 2.5 g of the previously obtained viral stock was suspended in 5 mL of buffer C (50 mM borate acid, pH 8.0, 5 mM EDTA). This sap, mixed with 10% Carborundum, was used to rub-inoculate two leaves (4 μL per leaf) from each of the 50 plants for the seven ecotypes. Plants were maintained in the conditions described above and harvested 21 dpi, ground in mortar with liquid nitrogen and stored at −80°C. Successful infections were confirmed by RT-PCR (Lalic et al., 2010). Plants were inoculated at growth stages between 3.5 and 3.7 in the Boyes et al. (2001) scale.
RNA Purification and Viral Load Quantification
RNA extraction from 100 mg tissue per plant was performed using RN easy Plant Mini kit (Qiagen) following manufacturer’s instructions. The concentration of total plant RNA extracts was adjusted to 50 ng/μL for each sample and the quantification of viral load was done with real time RT-PCR (RT-qPCR), using primers and methods previously described (Lalic et al., 2010) with some minor modifications. Amplifications were done using the ABI PRISM Sequence Analyzer 7500 (Applied Biosystems), according to the following profile: 5 min at 42°C, 10 s at 95°C following 40 cycles of 5 s at 95°C and 34 s at 60°C. RT-qPCR reactions were performed in triplicate, for each sample. Quantification results were further examined using SDS7500 software v.1.2.3 (Applied Biosystems).
RNA Extraction, RNA Labeling and Microarray Hybridization
At least three biological replicates for each infected sample category and four technical replicates of mock-inoculated plant were used for this study. Total RNA was extracted from homogenized tissue of control and infected plants using the RNeasy Plant Mini kit (Qiagen) and following manufacturer’s protocol. RNA integrity was verified in an Agilent 2100 Bioanalyzer (Agilent Technologies). RNA samples for Bioanalyzer were prepared using RNA 6000 Nano Assay Kit (Agilent Technologies) following manufacturer’s instructions.
Five hundred nanogram of spectrophotometrically quantified RNA (Nanodrop ND1000, Thermo scientific) were used in amplification and labeling reaction with the Quick Amp Labeling Kit One-Color (Agilent Technologies) following manufacturer’s instructions. All samples were amplified and labeled with Cy3 and subsequently verified in a 2100 Bioanalyzer as previously described.
As positive control of amplifying, labeling, and hybridization, synthetic RNA Spikes were added to the samples. The Spike solution was diluted and prepared following manufacturer’s protocol (RNA Spike-In Kit, One-Color, Agilent Technologies). Labeled RNA was used to hybridize the microarray 4 × 44 K slides carrying A. thaliana Col-0 probes (Agilent Technologies) as described at the standard hybridization protocol from Gene Expression Hybridization Kit (Agilent Technologies). After hybridization and wash, slides were scanned at 532 nm with a GenePix 4000B scanner (Axon Molecular Devices), at 10 μm resolution and 100% laser power. Photomultiplier tube voltages were adjusted to equal the overall signal intensity for each channel, to increase signal-to-noise ratio, and to reduce the number of spots with saturated pixels. Spot intensities were quantified using GenePix Pro 4.1 software (Axon Molecular Devices).
Microarray data were deposited at NCBI GEO under accession GSE37269.
Microarray Data Analysis
Microarray data were simultaneously normalized with software BABELOMICS 4.21 as follows. Measurements from all microarrays were rescaled into a unique final distribution to get data from different samples calibrated one to each other. The expression levels of all probes matching each gene were averaged, reflecting the expression of the gene. Control spots designed for quality checking, background signal, and cross hybridization estimations were eventually removed from the normalized data. For each ecotype of A. thaliana, differential expression analyses with the normalized data were performed using the LIMMA utility in BABELOMICS. Then, gene ontology (GO) analyses were performed using the FatiGO utility of BABELOMICS. The list of significantly up- or down-regulated genes was compared with the whole genome list.
To analyze the overlap in the lists of genes with altered expression among ecotypes, we calculated similarity matrixes between lists of genes for all pairwise comparisons of ecotypes. The (i, j) element of this matrix was computed according to Sij = 2nij/(ni + nj), where ni and nj are the genes found in ecotypes i and j and nij the number of genes shared between these two ecotypes. This similarity matrix was then used to construct a neighbor-joining dendrogram using PHYLIP v3.692. These analyses were performed separately for up- and down-regulated genes.
All other statistical analyses were done using IBM SPSS version 19.
Results and Discussion
Viral Load and Infectivity of TEV-At17b Across Ecotypes
Strain TEV-At17b was used to inoculate 50 plants of seven different ecotypes of A. thaliana. The ecotypes were selected according to their differences in susceptibility to TEV-At17 infection as described in Lalic et al. (2010). TEV-At17b induced visible symptoms in the ecotype in which it was evolved, Ler-0, including stunting, etching, and leaf malformation (Agudelo-Romero et al., 2008b; Figure S1 in Supplementary Material). The symptoms induced by TEV-At17b strongly differed among ecotypes, ranging from mild (Col-0, Di-2, and Oy-0) and moderate (Ler-0 and St-0) to a very severe syndrome (Ei-2 or Wt-1; Lalic et al., 2010; Figure S1 in Supplementary Material).
Next, we sought to evaluate the infectivity of TEV-At17b on each ecotype. To do so, we inoculated 54 plants of each ecotype with equal amounts of viral genomes (previously estimated by RT-qPCR). Twenty-one dots per inch, infections were confirmed by visual inspection of symptoms. In those plants showing no symptoms at all or very mild symptoms, the infection status was confirmed by RT-PCR. Infectivity was then estimated as the fraction of infected plants using the Laplace’s point estimator for the Binomial frequency parameter. For small sample sizes, this method provides more robust estimates than the most commonly used maximum likelihood estimator (Chew, 1971). Binomial 95% confidence intervals were also computed. Figure 1A shows the infectivity data. In all ecotypes, TEV-At17b infectivity was significantly greater than zero, being the lowest in Col-0 and the highest in Ei-2 and Wt-1. Indeed, infectivity significantly varied among ecotypes (χ2 = 226.815, 6 d.f., P < 0.001) and a Tukey post hoc test found that ecotypes could be classified into two disjoint groups (P ≥ 0.058). The first group formed by Col-0 and Oy-0, with infectivities ≤35.71%, and all other five ecotypes classified as a single group with infectivities ≥96.43%.
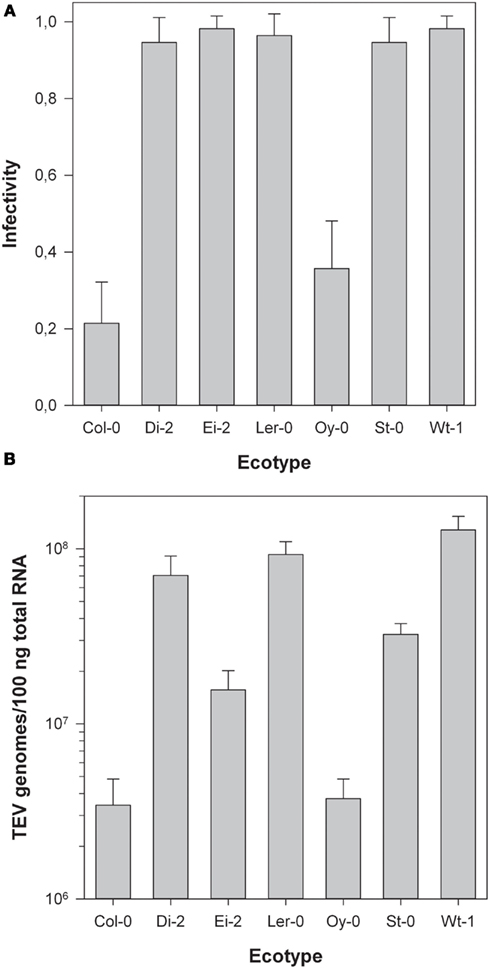
Figure 1. (A) Infectivity of TEV-At17b on each ecotype. Error bars represent 95% confidence intervals. The infection was determined by symptoms and confirmed by RT-PCR in plants showing no or mild symptoms. (B) Log viral load of TEV-At17b on each ecotype expressed as the content of viral RNA in total RNA extracted from homogeneous sap was determined by RT-qPCR. Error bars represent ±1 SEM.
Figure 1B illustrates the variation in viral load among ecotypes 21 dpi. Even after being log transformed, data violated the assumption of homoscedasticity (Levene’s test, F6,51 = 6.456, P < 0.001) and thus Kruskal–Wallis non-parametric ANOVA was used to evaluate the differences among groups. This test found a highly significant difference (χ2 = 44.113, 6 d.f., P < 0.001) driven by the existence of two non-overlapping groups (Tukey test, P ≥ 0.171). The first group was formed by Col-0 and Oy-0, ecotypes in which TEV-At17b reached the lowest accumulation (average viral load = 7.261 × 10⁵ genomes/100 ng total RNA). The second group was constituted by the five ecotypes wherein the virus reached higher accumulations (average viral load = 4.742 × 10⁷ genomes/100 ng total RNA; 65-fold compared to the first group).
All these results reproduce those previously reported by Lalic et al. (2010). Therefore, we refer the interested readers to that paper for an in depth discussion of these data. Here, we would only like to emphasize that ecotypes can be classified into two groups according to the susceptibility to and the accumulation of TEV-At17b: Col-0 and Oy-0 are less susceptible and allow for lower accumulation levels whereas the other five ecotypes are highly susceptible to infection and the virus accumulates to very high levels. An unfortunate consequence of the low infectivity and accumulation of TEV-At17b in Col-0 was our failure to collect useful infected plant material from this ecotype for its transcriptomic characterization. Therefore, in the following sections, only the remaining six ecotypes were used.
Similarities and Differences Inpatterns of Gene Expression among Infected Ecotypes
In the previous section we described differences in virus fitness traits across A. thaliana ecotypes. Next we explored whether these differences in TEV-At17b infectivity and accumulation had a correlate at the transcriptomic level. A. thaliana Col-0 4 × 44 K one-color microarray slides (Agilent Technologies) representing almost all plant genes were used in this study. Five biological replicates, infected with TEV-At17b, for ecotypes Di-2, Ei-2, Ler-0, St-0, and Wt-1, and three for Oy-0 were analyzed. As negative controls, we used four replicates of mock-inoculated plants from each ecotype.
After normalization and statistical analysis of microarray data, we identified genes with altered expression in TEV-At17b-infected plants compared to mock-inoculated plants. Table 1 shows the number of genes with significant up- and down-regulation. The complete list of altered genes can be found in Table S1 in Supplementary Material. All ecotypes, except Oy-0, had a large number of differentially expressed genes in response to TEV-At17b infection, ranging from 4041 for Ei-2 to 7184 for Wt-1. By contrast, only 40 genes had significantly altered expression for Oy-0. Indeed, a significant correlation exist between the number of altered genes and viral load (Spearman’s rS = 0.943, 4 d.f., P = 0.005), supporting the hypothesis that the more intense viral replication (and thus accumulation), the more perturbation to the cellular metabolism and thus, the more genes are suffering alterations in their expression levels. It is worth noting that the correlation remains significant even after removing Oy-0 data (rS = 0.900, 3 d.f., P = 0.037), thus precluding the possibility that the observed correlation was entirely driven by the large difference existing between accumulation in Oy-0 and the rest of ecotypes.
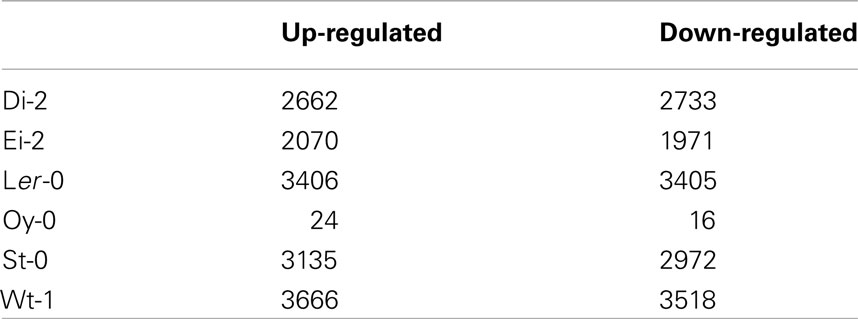
Table 1. Number of differentially expressed genes upon infection with TEV-At17b.
Readers interested in the detailed lists of differentially expressed genes for each ecotype are referred to Table S1 in Supplementary Material. A thoughtful analysis of the effect of infection of TEV-At17 on Ler-0 can be found in Agudelo-Romero et al. (2008a), and for the purpose of comparison, an analysis of the effect of the ancestral TEV strain on the same ecotype can be found in Agudelo-Romero et al. (2008b). Here we are mainly interested in comparing the effect of TEV-At17b infection across ecotypes. To do so, we compared the lists of altered genes, separately for up- and down-regulated genes, in a pairwise manner and computed a similarity index among pairs of lists. The lists of shared genes can be consulted in Table S1 in Supplementary Material. The resulting similarity matrixes were used to construct neighbor-joining dendrograms that classify ecotypes according to the similarity of their responses to TEV-At17b infection. Figure 2 shows these two dendrograms, with nearly identical topologies. The dendrograms support the existence of two clearly separated responses to TEV-At17b. The first group is formed by ecotypes Di-2, Ler-0, and St-0. Interestingly, Ler-0 and St-0 were susceptible to the ancestral strain of TEV because their susceptible alleles at the RTM loci. Hereafter, we will refer to these ecotypes as Group 1. Similarly, we will refer to ecotypes Ei-2, Oy-0 and Wt-1 as Group 2. Ecotypes do not cluster according to their symptoms, viral load, or infectivity. Group 2 is formed by ecotypes that show all possible symptomatologies, while members of Group 1 show either moderate or severe symptoms. In terms of viral load, Group 1 members all show high viral accumulation (Figure 1B), whereas Group 2 members were more variable: Ei-2 and Oy-0 had intermediate accumulation values (Figure 1B) while Wt-1 had the highest accumulation observed (Figure 1B).
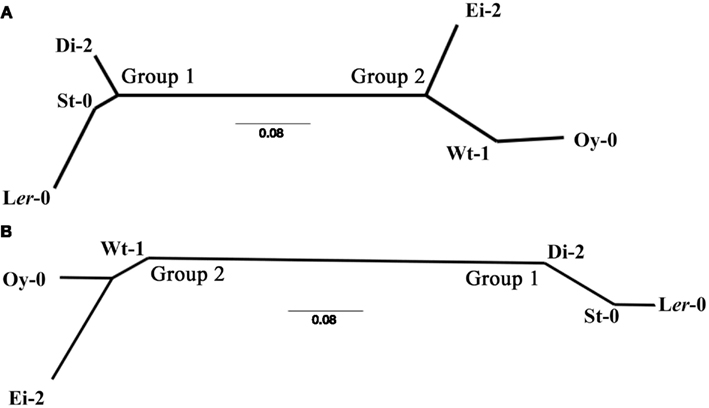
Figure 2. Neighbor-joining dendrograms illustrating the similarity of ecotypes in their transcriptomic response to TEV-At17b infection. (A) For up-regulated genes. (B) For down-regulated genes.
Group 1 have in common 688 up- and 521 down-regulated genes. Group 2 shares very few genes, because the very short list of genes altered in Oy-0 (Table 1). However, Ei-2 and Wt-1 within Group 2 still share 652 up- and 676 down-regulated genes. Globally, the six ecotypes only share five up- (At1g21520, At3g50090, At5g03350, At5g40990, and At5g61890) and one down-regulated (At5g15240) genes. Again, the low number of altered genes in Oy-0 biases this result. At1g21520 encodes for a protein of unknown function that localizes in the endoplasmic reticulum and has been associated with the response to oxidative stress (Luhua et al., 2008). At3g50090 encodes for an exonuclease with domains of ribonuclease H-like and RNase T/DNA polymerase III and that has been described in association to the degradation of miRNAs (Ramachandran and Chen, 2008). At5g03350 encodes for a lectin involved in carbohydrate binding and located in the apoplast, cell wall, and chloroplasts (Boudart et al., 2005). At5g40990 encodes for the GDSL lipase-like 1 protein (GLIP1) directly involved in plant resistance to fungal infection by acting on fungal cell walls. GLIP1 is a critical component of both local and systemic resistance responses via the ethylene-dependent pathway (Kwon et al., 2009). GeneAt5g61890 encodes for a member of the ethylene response factor subfamily B-4 of the ERF/AP2 transcription factor family. It is involved in biotic defense responses (Huibers et al., 2009). Finally, down-regulated gene At5g15240 encodes for a transmembrane amino acid transporter and it may be involved in osmotic stress (Gong et al., 2001).
From this section, we can conclude that heterogeneity exists in the response of different A. thaliana ecotypes to the infection with TEV-At17b. However, ecotypes can be classified in two groups according to the similarities among their responses. A core set of six genes was altered in all ecotypes. Interestingly, four of these genes were involved in responses to stress and one in the metabolism of miRNAs. Two of the stress-related genes were involved in the ethylene-dependent systemic resistance, which may indicate the relevance of this pathway in the response to viral infections.
One may argue that by looking only at 21 dpi, we had missed the switch-on of specific defense-related genes and pathways and that we have just observed a more general response to the intracellular damage induced by TEV on each ecotype. Indeed, it has been shown that early responses of A. thaliana to several viruses include changes in the expression of genes related to defense, cellular signaling, primary, and secondary metabolism, transcription, and transporters were up-regulated as soon as few hours post-inoculation (Whitham et al., 2003; Ishihara et al., 2004; Babu et al., 2008). Furthermore, one may also argue that different cells and tissues may respond in slightly different ways to infection (e.g., Yang et al., 2007) and that by pooling tissues together we missed tissue-specific responses and take an average picture of a more complex situation. These two criticisms are, indeed, important weaknesses of our study, as for many other mRNA profiling studies of plant-virus interactions (e.g., Golem and Culver, 2003; Espinoza et al., 2007; Agudelo-Romero et al., 2008a,b; Ascencio-Ibáñez et al., 2008). We had chosen 21 dpi as our sampling time for three reasons: (i) symptoms at this late time point result from the accumulative effects of alterations that take place at different moments, (ii) in our previous experience (Agudelo-Romero et al., 2008b), significant differences between TEV strains can be detected at this time point, and (iii) because this late time point includes the effect of systemic movement and not just cell-to-cell movement.
Functional Anotation of Altered Genes
Next, we sought to explore which biological processes were affected by TEV-At17b infection on each ecotype. To this end GO enrichment analyses were performed. Rather than describing individual ecotypes, as in the previous section, we will focus in exploring the commonalities and differences between ecotypic Groups 1 and 2. To increase the sensitivity of the FatiGO analyses to identify significant enrichments in biological processes, we removed Oy-0 from Group 2.
Figure 3 shows the biological processes significantly enriched for up- and down-regulated genes. Focusing first in the biological processes enriched for the up-regulated genes (Figure 3A), we found that both groups of ecotypes shared 11 functional categories, including five related to oxidative stresses and six related to defense responses to infections. Not surprisingly, a significant enrichment in genes involved in salicylic acid (SA) mediated responses has been detected in all ecotypes. The differences between the two ecotypic groups are perhaps more interesting than the similarities. Six biological processes were significantly enriched in Group 1 but not in Group 2. By contrast, 18 categories had been found as significantly enriched in Group 2 but not in Group 1 (Figure 3A). In Group 1, cell wall catabolic processes, auxin metabolic processes, response to ethylene, and responses to xenobiotic stimulus were all enriched. In Group 2, defense processes were relatively more important: SA mediated signaling was further enriched, as well as the SAR pathway, innate immune responses, and activation of apoptosis genes. Some additional responses to abiotic stresses were also activated in Group 2. The activation of additional defense responses in Group 2 ecotypes correlates to the stronger symptoms induced by TEV-At17b in these ecotypes and to its larger accumulation.
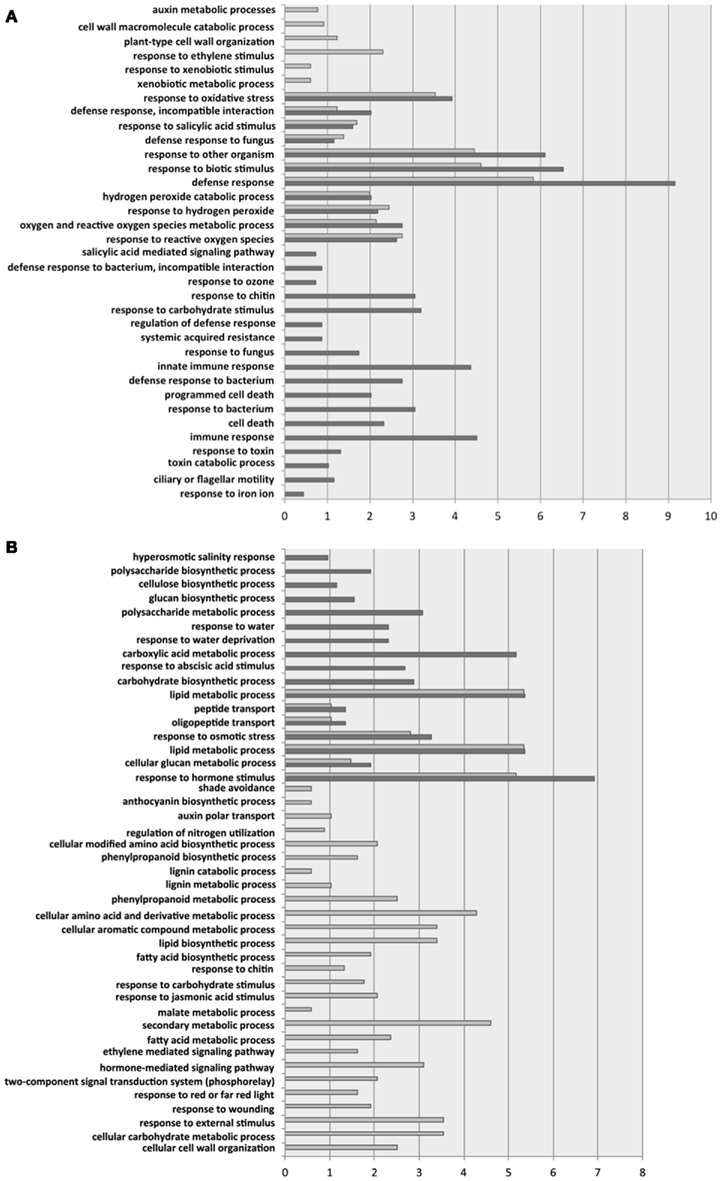
Figure 3. Significant GO categories for biological processes identified for Groups 1 (Di-2, Ler-0 and St-0; light gray bars) and 2 (Ei-2 and Wt-1; dark gray bars). (A) For up-regulated genes. (B) For down-regulated genes. The length of the bars represents the percentage of enrichment on each biological process.
Regarding the biological processes enriched among down-regulated genes (Figure 3B), we found a reduced number of categories significantly enriched in both ecotypic groups: peptide transport, lipid metabolism, cellular glucan metabolism, response to osmotic stress, and response to hormone stimulus. Twenty-six categories were significantly enriched for genes down-regulated in Group 1. These categories include shadow avoidance and responses to red light intensity, regulation of nitrogen utilization, lignin catabolism, and cell wall organization, several secondary metabolism processes (e.g., phenylpropanoid, aromatic compounds, malate, and fatty acids), and several signaling pathways mediated by jasmonic acid, auxins, and ethylene. Similarly, 10 biological processes were enriched among down-regulated genes in Group 2. This included hyperosmotic salinity and water depravation responses, processes involved in polysaccharide (e.g., cellulose, glucan) biosynthesis, in the metabolism of carboxylic acids, and responses to abscisic acid stimulus.
A major conclusion can be drawn from these analyses: the two groups of A. thaliana ecotypes significantly differ in the way they perceive and respond to TEV-At17b infection. Members of Group 1 tend to up-regulate genes involved in abiotic stresses and cell wall construction (perhaps reflecting the mild effect of viral infection in plant growth) and to shut down genes involved in secondary metabolism and some hormone-regulated pathways. Members of Group 2 tend to up-regulate defense genes and to shut down the production of cell wall components (perhaps reflecting the strong symptoms developed and the large accumulation of viral genomes).
Hosts have developed a variety of mechanisms to compensate for the impact of virus infection. For instance, modification of life-history traits and resource allocation may allow them to be more tolerant to infection (Stearns, 1976; Michella, 1985; Perrin and Christe, 1996). However, experimental support for this theory in the case of plant viruses is still scarce. In a pioneering study, Pagán et al. (2008) inoculated 18 ecotypes of A. thaliana at two different developmental stages with two isolates of Cucumber mosaic cucumovirus of different virulence and found heterogeneity among ecotypes in their response to infection. While all accessions delayed flowering, only those belonging to the more tolerant allometric group modified resource allocation to increase the production of reproductive structures and progeny, and reduced the length of reproductive period. Similarly, Bedhomme and Elena (2011) described that one of the effects of TEV and Turnip mosaic potyvirus infection on Nicotiana benthamiana was to change the allocation of resources, eliminating the plant-specific phenotypically plastic response to intra specific competition known as shade avoidance. The results that we report here show that the tolerance to the infection of ecotypes belonging to Group 1 compared to those belonging to Group 2 are clearly associated to profound differences in the expression of multiple genes.
Conclusion
The adaptation of TEV to a particular ecotype of A. thaliana took place by few mutations in the viral genome. However, these very few changes had a major impact in the way the virus interacted with its new host. Interestingly, the adaptation to a particular ecotype was not specific but allowed the new virus to infect additional ecotypes that were not susceptible to the ancestral virus. The interaction of this emerging virus with the different ecotypes was heterogeneous and resulted in differences in susceptibility, viral accumulation, and severity of symptoms. Here we have shown that this heterogeneity has its reflection at the host transcriptomic level, with different ecotypes activating/suppressing the expression of different sets of genes. However, we have been able of classifying ecotypes according to their patterns of gene expression into two groups. For those ecotypes where infection was more severe and allowed for more viral accumulation, the set of genes up-regulated tend to be involved into defenses, deviating resources from building new tissues. By contrast, more tolerant ecotypes in which infection induced milder symptoms and the virus accumulated to a lesser extent tend to up-regulate genes involved in abiotic stresses while expressing genes involved in the construction of new tissues. The analysis of recombinant inbreed lines (RILs) resulting from the cross between ecotypes from Groups 1 and 2 would allow for a fine dissection of the genetics underlying the differences in response to TEV-At17b infection. In this sense, RILs from the cross Col-0 × Ler-0 are already available (Lister and Dean, 1993).
Conflict of Interest Statement
The authors declare that the research was conducted in the absence of any commercial or financial relationships that could be construed as a potential conflict of interest.
Acknowledgments
We thank Francisca de la Iglesia, Javier Forment, and María A. Martínez-Godoy for excellent technical assistance; Miguel A. Pérez-Amador and Francisco Vera for guidance in the use of Agilent microarrays; and Guillermo Rodrigo for help with microarray analyses. This work was supported by grant BFU2009-06993 from the Spanish Ministerio de Ciencia e Innovación (MICINN) to Santiago F. Elena. Julia Hillung was supported by a fellowship from MICINN. José M. Cuevas was contracted under the CSIC JAE-doc program.
Supplementary Material
The Supplementary Material for this article can be found online at http://www.frontiersin.org/Virology/10.3389/fmicb.2012.00229/abstract
Figure S1. Examples of symptoms induced by TEV-At17b on the different A. thaliana ecotypes used in this study. In all panels, the plant at the left is a healthy, mock-inoculated plant, whereas the plant at the right corresponds to an infected sick plant. For Ei-2 and St-0, two pictures are shown (lateral and zenithal views).
Table S1. Excel file containing the list of all genes whose expression has been significantly altered (up- and down-regulated) upon infection with TEV-At17b.
Table S2. Excel file containing the lists of genes shared between ecotypes that belong to Groups 1 and 2.
Footnotes
References
Agudelo-Romero, P., Carbonell, P., De la Iglesia, F., Carrera, J., Rodrigo, G., Jaramillo, A., Pérez-Amador, M. A., and Elena, S. F. (2008a). Changes in the gene expression profile of Arabidopsis thaliana after infection with tobacco etch virus. Virol. J. 5, 92.
Agudelo-Romero, P., Carbonell, P., Pérez-Amardor, M. A., and Elena, S. F. (2008b). Virus adaptation by manipulation of host’s gene expression. PLoS ONE 3, e2397. doi:10.1371/journal.pone.0002397
Ascencio-Ibáñez, J. T., Sozzani, R., Lee, T. J., Chu, T. M., Wolfinger, R. D., Cella, R., and Hanley-Bowdoin, L. (2008). Global analysis of Arabidopsis gene expression uncovers a complex array of changes impacting pathogen response and cell cycle during gemini virus infection. Plant Physiol. 148, 436–454.
Babu, M., Griffiths, J. S., Huang, T. S., and Wang, A. (2008). Altered gene expression changes in Arabidopsis leaf tissues and protoplasts in response to plum pox virus infection. BMC Genomics 9, 325. doi:10.1186/1471-2164-9-325
Bailer, S. M., and Haas, J. (2009). Connecting viral with cellular interactomes. Curr. Opin. Microbiol. 12, 453–459.
Bedhomme, S., and Elena, S. F. (2011). Virus infection suppresses Nicotiana benthamiana adaptive phenotypic plasticity. PLoS ONE 6, e17275. doi:10.1371/journal.pone.0017275
Boudart, G., Jamet, E., Rossignol, M., Lafitte, C., Borderies, G., Jauneau, A., Esquerre-Tugaye, M. T., and Pont-Lezica, R. (2005). Cell wall proteins in apoplastic fluids of Arabidopsis thaliana rosettes: identification by mass spectrometry and bioinformatics. Proteomics 5, 212–221.
Boyes, C. D., Zayed, A. M., Ascenzi, R., McCaskill, A. J., Hoffman, N. E., Davis, K. R., and Görlach, J. (2001). Growth stage-based phenotypic analysis of Arabidopsis: a model for high throughput functional genomics in plants. Plant Cell 13, 1499–1510.
Carr, T., and Whitham, S. A. (2007). An emerging model system: Arabidopsis as a viral host plant. Plant Cell Monogr. 7, 159–183.
Carrington, J. C., and Whitham, S. A. (1998). Viral invasion and host defense: strategies and counter-strategies. Curr. Opin. Plant Biol. 1, 336–341.
Chew, V. (1971). Point estimation of the parameter of the binomial distribution. Am. Stat. 25, 47–50.
Chisholm, S. T., Mahajan, S. K., Whitham, S. A., Yamamoto, M. L., and Carrington, J. C. (2000). Cloning of the Arabidopsis RTM1 gene, which controls restriction of long-distance movement in tobacco etch virus. Proc. Natl. Acad. Sci. U.S.A. 97, 489–494.
Chisholm, S. T., Parra, M. A., Anderberg, R. J., and Carrington, J. C. (2001). Arabidopsis RTM1 and RTM2 genes function in phloem to restrict long-distance movement of tobacco etch virus. Plant Physiol. 127, 1667–1675.
Cosson, P., Sofer, L., Le, Q. H., Léger, V., Schurdi-Levraud, V., Whitham, S. A., Yamamoto, M. L., Gopalan, S., Le Gall, O., Candresse, T., Carrington, J. C., and Revers, F. (2010a). RTM3, which controls long-distance movement of potyviruses, is a member of a new plant gene family encoding a meprin and TRAF homology domain-containing protein. Plant Physiol. 154, 222–232.
Cosson, P., Sofer, L., Schurdi-Levraud, V., and Revers, F. (2010b). A member of a new plant gene family encoding a meprin and TRAF homology (MATH) domain-containing protein is involved in restriction of long distance movement of plant viruses. Plant Signal. Behav. 5, 1321–1323.
Dodds, P. N., and Rathjen, J. P. (2010). Plant immunity: towards an integrated view of plant-pathogen interactions. Nat. Rev. Genet. 11, 539–548.
Elena, S. F., Carrera, J., and Rodrigo, G. (2011). A systems biology approach to the evolution of plant-virus interactions. Curr. Opin. Plant Biol. 14, 372–377.
Espinoza, C., Medina, C., Somerville, S., and Arce-Johnson, P. (2007). Senescence-associated genes induced during compatible viral interactions with grapevine and Arabidopsis. J. Exp. Bot. 58, 3197–3212.
Gan, X., Stegle, O., Behr, J., Steffen, J. G., Drewe, P., Hildebrand, K. L., Lyngsoe, R., Schultheiss, S. J., Osborne, E. J., Sreedharan, V. T., Kahles, A., Bohnert, R., Jean, G., Derwent, P., Kersey, P., Belfield, E. J., Harberd, N. P., Kemen, E., Toomajian, C., Kover, P. X., Clark, R. M., Rätsch, G., and Mott, R. (2011). Multiple reference genomes and transcriptomes for Arabidopsis thaliana. Nature 477, 419–423.
Golem, S., and Culver, J. N. (2003). Tobacco mosaic virus induced alterations in the gene expression profile of Arabidopsis thaliana. Mol. Plant Microbe. Interact. 16, 681–688.
Gong, Z., Koiwa, H., Cushman, M. A., Ray, A., Bufford, D., Kore-Eda, S., Matsumoto, T. K., Zhu, J., Cushman, J. C., Bressan, R. A., and Hasegawa, P. M. (2001). Genes that are uniquely stress regulated in salt overly sensitive (sos) mutants. Plant Physiol. 126, 363–375.
Huibers, R. P., De Jong, M., Dekter, R. W., and Van den Ackerveken, G. (2009). Disease-specific expression of host genes during downy mildew infection of Arabidopsis. Mol. Plant Microbe. Interact. 22, 1104–1115.
Ishihara, T., Sakurai, N., Sekine, K. T., Hase, S., Ikegami, M., Shibata, D., and Takahashi, H. (2004). Comparative analysis of expressed sequence tags in resistant and susceptible ecotypes of Arabidopsis thaliana infected with cucumber mosaic virus. Plant Cell Physiol. 45, 470–480.
Kwon, S. J., Jin, H. C., Lee, S., Nam, M. H., Chung, J. H., Kwon, S. I., Ryu, C. M., and Park, O. K. (2009). GDSL lipase-like 1 regulates systemic resistance associated with ethylene signaling in Arabidopsis. Plant J. 58, 235–245.
Lalic, J., Agudelo-Romero, P., Carrasco, P., and Elena, S. F. (2010). Adaptation of tobacco etch potyvirus to a susceptible ecotype of Arabidopsis thaliana capacitates it for systemic infection of resistant ecotypes. Philos. Trans. R. Soc. Lond. B Biol. Sci. 365, 1997–2008.
Lister, C., and Dean, C. (1993). Recombinant inbred lines for mapping RFLP and phenotypic markers in Arabidopsis thaliana. Plant J. 4, 745–750.
Luhua, S., Ciftci-Yilmaz, S., Harper, J., Cushman, J., and Mittler, R. (2008). Enhanced tolerance to oxidative stress in transgenic Arabidopsis plants expressing proteins of unknown function. Plant Physiol. 148, 280–292.
Mahajan, S. K., Chisholm, S. T., Whitham, S. A., and Carrington, J. C. (1998). Identification and characterization of a locus (RTM1) that restricts long-distance movement of tobacco etch virus in Arabidopsis thaliana. Plant J. 14, 177–186.
Maule, A., Leh, V., and Lederer, C. (2002). The dialogue between viruses and hosts in compatible interactions. Curr. Opin. Plant Biol. 5, 279–284.
Michella, D. J. (1985). Host life-history variation in response to parasitism. Parasitology 90, 205–216.
Pagán, I., Alonso-Blanco, C., and García-Arenal, F. (2008). Host responses in life-history traits and tolerance to virus infection in Arabidopsis thaliana. PLoS Pathog. 4, e1000124. doi:10.1371/journal.ppat.1000124
Ramachandran, V., and Chen, X. (2008). Degradation of microRNAs by a family of exoribonucleases in Arabidopsis. Science 321, 1490–1492.
Rodrigo, G., Carrera, J., Ruiz-Ferrer, V., Del Toro, F. J., Llave, C., Voinnet, O., and Elena, S. F. (2012). A meta-analysis reveals the commonalities and differences in Arabidopsis thaliana response to different viral pathogens. PLoS ONE. doi:10.1371/journal.pone.0040526
Rowland, O., and Jones, J. D. G. (2001). Unraveling regulatory networks in plant defense using microarrays. Genome Biol. 2, 1001.1–1001.3.
Whitham, S. A., Anderberg, R. J., Chisholm, S. T., and Carrington, J. C. (2000). Arabidopsis RTM2 gene is necessary for specific restriction of tobacco etch virus and encodes an unusual small heat shock-like protein. Plant Cell 12, 569–582.
Whitham, S. A., Quan, S., Chang, H. S., Cooper, B., Estes, B., Zhu, T., Wang, X., and Hou, Y. M. (2003). Diverse RNA viruses elicit the expression of common sets of genes in susceptible Arabidopsis thaliana plants. Plant J. 33, 271–283.
Whitham, S. A., and Wang, Y. (2004). Roles for host factors in plant viral pathogenicity. Curr. Opin. Plant Biol. 7, 365–371.
Whitham, S. A., Yamamoto, M. L., and Carrington, J. C. (1999). Selectable viruses and altered susceptibility mutants in Arabidopsis thaliana. Proc. Natl. Acad. Sci. U.S.A. 96, 772–777.
Whitham, S. A., Yang, C., and Goodin, M. M. (2006). Global impact: elucidating plant responses to viral infection. Mol. Plant Microbe. Interact. 19, 1207–1215.
Wise, R. P., Moscou, M. J., Bogdanove, A. J., and Whitham, S. A. (2007). Transcript profiling in host-pathogen interactions. Annu. Rev. Phytopathol. 45, 329–369.
Keywords: emerging viruses, experimental evolution, host-virus interaction, systems biology, virus evolution
Citation: Hillung J, Cuevas JM and Elena SF (2012) Transcript profiling of different Arabidopsis thaliana ecotypes in response to Tobacco etch potyvirus infection. Front. Microbio. 3:229. doi: 10.3389/fmicb.2012.00229
Received: 08 April 2012; Paper pending published: 01 May 2012;
Accepted: 04 June 2012; Published online: 25 June 2012.
Edited by:
K. Andrew White, York University, CanadaReviewed by:
F. Murilo Zerbini, Universidade Federal de Viçosa, BrazilSteven Whitham, Iowa State University, USA
Copyright: © 2012 Hillung, Cuevas and Elena. This is an open-access article distributed under the terms of the Creative Commons Attribution Non Commercial License, which permits non-commercial use, distribution, and reproduction in other forums, provided the original authors and source are credited.
*Correspondence: Santiago F. Elena, Instituto de Biología Molecular y Celular de Plantas, Consejo Superior de Investigaciones Científicas-Universidad Politécnica de Valencia, Campus UPV CPI 8E, Ingeniero Fausto Elio s/n, 46022 Valencia, Spain. e-mail:c2FudGlhZ28uZWxlbmFAY3NpYy5lcw==