 Laetitia Muszkieta1 Anne Beauvais1
 Vera Pähtz2,3
 John G. Gibbons4
 Véronique Anton Leberre5,6,7 Rémi Beau1
 Kazutoshi Shibuya8 Antonis Rokas4
 Jean M. Francois5,6,7
 Olaf Kniemeyer2,3
 Axel A. Brakhage2
 Jean P. Latgé1*
- 1Unité des Aspergillus, Institut Pasteur, Paris Cedex, France
- 2Department of Molecular and Applied Microbiology, Leibniz Institute for Natural Product Research Infection Biology - Hans Knöll Institute and Department of Microbiology and Molecular Biology, Institute of Microbiology, Friedrich Schiller University Jena, Jena, Germany
- 3Integrated Research and Treatment Center, Center for Sepsis Control and Care Jena, University Hospital, Jena, Germany
- 4Department of Biological Sciences, Vanderbilt University, Nashville, TN, USA
- 5Université de Toulouse; INSA, UPS, INP; LISBP, Toulouse, France
- 6INRA, UMR792, Ingénierie des Systèmes Biologiques et des Procédés, Toulouse, France
- 7CNRS, UMR5504, Toulouse, France
- 8Department of Pathology, Omori Hospital, Toho University School of Medicine, Ota-Ku, Tokyo, Japan
In the lung, Aspergillus fumigatus usually forms a dense colony of filaments embedded in a polymeric extracellular matrix called biofilm (BF). This extracellular matrix embeds and glues hyphae together and protects the fungus from an outside hostile environment. This extracellular matrix is absent in fungal colonies grown under classical liquid shake conditions (PL), which were historically used to understand A. fumigatus pathobiology. Recent works have shown that the fungus in this aerial grown BF-like state exhibits reduced susceptibility to antifungal drugs and undergoes major metabolic changes that are thought to be associated to virulence. These differences in pathological and physiological characteristics between BF and liquid shake conditions suggest that the PL condition is a poor in vitro disease model. In the laboratory, A. fumigatus mycelium embedded by the extracellular matrix can be produced in vitro in aerial condition using an agar-based medium. To provide a global and accurate understanding of A. fumigatus in vitro BF growth, we utilized microarray, RNA-sequencing, and proteomic analysis to compare the global gene and protein expression profiles of A. fumigatus grown under BF and PL conditions. In this review, we will present the different signatures obtained with these three “omics” methods. We will discuss the advantages and limitations of each method and their complementarity.
Introduction
During lung infection, Aspergillus fumigatus hyphae are covered by an extracellular matrix (Figures 1A,B) (Loussert et al., 2010). In the case of aspergilloma, hyphae are embedded together in this dense extracellular matrix whereas in invasive aspergillosis hyphae are individually engulfed in the matrix (Figures 1A,B) (Beauvais et al., 2007; Muller et al., 2011). This extracellular matrix protects the fungus against host defense reactions as well as antifungal drugs. The in vivo composition of the mycelial extracellular matrix of A. fumigatus has been reported during host infection (Loussert et al., 2010). The extracellular matrix is composed of polysaccharides, pigment, and proteins. A. fumigatus biofilm (BF) condition can be reproduced in vitro. Indeed, the mycelium growing on porous plastic film deposited on the surface of agar medium plate is able to form an extracellular matrix with a composition closely similar to the in vivo with tightly bound hyphae (Figure 1C) (Beauvais et al., 2007). In contrast, this extracellular matrix is absent in mycelia grown in shake cultures and hyphae are only loosely associated. These differences in organizational and physiological characteristics between the mycelium growing under “planktonic” or “biofilm” condition are associated with specific transcriptional and translational signatures. As the development of the fungal BF in vivo is more close to aerial colony grown on a solid substratum in vitro, it is expected that an analysis of the colony physiology may help to understand the in vivo growth of A. fumigatus in patients.
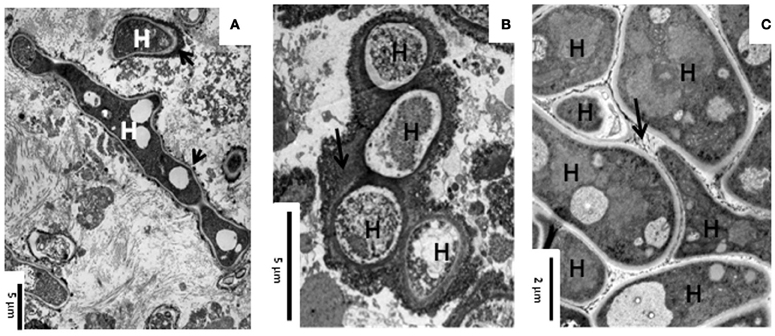
Figure 1. Transmission electron microscopy showing the ultrastructure of A. fumigatus biofilm in vivo and in vitro. (A) Invasive aspergillosis in human lung; (B) Aspergilloma in human lung; and (C) 24 h static and aerial culture of A. fumigatus at 30°C. Note the presence of an extracellular material (ECM, arrow) at the surface of the hyphae (H).
High-throughput technologies enable quantitative monitoring of the abundance of various biological molecules and allow quantification of their variation between two different conditions on a genomic scale. Omics approaches involve high-throughput technologies that enable the measurement of global changes in the abundance of mRNA transcripts (transcriptomic), proteins (proteomic), and other biomolecular components (metabolomic) in complex biological systems as a result of chemical perturbation or transition of developmental stages (Nie et al., 2007; Hawkins et al., 2010; Ozsolak and Milos, 2011). Using “omics” methods to compare the mycelium obtained in aerial condition vs. the mycelium growing in submerged condition may allow us to identify the biological process important during the BF growth.
In this review, we will present the different transcriptional and translational signature obtained by using transcriptomic (microarray and RNA-sequencing) and proteomic analyses of BF grown mycelium in comparison to submerged mycelium. In addition, since the application of omics technologies is quite at its infancy in the A. fumigatus field, comparison of these three “omics” methods makes it possible to highlight the advantages and limitations or complementarity of these methods.
Transcriptomic Analysis
A. fumigatus ATCC_46645 was the wild-type strain used in these analyses. This genome is composed of 9.926 predicted genes organized in eight chromosomes for a total size of 29.4 Mb (Niermann et al., 2005). Total RNA of aerial colony or submerged mycelium were obtained as described previously (Gibbons et al., 2012).
Data Obtained with Microarrays and RNA-Sequencing Analysis
Four biological replicates of the microarray experiment were performed, each time with a reciprocal labeling protocol (“dye-swap”), which served both as a labeling control and technical replicate. The microarrays analysis was realized by using the AF gene chip microarrays that cover about 9600 Open Reading Frames from genome of strain ATCC_46645, sequenced by J. Craig Venter Institute (JCVI), The Institute for Genomic Research (TIGR). Scanning was performed with an Axon scanner 4000A and the resulting images were analyzed by using GenePix Pro 6.01 software. The Bioplot software was used for statistical analysis. Quantile normalization was applied to the whole data set to account for variation between slides. Expression ratio cutoff of 2.0 and 0.5 were applied to select differentially expressed genes with a p-value <0.05 (Student's t-test). 359 genes differentially expressed in the BF condition as compared to submerged condition were identified. Among them, 193 and 169 genes were up or down regulated, respectively, under the BF growth conditions. The differentially expressed genes were classified according to the functional catalog FunCat. 66.84 and 59.17% of the up and down regulated genes were functionally annotated, which led to the identification of 6 functional categories significantly up regulated and 14 functional categories down regulated in A. fumigatus BF (p < 0.05 Fisher's Exact Test) (Table 1). However, when we considered the percentage of genes up or down regulated per category, this percentage was too low to ascertain the global up or down regulation of any of these functional categories.
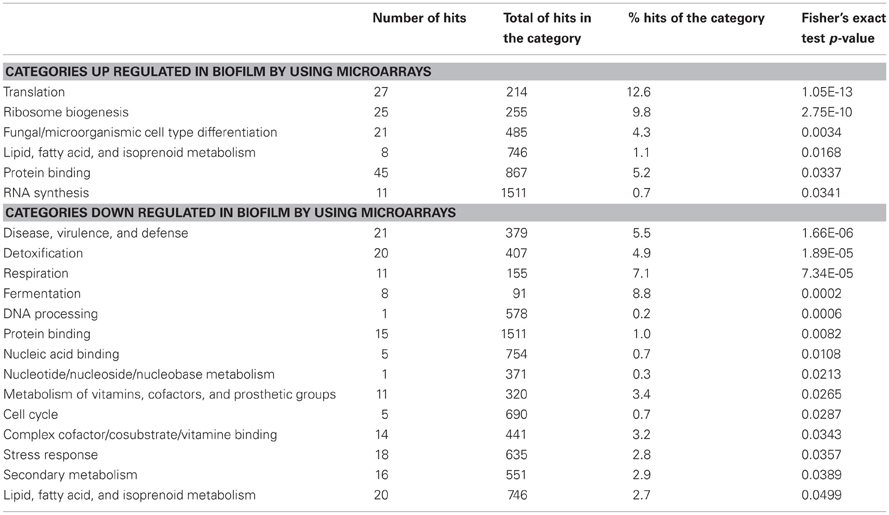
Table 1. Functional categorization of the differentially expressed genes in the biofilm condition by using microarrays.
The analysis of the transcriptional signature of the A. fumigatus BF grown under the same conditions was already published by Gibbons et al. (2012) by using RNA-sequencing. This method identified 10-fold more genes differentially expressed in the BF than microarrays. Among the 3729 differentially expressed genes, 2564 genes were up regulated and 1164 genes were down regulated in the BF. The functional categorization of the differentially expressed genes showed a total of 31 up regulated and 31 down regulated functional categories under BF growth conditions (Tables 2, 3). Among the different categories identified, 5 of the 6 up regulated categories and 9 of 14 down regulated categories of the microarrays analysis are retrieved, respectively, among up regulated and down regulated categories identified by using RNA-sequencing (Tables 1, 2, 3). Among the most highly enriched categories of the RNA-sequencing data, the categories linked to transport, detoxification, disease, virulence and defense, and homeostasis were significantly up regulated whereas the categories linked to carbohydrate metabolism such as glycolysis/glucogenesis and tricarboxylic-acid cycle were significantly down regulated.
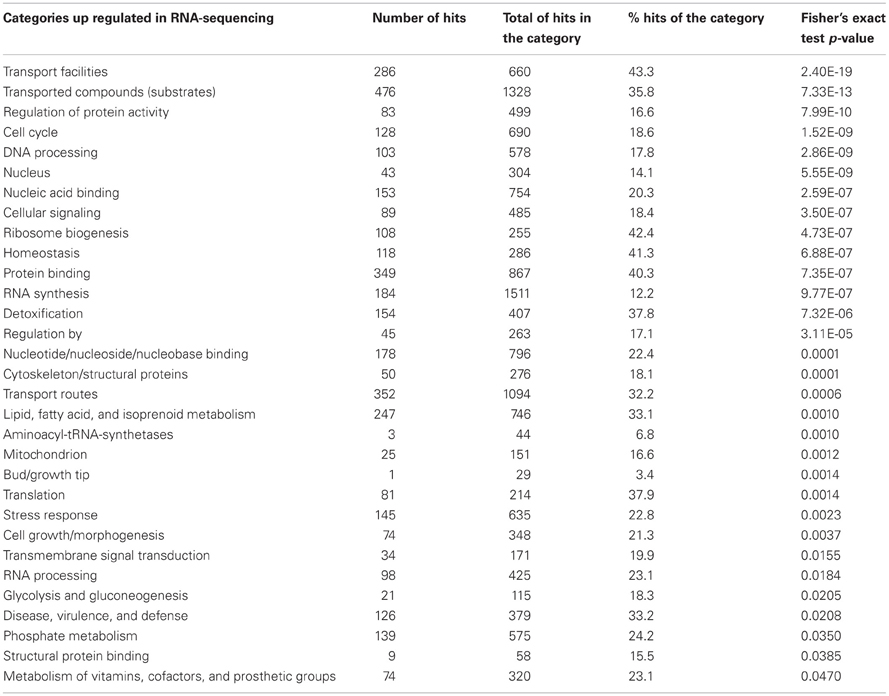
Table 2. Functional categorization of the up regulated biofilm genes obtained by using RNA-sequencing.
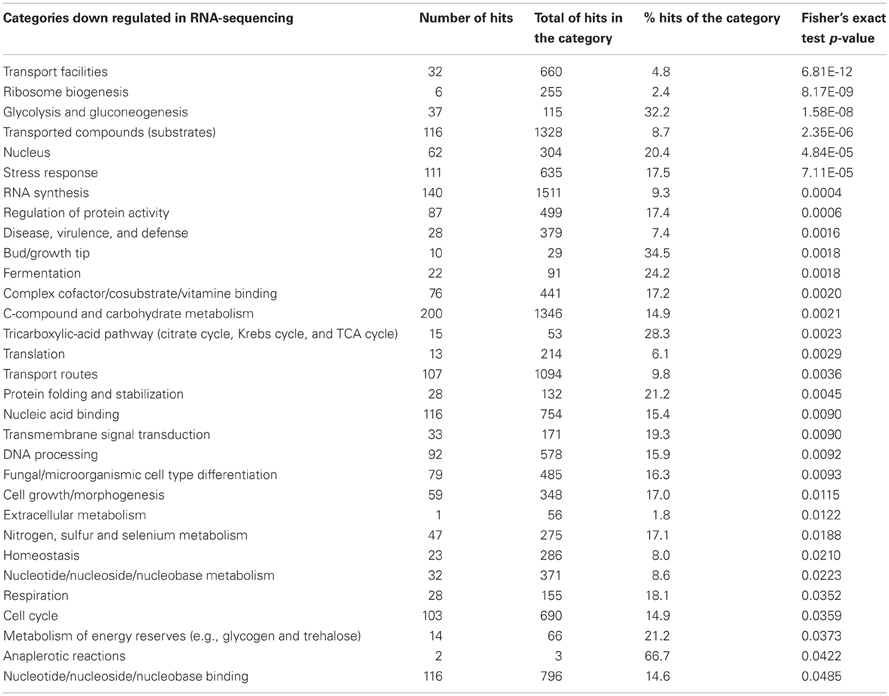
Table 3. Functional categorization of the down regulated biofilm genes obtained by RNA-sequencing.
Transcriptomic Signature: Microarray vs. RNA-Sequencing Analysis
Whereas the microarray analysis leads to the identification of hundreds of differentially expressed genes, RNA-sequencing allowed the identification of thousands of genes, which were differentially expressed in the BF. For several categories more than 30% of hits constituting a specific FunCat category were differentially expressed in the RNA-sequencing experiment. In constrast, in microarray analyses no more than 12% of the hits belonging to one category were differentially expressed (Tables 2, 3). Thus, RNA-sequencing allows a more robust identification of functional categories that represent the transcriptional signature of the BF growth of A. fumigatus (Tables 2, 3). Several reasons could explain the difference between signatures obtained with these two methods and justify the current replacement of microarrays analysis by RNA-sequencing data.
The development of microarrays enabled for the first time the simultaneous analysis of the expression levels of thousands of known or putative transcripts. However, microarrays provide mRNA expression pattern data based on the high-throughput and semi quantitative analysis of fluorescence signaling intensities (Morozova et al., 2009). However, this technique has limitations. As the technique relies on hybridization, it poses a range of potential problems such as interfering background hybridization levels, cross hybridization, difference in probe hybridization properties, and dye binding variances. This technological bias means that microarrays do not quantify easily and properly the expression pattern of low abundant transcripts since low intensity fluorescence signals are difficult to distinguish numerically and statistically from the background noise (Roy et al., 2011). Conversely, signal saturation can occur at high intensities and limits the ability to compare transcripts that are expressed at very high levels. In comparison, RNA-sequencing offers several major advantages. Firstly, RNA-sequencing allows quantifying gene expression levels precisely without any background by sequencing each transcript independently (Wang et al., 2009). Secondly, RNA-sequencing is very sensitive and can detect a larger dynamic range of gene expression levels in comparison to microarrays, without a lack of sensitivity for genes expressed at very low or very high levels. Furthermore, RNA-sequencing has showed a better reproducibility for both technical and biological replicates. These methodological and technical variations inherent to the methodologies themselves can explain the difference in the number of differentially expressed genes obtained by applying two methods to one experimental set-up.
In spite of these discrepancies, it was observed that among the 193 up regulated genes identified by microarrays, 119 were also up regulated in the RNA-sequencing data (Figure 2A). Among the 169 down regulated genes identified in the microarrays only 56 were shown to be down regulated in the RNA-sequencing analysis (Figure 2B). Thus, ~49% of the differentially expressed genes identified with microarrays were also retrieved in the RNA-sequencing data with a positive correlation of p = 0.82 (Pearson correlation) (Figure 2C). Some of the common differentially expressed genes found in both transcriptomic methods are discussed below (Table 4).
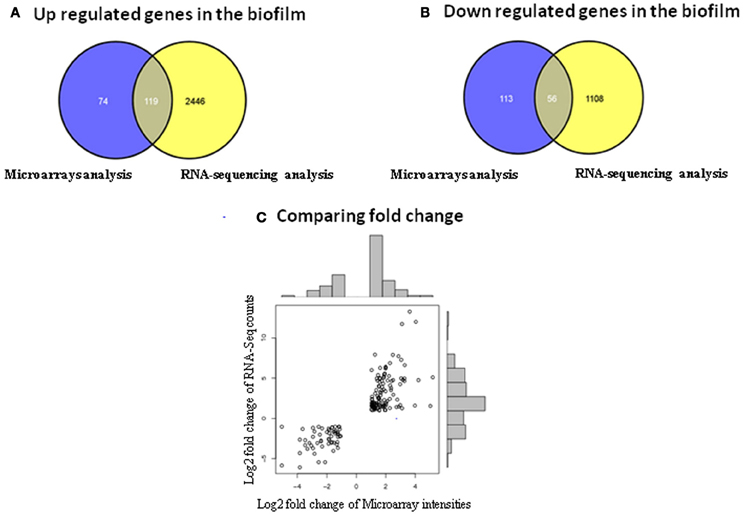
Figure 2. Identification of the differentially expressed genes common to both transcriptomic methods. (A) Comparison of the up regulated genes obtained with microarray and RNA-sequencing analysis in the biofilm. (B) Comparison of the down regulated genes obtained with microarray and RNA-sequencing analysis in the biofilm. (C) Comparison of the fold change obtained with microarray and RNA-sequencing analysis.
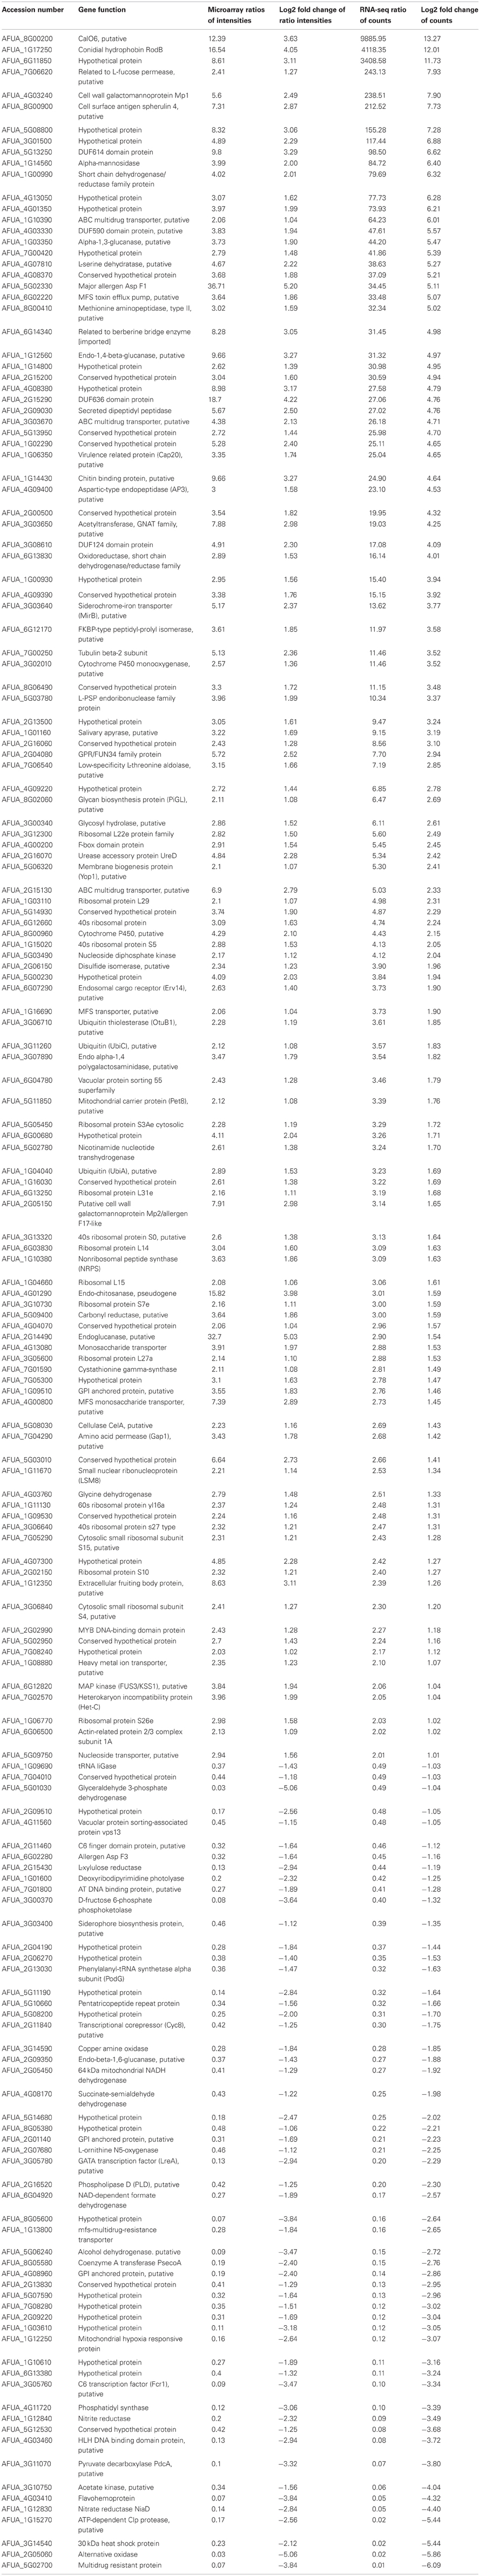
Table 4. List of differentially expressed genes common to both transcriptomic methods used.
A large proportion of common genes up regulated in the BF are involved in the transcriptional and translational regulation reflecting the establishment of different transcriptional and translational programs between these two growth conditions.
Genes coding for antigenic and allergenic proteins are differentially expressed in the BF. Two of the major allergens of A. fumigatus, the ribotoxin Asp F1 and the allergen Asp F7-like (extracellular cellulase CelA) are up regulated in the A. fumigatus BF (Madan et al., 1997a,b; Alvarez-Garcia et al., 2010). Among the 81 allergens identified in A. fumigatus, 39 genes were shown to be up regulated under BF conditions by using RNA-sequencing (Mari and Scala, 2006). Noteworthy, the secreted galactomannoprotein Afmp1p and the mannoprotein Afmp2p are up regulated in the BF (Woo et al., 2002; Chong et al., 2004). Afmp1p and Afmp2p are specific to A. fumigatus and are not found in other Aspergillus species. A clinical evaluation of sera from invasive aspergillosis patients has revealed that they contained circulating Afmp1p proteins as well as antibodies directed against both Afmp1p and Afmp2p proteins. A dual detection system was suggested for the diagnosis of aspergillosis based on the presence of circulating Afmp1 antigen and antibodies against Afmp2p. An overexpression of antigenic molecule does not occur in all cases, e.g., the allergen thioredoxin peroxidase AspF3 is down regulated in the BF (Kniemeyer et al., 2009). The occurrence of a higher production of allergens/antigens in the BF condition is in agreement with the initial observations that growth of the fungus in an infected lung is similar to the in vitro BF growth.
The rodB gene belonging to the hydrophobins family is also highly up regulated in the BF. A. fumigatus has at least six genes that code for hydrophobins, but only rodA and rodB have been studied for virulence implications (Paris et al., 2003). The rodA gene encodes a small hydrophobic cysteine-rich polypeptide present on the surface of the conidia and the deletion mutant displays a conidial cell wall without rodlet layer allowing a better recognition to alveolar macrophages. The rodA mutant produced smaller lung lesions and weaker inflammatory response than the reference wild-type strain in a murine model of invasive aspergillosis. However, although the rodB gene is highly expressed in the BF, the rodB deletion mutant did not show any obvious morphological phenotypes. The role of this hydrophobin in mycelial growth remains obscure.
The gene coding for the putative O-methyltransferase CalO6 is one of the most up regulated gene in the BF found in both analyses. This gene belongs to a secondary metabolism supercluster responsible for the biosynthesis of fumitremorgin, pseurotin A, and an unknown secondary metabolite (Khaldi et al., 2010). Among this supercluster composed of 44 genes, 3 genes were found to be up regulated in the microarray data set in comparison to 32 up regulated genes identified by RNA-sequencing. Fumitremorgin was shown to be an inhibitor of chemotherapy-resistant breast cancer cells and conferred sensitivity to anticancer drugs (Grundmann et al., 2008). In spite of these interesting biological characteristics, the potential role of fumitremorgins in Aspergillus pathogenesis has not been elucidated yet. The role of the pseurotin A toxin in the pathogenesis of A. fumigatus is also poorly understood (Ishikawa et al., 2009; Vodisch et al., 2011). The pseurotin A toxin was shown to be produced under hypoxic conditions and showed a slight cytotoxicity against lung fibroblasts and the capacity to inhibit IgE production (Ishikawa et al., 2009). Most of the studies on Aspergillus fumigatus mycotoxins dealt with gliotoxin. The corresponding gene cluster of gliotoxin is up regulated in the BF (Bruns et al., 2010; Speth et al., 2011; Scharf et al., 2012). Even though their role in fungal pathogenicity was suggested by these studies, their role during infection has not been experimentally assessed using pure substance.
RNA-sequencing as compared to microarrays provides clear evidence that entire pathways are differentially expressed. For example, the glycolysis pathway responsible for the conversion of glucose to pyruvate was shown to be down regulated in the A. fumigatus BF in both transcriptomic methods. Whereas microarrays allowed the identification of only 5 down regulated genes of the glycolysis, the RNA-sequencing highlighted 17 down regulated genes out of 28 genes constituting the glycolysis pathway (Figure 3). Genes encoding enzymes of the tricarboxylic-acid cycle are also differentially expressed as revealed by both transcriptomic methods. Genes encoding enzymes responsible of the conversion of citrate to succinyl-CoA, the oxidative branch of the TCA cycle, were shown to be down regulated in RNA-sequencing whereas enzymes participating in the conversion of succinyl-CoA to oxaloacetate were shown to be up regulated. In line with this, the isocitrate lyase, which is involved in the conversion of isocitrate to glyoxylate and succinate was shown to be up regulated in both analyses. These results reflect that the fungus may not acquire energy by fermentation but by metabolizing acetyl-CoA using the glyoxylate cycle under BF conditions. NADH formed by this cycle can enter then in the respiratory chain pathway. Genes belonging to the mitochondrial complexes II, III, and V, controlling oxidative phosphorylation, were shown to be up regulated in the BF in the RNA-sequencing analysis. In Candida albicans, levels of isocitrate lyase and malate synthase are greatly increased upon contact with its human host and interestingly, isocitrate lyase has been shown to be key virulence factor (Lorenz and Fink, 2001). In contrast, isocitrate lyase of A. fumigatus is not essential for the development of invasive aspergillosis in a murine model (Schobel et al., 2007).
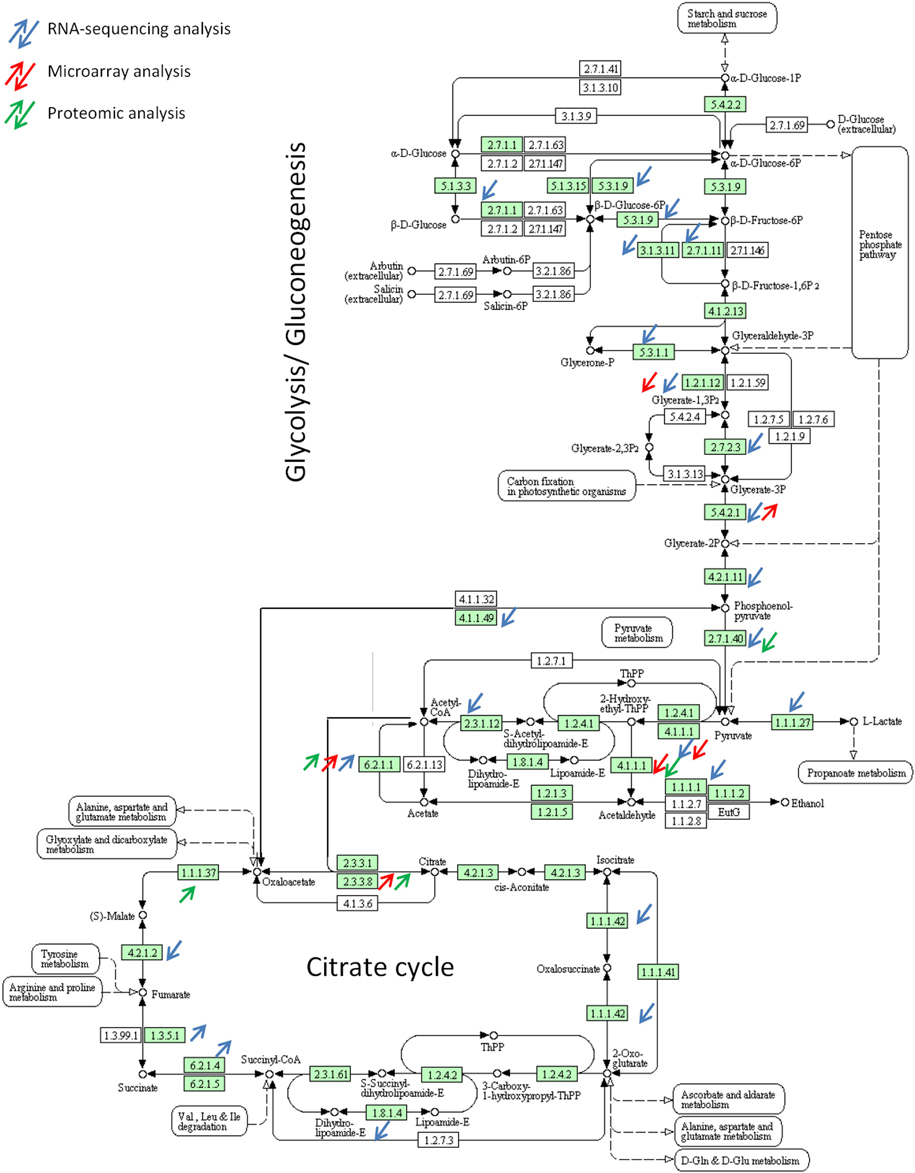
Figure 3. Differential expression of genes involved in glycolysis pathway and TCA cycle during biofilm growth.
One hundred and forty transporter genes were up regulated in the BF based on RNA-sequencing analysis. In comparison, microarrays revealed only the up regulation of only 5 MFS and 3 ABC transporters. The Mdr4 transporter was shown to be up regulated in an in vivo BF mouse model during voriconazole treatment (Langfelder et al., 2002; Nascimento et al., 2003; Rajendran et al., 2011). The ABC transporters Mdr1, Mdr2, and Mdr4 which are overexpressed in itraconazole-resistant mutants induced in vitro are also up regulated in our BF condition in the RNA-sequencing analysis (Nascimento et al., 2003). Thus, the up regulation of these efflux pumps in A. fumigatus could lead to azole resistance in BF grown A. fumigatus cultures. A recent study showed that the A. fumigatus BF sensitivity to voriconazole was increased in presence of an efflux pump inhibitor reflecting the importance of the transport activity in the BF to counteract the action of inhibitors in association with the 14-α-demethylase Cyp51A (Rajendran et al., 2011).
Proteomics Analysis
Large-scale analysis of the proteome is also important for a better understanding of the cellular, metabolic, and regulatory networks in the cell. Proteomic analysis offers the advantage to visualize the final product of the gene transcription. This methodology has still a bias against low-abundance and membrane proteins. However, targeted proteomic approaches based on LC-MS/MS techniques, such as selected reaction monitoring (SRM), have the potenial to detect proteins with low copy numbers (Picotti et al., 2009). In A. fumigatus, around 650 proteins have so far been identified by 2D-gel electrophoresis for a genome that has ~10,000 genes (Teutschbein et al., 2010). The proteomic analysis of the BF condition after 16 h growth as compared to submerged condition was performed as described by Bruns et al. (2010), with slight modifications. 2D-gel images were analyzed by using Delta 2D 4.3 (Decodon, Germany). Analysis of the 2-D gel patterns obtained revealed that 43 spots showed significant changes in abundance between the BF and planktonic cultures (Figure 4). Among them, 25 different proteins were identified by MALDI-TOF/TOF-analyses (Table 5). Three proteins were up and 22 were down regulated under BF conditions.
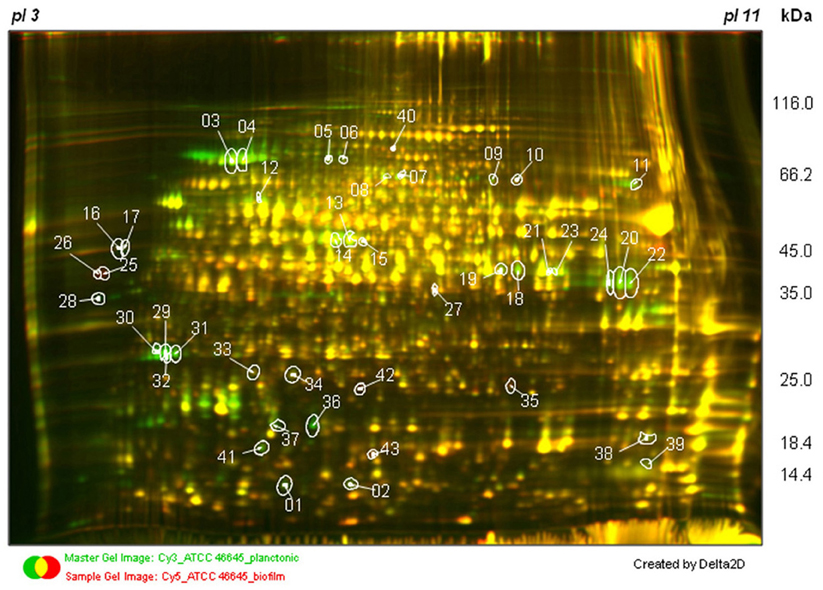
Figure 4. 2D electrophoretic separation of protein extracts of A. fumigatus grown under submerged (PL) and biofilm (BF) culture conditions. In total, 43 different protein spots of A. fumigatus changed significantly their abundance within 16 h of growth (protein spots are labeled with spot numbers as indicated in Table 5). A. fumigatus proteins were labeled with the CyDye DIGE Fluor minimal dye labeling kit. Subsequently, proteins were separated by 2D gel electrophoresis using immobilized pH gradient strips with a pH range of 3–11 NL in the first dimension. For the separation of proteins in the second dimension, SDS-polyacrylamide gradients gels (11–16%) were used. Differentially regulated proteins were identified by MALDI-TOF/TOF analysis. A three color overlaid gel image is shown. Samples were labeled as follows: ATCC 46645-planctonic culture control sample (Cy3), ATCC 46645-biofilm culture sample (Cy5), and internal standard (Cy2).
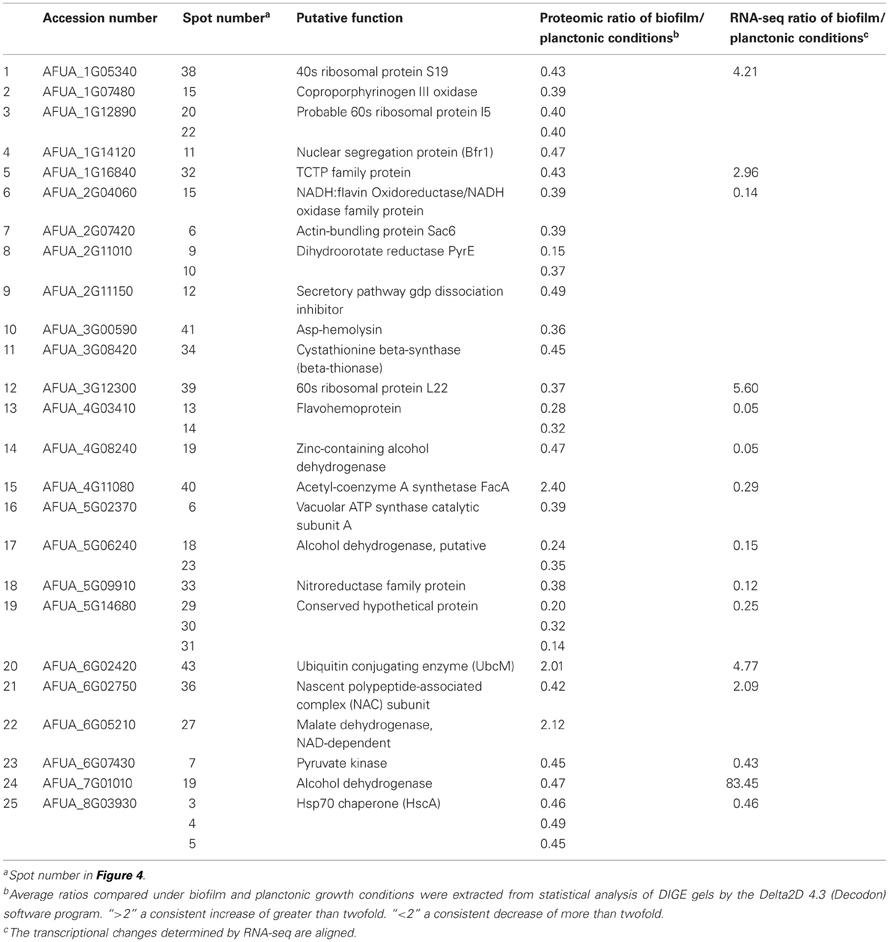
Table 5. List of differentially expressed proteins obtained by using proteomic analysis.
Proteomic vs. RNA-Seq Data
The comparison of the transcriptomic and proteomic data has revealed that 16 genes corresponding to differentially regulated proteins were retrieved in the RNA-sequencing data vs. only 5 genes for microarrays. Only 8 of the 22 down regulated proteins and corresponding mRNA were found to be down regulated (cutoff <0.5) with a correlation of p = 0.43 (Pearson correlation) and one protein and its corresponding mRNA was up regulated. These results stressed the difficulties in correlating transcriptome and proteome data. Several reasons may explain the low number of differentially expressed proteins and the low degree of correlation between transcriptomic and proteomic analyses (Nie et al., 2007; Sukardi et al., 2010). For technical reasons, the current two-dimensional gel-based analyses focus mainly on the cytoplasmic subset of the cell proteome due to the impossibility to date to extract most membrane or hydrophobic proteins. Proteins are then separated according to their isoelectric point and molecular mass. So proteins with an extreme isoelectric point or molecular mass are not amenable to 2D-gel electrophoresis. A sufficient amount of protein present in one spot is also crucial for the unambiguous identification of the protein by MALDI-TOF/TOF-analyses. Conversely, RNA-sequencing allows the identification of thousand mRNAs differentially regulated between two conditions. However, the transcript levels detected in mRNA profiling do not reflect all the regulatory processes in the cell, such as post-transcriptional-processes occurring before translation, the half-lives of mRNAs and proteins and the post-translational regulation on the protein level as the quality control of proteins and the degradation in the proteasome. Conversely to RNA-sequencing, the proteomic analysis highlights fewer regulated proteins but assured their real up regulation or down regulation in the cell. Thus, even if a limited number of proteins were identified by proteomic analysis, some of them could confirm the up regulation of pathways or genes in the BF at the protein level.
Among the proteins identified, proteins involved in the translational regulation and post-translational modifications are found. The data were in agreement with the transcriptomic data and shows that the transcriptional and translational processes involved in the two growth conditions were different.
Similarly, the pyruvate kinase was down regulated whereas the acetyl-CoA synthetase FacA and the malate dehydrogenase were up regulated in the BF. These results confirmed the down regulation of the glycolysis pathway and the up regulation of final steps of the TCA at the protein level.
The Asp-hemolysin protein was down regulated in the BF. Asp-hemolysin was reported to be released into the culture supernatant by A. fumigatus during growth in presence of elastin, collagen, and keratin, where it is supposed to exhibit a hemolytic activity (Wartenberg et al., 2011). However, the characterization of the deletion strain Δasp-HS did not revealed significant hemolytic and cytotoxic activity and the impact on pathogenicity and the biological role of the Asp-HS protein is still poorly understood.
All proteome data (gel images, spot information) were imported into our in-house data ware-house Omnifung http://www.omnifung.hki-jena.de and are publicly accessible.
Conclusions
In recent years, many high-throughput technologies have been developed to decipher various aspects of cellular processes, including the transcriptome, epigenome, proteome, metabolome, or interactome. The capacity to perform “omics” analyses at several different levels, such as transcriptomic, proteomic, or metabolomics, and their comparison and integration of information offers an exciting potential to answer many questions asked by a biological study. However, even if the utilization of different “omics” methods can be complementary, the combination of the different data obtained remains a challenge. Among the three “omics” methods used to identify the specific signature of the A. fumigatus BF, the RNA-sequencing has exceeded microarrays and is the most powerful analysis giving precise information on the expression of the entire genes of the genome in a biological sample with a few degree of variability. RNA-sequencing has allowed the identification of up regulated genes involved in transport, secondary metabolism, antigenic and allergenic molecules during BF growth. Data obtained have reflected the metabolic reorganization occurring in the BF. Thus, RNA-sequencing allows the identification of the genes differentially expressed between two biological conditions, but it also provides information concerning sequence variations such as alternative splicing events, gene fusion detection, and small RNA characterization at single-nucleotide resolution (Morozova et al., 2009). In contrast, proteomic analysis allows the identification of proteins, the final product of the gene expression, but the information collected is limited due to the high dynamic range of protein concentration within a cell and the difficulties in analyzing membrane proteins. However, the tremendous progress in LC-MS/MS-based proteomics, which has recently been made, opens up the possibility to detect and quantify also low abundant, highly glycosylated, and hydrophobic proteins including membrane proteins (Savas et al., 2011). To date even though these “omics” technologies are very appealing, the data obtained so far have not yet been able to solve the identification of virulence factors in A. fumigatus. Due to the opportunistic pathogenicity of the species, the identification of the essential metabolic pathways under in vivo conditions may be a better option than the search for specific virulence factors. In this option, “omics” technologies have a great future in the field of human-pathogenic fungi.
Conflict of Interest Statement
The authors declare that the research was conducted in the absence of any commercial or financial relationships that could be construed as a potential conflict of interest.
Acknowledgments
The research leading to these results has received funding from the European Union's Seventh Framework Programme [FP7/2007-2013] under grant agreement n° HEALTH-2010-260338 (ALLFUN), ERA-Net Pathogenomics Biomarkers for prevention, diagnosis and response to therapy of invasive aspergillosis (AspBIOmics), and ESF (European science Foundation) Fuminomics.
References
Alvarez-Garcia, E., Batanero, E., Garcia-Fernandez, R., Villalba, M., Gavilanes, J. G., and Martinez-Del-Pozo, A. (2010). A deletion variant of the Aspergillus fumigatus ribotoxin Asp f 1 induces an attenuated airway inflammatory response in a mouse model of sensitization. J. Investig. Allergol. Clin. Immunol. 20, 69–75.
Beauvais, A., Schmidt, C., Guadagnini, S., Roux, P., Perret, E., Henry, C., et al. (2007). An extracellular matrix glues together the aerial-grown hyphae of Aspergillus fumigatus. Cell. Microbiol. 9, 1588–1600.
Bruns, S., Seidler, M., Albrecht, D., Salvenmoser, S., Remme, N., Hertweck, C., et al. (2010). Functional genomic profiling of Aspergillus fumigatus biofilm reveals enhanced production of the mycotoxin gliotoxin. Proteomics 10, 3097–3107.
Chong, K. T., Woo, P. C., Lau, S. K., Huang, Y., and Yuen, K. Y. (2004). AFMP2 encodes a novel immunogenic protein of the antigenic mannoprotein superfamily in Aspergillus fumigatus. J. Clin. Microbiol. 42, 2287–2291.
Gibbons, J. G., Beauvais, A., Beau, R., McGary, K. L., Latge, J. P., and Rokas, A. (2012). Global transcriptome changes underlying colony growth in the opportunistic human pathogen Aspergillus fumigatus. Eukaryot. Cell 11, 68–78.
Grundmann, A., Kuznetsova, T., Afiyatullov, S., and Li, S. M. (2008). FtmPT2, an N-prenyltransferase from Aspergillus fumigatus, catalyses the last step in the biosynthesis of fumitremorgin B. Chembiochem 9, 2059–2063.
Hawkins, R. D., Hon, G. C., and Ren, B. (2010). Next-generation genomics: an integrative approach. Nat. Rev. Genet. 11, 476–486.
Ishikawa, M., Ninomiya, T., Akabane, H., Kushida, N., Tsujiuchi, G., Ohyama, M., et al. (2009). Pseurotin A and its analogues as inhibitors of immunoglobulin E [correction of immunoglobuline E] production. Bioorg. Med. Chem. Lett. 19, 1457–1460.
Khaldi, N., Seifuddin, F. T., Turner, G., Haft, D., Nierman, W. C., Wolfe, K. H., et al. (2010). SMURF: genomic mapping of fungal secondary metabolite clusters. Fungal Genet. Biol. 47, 736–741.
Kniemeyer, O., Lessing, F., and Brakhage, A. A. (2009). Proteome analysis for pathogenicity and new diagnostic markers for Aspergillus fumigatus. Med. Mycol. 47(Suppl. 1), S248–S254.
Langfelder, K., Gattung, S., and Brakhage, A. A. (2002). A novel method used to delete a new Aspergillus fumigatus ABC transporter-encoding gene. Curr. Genet. 41, 268–274.
Lorenz, M. C., and Fink, G. R. (2001). The glyoxylate cycle is required for fungal virulence. Nature 412, 83–86.
Loussert, C., Schmitt, C., Prevost, M. C., Balloy, V., Fadel, E., Philippe, B., et al. (2010). In vivo biofilm composition of Aspergillus fumigatus. Cell. Microbiol. 12, 405–410.
Madan, T., Arora, N., and Sarma, P. U. (1997a). Ribonuclease activity dependent cytotoxicity of Asp fl, a major allergen of A. fumigatus. Mol. Cell. Biochem. 175, 21–27.
Madan, T., Banerjee, B., Bhatnagar, P. K., Shah, A., and Sarma, P. U. (1997b). Identification of 45 kD antigen in immune complexes of patients of allergic bronchopulmonary aspergillosis. Mol. Cell. Biochem. 166, 111–116.
Mari, A., and Scala, E. (2006). Allergome: a unifying platform. Arb. Paul Ehrlich Inst. Bundesamt Sera Impfstoffe Frankf. A M 95, 29–39; discussion: 39–40.
Morozova, O., Hirst, M., and Marra, M. A. (2009). Applications of new sequencing technologies for transcriptome analysis. Annu. Rev. Genomics Hum. Genet. 10, 135–151.
Muller, F. M., Seidler, M., and Beauvais, A. (2011). Aspergillus fumigatus biofilms in the clinical setting. Med. Mycol. 49(Suppl. 1), S96–S100.
Nascimento, A. M., Goldman, G. H., Park, S., Marras, S. A., Delmas, G., Oza, U., et al. (2003). Multiple resistance mechanisms among Aspergillus fumigatus mutants with high-level resistance to itraconazole. Antimicrob. Agents Chemother. 47, 1719–1726.
Nie, L., Wu, G., Culley, D. E., Scholten, J. C., and Zhang, W. (2007). Integrative analysis of transcriptomic and proteomic data: challenges, solutions and applications. Crit. Rev. Biotechnol. 27, 63–75.
Niermann, W. C., Pain, A., Anderson, M. J., Wortman, J. R., Kim, H. S., Arroyo, J., et al. (2005). Genomic sequence of the pathogenic and allergenic filamentous fungus Aspergillus fumigatus. Nature 22, 1151–1156.
Ozsolak, F., and Milos, P. M. (2011). RNA sequencing: advances, challenges and opportunities. Nat. Rev. Genet. 12, 87–98.
Paris, S., Debeaupuis, J. P., Crameri, R., Carey, M., Charles, F., Prevost, M. C., et al. (2003). Conidial hydrophobins of Aspergillus fumigatus. Appl. Environ. Microbiol. 69, 1581–1588.
Picotti, P., Bodenmiller, B., Mueller, L. N., Domon, B., and Aebersold, R. (2009). Full dynamic range proteome analysis of S. cerevisiae by targeted proteomics. Cell 21, 795–806.
Rajendran, R., Mowat, E., McCulloch, E., Lappin, D. F., Jones, B., Lang, S., et al. (2011). Azole resistance of Aspergillus fumigatus biofilms is partly associated with efflux pump activity. Antimicrob. Agents Chemother. 55, 2092–2097.
Roy, N. C., Altermann, E., Park, Z. A., and McNabb, W. C. (2011). A comparison of analog and Next-Generation transcriptomic tools for mammalian studies. Brief. Funct. Genomics 10, 135–150.
Savas, J. N., Stein, B. D., Wu, C. C., and Yates, J. R. (2011). Mass spectrometry accelerates membrane protein analysis. Trends Biochem. Sci. 36, 388–396.
Scharf, D. H., Heinekamp, T., Remme, N., Hortschansky, P., Brakhage, A. A., and Hertweck, C. (2012). Biosynthesis and function of gliotoxin in Aspergillus fumigatus. Appl. Microbiol. Biotechnol. 93, 467–472.
Schobel, F., Ibrahim-Granet, O., Ave, P., Latge, J. P., Brakhage, A. A., and Brock, M. (2007). Aspergillus fumigatus does not require fatty acid metabolism via isocitrate lyase for development of invasive aspergillosis. Infect. Immun. 75, 1237–1244.
Speth, C., Kupfahl, C., Pfaller, K., Hagleitner, M., Deutinger, M., Wurzner, R., et al. (2011). Gliotoxin as putative virulence factor and immunotherapeutic target in a cell culture model of cerebral aspergillosis. Mol. Immunol. 48, 2122–2129.
Sukardi, H., Ung, C. Y., Gong, Z., and Lam, S. H. (2010). Incorporating zebrafish omics into chemical biology and toxicology. Zebrafish 7, 41–52.
Teutschbein, J., Albrecht, D., Potsch, M., Guthke, R., Aimanianda, V., Clavaud, C., et al. (2010). Proteome profiling and functional classification of intracellular proteins from conidia of the human-pathogenic mold Aspergillus fumigatus. J. Proteome Res. 9, 3427–3442.
Vodisch, M., Scherlach, K., Winkler, R., Hertweck, C., Braun, H. P., Roth, M., et al. (2011). Analysis of the Aspergillus fumigatus proteome reveals metabolic changes and the activation of the pseurotin A biosynthesis gene cluster in response to hypoxia. J. Proteome Res. 10, 2508–2524.
Wang, Z., Gerstein, M., and Snyder, M. (2009). RNA-Seq: a revolutionary tool for transcriptomics. Nat. Rev. Genet. 10, 57–63.
Wartenberg, D., Lapp, K., Jacobsen, I. D., Dahse, H. M., Kniemeyer, O., Heinekamp, T., et al. (2011). Secretome analysis of Aspergillus fumigatus reveals Asp-hemolysin as a major secreted protein. Int. J. Med. Microbiol. 301, 602–611.
Keywords: biofilm, transcriptomic, proteomic analysis, RNA-sequencing, RNA-seq, Aspergillus fumigatus
Citation: Muszkieta L, Beauvais A, Pähtz V, Gibbons JG, Anton Leberre V, Beau R, Shibuya K, Rokas A, Francois JM, Kniemeyer O, Brakhage AA and Latgé JP (2013) Investigation of Aspergillus fumigatus biofilm formation by various “omics” approaches. Front. Microbio. 4:13. doi: 10.3389/fmicb.2013.00013
Received: 15 November 2012; Accepted: 15 January 2013;
Published online: 12 February 2013.
Edited by:
Elaine M. Bignell, Imperial College London, UKReviewed by:
Tom Coenye, University of Ghent, BelgiumGustavo H. Goldman, Universidade de Sao Paulo, Brazil
Copyright © 2013 Muszkieta, Beauvais, Pähtz, Gibbons, Anton Leberre, Beau, Shibuya, Rokas, Francois, Kniemeyer, Brakhage and Latgé. This is an open-access article distributed under the terms of the Creative Commons Attribution License, which permits use, distribution and reproduction in other forums, provided the original authors and source are credited and subject to any copyright notices concerning any third-party graphics etc.
*Correspondence: Jean P. Latgé, Unité des Aspergillus, Institut Pasteur, 25 rue du docteur Roux, Paris 75015, France. e-mail:amVhbi1wYXVsLmxhdGdlQHBhc3RldXIuZnI=