

- Department of Molecular Microbial Physiology, Swammerdam Institute for Life Sciences, University of Amsterdam, Amsterdam, Netherlands
The internal pH (pHi) of a living cell is one of its most important physiological parameters. To monitor the pH inside Bacillus subtilis during various stages of its life cycle, we constructed an improved version (IpHluorin) of the ratiometric, pH-sensitive fluorescent protein pHluorin by extending it at the 5′ end with the first 24 bp of comGA. The new version, which showed an approximate 40% increase in fluorescence intensity, was expressed from developmental phase-specific, native promoters of B. subtilis that are specifically active during vegetative growth on glucose (PptsG) or during sporulation (PspoIIA, PspoIIID, and PsspE). Our results show strong, compartment-specific expression of IpHluorin that allowed accurate pHi measurements of live cultures during exponential growth, early and late sporulation, spore germination, and during subsequent spore outgrowth. Dormant spores were characterized by an pHi of 6.0 ± 0.3. Upon full germination the pHi rose dependent on the medium to 7.0–7.4. The presence of sorbic acid in the germination medium inhibited a rise in the intracellular pH of germinating spores and inhibited germination. Such effects were absent when acetic was added at identical concentrations.
Introduction
The internal pH (pHi) of living cells plays a fundamental role in many chemical reactions. Many intracellular enzymes show optimal activity and stability in a narrow pH range near neutrality. Furthermore, in many organisms proton gradients are required for the greater part of ATP synthesis while uptake systems often depend on the proton gradient over the cell membrane (Krulwich et al., 1998, 2011; Slonczewski et al., 2009). In the model eukaryote Saccharomyces cerevisiae, pHi was found to be a signal controlling growth (Orij et al., 2011). Gene expression as a response to glucose starvation was found to be mediated by changes in the pHi, through the protonation state-dependent binding of a transcription factor to membrane-associated phosphatidic acid (Young et al., 2010). In multicellular eukaryotes pHi is thought to be important during growth and differentiation (Cruciat et al., 2010). In prokaryotic organisms, the relationships between pHi and growth and development have not been studied extensively (Padan and Schuldiner, 1987).
Because of its various well-described differentiation modes, B. subtilis is generally considered to be the bacterial model organism for cellular differentiation. The best described mode of differentiation of this Gram-positive prokaryote is sporulation, with the pathways controlling sporulation understood in great molecular detail (Eichenberger et al., 2004; Steil et al., 2005; Wang et al., 2006). Germination is less well understood, but Keijser et al. (2007) have shown that this too, is a carefully orchestrated process. We reasoned that in analogy to eukaryotes, pHi could be a global regulator, as well as an indicator of the metabolic and energetic state of the cell. To gain further insight in the putative pHi dynamics of these differentiation processes, we studied the pHi of the mother cell and fore-spore independently. During sporulation the development of the pHi in the mother cell and the nascent fore-spore may also give insight in the level of independence of the two cells.
In B. subtilis, the pHi of the developing pre-spore is generally assumed to drop to pH = 6.0–6.4 during sporulation (Magill et al., 1994). The drop in pH causes a decrease in activity of phosphoglycerate mutase (PGM), which catalyses the conversion of 3-phosphoglycerate (3-PGA) to 2-phosphoglycerate. The reduced activity of PGM causes the accumulation of 3-PGA in the pre-spore. B. subtilis spores are metabolically dormant and contain no measurable ATP or glucose that could act as energy source during spore germination (Singh et al., 1977; Magill et al., 1996). It is assumed that the accumulated 3-PGA serves as an initial carbon and energy source for the cell.
The cell’s pHi can be measured with various methods. Ideally, intracellular pH measurements should be conducted in systems containing Good’s buffers (Good et al., 1966; Ferguson et al., 1980), to minimize the effect of the cell’s surrounding (unless desired). The probe used to measure pH should maintain accuracy over the pH range assessed. In addition, both the presence of the probe itself in a cell as well as the detection method applied should have minimal effect on cell physiology. Currently used techniques include the distribution of radiolabeled membrane-permeant weak acids, 31P nuclear magnetic resonance (NMR), fluorescent dyes (e.g., carboxyfluorescein, carboxyfluorescein diacetate, and succinimidyl ester; Ugurbil et al., 1978; Booth, 1985; Bulthuis et al., 1993; Magill et al., 1994; Breeuwer et al., 1996; Leuschner and Lillford, 2000). These methods have the advantage that no genetic modification is required and in the case of fluorescent dyes, single cell measurements are possible (Slonczewski et al., 2009). Weak acid dyes or reporters may alter the pHi and are therefore difficult to use accurately, and may require many treatment and incubation steps before measurement. 31P NMR and radiolabeled compounds require extensive cell handling and high cell density, which also disturb cell physiology. Another useful method is the use of fluorescent proteins [green fluorescent protein (GFP) derivatives]. This does require the organism to be genetically accessible but allows direct, fast, and localized pH measurements. In our lab, we have successfully used ratiometric pHluorin (Miesenböck et al., 1998) for a number of years in S. cerevisiae (Orij et al., 2011; Ullah et al., 2012), and more recently also in B. subtilis (Ter Beek, 2009). However, the codon usage of pHluorin was not optimized for use in B. subtilis. Our initial experiments suggested that our results might benefit from an increase in fluorescence intensity. This might be achieved by improving translation initiation (Veening et al., 2004). We therefore fused the first eight amino acids of comGA to pHluorin (Veening et al., 2004), as this was shown to improve the signal strength of cyan fluorescent protein (CFP) and yellow fluorescent protein (YFP). The pH-dependent ratiometric fluorescent properties of IpHluorin were not affected by this fusion. To monitor the pHi of both the mother cell and the pre-spore, ratiometric GFP-based IpHluorin was expressed from a number of developmental phase-specific native promoters of B. subtilis (Hilbert, 2004).
Expression of IpHluorin resulted in strong, compartmentalized, and cell type-specific signals. This allowed us to monitor the pHi during growth and sporulation, in both pre-spore, mother cell and mature spore, as well as during spore germination. Effects of the addition of sorbic and acetic acid on the pHi of germinating spores are described.
Materials and Methods
Strains and Growth Conditions
For general purpose growth, Escherichia coli MC1061 and B. subtilis PB2 strains were grown in Lysogeny broth (LB). For fluorescence measurements, B. subtilis strains were grown in defined liquid medium (M3G; Keijser et al., 2007) buffered at pH = 5.5 or 6.4 with 80 mM 2-(N-morpholino)ethanesulfonic acid (MES), or at pH = 7.0 or 7.4 with 80 mM 3-(N-morpholino)propanesulfonic acid (MOPS). All cultures were grown at 37°C, under continuous agitation at 200 rpm. When required, the following antibiotics were added: kanamycin for strains carrying pDG148-derived plasmids; 10 μg/ml for B. subtilis strains, 50 μg/ml for E. coli strains, spectinomycin for strains carrying pSG1729-derived plasmids or genomic inserts (50 μg/ml). The strains used in this study are listed in Table 1.
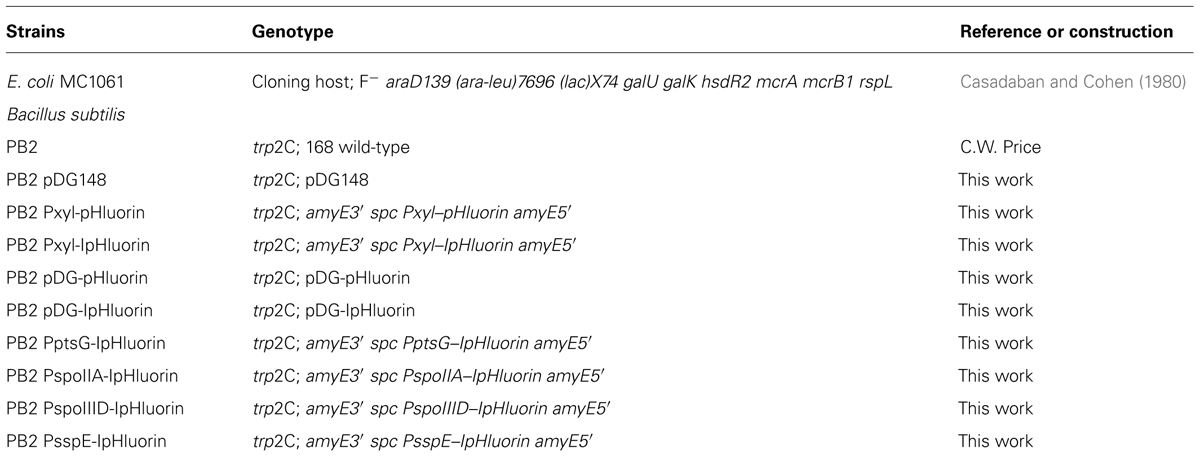
TABLE 1. Strains used in this study.
Sporulation of B. subtilis Strains
Spores of B. subtilis were prepared by glucose depletion of defined liquid medium (M3S, which is M3G without sodium glutamate), at pH = 7.0. Cultures were incubated for 4 days at 37°C under continuous agitation (200 rpm). Spores were harvested and purified by extensive washing with MilliQ water at 4°C. The spore crops were inspected by phase-contrast microscopy and were free (>99%) of vegetative cells, germinating spores, and debris. Spores were stored for up to 1 week in MilliQ water at 4°C at optical density (OD)600 = 1.
Cloning of Promoter Fusions with IpHluorin
Our initial experiments suggested that the accuracy of pH measurements might benefit from increased expression of pHluorin. To improve translation efficiency, the first 24 bp of comGA, with an ATG start codon, were fused to pHluorin by a polymerase chain reaction (PCR) with Pfu polymerase using primers IpHlu_2010_FW and IpHlu_2010_RV. This sequence was subsequently extended with a standard Shine–Dalgarno (SD) region (AAGGAGGAAGCAGGT; Joseph et al., 2001) using primers IpHlu_pDGA_FW. This SD-improved pHluorin (IpHluorin) was inserted between the HindIII and SalI sites of pDG148. This construct, pDG-IpHluorin, was transformed into B. subtilis PB2 and compared with PB2 carrying pDG-pHluorin to analyze expression levels and pH-dependent characteristics of pHluorin and IpHluorin. Also, a xylose-inducible, genome-integrated expression system was constructed. To this end, IpHluorin was inserted in pSG1729, between the AvrII and HindIII sites, thereby replacing GFP and placing IpHluorin under control of the xylose-inducible Pxyl promoter.
To monitor the pHi of B. subtilis for extended periods of time in different phases of its life cycle, without the need for externally supplied expression inducers, the promoter region of several growth phase-specific genes (PptsG, for vegetative cells growing on glucose, PspoIIA, specific for pre-septum, sporulating cells, PsspE, a fore-spore-specific gene, and PspoIIID, a mother cell-specific promoter) of B. subtilis were selected for their expression levels (Steil et al., 2005; Veening et al., 2006a). Approximately 500 bp upstream of the start codon were selected for cloning. By standardizing the SD region, we aimed to increase and standardize the expression levels of poorer promoter sites (Ozbudak et al., 2002; Botella et al., 2010). The promoter and SD-IpHluorin sequences were fused by a PCR and inserted in pSG1729, between the AvrII and HindIII sites, thereby replacing the GFP and placing IpHluorin under control of a B. subtilis promoter. All enzymes used were obtained from Fermentas (Thermo Fisher Scientific).
Bacillus subtilis PB2 was used as target for our transformations. B. subtilis cells were made transformation-competent as described before (Kunst and Rapoport, 1995). The newly constructed plasmids were integrated in the amyE locus as described (Lewis and Marston, 1999). All plasmids and oligonucleotides used in this study are listed in Tables 2 and 3.
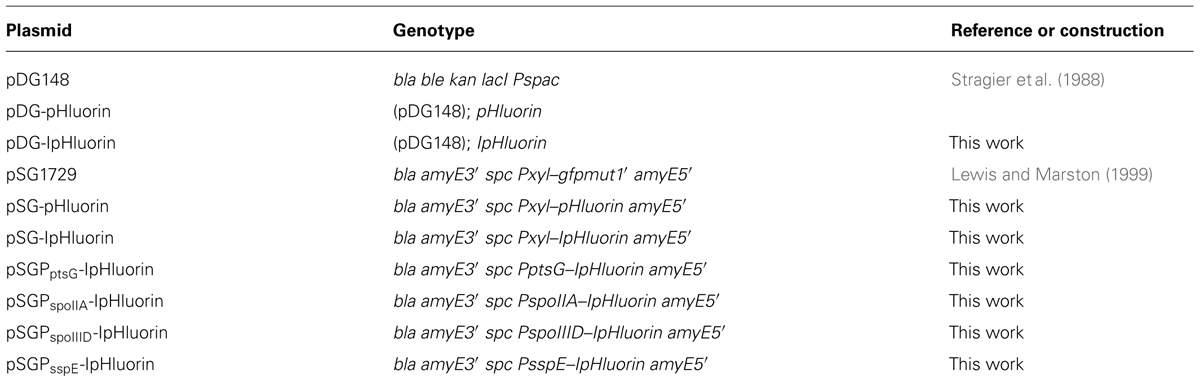
TABLE 2. Plasmids used in this study.
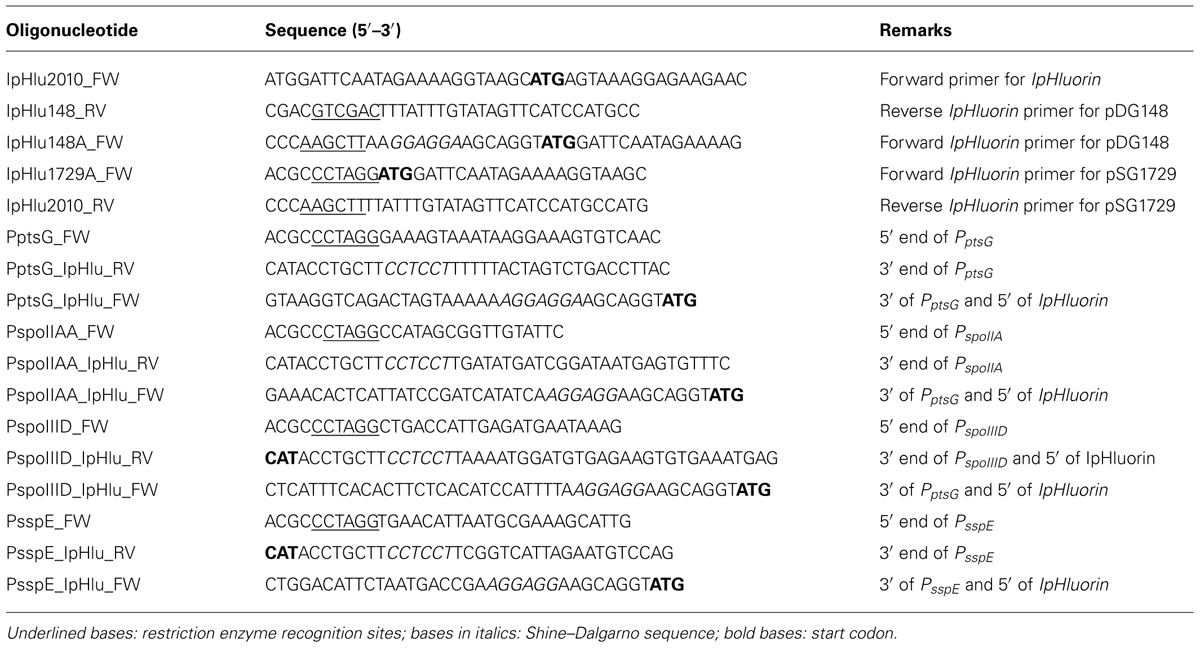
TABLE 3. Oligonucleotides used in this study.
Calibration of IpHluorin
Bacillus subtilis PB2 containing either pDG148, pDG-pHluorin or pDG-IpHluorin were grown to exponential phase in M3G at pH 7.0 containing 10 μg/ml kanamycin. Bacterial growth and expression levels of ratiometric pHluorin and IpHluorin were monitored in a FluoStar Optima (BMG Labtech, Germany) for 3 h after addition of 0–1 mM isopropyl β-D-1-thiogalactopyranoside (IPTG).
For calibration of the pH, expression of ratiometric pHluorin and IpHluorin was induced for 2.5 h by the addition of 1 mM IPTG. At OD600 = 0.4 the cells were centrifuged and resuspended in buffers with pH values ranging from 5.0 to 8.5 prepared from 0.1 M citric acid and 0.2 M K2HPO4. The intracellular and extracellular pH were equilibrated by the addition of 1 μM valinomycin and 1 μM nigericin (Breeuwer et al., 1996). Cells were transferred to black-walled microtiter plates and incubated at 37°C in a FluoStar Optima. OD600 was measured before start of the experiment. The ratio of emission intensity at 510 nm resulting from excitation at 390 and 470 nm (with photomultiplier gain set to 2,000) was calculated as described previously (Orij et al., 2011). Fluorescence and OD600 were monitored for 30 min, with measurements taken every 5 min. Calibration curves for pHluorin and IpHluorin were identical, with only minor fluctuations in fluorescence in time observed with pHluorin at pH = 8.5. From this, we concluded that the intracellular and extracellular pH had equilibrated rapidly. B. subtilis PB2 carrying pDG148 was measured for background fluorescence. Background fluorescence was subtracted at individual wavelengths before calculating the ratio. The calibration curve was determined by fitting the data of three independent biological replicates, each consisting of three technical replicates, with a polynomial curve of the third order.
Batch Measurements of pHi During Sporulation, Germination, and Outgrowth
To monitor pHi during growth and sporulation, all B. subtilis strains, wild-type (WT) (PB2) and those with IpHluorin fused to endogenous promoters were grown as described, in M3S without antibiotics, pH 7.0, to an OD600 = 0.1 in an incubator at 37°C under continuous agitation (200 rpm). Cell suspensions were diluted twofold by adding 50 μl of culture to 50 μl of medium in black microtiter plates which were then monitored in a FluoroStar Optima BMG (Labtech, Germany) at 37°C. OD600 and pH measurements were taken every 10 min for 48 h. The plates were shaken (200 rpm) in between measurements thus ensuring optimal growth (Ter Beek, 2009). For spore germination, washed spores were heat activated (30 min, 70°C, then cooled on ice) and subsequently mixed 1:1 with 2× concentrated M3 with or without glucose, containing weak organic acid (WOA) in predetermined concentrations. To trigger germination, 5 μl 20× concentrated AGFK (10 mM L-asparagine, 10 mM D-glucose, 1 mM D-fructose, 1 mM KCl; Wax and Freese, 1968) was added. Microtiter plates were placed in a FluoStar Optima (BMG Labtech, Germany) at 37°C and shaken between measurements (200 rpm). Growth was monitored for 2–12 h, with pH and OD600 measurements taken every 10 min.
Microscopy
To verify if expression of IpHluorin was correctly localized, B. subtilis cells were cultured as described above for batch measurements at pH = 7.0. All strains were grown as described to exponential phase or for 16–24 h to observe sporulating cells. Cells were immobilized on 1% agarose (Koppelman et al., 2004), and photographed with a CoolSnap fx (Photometrics) charge-coupled device (CCD) camera mounted on an Olympus BX-60 fluorescence microscope through an UPLANFl 100×/1.3 oil objective (Japan) with a 41017 - Endow GFP/EGFP Bandpass filter (Chroma Technology Corp., Bellows Falls, VT, USA).
Results
Improved Expression of pHluorin
Many microorganisms have an internal (cytosolic and/or mitochondrial) pH between 7 and 8 (Orij et al., 2009; Slonczewski et al., 2009) during optimal growth and maintaining pH homeostasis is of vital importance for most, including B. subtilis where pHi differences have been inferred for its various developmental phases. We now used the pH-sensitive GFP pHluorin, developed for yeast (Miesenböck et al., 1998), to directly measure on-line the pHi dynamics in B. subtilis. Codon usage of this GFP was not optimized for B. subtilis and our initial experiments suggested that expression might be improved. It was shown previously that addition of the first eight amino acids of comGA improved translation initiation efficiency of CFP and YFP in B. subtilis (Veening et al., 2004). We used this approach to construct improved pHluorin (IpHluorin; Figure 1A).
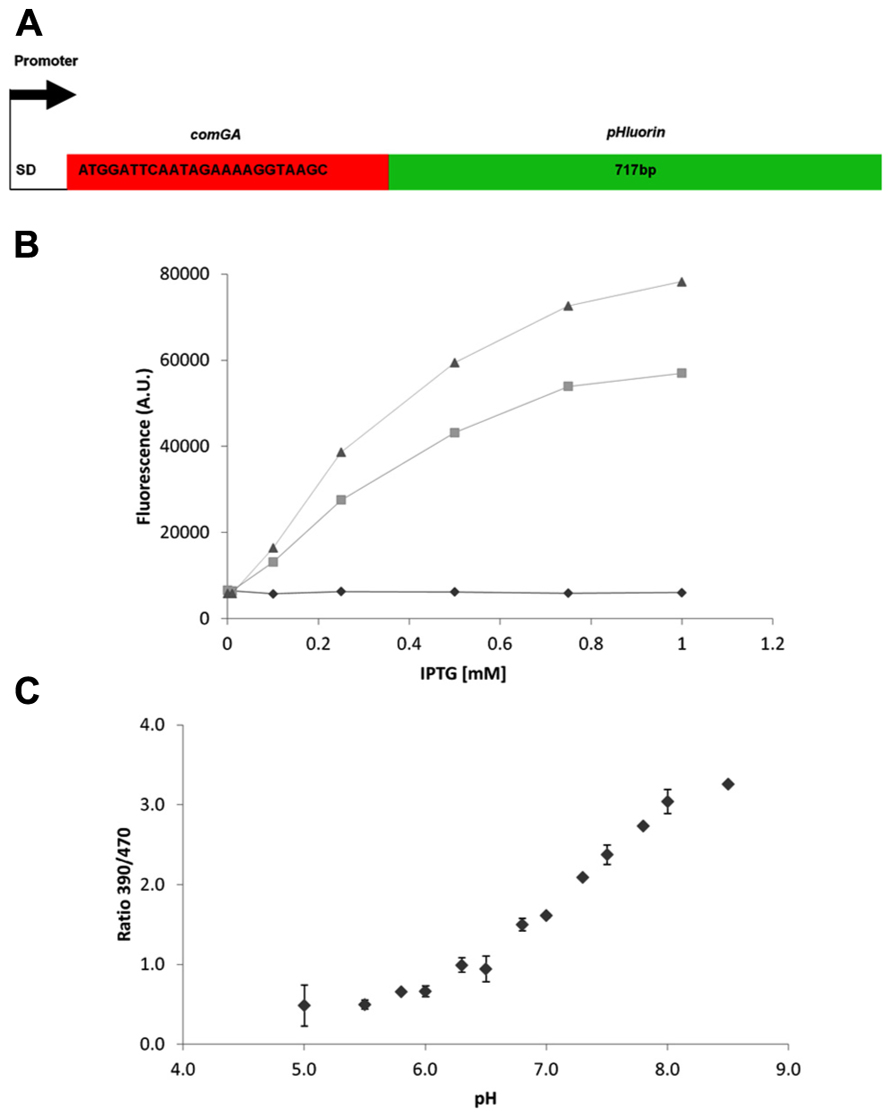
FIGURE 1. Improved expression of pHluorin in B. subtilis. (A) Schematic overview of the improved pHluorin construct. SD – Shine–Dalgarno sequence. comGA – the first 24 bp of comGA, with the start codon converted to ATG. (B) Expression levels of pHluorin and improved pHluorin after induction with IPTG. Fluorescence (AU, arbitrary units) at 510 nm from excitation at 390 nm was measured after 2.5 h of induction and normalized to OD600. Diamonds, control (pDG148); squares, pHluorin (pDG-pHluorin); triangles, IpHluorin (pDG-IpHluorin). (C) Calibration curve for IpHluorin. Error bars indicate standard deviations (n = 3).
To analyze fluorescence intensity of Bacillus cells harboring pDG148, pDG-pHluorin, or pDG-IpHluorin cells were transferred to microtiter plates containing 0–1 mM IPTG to induce expression. Cell growth was monitored for 3 h, together with fluorescence emission at 510 nm upon excitation at 390 and 470 nm. The three strains compared had identical growth rates (not shown). Fluorescence intensity after 2.5 h is shown in Figure 1B, and depended on the concentration of IPTG. Cells expressing IpHluorin had the highest signal intensity at 1 mM IPTG, approximately 40% higher than pHluorin under the same conditions. The most important characteristic of pHluorin is its shift in excitation wavelength depending on the pH of its surroundings. To establish if the addition of eight amino acids at the N-terminus would alter these characteristics, calibration curves for pHluorin and IpHluorin were made (Figure 1C for IpHluorin, not shown for pHluorin). Both growth rate and the ratiometric characteristics were similar and allowed reliable pHi readings in a range between pH 5 and 8.5 in live B. subtilis cultures.
The Internal pH Varies with Growth Phase
The cytosolic pH is a crucial parameter for bacteria because it modulates the activity of many enzymes (Vojinovic and Von Stockar, 2009) and in many species plays a crucial role in generating the proton-motive force (Shioi et al., 1980; Slonczewski et al., 2009). To monitor pHi during various stages of growth in Bacillus, we fused promoters of strongly expressed, growth phase-specific genes to IpHluorin. This allowed us to measure pHi of B. subtilis without addition of inducers such as IPTG or xylose (Figures 2A–H). The selected promoters and their specific expression phase are shown in Table 4.
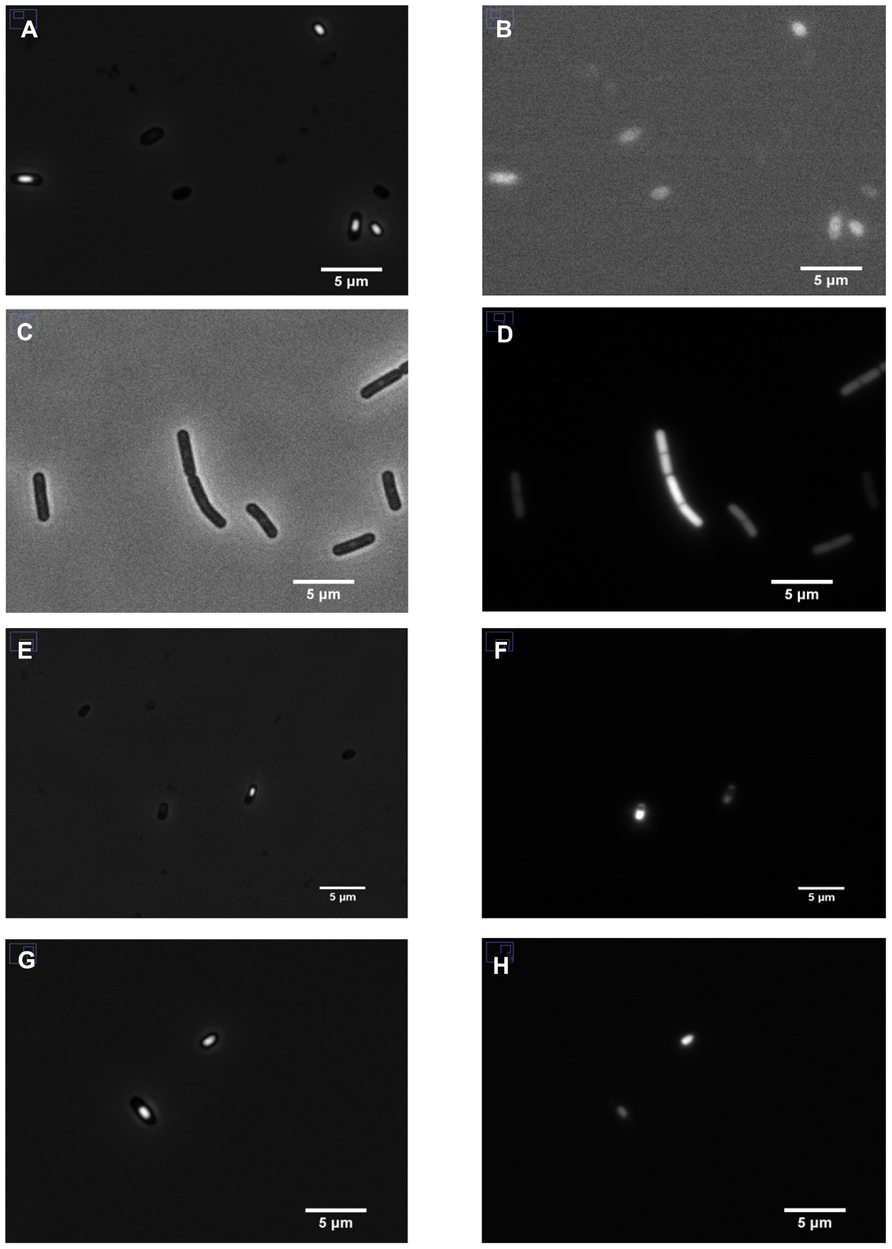
FIGURE 2. Expression of IpHluorin in B. subtilis PB2. Left panels: phase-contrast images; right panels: corresponding fluorescent signals. (A,B) Non-transformed cells; (C,D) PptsG-IpHluorin-expressing cells; (E,F) sporulating cells expressing PspoIIID-IpHluorin; (G,H) sporulating cells expressing PB2 PsspE-IpHluorin.
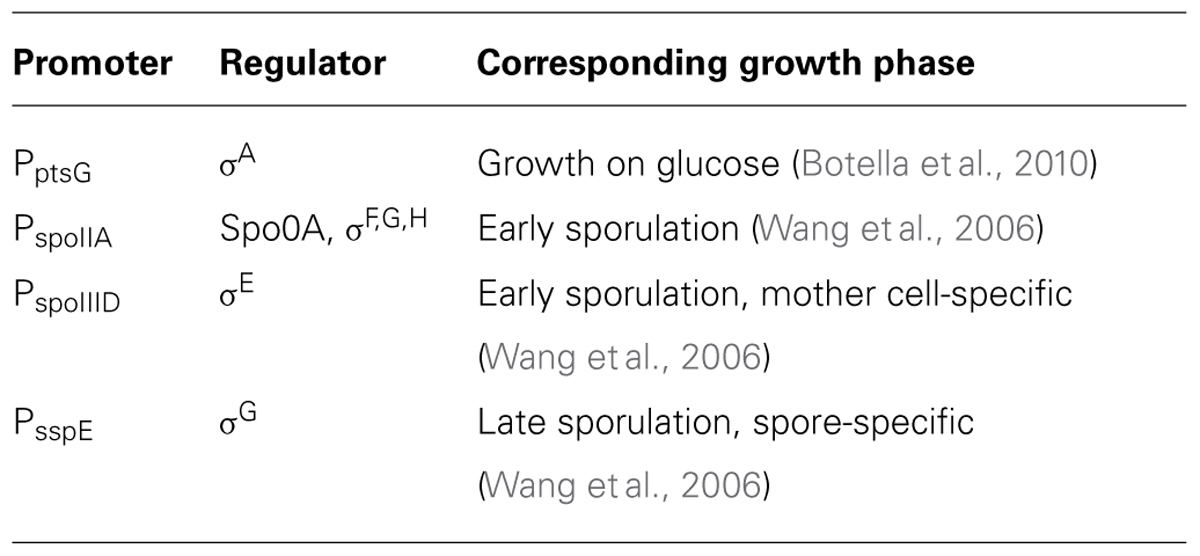
TABLE 4. Promoters used for IpHluorin expression.
To monitor the pHi during growth in minimal medium with glucose as the only carbon source, we used the promoter of ptsG, which encodes the glucose-specific enzyme II of the carbohydrate:phosphotransferase system to drive IpHluorin expression. PptsG is a strong promoter during vegetative growth on glucose (Botella et al., 2010). Expression of IpHluorin from the PptsG promoter follows the growth curve closely (Figure 3A). When the cells die or move into stationary phase (after 7.5 h), the signal intensity remains high and stable. The sporulation-specific promoters (Figure 4B) are activated after the drop in OD600, signifying the onset of sporulation.
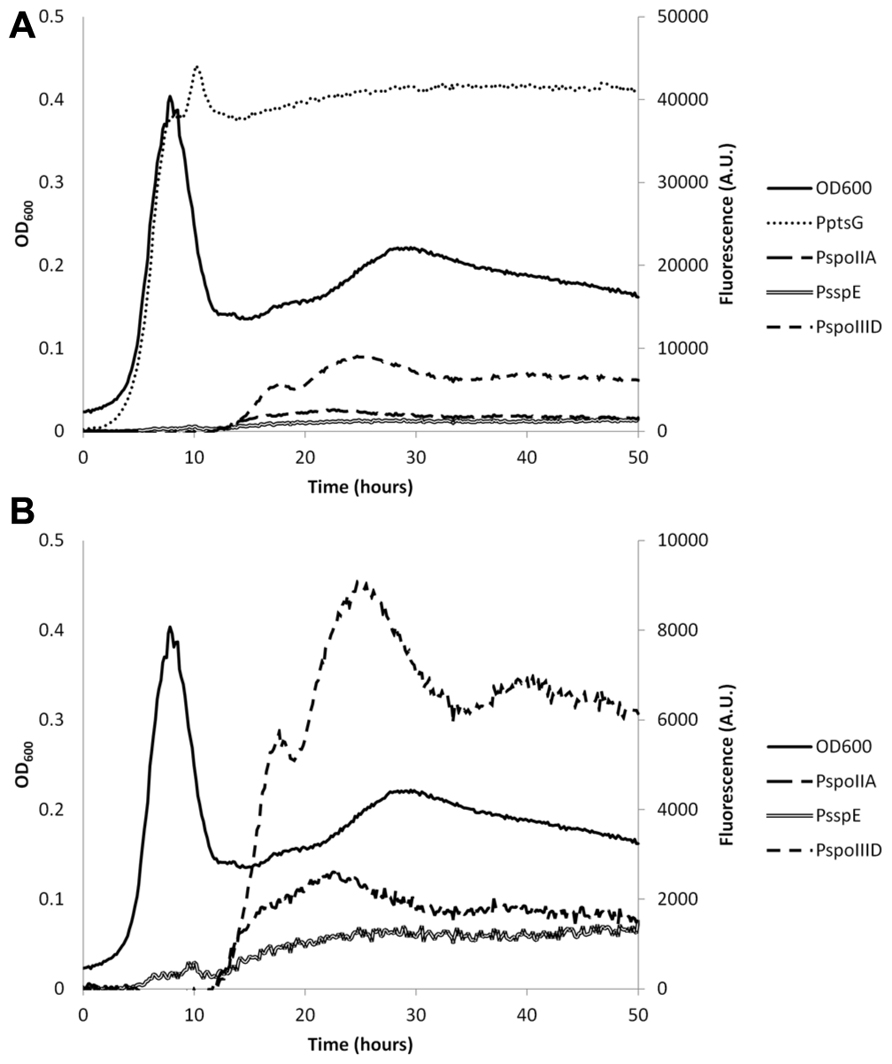
FIGURE 3. Representative example of the expression levels of IpHluorin from different promoters during different growth stages. (A) Fluorescence levels from excitation at 390 nm and emission at 510 nm from different promoters used. (B) Identical to (A), but without PptsG-IpHluorin. Expression of IpHluorin from sporulation-specific promoters starts only after the drop in OD600.
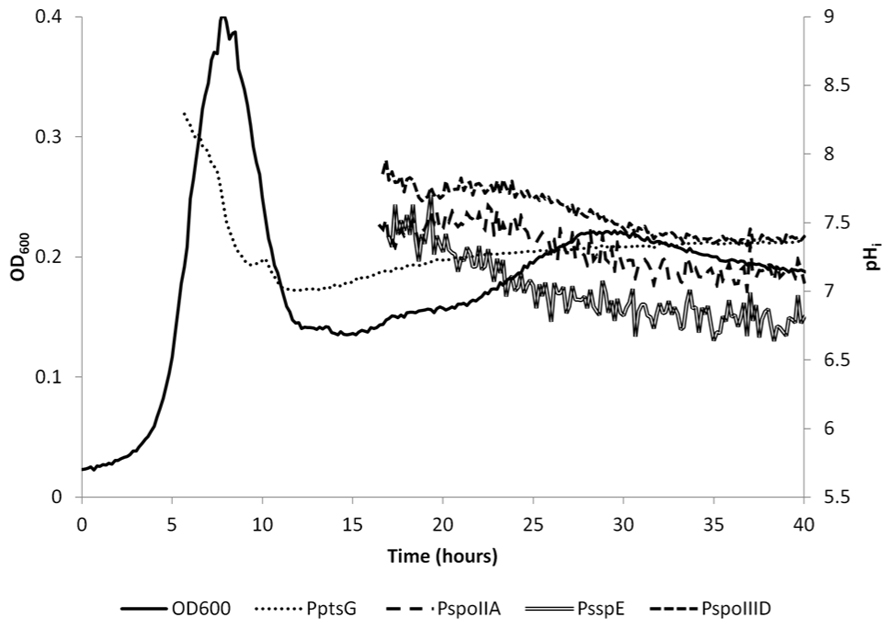
FIGURE 4. Internal pH as measured with IpHluorin expressed from different promoters. The pH is calculated from when the 390 nm channel exceeded 1,000 units. pH from the spore-specific promoters is calculated from approximately 17 h onward. Lines represent actual data from a representative example.
The pHi of B. subtilis reaches its highest value of around 8 during exponential growth. This value is in agreement with earlier reported values ranging from pH = 7.8 to 8.1 (Setlow and Setlow, 1980; Magill et al., 1994). At the drop in OD600, cells either die or differentiate and initiate sporulation or remain in stationary phase. This was accompanied by an apparent steep decrease in pHi, to 7.0 in vegetative cells expressing IpHluorin from PptsG. Likely, this at least partially is indicative for cell lysis as a strong fluorescent signal could also be detected in the medium after spinning down the cells. Additionally, it is possible that morphological changes of the cell affect their optical properties. Sporulating cells are, for instance, smaller than exponentially growing cells. Hence, after sporulation commences, the pH values observed with PptsG-IpHluorin can no longer be considered an accurate estimate of the intracellular pH in vegetative cells. Apart from aberrant values due to cell lysis, the PptsG-driven IpHluorin may also get trapped in sporulating cells so that the observed pH from PptsG-driven IpHluorin is the average of sporulating and non-sporulating cells as well as the medium. Subsequently, the OD600 rose again slowly and the apparent pH increased to 7.4 (Figure 3). We do not know from which cells this signal originates as it may represent the average of various differentiation types, all expressing IpHluorin. To deconvolute these signals, single cell measurements are needed.
Sporulation-Specific Expression of IpHluorin
Sporulation of B. subtilis is a well-described, carefully orchestrated process where a number of different sigma factors are activated during subsequent stages (Wang et al., 2006). It has been reported that the pHi of Bacillus spores is lower than that of vegetative cells (Magill et al., 1994). We set out to measure the pH in spores and at what stage in sporulation the drop in pH starts and when the pH would rise again during germination. For this purpose, we constructed strains with early and late (pre)spore-specific expression of IpHluorin. We selected promoters that would be active in the pre-spore and mother cell at different times during sporulation to monitor pHi of both cells separately. Expression from PspoIIA, PspoIIID, and PsspE starts after the drop in OD600. The surviving cells may prepare for diauxic growth or sporulation (Veening et al., 2008). This characteristic allowed us to measure differences in pHi in both mother cell and pre-spore in the subpopulation that initiates sporulation. Expression levels from PspoIIA, PspoIIID, and PsspE are lower than of PptsG, but are still reliable and strong enough to allow pH monitoring (Figures 3A,B). For the sporulation-specific promoters, a cut-off of 1,000 arbitrary units in the 390 to 510 nm fluorescence channel was used for pHi calculations.
SpoIIA is activated by high levels of activated Spo0A and its presence was shown to be a reliable indicator for cells that initiate sporulation (Veening et al., 2005). Indeed, a fluorescent signal of a GFP reporter under control of the SpoIIA promoter can be found in both mother cell and fore-spore (our unpublished observations; Veening et al., 2006b). Expression of genes in the mother cell regulated by PspoIIID follows that of those regulated by PspoIIA, as expected, but because expression levels of PspoIIID-controlled IpHluorin are higher, reliable pHi measurements can be obtained earlier with the latter. Initially, the sporulating subpopulation had a pHi that closely resembled the pHi of exponentially growing cells measured with the PptsG-IpHluorin strain. The mother cell (PspoIIID-IpHluorin) had a pH of 7.8 after 17 h of incubation. IpHluorin expressed from the spore-specific promoter PsspE revealed pH values of 7.4. The mother cell-specific expression of IpHluorin from the spoIIID promoter decreased after 25 h of culture. At that time point and from then onward, an apparent decrease measured with the mother cell-specific promoter driving IpHluorin expression was observed. This data, however, may at least partially be influenced by mother cell lysis and release of IpHluorin into the medium. The inferred pH at 40 h of culture closely resembled medium pH, corroborating this notion.
The decrease in pHi in the fore-spore (PsspE-IpHluorin) drops below the medium pH and its fluorescent signal can clearly be observed inside maturing spores (Figure 2H). Noticeably, spores have a very low water activity and optical properties dissimilar from vegetative cells, which may obscure the pH as defined as the number of free protons (Sunde et al., 2009).
Our data indicates that at 17.5 h of culture, the pHi of the fore-spore is 7.4, as reported by PsspE-IpHluorin. After 40 h, the pH value of 6.8 reported by PsspE-IpHluorin is approaching the reported value for Bacillus spores (pHi = 6.0 ± 0.3; Barton et al., 1980; Setlow and Setlow, 1980; Magill et al., 1994, 1996). Likely, because at this time point the population is still a mix of some fore-spore-containing cells as well as many free spores, the observed pH is slightly higher than the reported values for isolated Bacillus spores. Corroborating this, when we washed and isolated the spores our pHluorin-based measurement of the pHi of B. subtilis spores also indicated values around 6.0 ± 0.3 (see, e.g., pHi data of time point 0 obtained with IpHluorin driven by PsspE in Figure 5 and beyond).
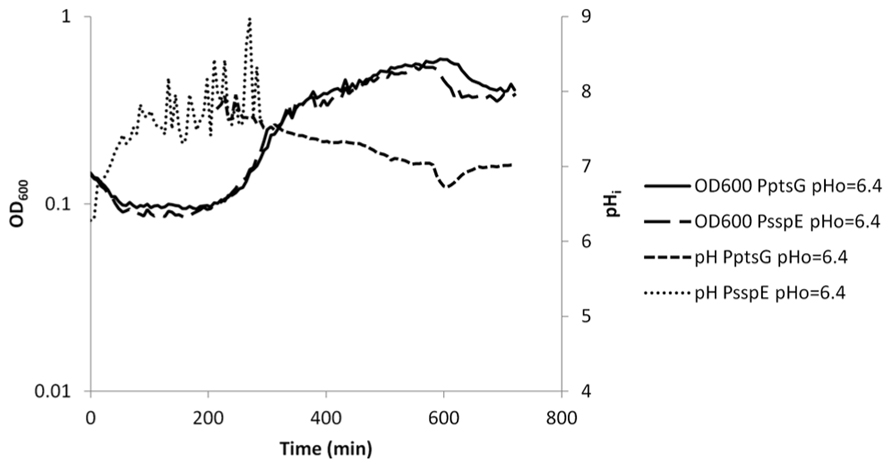
FIGURE 5. Internal pH during spore germination and outgrowth. IpHluorin accumulated in the spores (from expression controlled by PsspE) allows pH measurements from t = 0 to approximately 300 min. Expression of IpHluorin from PptsG allows calculation of the pHi from approximately 200 min. Data are from a representative example of germination and outgrowth of B. subtilis spores at an external pH of 6.4.
Internal pH During Spore Germination and Outgrowth
As described above, IpHluorin expressed from PsspE accumulates in mature spores. Germination and outgrowth were monitored used B. subtilis PB2 PsspE-IpHluorin and B. subtilis PB2 PptsG-IpHluorin. When germination is triggered by addition of a mixture of asparagine, glucose, fructose and potassium (AGFK), the OD600 of the spore crop drops, because the refractile spores turn phase-dark, due to water uptake. Simultaneously, the spore’s pHi rises. Depending on the medium pH, the pHi rises to 7.0–7.4 (Figure 5 and our unpublished observations for germination at pH 7.4, respectively). In the case of germination at pH = 6.4, this indicates the establishment of a pH gradient. Not all spores germinate at the same time, and significant heterogeneity can be observed in the timing of germination and outgrowth (Smelt et al., 2008). Since this is a mixed population, consisting of phase-bright and germinating spores, the actual pH change in individual germinating spores may differ.
During the lag phase between germination and outgrowth, the ptsG promoter is activated. Parallel expression of IpHluorin from this promoter shows that the pH measured this way lies between 7.5 and 7.8. This range of pH values is maintained during exponential growth. A generally observed slow decrease in pH may be due to acidification of the medium by acetic acid or CO2 (Russell and Diez-Gonzalez, 1998; Orij, 2010). After approximately 600 min, there is a sudden drop in pH and OD600 as described above (Figure 5).
Germination with medium pH = 7.4 shows a more rapid decrease in OD600 and an equally faster rise in pHi. Also, when outgrowth commences, pHi of these cells is higher, but follows a similar trend as with medium at pH = 6.4.
Internal pH During Spore Germination with Weak Acid Stress
Dormant spores are highly resistant to antimicrobial treatment, but also metabolically inert (Brul and Coote, 1999). When germination is triggered, the spore becomes more sensitive. Also, it has been observed that germination of Bacillus spores can be inhibited by various preservatives (Cortezzo et al., 2004; Van Melis et al., 2011). When spores start to germinate, they release protons and the pHi rises. Also, during this stage water is taken up and metabolism should be restarted. These processes might be a target moment for WOAs to halt outgrowth of the germinating spore.
Acetic and sorbic acid are amongst the most commonly used food preservatives (Stratford et al., 2009; Ter Beek and Brul, 2010; Ullah et al., 2012). While both WOAs have a similar pKa value, sorbic acid is clearly the more potent antimicrobial compound. We compared the effects of sorbic and acetic acid on germination and outgrowth by using concentrations of both acids that had a similar effect on growth rate (Ter Beek, 2009). Low concentrations of both acids reduced the exponential growth rate by approximately 50%. Spores germinating in medium (pH = 6.4) with 3 mM K-sorbate had a decreased rate of pHi increase. In controls the pHi increase between the start of germination and t = 90 min was 1.4 units whilst with 3 mM K-sorbate this was 0.7 units. At the onset of the exponential phase, the pHi which gradually decreased from pH = 7.4 to 7.2 at t = 11 h (Figure 6A). Twenty-five millimolars of K-acetate allowed a rapid increase in pHi during germination. The pHi during exponential growth remained stable at 7.2 during the experiment (Figure 7A).
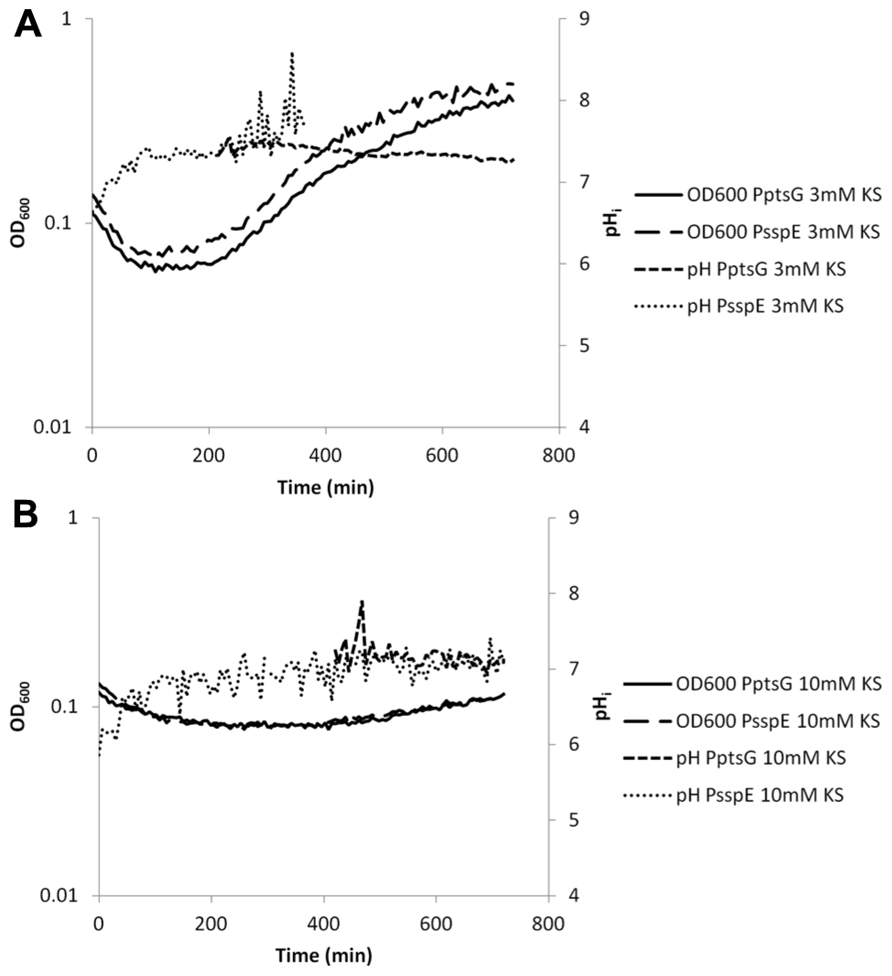
FIGURE 6. Internal pH during spore germination and outgrowth. IpHluorin accumulated in the spores (from expression controlled by PsspE) allows pH measurements from t = 0 to approximately 300 min. Expression of IpHluorin from PptsG allows calculation of the pHi from approximately 200 min. Data are from a representative example. (A) Ge rmination and outgrowth of B. subtilis spores at an external pH = 6.4 with 3 mM KS. (B) Germination and outgrowth of B. subtilis spores at an external pH = 6.4 with 10 mM KS.
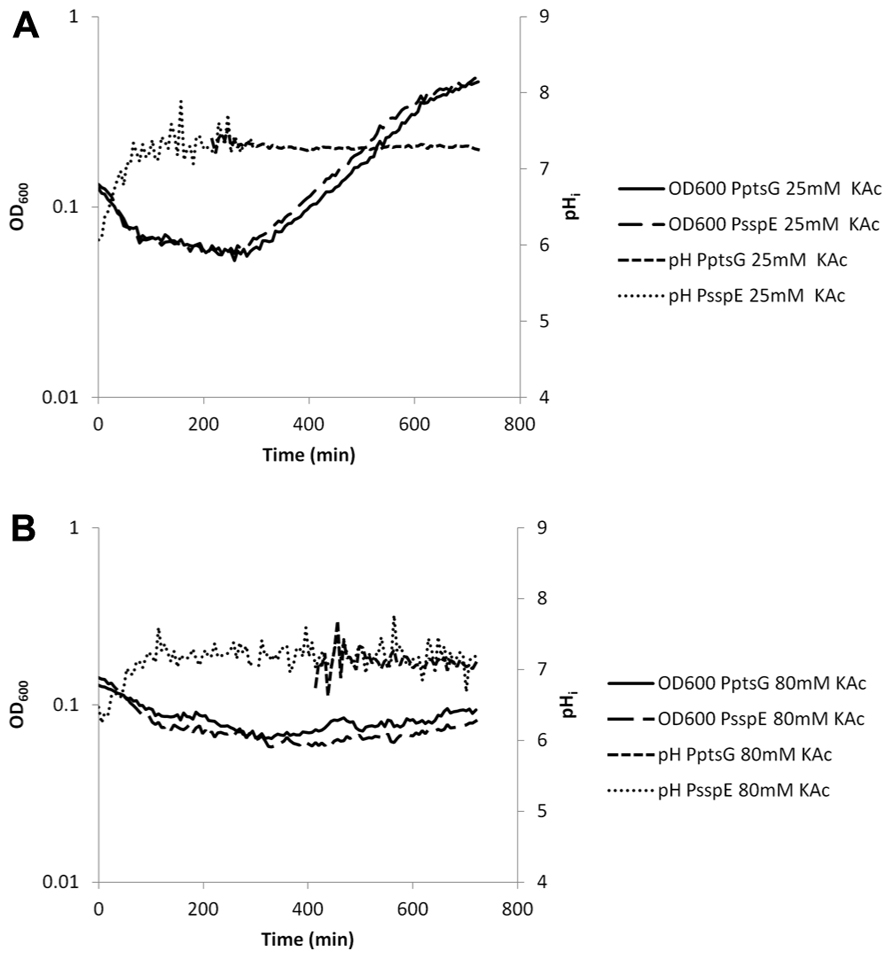
FIGURE 7. Internal pH during spore germination and outgrowth. IpHluorin accumulated in the spores (from expression controlled by PsspE) allows pH measurements from t = 0 to approximately 300 min. Expression of IpHluorin from PptsG allows calculation of the pHi from approximately 200 min. Data are from a representative example. (A) Germination and outgrowth of B. subtilis spores at an external pH = 6.4 with 25 mM KAc. (B) Germination and outgrowth of B. subtilis spores at an external pH = 6.4 with 80 mM KAc.
High concentrations of WOAs were selected to reduce growth by 85%. PptsG-driven expression of IpHluorin is delayed under these conditions, while spore-specific IpHluorin can be observed for longer periods of time because the signal is not diluted out. K-sorbate (10 mM) is shown to delay the maximum drop in OD600 indicative for spore germination. The data in Figure 6B show a drop from OD600 0.13 to 0.08 in 216 min rather than from 0.13 to 0.07 in 84 min as was seen in the control shown in Figure 5. The rise of the pHi was here similarly delayed as was the case with 3 mM K-sorbate. Such effects were not seen with 80 mM K-acetate, although the reduction in growth rate is similar (Figure 7B).
To further confirm the observation that sorbic acid inhibited the development of a positive inside pH gradient, spores of B. subtilis PB2 PsspE-IpHluorin were incubated with identical concentrations of either sorbic or acetic acid in medium without glucose other than present as germinant. When germination was triggered by addition of AGFK, spores incubated with sorbic acid showed a clear concentration dependant reduction in OD600 drop-rate as well as a reduced pHi increase-rate. The OD drop-rate decreased from 80 × 10-3 to 40 × 10-3 OD600/min when 0.5 mM undissociated sorbic acid was present (Figure 8B). Such effects were not seen with acetic acid at identical concentrations, which behaved virtually identical to non-stressed germinating spores (Figures 8A,C). These observations are in agreement with earlier reports stating that sorbic acid can specifically inhibit germination of B. cereus and B. subtilis, likely by interacting with germinant receptors (Cortezzo et al., 2004; Van Melis et al., 2011).
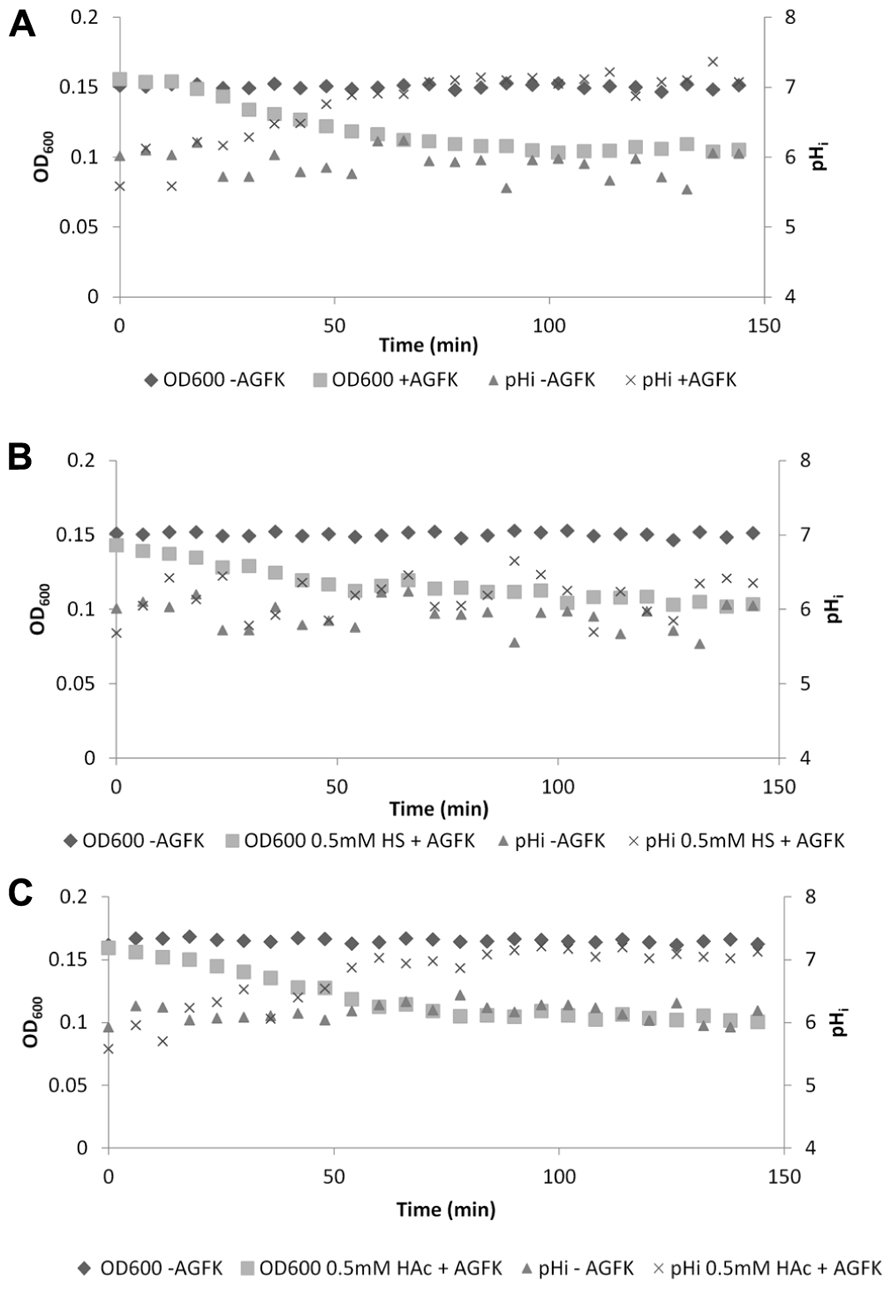
FIGURE 8. OD600 and internal pH during germination of B. subtilis PB2 PsspE-IpHluorin spores in medium without glucose (pHo = 6.4). Data are from a representative example. (A) Germination with AGFK; (B) germination with AGFK in 0.5 mM sorbic acid; (C) germination with AGFK in 0.5 mM acetic acid.
Discussion
We show here that IpHluorin is an accurate, versatile probe to investigate the pHi of B. subtilis. We were able to improve expression of pHluorin by fusion of the first 24 bp of comGA with the pHluorin-encoding gene. Genomic integration of IpHluorin resulted in more homogeneous expression levels compared to a multi-copy plasmid. It also resulted in a more stable construct, not requiring antibiotics for maintenance of the IpHluorin gene during extended periods of growth (not shown). The use of genomically integrated constructs with endogenous promoters for the expression of IpHluorin resulted in a strong enough signal for accurate pH measurements during exponential growth on glucose as well as compartment-specific pHi measurements during sporulation. The IpHluorin that accumulates in the spore under control of PsspE allows pHi measurements of the B. subtilis spore. During spore germination and outgrowth, the signal from IpHluorin, expressed from PsspE overlaps slightly in time with PptsG-IpHluorin expression, thus allowing continuous pHi monitoring during germination and outgrowth in batch. The pH values we have observed here closely resemble those found with other methods. During exponential growth, the pHi approaches pH = 8. The pHi of B. subtilis spores was also found to lie at approximately pH = 6. Despite the fact that expression levels of IpHluorin are much lower in spores, the pH value observed again closely corresponds to earlier reported values. The notion that during outgrowth a pH is observed that closely resembles the pHi during exponential growth (as observed with PptsG-IpHluorin) further corroborates the accuracy of our method.
Other methods to measure pHi generally involve compounds that are hydrophobic and have WOA groups and may act as uncouplers, thereby depleting the ΔpH and influencing ΔΨ over the membrane. They are also more labor-intensive when high temporal resolution is required and except for fluorescent dyes do not allow cell type-specific pH measurements. However, these methods require long-term incubation with the dye plus extensive washing, taking up to 20 min to prepare the sample. Future studies will have to determine the phototoxicity and bleach rate of IpHluorin in individual (growing, sporulating, and germinating) cells.
We have observed clear differences in pHi between PptsG-IpHluorin and sporulation-specific IpHluorin. It has been shown that within a growing population of B. subtilis cells, differentiation occurs (Veening et al., 2006a, b) and this may affect metabolic state and pHi. This heterogeneity cannot be clearly monitored in batch without the use of more specific promoters or single cell observations. Also during spore germination such heterogeneity is seen (Smelt et al., 2008), so our results show the average of a germinating population.
During spore germination, the pHi increases due to release of protons (Swerdlow et al., 1981). This process follows the drop in OD600, and results from H2O uptake and release of DPA. Our results show that a ΔpH is established rapidly. Such an increased pH can reactivate PGM, thus allowing the utilization of the spore’s 3-PGA store (Magill et al., 1994).
Taken together, our results show accurate, long-term pHi monitoring in growing and sporulating B. subtilis cultures as well as during spore germination. The pHi of sporulating cells is as high as that of exponentially growing cells. This is particularly the case for the mother cell. The pre-spore pHi drops to pH = 6.0, however. The PptsG-IpHluorin strain can be used for many experiments where the pHi needs to be measured in cells growing on glucose, without the need for additional inducers like IPTG. Also, antibiotics are not strictly necessary. The sporulation-specific IpHluorin-expressing strains may give more insight in compartmentalization during sporulation, while the PsspE-IpHluorin strain may also help understanding spore germination characteristics in the presence of potential outgrowth inhibitors such as the WOAs sorbic acid and acetic acid.
Clearly, because not all cells are in exactly the same state, these data represent the average value of the pHi in the population studies. To analyze the heterogeneity single-spore pHi measurements are needed. Currently we are extending our single cell live imaging tool “SporeTracker” (Pandey et al., 2013) to that end.
Conflict of Interest Statement
The authors declare that the research was conducted in the absence of any commercial or financial relationships that could be construed as a potential conflict of interest.
Acknowledgments
Tanneke den Blaauwen and Jolanda Verheul are thanked for usage of and assistance with the microscopy facilities of the department of Molecular Cytology at the University of Amsterdam. Frans Klis and Gertien Smits are acknowledged for critically reading initial versions of the manuscript. Alex Ter Beek and Janneke Wijman are acknowledged for initial experiments with pHluorin and many stimulating discussions on Bacillus subtilis acid stress physiology.
References
Barton, J. K., Den Hollander, J. A., Lee, T. M., MacLaughlin, A., and Shulman, R. G. (1980). Measurement of the internal pH of yeast spores by 31P nuclear magnetic resonance. Proc. Natl. Acad. Sci. U.S.A. 77, 2470–2473. doi: 10.1073/pnas.77.5.2470
Botella, E., Fogg, M., Jules, M., Piersma, S., Doherty, G., Hansen, A., et al. (2010). pBaSysBioII: an integrative plasmid generating gfp transcriptional fusions for high-throughput analysis of gene expression in Bacillus subtilis. Microbiology (UK) 156, 1600–1608. doi: 10.1099/mic.0.035758-0
Breeuwer, P., Drocourt, J., Rombouts, F. M., and Abee, T. (1996). A novel method for continuous determination of the intracellular pH in bacteria with the internally conjugated fluorescent probe 5 (and 6-)-carboxyfluorescein succinimidyl ester. Appl. Environ. Microbiol. 62, 178–183.
Brul, S., and Coote, P. (1999). Preservative agents in foods. Mode of action and microbial resistance mechanisms. Int. J. Food Microbiol. 50, 1–17. doi: 10.1016/S0168-1605(99)00072-0
Bulthuis, B. A., Koningstein, G. M., Stouthamer, A. H., and Van Verseveld, H. W. (1993). The relation of proton motive force, adenylate energy charge and phosphorylation potential to the specific growth rate and efficiency of energy transduction in Bacillus licheniformis under aerobic growth conditions. Antonie Van Leeuwenhoek 63, 1–16. doi: 10.1007/BF00871725
Casadaban, M. J., and Cohen, S. N. (1980). Analysis of gene control signals by DNA fusion and cloning in Escherichia coli. J. Mol. Biol. 138, 179–207. doi: 10.1016/0022-2836(80)90283-1
Cortezzo, D. E., Setlow, B., and Setlow, P. (2004). Analysis of the action of compounds that inhibit the germination of spores of Bacillus species. J. Appl. Microbiol. 96, 725–741. doi: 10.1111/j.1365-2672.2004.02196.x
Cruciat, C.-M., Ohkawara, B., Acebron, S. P., Karaulanov, E., Reinhard, C., Ingelfinger, D., et al. (2010). Requirement of prorenin receptor and vacuolar H+-ATPase-mediated acidification for Wnt signaling. Science 327, 459–463. doi: 10.1126/science.1179802
Eichenberger, P., Fujita, M., Jensen, S. T., Conlon, E. M., Rudner, D. Z., Wang, S. T., et al. (2004). The program of gene transcription for a single differentiating cell type during sporulation in Bacillus subtilis. PLoS Biol. 2:e328. doi: 10.1371/journal.pbio.0020328
Ferguson, W. J., Braunschweiger, K. I., Braunschweiger, W. R., Smith, J. R., McCormick, J. J., Wasmann, C. C., et al. (1980). Hydrogen ion buffers for biological research. Anal. Biochem. 104, 300–310. doi: 10.1016/0003-2697(80)90079-2
Good, N. E., Winget, G. D., Winter, W., Connolly, T. N., Izawa, S., and Singh, R. M. (1966). Hydrogen ion buffers for biological research. Biochemistry 5, 467–477. doi: 10.1021/bi00866a011
Hilbert, D. (2004). Compartmentalization of gene expression during Bacillus subtilis spore formation. Microbiol. Mol. Biol. 68, 234–262. doi: 10.1128/MMBR.68.2.234-262.2004
Joseph, P., Fantino, J. R., Herbaud, M. L., and Denizot, F. (2001). Rapid orientated cloning of a shuttle vector allowing modulated gene expression in Bacillus subtilis. FEMS Microbiol. Lett. 205, 91–97. doi: 10.1111/j.1574-6968.2001.tb10930.x
Keijser, B. J. F., Ter Beek, A., Rauwerda, H., Schuren, F., Montijn, R., Van der Spek, H., et al. (2007). Analysis of temporal gene expression during Bacillus subtilis spore germination and outgrowth. J. Bacteriol. 189, 3624–3634 doi: 10.1128/JB.01736-06
Koppelman, C.-M., Aarsman, M. E. G., Postmus, J., Pas, E., Muijsers, A. O., Scheffers, D.-J., et al. (2004). R174 of Escherichia coli FtsZ is involved in membrane interaction and protofilament bundling, and is essential for cell division. Mol. Microbiol. 51, 645–657. doi: 10.1046/j.1365-2958.2003.03876.x
Krulwich, T. A., Ito, M., Hicks, D. B., Gilmour, R., and Guffanti, A. A. (1998). pH homeostasis and ATP synthesis: studies of two processes that necessitate inward proton translocation in extremely alkaliphilic Bacillus species. Extremophiles 2, 217–222. doi: 10.1007/s007920050063
Krulwich, T. A., Sachs, G., and Padan, E. (2011). Molecular aspects of bacterial pH sensing and homeostasis. Nat. Rev. Microbiol. 9, 330–343. doi: 10.1038/nrmicro2549
Kunst, F., and Rapoport, G. (1995). Salt stress is an environmental signal affecting degradative enzyme synthesis in Bacillus subtilis. J. Bacteriol. 177, 2403–2407.
Leuschner, R. G., and Lillford, P. J. (2000). Effects of hydration on molecular mobility in phase-bright Bacillus subtilis spores. Microbiology (UK) 146, 49–55.
Lewis, P. J., and Marston, A. L. (1999). GFP vectors for controlled expression and dual labelling of protein fusions in Bacillus subtilis. Gene 227, 101–110. doi: 10.1016/S0378-1119(98)00580-0
Magill, N. G., Cowan, A. E., Koppel, D. E., and Setlow, P. (1994). The internal pH of the forespore compartment of Bacillus megaterium decreases by about 1 pH unit during sporulation. J. Bacteriol. 176, 2252–2258.
Magill, N. G., Cowan, A. E., Leyva-Vazquez, M. A., Brown, M., Koppel, D. E., and Setlow, P. (1996). Analysis of the relationship between the decrease in pH and accumulation of 3-phosphoglyceric acid in developing forespores of Bacillus species. J. Bacteriol. 178, 2204–2210.
Miesenböck, G., De Angelis, D. A., and Rothman, J. E. (1998). Visualizing secretion and synaptic transmission with pH-sensitive green fluorescent proteins. Nature 394, 192–195. doi: 10.1038/28190
Orij, R. (2010). On the Intracellular pH of Baker’s Yeast. Ph.D. thesis, University of Amsterdam, Amsterdam.
Orij, R., Brul, S., and Smits, G. J. (2011). Intracellular pH is a tightly controlled signal in yeast. Biochim. Biophys. Acta 1810, 933–944. doi: 10.1016/j.bbagen.2011.03.011
Orij, R., Postmus, J., Ter Beek, A., Brul, S., and Smits, G. J. (2009). In vivo measurement of cytosolic and mitochondrial pH using a pH-sensitive GFP derivative in Saccharomyces cerevisiae reveals a relation between intracellular pH and growth. Microbiology (UK) 155, 268–278. doi: 10.1099/mic.0.022038-0
Ozbudak, E. M., Thattai, M., Kurtser, I., Grossman, A. D., and Van Oudenaarden, A. (2002). Regulation of noise in the expression of a single gene. Nat. Genet. 31, 69–73. doi: 10.1038/ng869
Padan, E., and Schuldiner, S. (1987). Intracellular pH and membrane potential as regulators in the prokaryotic cell. J. Membr. Biol. 95, 189–198. doi: 10.1007/BF01869481
Pandey, R., Ter Beek, A., Vischer, N. O. E., Smelt, J., Brul, S., and Manders, E. M. M. (2013). Live cell imaging of germination and outgrowth of individual Bacillus subtilis spores; the effect of heat stress quantitatively analyzed with SporeTracker. PLoS ONE 8:e58972. doi: 10.1371/journal.pone.0058972
Russell, J. B., and Diez-Gonzalez, F. (1998). The effects of fermentation acids on bacterial growth. Adv. Microb. Physiol. 39, 205–234. doi: 10.1016/S0065-2911(08)60017-X
Setlow, B., and Setlow, P. (1980). Measurements of the pH within dormant and germinated bacterial spores. Proc. Natl. Acad. Sci. U.S.A. 77, 2474–2476. doi: 10.1073/pnas.77.5.2474
Shioi, J. I., Matsuura, S., and Imae, Y. (1980). Quantitative measurements of proton motive force and motility in Bacillus subtilis. J. Bacteriol. 144, 891–897.
Singh, R. P., Setlow, B., and Setlow, P. (1977). Levels of small molecules and enzymes in the mother cell compartment and the forespore of sporulating Bacillus megaterium. J. Bacteriol. 130, 1130–1138.
Slonczewski, J. L., Fujisawa, M., Dopson, M., and Krulwich, T. A. (2009). Cytoplasmic pH measurement and homeostasis in bacteria and archaea. Adv. Microb. Physiol. 55, 1–74. doi: 10.1016/S0065-2911(09)05501-5
Smelt, J. P. P. M., Bos, A. P., Kort, R., and Brul, S. (2008). Modelling the effect of sub(lethal) heat treatment of Bacillus subtilis spores on germination rate and outgrowth to exponentially growing vegetative cells. Int. J. Food Microbiol. 128, 34–40. doi: 10.1016/j.ijfoodmicro.2008.08.023
Steil, L., Serrano, M., Henriques, A. O., and Völker, U. (2005). Genome-wide analysis of temporally regulated and compartment-specific gene expression in sporulating cells of Bacillus subtilis. Microbiology (UK) 151, 399–420. doi: 10.1099/mic.0.27493-0
Stragier, P., Bonamy, C., and Karmazyn-Campelli, C. (1988). Processing of a sporulation sigma factor in Bacillus subtilis: how morphological structure could control gene expression. Cell 52, 697–704. doi: 10.1016/0092-8674(88)90407-2
Stratford, M., Plumridge, A., Nebe-von-Caron, G., and Archer, D. B. (2009). Inhibition of spoilage mould conidia by acetic acid and sorbic acid involves different modes of action, requiring modification of the classical weak-acid theory. Int. J. Food Microbiol. 136, 37–43. doi: 10.1016/j.ijfoodmicro.2009.09.025
Sunde, E. P., Setlow, P., Hederstedt, L., and Halle, B. (2009). The physical state of water in bacterial spores. Proc. Natl. Acad. Sci. U.S.A. 106, 19334–19339. doi: 10.1073/pnas.0908712106
Swerdlow, B. M., Setlow, B., and Setlow, P. (1981). Levels of H+ and other monovalent cations in dormant and germinating spores of Bacillus megaterium. J. Bacteriol.148, 20–29.
Ter Beek, A. S. (2009). Weak Organic Acid Stress in Bacillus subtilis. Ph.D. thesis, University of Amsterdam, Amsterdam.
Ter Beek, A. S., and Brul, S. (2010). To kill or not to kill Bacilli: opportunities for food biotechnology. Curr. Opin. Biotechnol. 21, 168–174. doi: 10.1016/j.copbio.2010.03.014
Ugurbil, K., Rottenberg, H., Glynn, P., and Shulman, R. G. (1978). 31P nuclear magnetic resonance studies of bioenergetics and glycolysis in anaerobic Escherichia coli cells. Proc. Natl. Acad. Sci. U.S.A. 75, 2244–2248. doi: 10.1073/pnas.75.5.2244
Ullah, A., Orij, R., Brul, S., and Smits, G. J. (2012). Quantitative analysis of the modes of growth inhibition by weak organic acids in yeast. Appl. Environ. Microbiol. 78, 8377–8387. doi: 10.1128/AEM.02126-12
Van Melis, C. C. J., Nierop Groot, M. N., and Abee, T. (2011). Impact of sorbic acid on germinant receptor-dependent and -independent germination pathways in Bacillus cereus. Appl. Environ. Microbiol. 77, 2552–2554. doi: 10.1128/AEM.02520-10
Veening, J., Smits, W. K., Hamoen, L. W., Jongbloed, J. D. H., and Kuipers, O. P. (2004). Visualization of differential gene expression by improved cyan fluorescent protein and yellow fluorescent protein production in Bacillus subtilis. Appl. Environ. Microbiol. 70, 6809–6815. doi: 10.1128/AEM.70.11.6809- 6815.2004
Veening, J.-W., Hamoen, L. W., and Kuipers, O. P. (2005). Phosphatases modulate the bistable sporulation gene expression pattern in Bacillus subtilis. Mol. Microbiol. 56, 1481–1494. doi: 10.1111/j.1365-2958.2005.04659.x
Veening, J.-W., Smits, W. K., Hamoen, L. W., and Kuipers, O. P. (2006a). Single cell analysis of gene expression patterns of competence development and initiation of sporulation in Bacillus subtilis grown on chemically defined media. J. Appl. Microbiol.101, 531–541. doi: 10.1111/j.1365-2672.2006.02911.x
Veening, J. W., Kuipers, O. P., Brul, S., Hellingwerf, K. J., and Kort, R. (2006b). Effects of phosphorelay perturbations on architecture, sporulation and spore resistance in biofilms of Bacillus subtilis. J. Bacteriol. 188, 3099–3109. doi: 10.1128/JB.188.8.3099-3109.2006
Veening, J.-W., Stewart, E. J., Berngruber, T. W., Taddei, F., Kuipers, O. P., and Hamoen, L. W. (2008). Bet-hedging and epigenetic inheritance in bacterial cell development. Proc. Natl. Acad. Sci. U.S.A. 105, 4393–4398. doi: 10.1073/pnas.0700463105
Vojinovic, V., and Von Stockar, U. (2009). of uncertainties in pH, pMg, activity coefficients, metabolite concentrations, and other factors on the analysis of the thermodynamic feasibility of metabolic pathways. Biotechnol. Bioeng. 103, 780–795. doi: 10.1002/bit.22309
Wang, S. T., Setlow, B., Conlon, E. M., Lyon, J. L., Imamura, D., Sato, T., et al. (2006). The forespore line of gene expression in Bacillus subtilis. J. Mol. Biol. 358, 16–37. doi: 10.1016/j.jmb.2006.01.059
Wax, R., and Freese, E. (1968). Initiation of the germination of Bacillus subtilis spores by a combination of compounds in place of L-alanine. J. Bacteriol. 95, 433–438.
Keywords: bacterial spore formers, spores, spore germination, intracellular pH, GFP, pHluorin, weak organic acids, uncouplers
Citation: van Beilen JWA and Brul S (2013) Compartment-specific pH monitoring in Bacillus subtilis using fluorescent sensor proteins: a tool to analyze the antibacterial effect of weak organic acids. Front. Microbiol. 4:157. doi: 10.3389/fmicb.2013.00157
Received: 05 April 2013; Accepted: 30 May 2013;
Published online: 18 June 2013.
Edited by:
Nuno Pereira Mira, Instituto Superior Técnico, Institute for Biotechnology and Bioengineering, PortugalReviewed by:
Harold J. Schreier, University of Maryland Baltimore County, USAPeter Setlow, University of Connecticut Health Center, USA
Copyright: © 2013 van Beilen and Brul. This is an open-access article distributed under the terms of the Creative Commons Attribution License, which permits use, distribution and reproduction in other forums, provided the original authors and source are credited and subject to any copyright notices concerning any third-party graphics etc.
*Correspondence: Stanley Brul, Department of Molecular Microbial Physiology, Swammerdam Institute for Life Sciences, University of Amsterdam, Science Park 904, 1098 XH Amsterdam, Netherlands e-mail:cy5icnVsQHV2YS5ubA==