 Isabell Klawonn1*
 Gaute Lavik2
 Philipp Böning3
 Hannah K. Marchant2
 Julien Dekaezemacker2
 Wiebke Mohr2
 Helle Ploug1,4
- 1Department of Ecology, Environment and Plant Sciences, Stockholm University, Stockholm, Sweden
- 2Max Planck Institute for Marine Microbiology, Bremen, Germany
- 3Institute of Chemistry and Biology of the Marine Environment, Carl von Ossietzky University of Oldenburg, Oldenburg, Germany
- 4Department of Marine Sciences, University of Gothenburg, Gothenburg, Sweden
Recent findings revealed that the commonly used 15N2 tracer assay for the determination of dinitrogen (N2) fixation can underestimate the activity of aquatic N2-fixing organisms. Therefore, a modification to the method using pre-prepared 15−15N2-enriched water was proposed. Here, we present a rigorous assessment and outline a simple procedure for the preparation of 15−15N2-enriched water. We recommend to fill sterile-filtered water into serum bottles and to add 15−15N2 gas to the water in amounts exceeding the standard N2 solubility, followed by vigorous agitation (vortex mixing ≥ 5 min). Optionally, water can be degassed at low-pressure (≥950 mbar) for 10 min prior to the 15−15N2 gas addition to indirectly enhance the 15−15N2 concentration. This preparation of 15−15N2-enriched water can be done within 1 h using standard laboratory equipment. The final 15N-atom% excess was 5% after replacing 2–5% of the incubation volume with 15−15N2-enriched water. Notably, the addition of 15−15N2-enriched water can alter levels of trace elements in the incubation water due to the contact of 15−15N2-enriched water with glass, plastic and rubber ware. In our tests, levels of trace elements (Fe, P, Mn, Mo, Cu, Zn) increased by up to 0.1 nmol L−1 in the final incubation volume, which may bias rate measurements in regions where N2 fixation is limited by trace elements. For these regions, we tested an alternative way to enrich water with 15−15N2. The 15−15N2 was injected as a bubble directly to the incubation water, followed by gentle shaking. Immediately thereafter, the bubble was replaced with water to stop the 15−15N2 equilibration. This approach achieved a 15N-atom% excess of 6.6 ± 1.7% when adding 2 mL 15−15N2 per liter of incubation water. The herein presented methodological tests offer guidelines for the 15N2 tracer assay and thus, are crucial to circumvent methodological draw-backs for future N2 fixation assessments.
Introduction
The availability of fixed nitrogen (N) in N-limiting habitats is a proximal driver of aquatic productivity and the subsequent sequestration of carbon dioxide (CO2) from the atmosphere to the sediment (Capone, 2001; Gruber and Galloway, 2008). Biological N2 fixation is the largest source of fixed nitrogen to the marine biosphere (100–200 Tg N year−1) (Codispoti, 2007; Grosskopf et al., 2012). Rates of N2 fixation can be estimated using a mass balance approach, for example, through deep-water nutrient stoichiometry (Gruber and Sarmiento, 1997; Deutsch et al., 2007) or natural signatures of stable isotopes (Montoya et al., 2002). Alternatively, N2 fixation can be measured indirectly with the acetylene reduction assay or directly with the 15N2 tracer assay (Zehr and Montoya, 2007 and references therein). Recently, it has been demonstrated that the commonly used 15N2 tracer assay leads to a significant underestimation of true N2 fixation rates, which may explain, at least partially, the apparent imbalance of sources and sinks of N in the global oceans (Grosskopf et al., 2012). In the former protocol of the 15N2 tracer assay, 15−15N2 gas was added directly as a bubble to water, and an instantaneous equilibrium between the 15−15N2 gas bubble and the N2 dissolved in water was assumed. Rates of N2 fixation were then calculated from the incorporation of 15−15N2 gas into biomass assuming a constant 15N-atom percent (atom%) in the dissolved N2 pool from the time of the tracer addition until the end of incubations (Montoya et al., 1996). The dissolution of a 15−15N2 gas bubble in water, however, is not instantaneous but time-delayed (Mohr et al., 2010). Consequently, in the past, rates of N2 fixation might have been underestimated depending on the incubation time, the timing of the injection of the 15−15N2 bubble relative to the diel cycle of organisms and the species composition of the diazotrophic community (Mohr et al., 2010; Grosskopf et al., 2012). To circumvent the potential underestimation of N2 fixation rates, a simple but effective twist has been proposed: the 15N tracer was added as an aliquot of 15−15N2-enriched seawater, which is prepared prior to incubations. Thereby, a constant 15N-atom% throughout incubations was ensured (Mohr et al., 2010).
These methodological advances stimulated a debate on how to prepare 15−15N2-enriched seawater—bearing in mind the practicability and time efficiency of the overall protocol. We took this debate as an inspiration, and tested methodological options to facilitate the preparation of 15−15N2-solutions and evaluated their benefits on the dissolution of 15−15N2 gas in water in relation to their time effort. We also estimated the risk of contaminations with trace elements (Fe, P, Mo, Mn, Zn, Cu) during the preparation of 15−15N2-enriched water, which may bias N2 fixation measurements in regions where N2 fixation is limited by the availability of P or Fe. Finally, recommendations are given for a rapid, simple and reliable procedure to enrich water with 15−15N2 gas.
Materials and Methods
Efficiency of Water Degassing
Two liters of deionized water were filled into a 4 L vacuum filtration flask suitable for low pressures. The flask was closed gas-tight, connected to a vacuum pump (Diaphragm Vacuum Pump N 026.3AN.18, KNF Neuberger GmbH, Freiburg, Germany) via gas-tight tubing (5 mm i.d.) and placed on a magnetic stirring block (Heidolph MR Hei-Mix L) (Figure 1). The maximum vacuum was 950 mbar below atmospheric pressure (atm. pressure) and water was mixed vigorously while degassing (magnetic stirring bar 40 × 8 mm, 1400 rpm). Degassing was conducted at 0, 200, 600, and 950 mbar below atm. pressure for up to 30 min. The stirring was stopped after the indicated degassing time and the pump switched off as soon as the water turbulence ceased. The water was transferred from the filtration flask into 160 mL borosilicate glass serum bottles using gas-tight tubing (transparent Tygon®, 8 mm o.d., 5 mm i.d.) via siphoning, i.e., atm. pressure was used to force water to flow from the filtration flask into a lower placed serum bottle. The tubing ends were positioned at the bottom of the serum bottle and filtration flask to limit the contact of water with air. As a measure of degassing efficiency, we determined the O2 concentration using a calibrated Clark-type microelectrode (tip diameter < 100 μm, Unisense A/S, Denmark) after the water was transferred into the serum bottles. The theoretical O2 concentration was calculated as
where TGP is the total gas pressure (here equivalent to the absolute degassing pressure = standard atm. pressure—degassing pressure), χO2 the mole fraction of O2 (= 0.2095) and kH the Henry law constant (772.55 L atm mol−1 at 24°C, salinity 0).
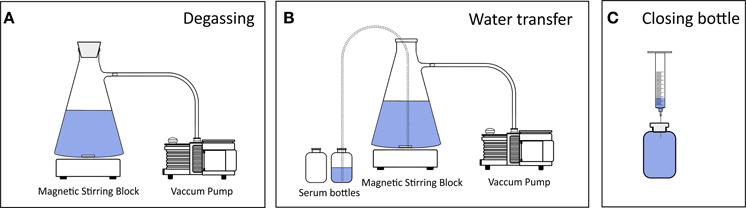
Figure 1. Set-up of low-pressure degassing and bottling of water. (A) Water was filled into a filtration flask, which was closed air-tight, placed on a magnetic stirring block and connected to a vacuum pump. During degassing the stirring was set to its maximum (1400 rpm) causing a turbulent vortex. (B) Water was transferred into borosilicate serum bottles via siphoning through gas-tight tubing so that atmospheric pressure forced the water to flow from the filtration flask into the serum bottles. Siphoning was initiated by air suctioning using a syringe. The tubing ends were kept at the bottoms of both flasks to avoid any water dripping and thus to minimize the gas–water interface. (C) The serum bottles were crimp-sealed headspace-free. A needle attached to a syringe without plunger was used as an outlet to not introduce air bubbles into the bottle while closing the bottle with a rubber stopper.
Preparation of 15−15N2-enriched Seawater
The common procedure for all tests on the 15−15N2 dissolution was as follows: About 1.5 L of deionized water was degassed at 0 or 950 mbar low-pressure for 15 min as described above. The water was siphoned into 160 mL serum bottles and the bottles were crimp-sealed headspace-free with thick rubber stoppers (h = 1 cm) which can withstand over-pressure in the serum bottles (Figure 1). 2.5 mL of 15−15N2 gas (98 atom% 15N, Sigma-Aldrich) were injected into each bottle with a disposable needle (0.6 × 25 mm, Terumo Corporation, Leuven, Belgium) attached to a gas-tight syringe (2.5 mL, Luer Lock, SGE Analytical Science). Overpressure from the gas-tight syringe was released after withdrawing 15−15N2 gas from the gas cylinder. The solutions were vortex-mixed in the serum bottles for 1 min. Based on this procedure (unless stated differently in A–E or Table 1), we prepared 96 serum bottles which were grouped as triplicates and used to evaluate the effect of the following preparation steps on the 15−15N2 dissolution in water (see also Table 1):
(A) Water degassing: Water was degassed at 0 or 950 mbar low pressure prior to the addition of 15−15N2 gas. The volume of injected 15−15N2 gas varied between 0 and 5 mL per 160 mL water.
(B) Volume of 15−15N2 gas addition: The volume of the 15−15N2 gas ranged from 1 to 7 mL per 160 mL water.
(C) Agitation: The solutions were hand-shaken for 30 sec (50-fold vigorous inversion by 180°) or vortex-mixed for 1–20 min, respectively, after 15−15N2 had been added. During shaking, care was taken to disrupt the gas bubble into multiple small bubbles.
(D) Compression of injected gas bubble: A fraction of 15−15N2 will not dissolve in water but remain in the gaseous phase due to vapor–liquid equilibrium. Consequently, more 15−15N2 gas can be forced into the aqueous phase by reducing the bubble volume. We compressed the bubble volume by pressing 0.5 mL of water into half of the serum bottles after 15−15N2 gas had been injected. The subsequently added water was degassed at low-pressure when added to degassed water in the serum bottles, and not degassed when added to non-degassed water. The bubble volume was estimated by determining the bubble diameter with a ruler through the glass wall of the serum bottles.
(E) Storage time and temperature of the 15−15N2-enriched water: The solutions were stored for 1 or 24 h at 4°C (for 2.5 mL 15−15N2) or 24°C (for 2.5 and 5.0 mL 15−15N2 addition) after the 15−15N2 gas injection. In practice, the temperature of the 15−15N2 aliquot should equal the temperature of the incubation water. Thus, the water temperature was raised from 4°C back to 24°C in a water bath after the indicated storage time and before analyzing the 15−15N2 concentration.
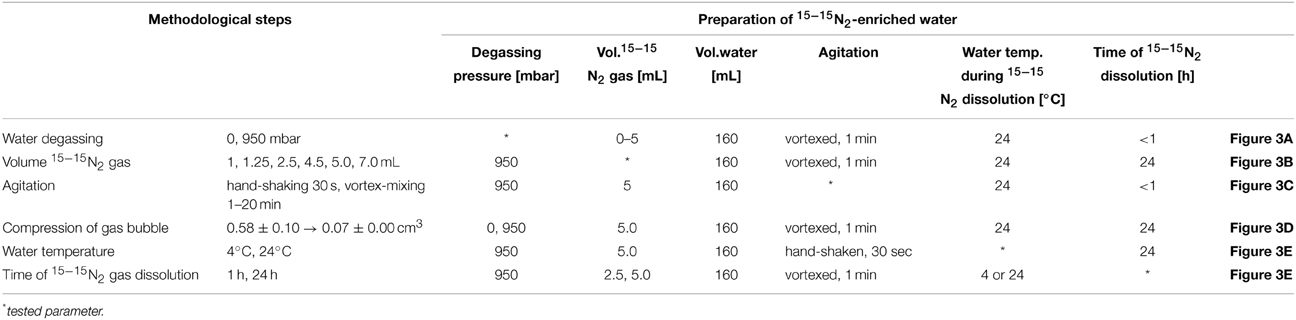
Table 1. Optional methodological steps which were tested for the preparation of 15−15N2-enriched water.
Isotope ratios of dissolved N2 and concentrations of 15−15N2 were analyzed using either a membrane-inlet mass spectrometer (MIMS; GAM200, IPI) at the Max Planck Institute for Marine Microbiology in Bremen, Germany or a gas chromatography isotope ratio mass spectrometer (GC-IRMS; Thermo Delta V, Thermo Fisher Scientific Inc.) at the Stable Isotope Laboratories at the Department of Geology, Stockholm University, Sweden. For MIMS measurements, water was analyzed immediately and directly in each 160 mL serum bottle. For GC-IRMS measurements, subsamples from serum bottles were transferred to 12 mL Exetainer® using a wide needle (2 × 80 mm) and a 50 mL disposable syringe.
All tests on the 15−15N2 dissolution were conducted with deionized water. In order to test the validity of our results over a range of salinities, artificial seawater with a salinity of 0, 5, 20, and 35 was enriched with 5 mL 15−15N2 per 160 mL water. Generally, the solubility of gases decreases with elevated salinity. In our tests, this was confirmed by a negative linear correlation between the absolute 15−15N2 concentration and salinity (R2 = 0.9809). However, the final 15N-atom% excess was identical in saline and non-saline solutions because the relative solubility of 14−14N2, 14−15N2 and 15−15N2 decreased by the same magnitude at increasing salinity. Hence, our tests with deionized water are applicable for fresh- and seawater.
Trace Elements
Contaminations with trace elements can occur due to the contact of water with glass, plastic and rubber ware (Heinrichs and Hermann, 1990) or due to the use of artificial seawater as a solvent for 15−15N2 gas. We investigated whether trace elements accumulated during the preparation of 15−15N2-enriched water. All glass and plastic ware used in the above described experiments were washed with ultrapure HCl (10%, vol/vol), and rinsed and soaked in ultrapure water (Milli Q). HDPE-vials for trace element subsamples were preconditioned in 10% HCl overnight and thereafter rinsed with Milli Q water. During the preparation of 15−15N2-enriched water, 25 mL-subsamples were transferred into HDPE-vials (triplicates) after the following steps in the protocol: (step 1) vacuum degassing, (step 2) water transfer to serum bottles and 5 min of vortex-mixing, and (step 3) 15−15N2 gas injection and subsequent transfer of a 15−15N2 aliquot to the incubation volume. In addition, we prepared 15−15N2-enriched artificial seawater (S9883 Sigma) with a salinity of 35 to test whether artificial seawater can be an alternative to sterile filtered natural seawater, or whether it constitutes a substantial source of trace elements.
Trace element sub-samples were acidified with ultrapure HNO3 (Fisher Scientific) to a final concentration of 2% (vol/vol). Samples were analyzed for phosphorus (P), iron (Fe), molybdenum (Mo), manganese (Mn), zinc (Zn), and copper (Cu) using high-resolution inductively coupled plasma mass spectrometry (ICP-MS; Thermo Fisher Element II) at the ICBM, University of Oldenburg. ICP-MS measurements were done in medium resolution mode to separate molecular interferences from the analytes. The trace element concentrations were assessed with one-point calibration using single-element standards (Roth® or Sigma-Aldrich®) in the ppt (10−12) to lower ppb (10−9) range. Ultrapure 2% HNO3 (vol/vol) served as blank. The relative standard deviation was 2% for concentrations in the upper ppt to ppb range, and 15% (Fe, Cu, Mn, Zn) and 30% (Mo, P) for concentrations ≤ 10 ppt.
Modified Bubble Injection of 15−15N2 assay
The addition of pre-prepared 15−15N2-enriched water may alter the trace element composition in the incubation water. To test an alternative and less invasive addition of 15−15N2 to an incubation volume, we combined the previously used bubble approach (Montoya et al., 1996) and the recently proposed dissolution approach (Mohr et al., 2010). Natural seawater samples were taken in the North Sea at different sampling stations and days. The seawater was filled headspace-free in 2 L polycarbonate bottles fitted with septum caps and the 15N tracer (98% + 15−15N2, Cambridge Isotope Laboratories, lot#I-17229) was added at a ratio of 2 mL 15−15N2 per liter of seawater. Bottles were gently mixed by hand for 15 min. Subsequently, the remaining gas bubble was removed in order to stop equilibration of N2 between the gas and aqueous phase. A water subsample was transferred into 12 mL Exetainer® and preserved with 100 μL of saturated HgCl2 solution for later analysis of the 15−15N2 concentration. After sub-sampling, the incubation bottles were refilled headspace-free with seawater to prevent any loss of 15−15N2 gas during the incubation.
Application of the 15−15N2 Dissolution Assay
We incubated a culture of Nodularia spumigena KAC 12 (Karlberg and Wulff, 2013) by applying the dissolution (Mohr et al., 2010) and the bubble assay (Montoya et al., 1996). For the dissolution assay, water which was 0.2 μm-filtered (Isopore™ Membrane Filters, GTTP, Merck Millipore Ltd. Ireland) and degassed at 950 mbar low-pressure, was filled into 160 mL serum bottles, enriched with 2.5 mL 15−15N2 gas and vortex-mixed for 1 min. The seawater was taken in the Baltic Sea at station B1 (N 58° 48′ 18, E 17° 37′ 52). Triplicate incubations were initiated by adding 20 mL of the 15−15N2-enriched stock solution to 250 mL of N. spumigena suspension. Thereafter, the 250 mL serum bottles were crimp-sealed headspace-free. For the bubble assay, 300 μL of 15−15N2 were directly injected as a gas bubble to 250 mL N. spumigena suspension through the rubber stopper. The amount of 15−15N2 was calculated to give a similar 15N-atom% for both the bubble and the dissolution assay. All bottles were gently inverted 50 times by hand after the 15−15N2 addition, and incubated at 150 μE m−2 s−1 and 18°C for 0, 3, 6, 12, and 24 h. At the end of incubations, the following sub-samples were taken from each serum bottle: (1) Triplicate sub-samples were filled headspace-free into 12 mL Exetainer® vials to determine the 15N-atom% in the N2. These samples were preserved with 100 μL of saturated ZnCl2 solution. (2) 50 mL were preserved with Lugol's solution (L6146 Sigma) for cell counting of N. spumigena. The cell counting resulted in 7.4 ± 0.3 × 10⁷ cells L−1 (mean ± s.d., n = 9). (3) 150 mL were filtered onto pre-combusted GF/F filters and frozen at −80°C to quantify the amount of 15−15N2 incorporated into biomass. The GF/F filters were dried at 50°C overnight, pelletized into tin cups and analyzed on a Thermo Flash EA 1112 elemental analyzer coupled to an isotopic ratio mass spectrometer (Finnigan Delta Plus XP, Thermo Fisher Scientific) at the MPI, Bremen. Gases (calibrated against IAEA references) and caffeine were used as standards for the isotope ratios and the quantification of particulate organic carbon and nitrogen (POC, PON), respectively.
N2 fixation rates were calculated as
where A is the 15N-atom% in the dissolved N2 pool (AN2) and particulate material (APN), and [PN] is the concentration of particulate material. A significant 15N-uptake other than 15N2 fixation due to the impurity of 15N2 gas (Dabundo et al., 2014) could be excluded for our studies since traces of 15, 15, or 15 in the 15−15N2-enriched water were not detectable using GC-IRMS.
The parameter AN2, as given in Equation (2), is defined as 15N-atom% in the dissolved N2 pool, that is, the sum of naturally abundant and added 15N. However, in the literature, AN2 is occasionally denoted as 15N-enrichment or 15N-excess enrichment. This misleading use of terms may lead to miscomprehension and we recommend a clear distinction between 15N-atom% and 15N-atom% excess in future studies.
Results and Discussion
Efficiency of Degassing
Recent studies applied water degassing at 750–960 mbar below atm. pressure for approximately 1 h, and degassing set-ups were similar to the one shown here (Figure 1) or a membrane flow-through system was used (Mohr et al., 2010; Grosskopf et al., 2012; Rahav et al., 2013). Alternatively, ambient air was removed by purging with helium (Wilson et al., 2012). Nevertheless, the benefit of the degassing pressure/duration on the degassing efficiency and finally on the actual 15−15N2 dissolution has not been assessed systematically.
The solubility of gas follows Henry's law, i.e., the amount of gas dissolved in a liquid is proportional to its partial pressure.
where p is the partial pressure, c the concentration of the solute and kH the Henry law constant. In agreement, in our tests the degree of degassing and the degassing pressure were positively correlated (Figure 2A, R2 = 0.9985). The efficiency of the degassing set-up to remove dissolved gas from water was high and met theoretical assumptions. Following Equation (1), water degassing at 200, 600, and 950 mbar low-pressure reduces the O2 air-saturation to 83.0, 42.2, and 6.5%, respectively. By applying the set-up as shown in Figure 1, dissolved gas was removed from water to 84.2 ± 0.9% O2 air-saturation (mean ± s.d., n = 6) at 200 mbar, 43.0 ± 1.9% (n = 6) at 600 mbar and 8.0 ± 0.7% (n = 6) at 950 mbar low-pressure. The minor difference between the measured and theoretical O2 air-saturation can be explained either by a deviation of the actual atm. pressure from the standard atm. pressure or by O2 contamination as the water was transferred from the filtration flask to the serum bottles. Degassing was accelerated by vigorous stirring and the maximum gas removal achieved after 5–10 min (Figure 2B). Hence, degassing at 950 mbar low-pressure in a simple set-up as applied here is an efficient and fast way of gas removal yielding a high degree of gas removal to ≤10% air-saturation within minutes (Figure 2B).
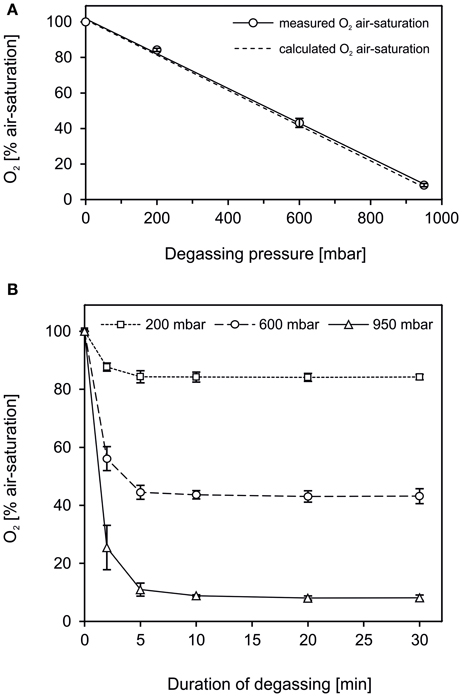
Figure 2. The efficiency of water degassing conducted in a set-up as shown in Figure 1. (A) Deionized water was degassed at 0, 200, 600, and 950 mbar below atmospheric pressure. The level of gas removal, determined as O2 air-saturation, was positively correlated to the degassing pressure (straight line, R2 = 0.9985). The efficiency of the degassing procedure was high and met the theoretical O2 air-saturation at a given low-pressure calculated according to Henry's law (dashed line). (B) The gas removal progressed fast, with the major part of gas being removed within the first 2–5 min. (A,B) Data are given as mean ± s.d. (n = 6).
Preparation and Evaluation of 15−15N2-enriched Water
The Effect of Water Degassing on the Dissolution of 15−15N2 Gas
Gases and their isotopes have a similar solubility (Klots and Benson, 1963), and the N2 solubility is linearly correlated to the partial pressure (Equation 3). Correspondingly, our data showed that water degassing had no direct effect on the amount of 15−15N2 which dissolved in water after 15−15N2 had been added (Figure 3A). Nonetheless, water degassing had two indirect effects increasing the 15N-atom% excess in the final incubation volume. Firstly, degassing at 950 mbar low-pressure lowered the 14−14N2 and 14−15N2 background in the 15−15N2-enriched water to ≤10% (compare with Figure 2). Thereby, less 14N is added together with 15−15N2-enriched water to the incubation volume and the final 15N-atom% excess in the incubation volume would increase by 4.5% (e.g., from 5.0 to 5.2% assuming that the aliquot of 15−15N2-enriched water equals 5% of the final incubation volume). Secondly, water degassing lowered the initial total gas pressure and thus more 15−15N2 could be added to under-saturated water without risking the borosilicate serum bottles to explode. Roughly, the serum bottles could withstand the overpressure of a maximum of 5 mL 15−15N2 per 160 mL non-degassed water and 7 mL 15−15N2 per 160 mL of 950 mbar-degassed water. This can yield an additional increase in the final 15N-atom excess of 30% (e.g., from 5.2 to 6.8% 15N-atom% excess).
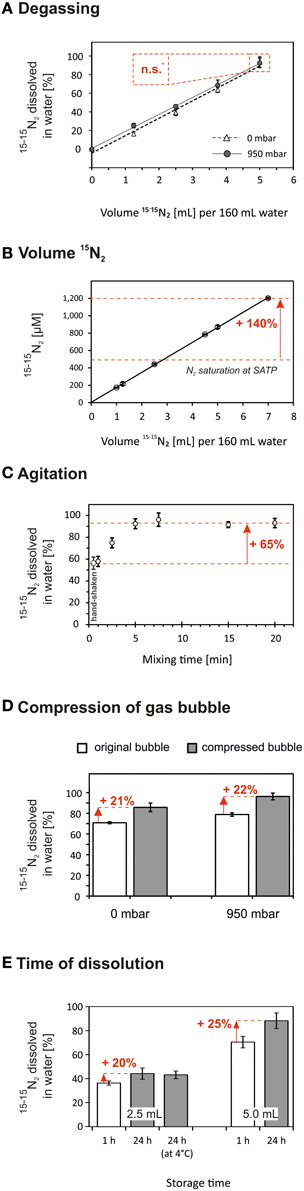
Figure 3. The dissolution of 15−15N2 in water could be accelerated by applying optional methodological steps during the preparation of 15−15N2-enriched water. Red numbers indicate the relative increase of the amount of 15−15N2 gas which dissolved in the water after the optional steps have been applied. For each treatment the highest amount of 15−15N2 dissolved in water was normalized to 100% (except B). Data are given as mean ± s.d. (n = 3). (A) The amount of 15−15N2 dissolved in water was not significantly (n.s., p > 0.05) different in water degassed at 0 or 950 mbar below atmospheric pressure. Nonetheless, the 15N-atom% in the final incubation volume can be increased by two indirect effects of water degassing on the final 15N-atom% excess (data not shown, see Section The effect of water degassing on the dissolution of 15−15N2 gas). (B) The 15−15N2 concentration was positively correlated to the volume of injected 15−15N2 gas even at N2 oversaturation. The N2 solubility at standard ambient temperature and pressure (SATP) is indicated by the lower dashed line (Colt, 2012). (C) Agitation was an effective mode to raise the 15−15N2 dissolution in water. The maximum 15N-tracer concentration was achieved after 5 min of vortex mixing. (D) The injected 15−15N2 gas bubble was compressed by the addition of water into the bottle, i.e., pressure increase in the bottle. The volume reduction of the gas bubble enhanced the amount of 15−15N2 dissolved in water by 21–22%. (E) Solutions of 15−15N2 were stored at 24°C or 4°C for 1 h or 24 h. After 24 h the 15−15N2 dissolved in water increased by 20–25% as compared to 1 h storage time. A colder storage temperature had no significant effect on the 15−15N2 concentration.
The Effect of the Volume of Injected 15−15N2 Gas on the 15−15N2 Concentration
In agreement with Equation 3, we found a strong positive correlation between the amount of injected 15−15N2 gas and the measured 15−15N2 concentration in water even when exceeding the standard solubility of N2 in water (R2 = 0.9998, Figure 3B). The maximum 15−15N2 concentration was 1200 μmol L−1, that is, adding a 20 mL aliquot of this solution to 1 L of incubation volume (24°C, 0 PSU) would be sufficient to achieve a final 15N-atom excess of 5%. Further, instead of serum bottles, we tested the usage of Exetainer® vials as water containers. We injected 2 mL of 15−15N2 gas into a 12 mL Exetainer® filled with non-degassed water and vortex-mixed the solution for 1 min. The 15−15N2 concentration was 782 ± 48 μmol L−1 (n = 3), i.e., an aliquot of 30 mL added to 1 L of incubation volume (24°C, 0 PSU) would be sufficient to achieve a final 15N-atom excess of 5%. The preparation of 15−15N2-enriched water in the Exetainer® vials was fast but the overpressure in the vials was high which made it difficult to press the total volume of 15−15N2 gas into the vials. Moreover, the 15−15N2 recovery was low (around 11%), presumably because a large gas bubble remained even after vortex-mixing.
The Effect of Agitation on the Dissolution of 15−15N2 Gas
In general, agitation promotes turbulent diffusion of gases across the gas–water interface. Hand shaking and vortex mixing had the same efficiency on the 15−15N2 dissolution relative to the mixing time; however, due to practical reasons we applied vortex-mixing in cases when the mixing exceeded 30 s. Vortex mixing yielded the maximum 15−15N2 concentration within 5 min. The amount of 15−15N2 which dissolved in water could therefore be increased by 65% after 5 min of vortex mixing compared to the 15−15N2 dissolution after 30 s of hand-shaking (Figure 3C).
The Effect of Compressing the Gas Bubble on the Dissolution of 15−15N2 Gas
Dinitrogen gas is rather insoluble in water whereby a major part of N2 remains in the gas phase. Thus, a reduction of the bubble volume by increasing the pressure inside the serum bottle should enhance the amount of 15−15N2 which dissolves in water. We injected 5 mL 15−15N2 gas to 160 mL non-degassed (0 mbar) and degassed water (950 mbar) which created a bubble of 0.58 ± 0.10 cm3 (mean ± s.d., n = 12). After pressing 0.5 mL of water into half of the serum bottles, the bubble size was compressed to 0.07 ± 0.00 cm3 (n = 6) irrespective of the earlier applied degassing pressure. This bubble compression led to a rise in 15−15N2 by 21–22% (Figure 3D). In fact, this rise in 15−15N2 corresponded to the amount of 15−15N2 which was initially trapped in the bubble but dissolved in the liquid as the bubble was compressed. Compressing the gas bubble was a quick process but occasionally the pressure increase within the serum bottle caused the bottle to shatter risking the applicants' health.
The Effect of Storage Time and Temperature on the Dissolution of 15−15N2 Gas
The amount of 15−15N2 which dissolved in water increased by 20–25% after 24 h compared to 1 h storage (Figure 3E). Although this was a substantial effect, this approach to increase the 15−15N2 concentration seemed inefficient considering its time effort. Decreasing the temperature during storage from 24°C to 4°C did not yield higher 15−15N2 concentrations. Although gases are more soluble at colder temperatures, the re-warming of the 15−15N2 solution from 4°C to 24°C before the 15−15N2 concentration analysis might have reversed the effect of the colder storage temperature; however, this step is inevitable to not alter the temperature in the incubation volume.
Final 15N-atom% Excess Using the Dissolution Approach
For most field studies an incubation volume of 1–4 L and a final 15N-atom excess of 2–5% is applied (Grosskopf et al., 2012 Supplementary information). We achieved a 15N-atom excess of 5% in the final incubation volume by applying the following steps: 5 mL of 15−15N2 gas were added to 160 mL water (degassed at 950 mbar low-pressure for 15 min) in serum bottles. Thereafter, the 15−15N2 solution was vortex-mixed for 1 min. We transferred 50 mL of the 15−15N2 stock solution to a 1 L Schott glass bottle which was filled to the brim (1150 mL), i.e., the volume of the 15−15N2 aliquot equaled less than 5% of the total incubation volume. The final 15N-atom% excess was 4.8 ± 0.1% (n = 10) with no significant difference after 0.5 and 12 h following the 15−15N2 aliquot addition (p > 0.05). The 15N-atom% excess might have been further enhanced by increasing the initial 15−15N2 gas addition to 7 mL 15−15N2 per 160 mL water and prolonging vortex-mixing to 5 min. During our later tests, the addition of 7 mL 15−15N2 gas to 160 mL degassed water yielded a 15−15N2 concentration of 1200 μmol L−1 (Figure 3B). Based on these results, only 2% of the incubation volume (24°C, salinity 0) would have to be replaced with 15−15N2-enriched water to reach a final 15N-atom excess of 5%. Importantly, the amount of 15−15N2 that is transferred to the incubation water has to be adjusted according to the standard N2 solubility at a given water salinity and temperature.
We validated whether the transfer of 15−15N2-enriched water from the incubation bottle to an Exetainer® vial may cause a loss of 15−15N2 to the atmosphere. The 15−15N2-enriched water from an incubation bottle was gently aspirated with a 50 mL syringe (Plastic Sterile Plastipak) and expelled through a 0.2-μm syringe filter to the bottom of an Exetainer® vial. The gas–water interface was minimized during the water transfer by not dripping the solution into the Exetainer® vial, but using a needle (2 × 80 mm) or small tubing as extension of the syringe to gently release the water to the bottom of the vial. The 15−15N2 concentration was measured directly in the incubation volume and after a sub-sample was transferred to an Exetainer® using MIMS. On average the relative 15−15N2 loss was 4 ± 1% (mean ± s.d., n = 6) after the above described sample transfer.
Final 15N-atom% Excess Using the Modified 15−15N2 Bubble Addition
The addition of 2 mL 15−15N2 gas per liter seawater and subsequent removal of the bubble in the incubation volume yielded a 15N-atom excess of 6.6 ± 1.7% (mean ± s.d., n = 12) ranging from 3.9 to 10.1% for water with salinities from 25 to 0.4. This wide range was driven by three bottles with considerably lower (3.9%) or higher (10.1%) values, but in nine of the 12 bottles the 15N-atom excess was 6.8 ± 0.9%. When using the modified bubble addition, a consistent agitation should be used to ensure a small variability of 15N-atom% among experiments. One disadvantage of this approach is the less efficient use of 15−15N2 gas (utilizing 40% of the 15−15N2 gas compared to 70% when adding 15−15N2-enriched water as a stock solution). Nonetheless, the modified bubble approach is a less invasive approach for N2 fixation measurements compared to the addition of pre-prepared 15−15N2-enriched stock solutions and may minimize the risk of trace element contaminations (see Section Trace Elements).
Trace Elements
Trace element concentrations in the 15−15N2-enriched water were ≤2 nmol L−1 for Fe, P, Mn, Mo, Cu, Zn. The individual element concentrations in the final incubation volume increased by a maximum of 0.01 nmol P L−1, 0.1 nmol Fe L−1, 0.04 nmol Mn L−1, 0.1 nmol Cu L−1, and 0.09 nmol Cu L−1. These concentrations were calculated by assuming that the volume of the 15−15N2-enriched water which is transferred to the incubations equals 5% of the total incubation volume. Concentrations of Mo did not differ in the 15−15N2-enriched water and blank solutions. These trace element contaminations should be seen as an estimate. We expect that contaminations vary depending on the specific material used during the preparation of 15−15N2-enriched water and also the history of that material. In our tests, major contamination sources for Fe were the contact of water with glass ware and colored rubber stoppers. In contrast, the utilization of stainless steel needles (0.6 × 25 mm, Terumo Corporation, Leuven, Belgium), which were used for the 15−15N2 gas injection into the serum bottles, led to no substantial Fe-contamination because the cannulas were by default covered with silicone (personal communication with the supplier TERUMO BCT Europe).
The artificial seawater (salinity of 35) was highly enriched with trace metals, ranging from 23–70 nmol L−1 for Fe, Mn, Cu, Zn. Levels of Mo were low, 0.1 nmol L−1, and levels of P were not different from blank levels. These concentrations confirmed the declaration of the manufacturer Sigma stating their sea salt S9883 may contain ≤500 nmol L−1 of trace elements (information received after written request). The usage of this specific artificial seawater would have led to trace metal concentrations in the incubation water of 3.5 nmol L−1 for Fe, 2.3 nmol L−1 for Mn, 2.9 nmol L−1 for Cu, 1.2 nmol for Zn and 5 pmol L−1 for Mo assuming that the volume of the artificial seawater added to the incubation volume equals 5 Vol%. Such concentration levels are in excess of those in wide regions of the marine environment. Artificial seawater prepared with sea salt of a different batch, supplied by manufacturers other than Sigma (S9883) or seawater prepared using ultrapure single element powder may yield lower (or higher) concentrations of trace elements.
Application of 15−15N2 Dissolution Assay
The dissolution approach attained a 15N-atom% excess of 4.3 ± 0.3% (mean ± s.d., n = 35). The differences between the time points were low and are explained by differences of the initial 15−15N2 stock solution as we used a different serum bottle of the 15−15N2 stock solution for each set of triplicates of each time point. In contrast, the 15N-atom% excess increased from 1.6 ± 0.1% (n = 9) after 15 min to 4.5 ± 0.3% (n = 9) after 24 h when the 15−15N2 gas was injected as a bubble (Figure 4A). This led to an underestimation of N2 fixation by 38% after 3 h and 16% after 24 h incubations if the 15N-atom% was assumed to be 4.5% throughout the entire incubation period (Figure 4B). The decrease in underestimation of N2 fixation with time was due to the fact that the 15−15N2 reached its vapor–liquid equilibrium after approximately 6 h (Figure 4B). In addition, the positively buoyant colonies of Nodularia spumigena floated and assembled close to the gas bubble where they were exposed to a higher 15N-atom% compared to organisms more distant from the gas bubble. This might have compensated for the initially lower 15−15N2 concentration in water (see also Grosskopf et al., 2012 SI; White, 2012).
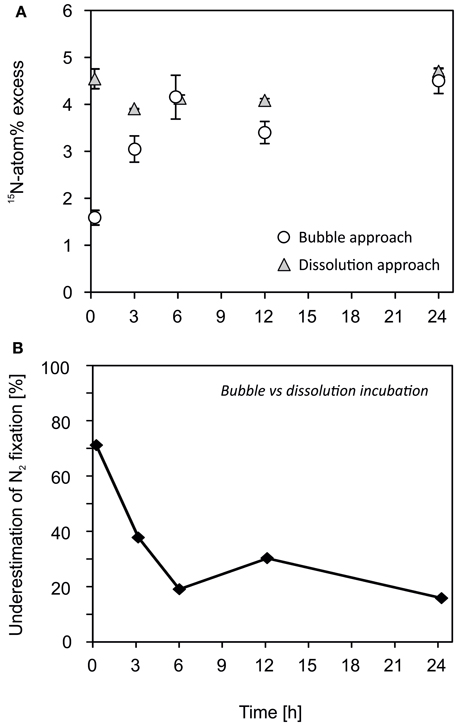
Figure 4. A Nodularia spumigena culture was incubated following the former bubble-addition and the modified dissolution assay. (A) The dissolution of a 15−15N2 gas bubble was time-dependent. The 15N-atom% increased over time if the 15N-tracer was added as a bubble directly to the incubation volume (see also Mohr et al., 2010). The 15N-atom% was more consistent as an aliquot of 15−15N2-enriched water was added to the N. spumigena solution (dissolution approach). (B) Rates of N2 fixation were underestimated by 16–71% when using the bubble approach compared to the dissolution approach.
Recommendations and Comments
The following guidelines are recommended as best practice for an efficient and reproducible preparation of 15−15N2-enriched water and the reliable determination of N2 fixation rates:
(1) For the preparation of 15−15N2-enriched water, we suggest to add 15−15N2 to sterile-filtered water in excess of the standard N2 solubility and to mix the solution vigorously, preferably by vortex-mixing for at least 5 min. Prior to the addition of 15−15N2, sterile-filtered water can be degassed at low-pressure (≥950 mbar) to indirectly increase the 15−15N2-atom% excess in the final incubation volume (see Section The effect of water degassing on the dissolution of 15−15N2 gas). The protocol for the 15−15N2 enrichment, however, might be adjusted according to the experimental set-up, time plan and study area. A rating according to the benefits and drawbacks of the methodological steps for the preparation of 15−15N2-enriched water is given in Table 2.
(2) Natural seawater from the specific sampling stations/depths should be used rather than artificial seawater in order to avoid trace element contaminations. In addition, to minimize possible contaminations during the preparation of 15−15N2-enriched water, we recommend washing all equipment with 10% HCl (vol/vol) followed by several rinses with MilliQ, and to use old and worn glass ware which has lost its element impurities. Transparent rubber stoppers and tubing (for example, transparent PVC, PE or Tygon®, which are N-free) are preferable over colored rubber stoppers and tubing. In our tests, the mean concentration of trace elements in the incubation volume was estimated to increase by up to 0.1 nmol L−1 due to the addition of pre-prepared 15−15N2-enriched water. We consider trace element contamination levels of up to 0.1 nmol L−1 as minor for many regions of the aquatic environment. Yet, marine pelagic (cyanobacterial) N2 fixation can be limited by the availability of Fe and P, especially in the open ocean (e.g., Sanudo-Wilhelmy et al., 2001; Mills et al., 2004; Turk-Kubo et al., 2012). We therefore advise against the preparation of 15−15N2 enriched water as shown in Figure 1 when working in regions where concentrations of dissolved Fe are very low (≤0.1 nmol L−1), e.g., the South Atlantic Ocean or parts of the central North and South Pacific Gyres (Brown et al., 2005; Sohm et al., 2011). Here, the modified bubble addition approach is recommended due to a lower risk of trace element contamination.
(3) A sub-sample of the incubation water should be taken for MIMS or GC-IRMS analyses in order to determine the actual enrichment of 15−15N2 and to ensure the accurate calculation of N2 fixation rates. When using the modified bubble method, every individual incubation bottle should be sub-sampled. We further recommend that 15N2 gas bottles are checked for potential impurities with 15N-compounds other than 15N2 (Dabundo et al., 2014).
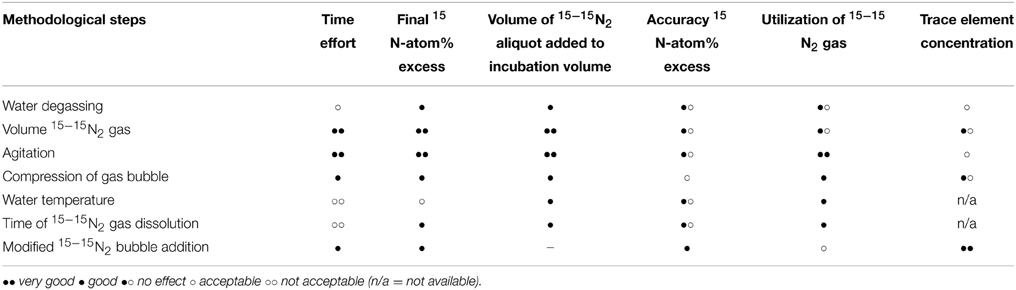
Table 2. Rating of optional methodological steps for the preparation of 15−15N2-enriched water according to their positive (••) or negative (◦◦) effects on parameters which are of importance for N2 fixation assays.
To highlight the importance of the determination of the 15N-atom% in the incubation, we modeled the effect of under-/overestimating the 15N-labeling on rates of N2 fixation (Figure 5). Rates of N2 fixation are calculated according to Equation (2) and an incorrect assumption of the 15N-atom% or 15N-atom% excess leads to a significant bias in N2 fixation rates. The percent deviation from true N2 fixation rates is more pronounced if the 15N-atom% or 15N-atom% excess is underestimated compared to occasions when it is overestimated. Moreover, the magnitude of potential errors in N2 fixation rates is lower when using a 15N-atom% of ≥5% compared to a lower 15N-atom% of ≤2% (Figure 5). A high 15N-atom% should also be used in regions with high biomass and/or high productivity, but low N2-fixing activity. Here, a high 15N-atom% increases the detection limit of N2 fixation since the 15N-PON signal from N2 fixation can be attenuated by the presence of non-diazotroph PON.
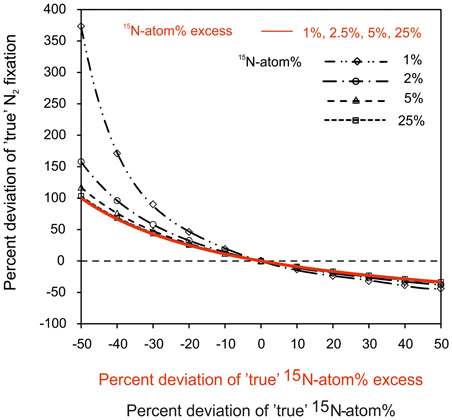
Figure 5. Modeled deviation from true, actual N2 fixation rates in correlation to the potential deviation from true values of 15N-atom% (in black) or 15N-atom% excess (in red). Following Equation 2, a deviation of 15N-atom% or 15N-atom% excess from the true value will lead to significant under- or overestimations of N2 fixation. This error in N2 fixation rates is especially pronounced when the 15N-atom% or 15N-atom% excess is underestimated. In addition, the variable 15N-atom% is corrected for the naturally present 15N (0.366%) for calculations of N2 fixation rates. This correction has a more pronounced weighting on the calculated N2 fixation when using a low 15N-atom% of ≤2% compared to a higher 15N-atom of ≥5%. The percent deviation was calculated as difference between the incorrect, i.e., falsely estimated value of 15N-atom%/15N-atom% excess and their true values.
Currently, the 15N2 tracer assay is the only available method for a direct assessment of N2 fixation by aquatic diazotrophs and its application has greatly advanced our understanding of the global N-cycle. Nevertheless, the systematic underestimation of actual N2 fixation rates by the former bubble approach demanded the development and evaluation of a revised protocol. In the future, the application of a reliable 15N2 tracer assay will be of importance to advance our knowledge in diazotrophic activity and biogeography in the aquatic environment. Especially, the activity of unicellular and symbiotic diazotrophs is believed to have been underestimated up to 6-fold during past field campaigns (Grosskopf et al., 2012). A modified, standardized N2 fixation methodology is therefore expected to yield higher rates of N2 fixation which may, at least partially, resolve the discrepancy between N-gain and -loss processes in marine N budget calculations (Codispoti, 2007).
Author Contributions
IK, GL, JD, WM and HP designed the study. IK, GL, PB, HM, JD and WM conducted the experiments and sample analyses. All authors contributed to the interpretation of data and drafting the work.
Conflict of Interest Statement
The authors declare that the research was conducted in the absence of any commercial or financial relationships that could be construed as a potential conflict of interest.
Acknowledgments
The research was funded by The Swedish Research Council for Environment, Agricultural Sciences and Spatial Planning, FORMAS (Grant nr. 215-2009-813 to Ragnar Elmgren and HP and Grant nr. 215-2010-779 to HP), the Max Planck Society, Baltic Ecosystem Based Management research program to HP (http://www.su.se/beam) and the Baltic Sea Centre, Stockholm University to IK. We thank Gabriele Klockgether for the help during EA-IRMS analyses, Björn Andersson, Nurun Nahar and the staff of the Askö Marine Research Station for their assistance during sampling and experiments, Monica Appelgren for providing the N. spumigena culture, Katharina Pahnke for the possibility to conduct trace element analyses and for commenting on an earlier version of the manuscript, and Rachel Foster for discussing an early draft of this study. We also thank the class of 2018 of the International Max Planck Research School of Marine Microbiology for testing the modified 15−15N2 bubble addition. The organizers Julie LaRoche et al. and participants of the workshop “The reassessment of marine dinitrogen fixation methodology and measurements” held in Kiel, Germany in 2012, are acknowledged for providing the stage for vital discussions on methodological aspects which were tested in this study. Roberta Hamme and John Colt gave valuable input on the principles of gas solubility in liquids. We also thank the reviewers for thoughtful comments.
References
Brown, M. T., Landing, W. M., and Measures, C. I. (2005). Dissolved and particulate Fe in the western and central North Pacific: results from the 2002 IOC cruise. Geochem. Geophys. Geosyst. 6, Q10001. doi: 10.1029/2004GC000893
Capone, D. G. (2001). Marine nitrogen fixation: what's the fuss? Curr. Opin. Microbiol. 4, 341–348. doi: 10.1016/S1369-5274(00)00215-0
Codispoti, L. A. (2007). An oceanic fixed nitrogen sink exceeding 400 Tg N a−1 vs the concept of homeostasis in the fixed-nitrogen inventory. Biogeosciences 4, 233–253. doi: 10.5194/bg-4-233-2007
Colt, J. (2012). “Solubility of atmospheric gases in brackish and marine waters,” in Computation of Dissolved Gas Concentration in Water as Functions of Temperature, Salinity and Pressure, 2nd Edn (London: Elsevier), 73–131.
Dabundo, R., Lehmann, M. F., Treibergs, L., Tobias, C. R., Altabet, M. A., Moisander, P. H., et al. (2014). The contamination of commercial 15N2 gas stocks with 15N-labeled nitrate and ammonium and consequences for nitrogen fixation measurements. PLoS ONE 9:e110335. doi: 10.1371/journal.pone.0110335
Deutsch, C., Sarmiento, J. L., Sigman, D. M., Gruber, N., and Dunne, J. P. (2007). Spatial coupling of nitrogen inputs and losses in the ocean. Nature 445, 163–167. doi: 10.1038/nature05392
Grosskopf, T., Mohr, W., Baustian, T., Schunck, H., Gill, D., Kuypers, M. M. M., et al. (2012). Doubling of marine dinitrogen-fixation rates based on direct measurements. Nature 488, 361–364. doi: 10.1038/nature11338
Gruber, N., and Galloway, J. N. (2008). An Earth-system perspective of the global nitrogen cycle. Nature 451, 293–296. doi: 10.1038/nature06592
Gruber, N., and Sarmiento, J. L. (1997). Global patterns of marine nitrogen fixation and denitrification. Global Biogeochem. Cycles 11, 235–266. doi: 10.1029/97GB00077
Heinrichs, H., and Hermann, A. G. (1990). Praktikum der Analytischen Geochemie. Berlin; Heidelberg: Springer.
Karlberg, M., and Wulff, A. (2013). Impact of temperature and species interaction on filamentous cyanobacteria may be more important than salinity and increased pCO2 levels. Mar. Biol. 160, 2063–2072. doi: 10.1007/s00227-012-2078-3
Klots, C. E., and Benson, B. B. (1963). Isotope effect in the solution of oxygen and nitrogen in distilled water. J. Chem. Physics 38, 890–892. doi: 10.1063/1.1733778
Mills, M. M., Ridame, C., Davey, M., La Roche, J., and Geider, R. J. (2004). Iron and phosphorus co-limit nitrogen fixation in the eastern tropical North Atlantic. Nature 429, 292–294. doi: 10.1038/nature02550
Mohr, W., Grosskopf, T., Wallace, D. W., and Laroche, J. (2010). Methodological underestimation of oceanic nitrogen fixation rates. PLoS ONE 5:e12583. doi: 10.1371/journal.pone.0012583
Montoya, J. P., Carpenter, E. J., and Capone, D. G. (2002). Nitrogen fixation and nitrogen isotope abundances in zooplankton of the oligotrophic North Atlantic. Limnol. Oceanogr. 47, 1617–1628. doi: 10.4319/lo.2002.47.6.1617
Montoya, J. P., Voss, M., Kähler, P., and Capone, D. G. (1996). A simple, high-precision, high-sensitivity tracer assay for N2 fixation. Appl. Environ. Microbiol. 62, 986–993.
Rahav, E., Herut, B., Levi, A., Mulholland, M. R., and Berman-Frank, I. (2013). Springtime contribution of dinitrogen fixation to primary production across the Mediterranean Sea. Ocean Sci. 9, 489–498. doi: 10.5194/os-9-489-2013
Sanudo-Wilhelmy, S. A., Kustka, A. B., Gobler, C. J., Hutchins, D. A., Yang, M., Lwiza, K., et al. (2001). Phosphorus limitation of nitrogen fixation by Trichodesmium in the central Atlantic Ocean. Nature 411, 66–69. doi: 10.1038/35075041
Sohm, J. A., Webb, E. A., and Capone, D. G. (2011). Emerging patterns of marine nitrogen fixation. Nat. Rev. Microbiol. 9, 499–508. doi: 10.1038/nrmicro2594
Turk-Kubo, K. A., Achilles, K. M., Serros, T. R. C., Ochiai, M., Montoya, J. P., and Zehr, J. P. (2012). Nitrogenase (nifH) gene expression in diazotrophic cyanobacteria in the Tropical North Atlantic in response to nutrient amendments. Front. Microbiol. 3, 386. doi: 10.3389/fmicb.2012.00386
White, A. E. (2012). Oceanography: the trouble with the bubble. Nature 488, 290–291. doi: 10.1038/nature11481
Keywords: N2 fixation, cyanobacteria, gas–liquid solution, 15N2 gas, gas solubility, iron, phosphorus, Nodularia spumigena
Citation: Klawonn I, Lavik G, Böning P, Marchant HK, Dekaezemacker J, Mohr W and Ploug H (2015) Simple approach for the preparation of 15−15N2-enriched water for nitrogen fixation assessments: evaluation, application and recommendations. Front. Microbiol. 6:769. doi: 10.3389/fmicb.2015.00769
Received: 26 April 2015; Accepted: 14 July 2015;
Published: 04 August 2015.
Edited by:
Hongyue Dang, Xiamen University, ChinaReviewed by:
Florence Schubotz, University of Bremen, GermanyDeniz Bombar, University of Copenhagen, Denmark
Copyright © 2015 Klawonn, Lavik, Böning, Marchant, Dekaezemacker, Mohr and Ploug. This is an open-access article distributed under the terms of the Creative Commons Attribution License (CC BY). The use, distribution or reproduction in other forums is permitted, provided the original author(s) or licensor are credited and that the original publication in this journal is cited, in accordance with accepted academic practice. No use, distribution or reproduction is permitted which does not comply with these terms.
*Correspondence: Isabell Klawonn, Department of Ecology, Environment and Plant Sciences Stockholm University, Svante Arrhenius väg 21A, Stockholm 106 91, Sweden,aXNhYmVsbC5rbGF3b25uQHN1LnNl