 Jakob Frimodt-Møller
 Godefroid Charbon
 Karen A. Krogfelt
 Anders Løbner-Olesen
- 1Department of Biology, Section for Functional Genomics and Center for Bacterial Stress Response and Persistence, University of Copenhagen, Copenhagen, Denmark
- 2Department of Microbiology and Infection Control, Statens Serum Institut, Copenhagen, Denmark
In Escherichia coli, chromosome replication is initiated from oriC by the DnaA initiator protein associated with ATP. Three non-coding regions contribute to the activity of DnaA. The datA locus is instrumental in conversion of DnaAATP to DnaAADP (datA dependent DnaAATP hydrolysis) whereas DnaA rejuvenation sequences 1 and 2 (DARS1 and DARS2) reactivate DnaAADP to DnaAATP. The structural organization of oriC, datA, DARS1, and DARS2 were found conserved among 59 fully sequenced E. coli genomes, with differences primarily in the non-functional spacer regions between key protein binding sites. The relative distances from oriC to datA, DARS1, and DARS2, respectively, was also conserved despite of large variations in genome size, suggesting that the gene dosage of either region is important for bacterial growth. Yet all three regions could be deleted alone or in combination without loss of viability. Competition experiments during balanced growth in rich medium and during mouse colonization indicated roles of datA, DARS1, and DARS2 for bacterial fitness although the relative contribution of each region differed between growth conditions. We suggest that this fitness advantage has contributed to conservation of both sequence and chromosomal location for datA, DARS1, and DARS2.
Introduction
In Escherichia coli chromosome replication is initiated from a single origin, oriC, and proceeds bi-directionally until the two replication forks meet at terminus of replication (terC). The initiator protein DnaA belongs to the AAA+ (ATPases Associated with diverse Activities) proteins. DnaA can bind ATP and ADP with similar high affinities (Skarstad and Katayama, 2013), but only DnaA bound to ATP is able to initiate DNA replication (Sekimizu et al., 1987). Different recognition sites for DnaA has been identified in oriC; three high to medium affinity sites (R1, R4, and R2) that binds both DnaAATP and DnaAADP (Fuller et al., 1984), and multiple lower affinity sites (R3, R5/M, I1, I2, I3, C1, C2, C3, τ1, and τ2) (McGarry et al., 2004; Kawakami et al., 2005; Rozgaja et al., 2011) (Figure 1). Only DnaAATP is capable to bind to low-affinity sites (McGarry et al., 2004; Kawakami et al., 2005; Rozgaja et al., 2011), and single stranded DnaA boxes (Speck and Messer, 2001). Binding of the Fis protein to oriC is reported to both inhibit initiation of replication (Wold et al., 1996; Ryan et al., 2004; Riber et al., 2009), stimulate initiation (Flåtten and Skarstad, 2013), or have no effect on initiation (Margulies and Kaguni, 1998), while the binding of integration host factor (IHF) plays a central role in forming an optimal complex (Ryan et al., 2002; Keyamura et al., 2007; Ozaki and Katayama, 2012). Binding of DnaAATP to both high- and low affinity DnaA boxes in oriC are proposed to result in a oligomeric DnaA structure, which assisted by IHF leads to duplex opening in the AT-rich region, i.e., open complex formation (Skarstad and Katayama, 2013). Following duplex opening the helicase DnaB is loaded onto the now single-stranded DNA by the help of DnaA, which leads to further duplex opening and assembly of the replisome (Skarstad and Katayama, 2013).
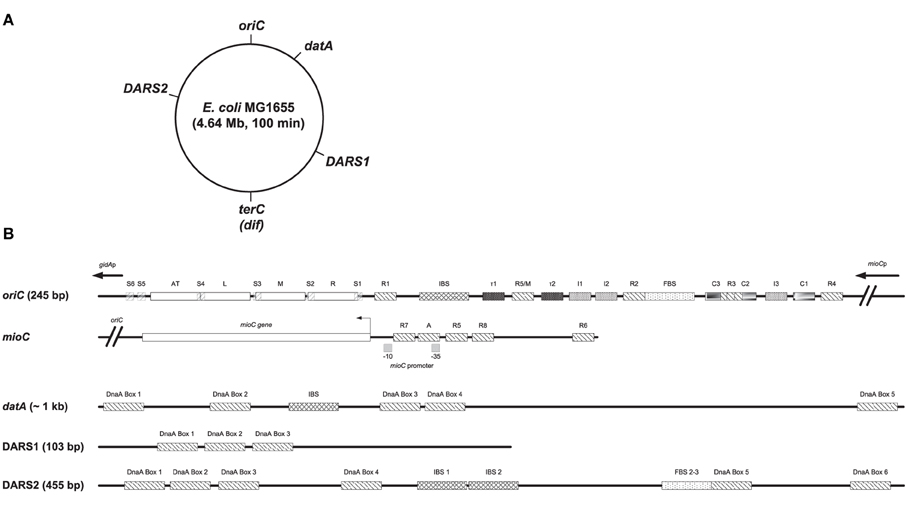
Figure 1. Structures of oriC, mioC promoter, datA, DARS1, and DARS2. (A) The MG1655 chromosome is shown as a circle and the locations of oriC (at the genome map position of 84.6 min), datA (at 94.6 min), DARS1 (at 17.5 min), DARS2 (at 64.0 min), and terC/dif (around 36 min) are indicated. (B) Basic structures of oriC, the mioC promoter, datA, DARS1, and DARS2 are schematically shown. Both high- to medium affinity sites (R1, R4, and R2) that binds both DnaAATP and DnaAADP, lower affinity sites (R3, R5/M, I1, I2, I3, C1, C2, C3, τ1, and τ2), and Single-stranded DnaA-ATP box 1–6 (S1-6) that only binds DnaAATP are indicated in oriC (see text for details). The minimal oriC sequence (245 bp) is defined to end just to the left of the 13-mer termed L and to the right of DnaA Box R4. Note that the R3 DnaA box overlaps with DnaA box C3 and C2 in oriC. DnaA boxes in the mioC promoter are indicated as described by Hansen et al. (2007), with DnaA Box R5 and R6 being high affinity sites, while DnaA Box R7, R8, and A are lower affinity sites. DARS1 contains 3 DnaA boxes, DARS2 contains 6 DnaA boxes an IBS and a FBS, and datA contains 5 DnaA boxes and an IBS. IBS, IHF-binding site; FBS, FIS-binding site. Figure is not to scale.
Initiation of replication is a highly regulated process in E. coli. Replication begins essentially simultaneously at all cellular origins (Skarstad et al., 1986), i.e., in synchrony and only once per cell cycle. The tight control is primarily ensured by the oscillation of DnaAATP that has a temporal increase around the time of initiation, and decreases rapidly thereafter (Kurokawa et al., 1999). Following initiation, oriC is temporarily inactivated by the binding of SeqA to hemi-methylated GATC-sites (Campbell and Kleckner, 1990; Lu et al., 1994). This sequestration lasts for about 1/3 of the doubling time and provides a time period for RIDA (Regulatory Inactivation of DnaA) and DDAH (datA-dependent DnaAATP hydrolysis) to hydrolyse DnaAATP to DnaAADP. In RIDA, the Hda protein, in association with the DNA-loaded β-clamp (DnaN), activates the intrinsic ATPase activity of DnaA, which converts DnaAATP into DnaAADP (Kurokawa et al., 1999; Kato and Katayama, 2001). DDAH is an IHF dependent hydrolysis of DnaAATP to DnaAADP, which takes place at the datA locus (Kasho and Katayama, 2013). datA contain five DnaA boxes as well as an IHF-binding site (Nozaki et al., 2009; Kasho and Katayama, 2013) (Figure 1). Common for both RIDA and DDAH is that both processes lower the DnaAATP/DnaAADP ratio to counter unwanted re-initiation of replication. At later stages in the cell cycle the DnaAATP level must increase past a critical level for a new round of initiation of replication. This is done by rejuvenation of DnaAADP to DnaAATP at the DARS1 and DARS2 loci, where rejuvenation at the DARS2 locus is dependent on IHF and Fis (Kasho et al., 2014). In addition de novo synthesis of DnaA, which by and large will be ATP bound because ATP is more abundant than ADP within the cell, will also contribute to the increase in DnaAATP (Kurokawa et al., 1999). DARS1 and DARS2 contain a core of three DnaA boxes (Figure 1). In addition, DARS1 needs a specific DNA region flanking the core for stimulation of ADP dissociation from DnaA (Fujimitsu et al., 2009), while DARS2 contains three additional DnaA boxes and requires both Fis binding sites (FBS) 2 and 3, and IHF binding to IHF binding sites (IBS) 1 and 2 be active (Kasho et al., 2014) (Figure 1).
Termination of replication occurs in terC, a poorly-defined region approximately 180° away from oriC (Hill et al., 1987). If an uneven number of homologous recombination events between daughter chromosomes have taken place during replication, the end result will be a chromosome dimer (Sherratt et al., 2004). Resolution takes place at a 28 bp site dif, located in terC (Sherratt et al., 2004) in a process involving two tyrosine recombinases, XerC and XerD. The XerCD recombinase is activated and delivered at dif by the FtsK translocase (Bigot et al., 2005). Numerous forces seem to shape the organization of bacterial chromosomes, and the pattern of these forces on the chromosome is evident at different levels. In both the Gram-negative bacteria E. coli (Bergthorsson and Ochman, 1998) and Salmonella enterica (Liu and Sanderson, 1995a,b), as well as the Gram-positive bacterium Lactococcus lactis (Campo et al., 2004), selective pressure maintains a global architecture of the chromosome, which preserves two replication arms of nearly equal length. In addition to chromosome symmetry further chromosomal constrains are observed in E. coli. Four insulated macrodomains (MD) and two less constrained regions called non-structured (NS) regions has been uncovered (Niki et al., 2000; Valens et al., 2004). MDs are defined as regions where DNA interactions occur preferentially, while DNA interactions between the different MDs are highly restricted. NS regions can however interact with both its flaking MDs (Valens et al., 2004). oriC and datA are contained within the Ori MD, while the Ter MD contains dif. The Ori MD is flanked by NSRight and NSLeft (where DARS2 is found) whereas the Ter MD is flanked by the Left MD and the Right MD which contain DARS1 (Valens et al., 2004) (Figure 2). Several observations indicates that the MDs and NS plays a part in the segregation of sister chromatids and the mobility of chromosomal DNA. The Ori MD is centered on a centromere-like 25 bp sequence designated migS, which affects oriC positioning during chromosome segregation (Yamaichi and Niki, 2004; Fekete and Chattoraj, 2005). Furthermore, movement of the Ter MD is maintained by several factors including the MatP/matS system (Mercier et al., 2008), and ZapA, ZapB, and FtsZ (Espeli et al., 2012; Buss et al., 2015).
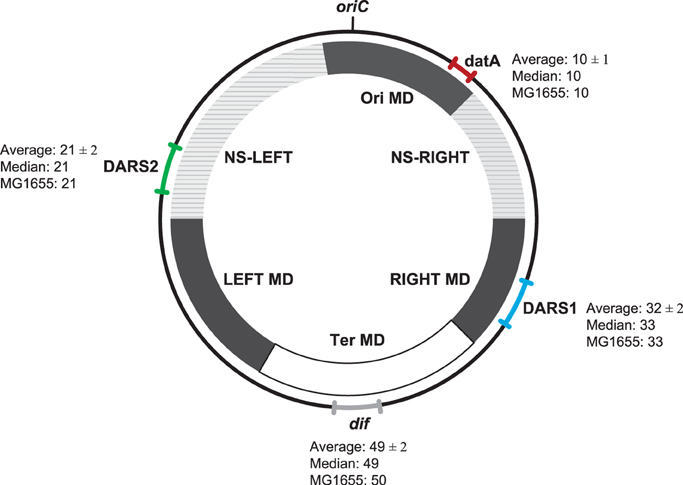
Figure 2. Location of datA, DARS1, DARS2, and dif regions on the E. coli genomes. The range (the relative distance ± the standard deviation in centisomes) in the chromosomal position of datA (red), DARS1 (blue), DARS2 (green), and dif (gray) are shown in the outer circle. For each region the average relative distance with the standard deviation (see Materials and Methods), the median, as well as the chromosomal position in MG1655 (MG1655) are indicated. All distances are given in centisomes. The inner circle schematically shows the location of the different MD- and NS-regions as indicated by Esnault et al. (2007).
Despite of the restraints on the E. coli K-12 chromosome, the size of genomes of other E. coli species varies from 4.6 to 5.7 Mb, indicating that horizontal gene transfer and genome reductions frequently takes place (Leimbach et al., 2013). A very dynamic genome structure underlies the metabolic and phenotypic diversity of E. coli. The genome of a bacterial species can be grouped into two categories. The core genome contains genes present in all strains, while the flexible genome comprises genes that are present in only a few strains or unique to single isolates (Medini et al., 2005). The pan-genome of a bacterial species is the combination of the core genome and the flexible genome (Medini et al., 2005). A typical E. coli genome has approximately 5000 genes, where roughly 2200 genes represent the core genome (Rasko et al., 2008). E. coli has a very large pan-genome (>18,000 genes), which grows for each new genome sequenced (Medini et al., 2005; Rasko et al., 2008). This indicates that there is a great diversity in gene content between E. coli species. Nevertheless, comparison of bacterial chromosomes from related genera revealed a conservation of organization (Eisen et al., 2000). For instance, even though E. coli and Salmonella typhimurium diverged from a common ancestor about 140 million years ago their genetic maps are extensively superimposable (Groisman and Ochman, 1997).
Here we report a conserved chromosomal position of the non-coding regions datA, DARS1, and DARS2 relative to oriC in E. coli. In addition, we report that the structural organization of oriC, datA, DARS1, and DARS2 regions are conserved in all E. coli strains analyzed. Furthermore, we demonstrate that even though the loss of datA, DARS1, or DARS2 did not result in a measurable reduction in growth rate, the mutant cells had a lower fitness than wild-type when tested under laboratory conditions or in mice.
Materials and Methods
Growth Conditions
Cells were grown in Luria–Bertani Broth (LB) or AB minimal medium supplemented with 0.2% glucose, 10 μg/ml thiamine, and when indicated 0.5% casamino acids. MacConkey agar was used for mice experiments. All cells were cultured at 37°C. When necessary, antibiotics were added to the following concentrations: kanamycin, 50 μg/ml; streptomycin, 100 μg/ml; chloramphenicol, 20 μg/ml; ampicillin, 150 μg/ml.
Bacterial Strains and Plasmids
A spontaneous streptomycin resistance mutant of MG1655 (ALO1825) was obtained by plating an overnight culture on streptomycin-plates, resulting in MG1655 StrR (ALO4292) (see Table S1 for used strains).
The DARS2 region containing DnaA box I-III was replaced with the cat gene in MG1655 by the lambda red procedure (Datsenko and Wanner, 2000), resulting in the ΔDARS2::cat mutant (ALO4254). Briefly, DNA fragments were PCR amplified using modified primers MutH-9 (5′-TCACAGTTATGTGCAGAGTTATAAACAGAGGAAGGGGTG GATAGCCGTTTCGATTTATTCAACAAAGCCACG-3′) and MutH-10 (5′-CTACGGAATTACTACGGGAAAACCCGGAGC ATTCTGAATAAGCCCGATATGCCAGTGTTACAACCAATTA ACC-3′), where the underlined sequence will anneal to pKD3 (Datsenko and Wanner, 2000). Each deletion was verified by PCR. The DARS2 deletion was moved from ALO4254 to ALO4292 by P1 transduction using established procedures (Miller, 1972) and by selection for chloramphenicol resistance, resulting in ALO4310. The cat gene was removed from ALO4310 by pCP20, according to a method described previously (Cherepanov and Wackernagel, 1995), resulting in ALO4312.
The DARS1 region was replaced with the cat gene in ALO4292 harboring pKD46, as described above, resulting in the ΔDARS1::cat mutant (ALO4313). DNA fragments were PCR amplified using pKD3 as template and primers DARS1_pKD3_FW (5′-TACATAAACCTTGCCT TGTTGTAGCCATTCTGTATTCGATTTATTCAACAAAGCCA CG-3′) and DARS1_pKD3_RV (5′-AAAACAGTTCATCAC CATAATATTTCTGATACAGCGTAAAGCCAGTGTTACAACC AATTAACC-3′) using pKD3 as a template. Each deletion was verified by PCR. The double deletion of DARS1 and DARS2 was obtained in the same background by moving the DARS1 deletion from ALO4313 into the cat sensitive ALO4312 by P1 transduction, resulting in ALO4315.
The ΔdatA::kan allele was obtained from RSD428 (Kitagawa et al., 1998). The datA deletion was moved into ALO4292 and ALO4315 by P1 transduction, selecting for kanamycin, resulting in ALO4331 and ALO4511 respectively. Each deletion was verified by PCR.
lacZ::Tn5::kan was moved from MC1000 F' lacIq, lacZ::Tn5 (laboratory stock) to MG1655 by P1 transduction and selecting for kanamycin, resulting in ALO1257. DARS1 and DARS2 were deleted in ALO1257 (as described above) to give ALO4618 and ALO4619. The cat gene was removed from ALO4618 and ALO4619 by pCP20, before transformation of pALO75 (Løbner-Olesen et al., 1987) for investigation of β-galactosidase synthesis from the mioC promoter. Strain RB210 (MC1000 carries a dnaA-lacZ translational fusion on phage λRB1 integrated at attλ (Braun et al., 1985). λRB1 was transduced from RB210 to ALO1257, resulting in ALO1265. The deletion of DARS2 or datA was done as described above and resulted in strains ALO4626 and ALO4627, respectively, for investigation of β-galactosidase synthesis from the dnaA promoter.
Flow Cytometry
Flow cytometry was performed as described previously (Løbner-Olesen et al., 1989) using an Apogee A10 instrument. For each sample, a minimum of 30,000 cells were analyzed. Numbers of origins per cell and relative cell mass were determined as described previously (Løbner-Olesen et al., 1989).
The distribution of origins per cell was measured after treating exponentially growing cells with rifampicin and cephalexin for 4 h. Rifampicin block initiation of replication, while cephalexin will block cell division. The average number of chromosomes per cell will therefore be equivalent to the number of oriC's present in the cell at the time the drugs were added.
Relative Distance
The relative distance between oriC and DARS1, DARS2, datA, and dif were calculated in centisomes (see equation below). Each E. coli chromosome is by definition 100 centisomes. The relative distance is set as the distance in base pairs between oriC and the region of interest divided by the size of the genome in base pairs of the investigated E. coli strain. There are two distances to dif, one for each replication arm. In this study only the shortest replication arm is presented, while the distance of the longest replication arm by default is the sum of the shortest replication arm substracted from 100.
To calculate the relative distance the chromosome needs to be fully assembled. For this the sequence of 70 fully assembled E. coli chromosomes from The European Nucleotide Archive (http://www.ebi.ac.uk/genomes/bacteria.html) were obtained and analyzed. Two times two strains were uploaded under the same strain name, i.e., W and ST540. We denote them Wa (uploaded under sequence CP002185), Wb (uploaded under sequence CP002967), ST540a (uploaded under sequence CP002185), and ST540b (uploaded under sequence CP002967). Wa are identical to Wb, why Wa was used, while ST540b was used as ST540a was excluded (see below). BL21-DE3 and BL21-Gold were excluded for being deviates of B str. REL606, while KO11, KO11FL, and LY180 were excluded for being deviates of W.
Six E. coli genomes were found to have relative distances, which were two times the standard deviation or more away from the average (Table S2). Of these W3110, MC4100, and strain ST540a were excluded. ST540a and MC4100 has 20% or more imbalance between the length of the two replication arms, which have been shown to give abnormal cells that was dependent on the RecBC-dependent homologous recombination for viability (Esnault et al., 2007), why they were excluded. W3110 is disqualified due to a known inversion around oriC (Hayashi et al., 2006), which explains the altered relative distances compared to the E. coli average.
The final dataset comprised of 59 fully assembled E. coli genomes (Table S3). The position and sequence of oriC, DARS1, DARS2, datA, and dif are known in MG1655, but not annotated in the dataset. We therefore choose to annotate the regions in 58 remaining E. coli genomes. The sequence of each of the regions (see Supplementary Data) from MG1655 where therefore aligned with the chosen E. coli genomes to obtain the chromosomal position and sequence of the region in each individual E. coli genomes.
Mutation Frequency
The mutation frequency was estimated for intergenic regions. Regions between protein-coding genes of more than 300 bp were selected in MG1655. These regions were trimmed for 100 bps on each side, to avoid conserved promoter-regions, and blasted against the 58 remaining E. coli genomes. If not present in the entire dataset the intergenic region was discharged, resulting in 109 regions. Of these 13 intergenic regions contained known conserved sRNA or tRNA's, why they were removed, resulting in 96 intergenic regions. Each intergenic region was aligned and number of nucleotides that were not present in every genome was calculated to give a mutation frequency.
Competition Experiment in LB
The fitness of ΔDARS1, ΔDARS2, ΔDARS1 ΔDARS2, and ΔdatA compared to the wild-type were investigated during direct competition in LB medium. The competing strains were inoculated pairwise at an approximate concentration of (107 CFU/mL) each. The populations were propagated by continuously transfers in LB medium. Samples from each population were taken at 10-generation intervals. Each sample was diluted in 0.9% NaCl and plated on LB plates with appropriate antibiotics. To distinguish the various E. coli strains, dilutions were plated on LB plates containing no antibiotic, kanamycin, or chloramphenicol. All plates were incubated for 18–24 h at 37°C prior to counting. When necessary to distinguish strains, 100 colonies from plates containing no antibiotic were toothpicked onto LB plates containing kanamycin or LB plates containing chloramphenicol.
Mouse Colonization Experiments
The specifics of the streptomycin-treated mouse model used to compare the large intestine colonizing abilities of E. coli strains in mice have been described previously (Leatham et al., 2005; Leatham-Jensen et al., 2012). Briefly, Six-to-eight-week-old, outbreed female CD-1 (Charles River Laboratories, Netherlands) mice were given drinking water containing streptomycin sulfate (5 g/l) for 24 h to eliminate resident facultative anaerobic bacteria (Miller and Bohnhoff, 1963). Mice were orally fed 100 μL of 20% (wt/vol) sucrose containing 106 CFU LB grown E. coli strains. The number of E. coli colonizing the mouse large intestine is reflected in the mouse feces, which is why fecal counts are used to estimate the various E. coli strains' ability to colonize the mouse intestine (Leatham-Jensen et al., 2012). After ingesting the bacterial suspension; feces was collected after 24 h, and as indicated. The mice were caged in groups of three mice, and cages were changed weekly. Mice were marked so they could be isolated and fecal pellets could be collected from each individual mouse. Mice were given fresh drinking water containing streptomycin sulfate (5 g/l) each day. Each fecal sample was homogenized in 1% Bacto tryptone (Difco Laboratories, NJ, USA), diluted in the same medium, and plated on MacConkey agar plates with appropriate antibiotics. When appropriate, 1 ml of a fecal homogenate (sampled after the feces had settled) was centrifuged at 12,000 X g, resuspended in 100 μL of 1% Bacto tryptone, and plated on a MacConkey agar plate with the appropriate antibiotics. This procedure increases the sensitivity of the assay from 102 CFU/gram of feces to 10 CFU/per g of feces. To distinguish the various E. coli strains in feces, dilutions were plated on lactose MacConkey agar containing either streptomycin, streptomycin and kanamycin, or streptomycin and chloramphenicol. All plates were incubated for 18–24 h at 37°C prior to counting. When necessary to distinguish strains, 100 colonies from plates containing streptomycin were toothpicked onto MacConkey agar plates containing streptomycin and kanamycin or onto MacConkey agar plates containing streptomycin and chloramphenicol. Ethics approval statement; 2007/561-1430.
β-Galactosidase Assays
Cells were grown exponentially at 37°C in AB minimal medium supplemented with casamino acids, and β-galactosidase activities were measured as described by Miller (1972).
Results
Conserved Relative Distance from oriC to datA, DARS1, DARS2, and dif in E. coli
Bergthorsson and Ochman (1998) suggested that there is an evolutionary pressure on keeping the E. coli chromosome symmetric, so an approximately equal length of the two replication arms are maintained. The non-coding regions DARS1, DARS2, and datA are all indirectly involved in initiation of replication at oriC as they modulate the activity and for datA also the amount of DnaA available for initiation in a dosage dependent manner. The replication-associated gene dosage of each region relative to oriC changes with growth rate and is given by the formula Nx/NoriC = 2([C × (1−x) +D]∕τ) where x is the relative distance from oriC, C is the replication period, D is the time following termination of replication until cell division, and τ is the doubling time (Bremer and Churchward, 1977). We therefore decided to investigate if there was any evolutionary pressure on their chromosomal position relative to oriC. The genome size of E. coli varies from 4.6 to 5.7 Mb (Leimbach et al., 2013). Thus, to compare chromosomal positions between genomes with up to 1 Mb difference we calculated a relative distance from oriC (see Materials and Methods) while using MG1655 as reference strain. The replication terminus is not as well defined as the origin of replication, this is why dif was chosen to represent terC (Hendrickson and Lawrence, 2007).
Although the study was limited to 59 “closed” E. coli genomes, the dataset includes a wide variety of different E. coli (see Table S3). Pathogenic E. coli strains are categorized into pathotypes (Kaper et al., 2004). The dataset includes four pathotypes, which are associated with diarrhea, namely shiga toxin-producing E. coli (STEC)/enterohemorrhagic E. coli (EHEC), enterotoxigenic E. coli (ETEC), enteropathogenic E. coli (EPEC), and enteroaggregative E. coli (EAEC). In addition to the intestinal pathogens two E. coli associated with the inflammatory bowel disease Crohn's disease were also included. In contrast to intestinal pathogenic E. coli (IPEC), which are obligate pathogens, extraintestinal pathogenic E. coli (ExPEC) are facultative pathogens which belong to the normal gut flora of a certain fraction of the healthy population where they live as commensals (Köhler and Dobrindt, 2011). The dataset contains ExPEC associated with neonatal-meningitis, asymptomatic bacteriuria, acute cystitis, the multidrug resistant ST131, as well as several uropathogenic E. coli (UPEC). In addition to human pathogenic E. coli strains, several E. coli strains isolated from the feces of healthy individuals (human commensals) are included. Apart from numerous common E. coli laboratory strains the dataset is concluded by three E. coli strains shown to be pathogenic in animals (avian pathogenic E. coli (APEC), and porcine enterotoxigenic E. coli) as well as an E. coli isolated from a toxic-metal contaminated site (for references see Table S3).
The chosen E. coli genome dataset had a median genome size of 5,095,204 bp, spanning from 3,976,195 bp (MDS42) to 5,697,240 bp (O26:H11 str. 11368). MDS42 is a “man-made” reduced E. coli K-12 genome derived from MG1655, which was constructed to identify non-essential genes (Pósfai et al., 2006). The smallest non-lab constructed E. coli chromosome was BW2952 with 4,578,159 bp. Due to the great diversity in both origin of isolation and genome size we believe that the dataset will be representative of E. coli as a whole.
Despite the large differences in genome size between E. coli strains, we found approximately the same relative distance from oriC to dif, datA, DARS1, and DARS2, respectively (Figure 2). This observation points to a conserved chromosomal organization. This organization is further conserved at the replichore level as, DARS2 was always found on one replichore, while datA and DARS1 were always found on the other replichore. dif was found at the chromosomal position opposite of oriC, which indicates that both replications arms were of approximately equal length in accordance with data from Bergthorsson and Ochman (1998).
E. coli Chromosome Symmetry
The conserved position of DARS1, DARS2, datA, and dif relative to oriC in the tested 59 E. coli genomes, suggests that new DNA obtained by horizontal gene transfer has been equally distributed between the two replication arms, but also between the different regions on each of the replication arms. Strain O157:H7 EDL933 that has a genome size of 5.53 Mb, i.e., about 0.9 Mb bigger than the laboratory strain MG1655, exemplifies this (Figure 3). MG1655 and O157:H7 EDL933 shares a common 4.1 Mb backbone, which is co-linear except for one 422-kilobase inversion spanning the replication terminus (Perna et al., 2001). The differences between the two genomes are reflected in K-islands (0.53 Mb), which is the DNA present only in MG1655 and O-islands (1.34 Mb), which is unique to O157:H7 EDL933 (Perna et al., 2001). When a circular genome map of O157:H7 EDL933 is compared to MG1655 the 1.34 Mb DNA unique to O157:H7 EDL933 is not only distributed between the two replication arms but as expected also among the cis-acting regions for regulation of initiation of replication (gray boxes; see Figure 3).
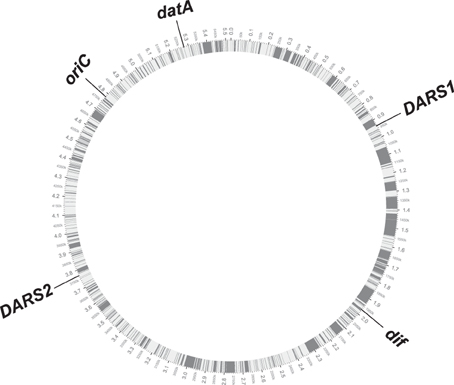
Figure 3. Circular genome map of O157:H7 EDL933 compared with MG1655. The outer circle shows the genomic backbone of the O157:H7 EDL933 genome with the chromosomal position of oriC, datA, DARS1, DARS2, and dif annotated. The inner circle displays in white the common 4.1 Mb backbone between the two E. coli genomes, while the gray bars illustrates the distribution of the 1.34 Mb DNA unique to O157:H7.
The E. coli strain MDS42 (Pósfai et al., 2006) contains a 14.0% reduced genome relative to it's the parental MG1655. However, it maintained a similar relative distance from oriC to DARS1, DARS2, datA, and dif as the parental strain (see Table S3), i.e., the non-essential DNA lost from MG1655 was distributed between the different non-coding cis-acting regions.
Conservation of oriC, DARS1, DARS2 and datA Regions
Only a few genomes showed 100% sequence identity of the oriC, DARS1, DARS2, and datA-regions to those of MG1655. The comparison between the nucleotide sequences from the 59 different E. coli genomes is found in the Supplementary Material (Supplementary Figures S12–S15).
In order to estimate the mutation pressure on oriC, datA, DARS1, and DARS2 we calculated the mutation frequency for intergenic regions in E. coli (see Materials and Methods). It was found to be 6 mutations per 100 ± 3 bp. Neither of the oriC, datA, DARS1, or DARS2 regions differed significantly from this average frequency (Not shown). However, the vast majority of changes observed were found in spacer regions whereas binding sites for key proteins were conserved among all genomes (Table 1) which underlines their important role for cell cycle control.
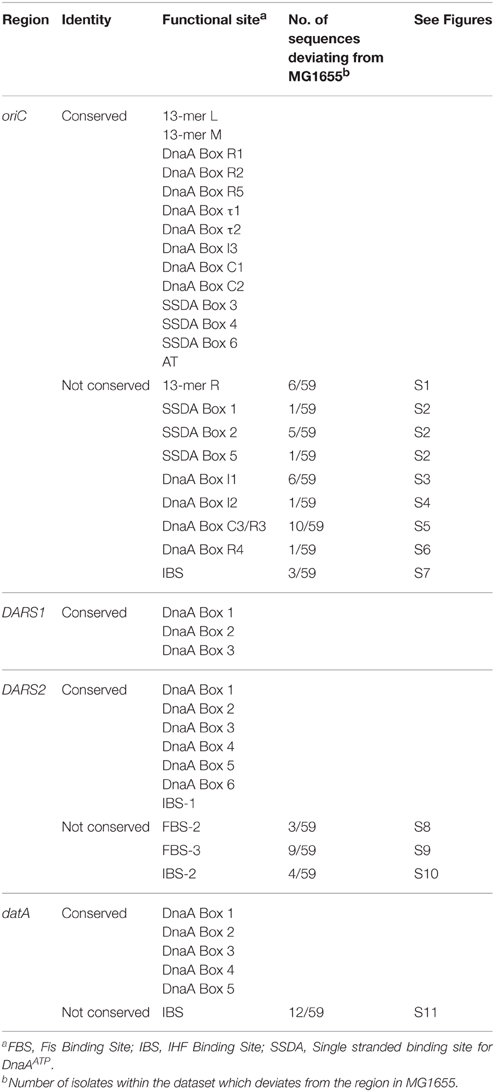
Table 1. Sequence deviations in conserved regions of oriC, DARS1, DARS2 and datA.
oriC
In oriC both of the AT-rich 13-mer regions L and M were identical among the 59 strains, whereas the R 13-mer varied in the two outer positions (Supplementary Figure S1). Three of the six 6-mer sites present in the AT-rich region (Supplementary Figures S3, S4, S6) that specifies binding of DnaAATP when in the single stranded configuration (Figure 1) were identical to the same regions in MG1655. However, Supplementary Figures S1, S2, S5 carries single nucleotide changes relative to MG1655 in a subset of strains. In five strains a nucleotide alteration was found in the single stranded DnaA-ATP box 2 that demolished a GATC-site, which is the substrate for Dam methyltransferase (Supplementary Figure S2).
The majority of DnaA binding sites in oriC (R1, R2, R5, τ1, τ2, I3, C1, and C2) were completely conserved, whereas R3, C3, I1, I2, and R4 binding sites carried differences to the corresponding MG1655 sequences in some strains (Supplementary Figure S12). Controversy about which of DnaA Box R3 and DnaA Box C3 are functional during unwinding of oriC exists (Kaur et al., 2014). The DnaA Box R3 overlaps with both DnaA Box C2 and C3 (Figure 1; Supplementary Figure S12). Nonetheless, all three DnaA boxes are included in the present study.
The consensus sequence for the R-box is TTWTNCACA (W is dA or dT and N is any nucleotide) (Schaper and Messer, 1995). In MG1655 DnaA Box I1 differs from the R-box consensus sequence by three nucleotides, while DnaA Box C3 and I2 differ by four nucleotides (Grimwade et al., 2000; Ryan et al., 2002; Rozgaja et al., 2011). We only identified sequence alterations that resulted in an altered identity to the R-box consensus sequences for DnaA binding sites, I2, R3, and R4. The I2 binding site from strain ED1a was found to fit better to the R-box consensus sequence compared to the DnaA box I2 sequence from MG1655 (Supplementary Figure S4). The MG1655 DnaA Box R3 differs from the R-box consensus sequence by one nucleotide, while the 10 E. coli strains deviating from the MG1655 DnaA Box R3 sequence deviate from the R-box consensus sequence by two nucleotides (Supplementary Figure S5). Strain 0127:H6 E2348/69 deviates from the R-box consensus sequence by a nucleotide in DnaA Box R4 (Supplementary Figure S6). The change from a dT to a dC in nucleotide position number 4 diminishes the identity to the R-box consensus sequence.
The IHF binding site consensus sequence is WATCAANNNNTTR [W is dA or dT, R is dA or dG, and N is any nucleotide (Hales et al., 1994)]. Three strains were found to differ with respect to the oriC IBS (Supplementary Figure S7). O26:H11 str. 11368 was found to have a diminished identity to the IHF consensus sequence compared to MG1655, while both O145:H28 str. RM12761 and O145:H28 str. RM13516 was found to have a better fit. The Fis binding site in oriC was found completely conserved in all strains (Supplementary Figure S12).
The nucleotide distances between the protein binding regions were highly conserved between strains. Only O26:H11 str. 11368 and O111:H- str. 11128 lacked a nucleotide in the spacer region between the AT-rich 13-mer termed R and the DnaA Box R1 in oriC compared to MG1655 (Supplementary Figure S12).
Based on this analysis it is hard to deduce a hierarchy of the importance of the different DnaA binding sites in oriC. Ten strains had changes in the R3/C3 boxes. Whereas the alterations resulted in a R3 box with poorer resemblance to the R-box consensus, this was not the case for C3. Therefore, it is likely that C3 represents the functional DnaA binding site in the replication origins.
DARS1, DARS2, and datA
All DnaA binding sites in datA, DARS1, and DARS2 were completely conserved between the strains analyzed (Table 1) (Supplementary Figures S13–S15). FBS-2 of DARS2 differed from that of MG1655 in three strains. However, since Fis has the consensus sequences GNNYANNNNNTRNNC (Y is dC or dT, R is dA or dG, and N is any nucleotide) (Finkel and Johnson, 1992) none of the observed differences resulted in a reduced similarity to the Fis consensus sequence (Supplementary Figure S8). For FBS-3 of DARS2, four E. coli strains differed from MG1655 and had a reduced identity the Fis consensus sequence (Supplementary Figure S9).
The IHF binding site IBS-1 of DARS2 was identical in all 59 genomes. The sequence variations of IBS-2 of DARS2 (Supplementary Figure S10) or the IBS in datA (Supplementary Figure S11), relative to MG1655 did not change the identity to the IHF consensus sequences. The datA region of strains HS and O103:H2 str. 12009 DNA lacked four nucleotides between DnaA Box 1 and DnaA Box 2, while strain 536 lacked a nucleotide between the IBS and DnaA Box 3.
Altogether, these observations suggest that there is a strong selection pressure on maintaining the sequence and spacing of protein binding sites, and thereby functionality of oriC, DARS1, DARS2, and datA. The majority of the nucleotide differences observed was located in the non-functional spacer regions between the different protein binding sites. The majority of differences found within protein binding sites, did not reduce the identity to the investigated consensus sequence.
Importance of datA, DARS1, and DARS2 for Cell Cycle Control
Despite of the conservation of the chromosomal positions of DARS1, DARS2, and datA relative to oriC, neither is essential (Kitagawa et al., 1998; Fujimitsu et al., 2009). Cells with and without datA were also previously found to have similar doubling times (Kitagawa et al., 1998). We created cells with deletions of datA, DARS1, and DARS2 individually and in various combinations. These cells were viable no matter which combination of DARS1, DARS2, and datA we deleted. The cellular doubling time was not affected by individual deletions but increased when combinations of DARS1, DARS2, and datA were deleted (Table 2). Cells carrying ΔDARS1 ΔDARS2 and ΔDARS1 ΔDARS2 ΔdatA were found to have the longest doubling time in minimal medium supplemented with glucose and casamino acids, while ΔDARS1 ΔdatA and ΔDARS2 ΔdatA cells were found to have the longest doubling time in the same medium without casamino acids (Table 2).
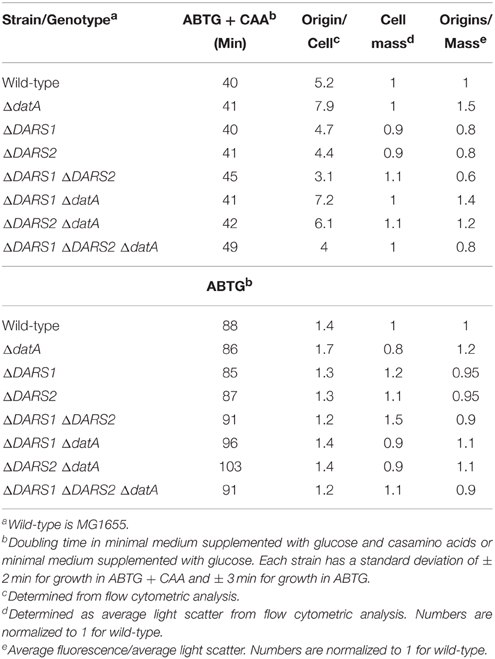
Table 2. Cell cycle parameters of mutant strains.
We used lacZ fusions of dnaA and mioC promoters to assess the effect of datA, DARS1, and DARS2 loss on the cellular DnaAATP/DnaAADP ratio. The dnaA gene is transcribed from two upstream promoters, termed dnaA1p and dnaA2p. Four DnaA boxes are located between the two promoters, with only one of them containing the stringent consensus sequence (Hansen et al., 1982, 2007; Armengod et al., 1988). Both dnaA promoters are negatively regulated by the DnaA protein (Hansen et al., 2007), with DnaAATP being most efficient in repressing dnaA expression (Speck et al., 1999). DnaAATP also repress the mioC promoter located upstream of oriC prior to initiation by binding to five DnaA boxes located within and/or close the promoter. Of the five DnaA boxes only one contains the stringent consensus sequence (Figure 1) (Ogawa and Okazaki, 1994; Bogan and Helmstetter, 1997; Hansen et al., 2007). Loss of datA resulted in a slight repression of dnaA (Table 3). This is in agreement with an increase in the DnaAATP/DnaAADP ratio, and the dnaA promoter being repressed by DnaAATP (Kitagawa et al., 1998; Speck et al., 1999; Kasho and Katayama, 2013). Loss of DARS1 led to an increased expression of the mioC gene while loss of DARS2 led to an increased expression of both the dnaA and mioC genes (Table 3), since both promoters are subject to negative transcriptional control by DnaAATP (Speck et al., 1999; Hansen et al., 2007). This agrees with DARS1 and DARS2 being instrumental in increasing the cellular DnaAATP level, and that DARS2 is more efficient than DARS1 (Fujimitsu et al., 2009).
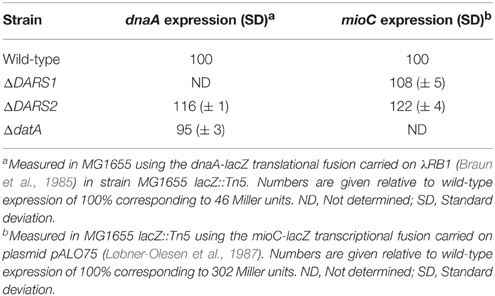
Table 3. Expression of the dnaA and mioC genes.
We proceeded to analyze the cell cycle characteristics by flow cytometry (Table 2; Figure 4). Wild-type cells exhibited the expected synchronous initiation pattern with the majority of cells containing 2, 4, or 8 replication origins (Figure 4A) (Skarstad et al., 1986). datA deficient cells had an increased origin concentration (origins/mass) (Kitagawa et al., 1998), which resulted both from an increase number of origins per cell and a decreased cell mass (during slow growth only) (Table 2). A high degree of initiation asynchrony was observed for ΔdatA cells (Figure 4E) (Kitagawa et al., 1998). Cells deficient in DARS1, DARS2 or both regions had a reduced origin concentration relative to wild-type cells (Table 2; Figures 4B–D) (Fujimitsu et al., 2009). Compared to wild-type, all DARS mutant cells had an increased cell mass during slow growth whereas only the ΔDARS1 ΔDARS2 double mutant had increased cell mass during fast growth. Asynchrony of initiation was observed for ΔDARS2 (Figure 4C) and ΔDARS1 ΔDARS2 (Figure 4D) cells, but not for cells carrying the ΔDARS1 mutation alone (Figure 4B) (Fujimitsu et al., 2009).
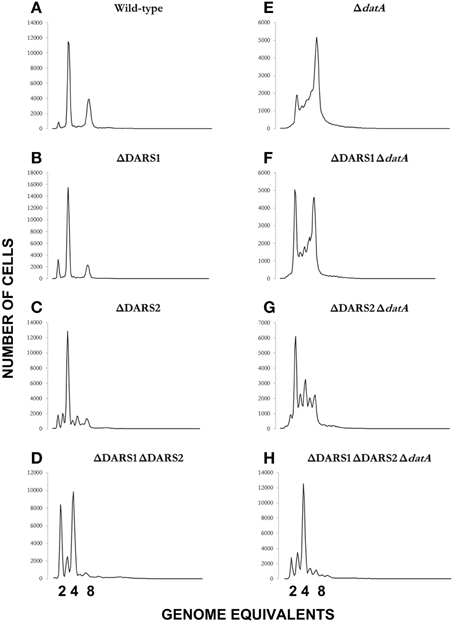
Figure 4. Cellular origin distribution. Prior to flow cytometric analysis exponentially growing wild-type and mutant cells was treated with rifampicin and cephalexin. Cells were grown in AB minimal medium supplemented with 0.2% glucose, 10 μg/ml thiamine, and 0.5% casamino acids at 37°C. Wild-type is MG1655 (A); relevant mutations are indicated in individual panels (B–H).
Because the datA region promotes inactivation of DnaAATP to DnaAADP, and the DARS regions promote the opposite, i.e., DnaA reactivation, we decided to see whether loss of DARS1, DARS2 or both could suppress the initiation defect of datA cells. Deletion of DARS1 in ΔdatA cells only marginally lowered the origin per mass (from 1.5 to 1.4; Table 2). A similar but larger effect was observed when DARS2 was deleted suggesting that DARS2 is more efficient than DARS1 for DnaA rejuvenation. Deleting both DARS1 and DARS2 in ΔdatA cells lowered the origin concentration below wild-type level (Table 2) and also partly restored initiation synchrony (Figure 4H). Overall, these experiments show that loss of rejuvenation activity overcompensates for loss of DDAH. This may be explained by the RIDA process, which being active in the triple mutant so that DnaAATP to DnaAADP conversion is still ongoing.
DARS1 and DARS2 are Required for Mouse Colonization
In order to examine the fitness cost of losing DARS or datA activity we performed two different competition experiments: continued growth in LB medium and during mouse colonization, where the streptomycin-treated mouse was chosen as the in vivo model. For both competition experiments strains were introduced pairwise at approximately equal numbers (Figure 5). If they have the same fitness they would also be recovered in equal numbers.
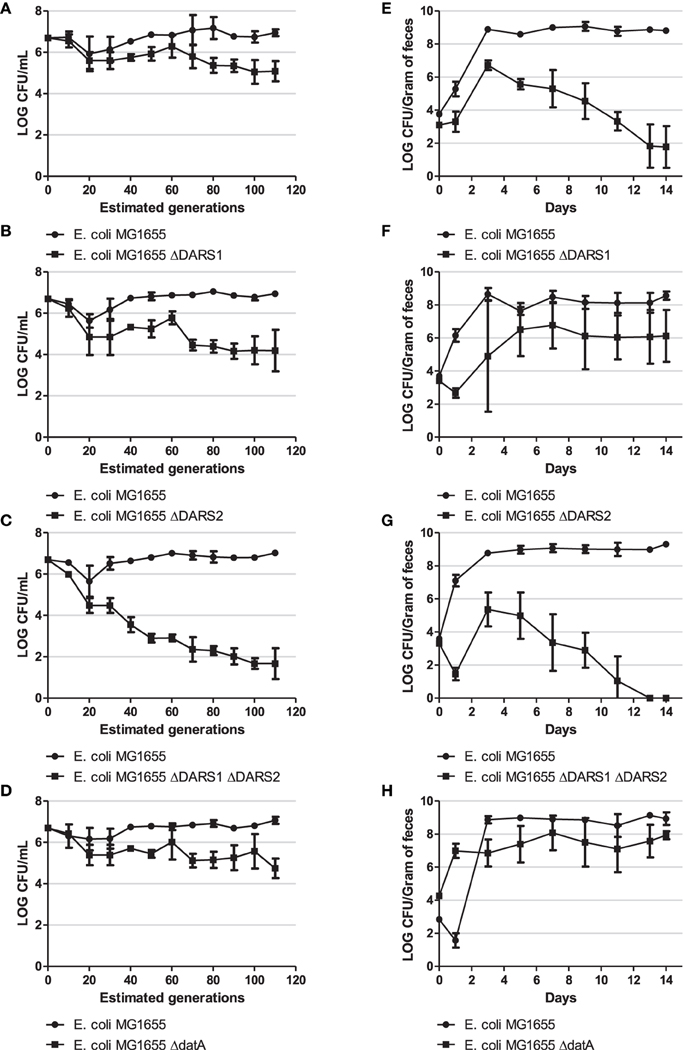
Figure 5. Competition experiment. Competition experiment in LB medium (A–D) and during colonization of the mouse large intestine (E–H) for MG1655 and MG1655 ΔDARS1 (A,E, respectively), MG1655 and MG1655 ΔDARS2 (B,F, respectively), MG1655 and MG1655 ΔDARS1 ΔDARS2 (C,G, respectively), and MG1655 and MG1655 ΔdatA (D,H, respectively). At the indicated times, samples were homogenized, diluted, and plated as described in Materials and Methods. Bars represent the standard error of the log10 mean number of CFU per mL (competition experiment in LB medium) or CFU per gram of feces (mice experiment).
During growth in LB the wild-type was more fit than the cells deficient in either DARS1, DARS2, both DARS1 and DARS2, or datA (Figure 5). The biggest fitness cost resulted from loss of both DARS1 and DARS2 (Figure 5C) followed by loss of DARS2 (Figure 5B) loss of DARS1 (Figure 5A) which was similar to loss of datA (Figure 5D).
The same order of fitness was not observed when evaluated in mice. Following colonization, the number of wild-type E. coli increased for about 3 days until stabilizing around 109 cfu per gram of mouse feces (Figures 5E–H). Cells deficient in DARS1 increased in number to peak at about 107 cfu/gram feces at day 3 followed by a rapid decline in number over the next days to end around 102 cfu/gram feces at day 14 (Figure 5E) suggesting that these cells were rapidly out-competed by wild-type cells. Cells deficient in both DARS1 and DARS2 (Figure 5G) were outcompeted at a slightly faster rate than cells deficient in only DARS1, suggesting that DARS2 plays a minor role to DARS1 in fitness during mouse colonization. In agreement with this, DARS2 mutant cells were able to coexist in the mouse along with wild-type cells albeit at a lower number (Figure 5F). Loss of datA was similar to the loss of DARS2. Following co-infection in mice both wild-type and datA cells increased in numbers to level at 109 and 107 cfu per gram feces, respectively, and remained at these levels for the duration of the experiment (Figure 5H). Therefore, datA and DARS2 deficient cells were poor at establishing colonization relative to the wild-type, but once established cells were not outcompeted with time.
On day 14 post-feeding, wild-type and a ΔDARS1, ΔDARS2, ΔDARS1 ΔDARS2, or ΔdatA cells (depending on the competition experiment) were isolated from the feces of each mouse for further study. The origin per mass and asynchrony index score were determined for each strain isolated post-infection and found to be similar to the initial strains fed to each mouse [data not shown] showing that secondary mutations were not likely to have been selected during growth in the mouse.
Overall these experiments indicate that different factors determine fitness of cells dependent on growth conditions. During continued growth in LB medium, both promotion and prevention of DnaAATP to DnaAADP conversion resulted in a fitness cost. On the other hand, overinitiation resulting from DnaAATP accumulation in datA cells did not seem to affect mouse colonization to the same extent as loss of rejuvenation ability, especially promoted by DARS1.
Discussion
In this study we found conservation in distances from oriC to the non-coding regions DARS1, DARS2, datA, and dif in E. coli. DARS1 and datA were always found on the same replichore, while DARS2 were found on the other replichore. The oriC, DARS1, DARS2, and datA regions were found to be structurally similar among the tested E. coli, with most of the sequence differences found to be in the non-functional spacer regions between key protein binding sites. Cells deficient in DARS1, DARS2, or datA were viable and had doubling times similar to wild-type. However, replication initiation was perturbed. Cells deficient in datA were found to initiate asynchronously, and this could not be counteracted by further deletions of either DARS1 or DARS2. Cells deficient in DARS1, DARS2, DARS1, and DARS2, or datA were found to be less fit than the wild-type in both LB medium and during mouse colonization.
Conservation of oriC
In the chromosomal context initiation of replication can be initiated from a mutant oriC without DnaA box R2, R3, R4, or R5, the IBS or the FBS (Weigel et al., 2001), as well as DnaA boxes I1, I2, or I3 (Riber et al., 2009). It is also possible to invert the direction of R4, add 14 bp between DnaA Box R3 and DnaA Box R4, or delete the right half of oriC (from position 275 to 352) (Weigel et al., 2001). Although DnaA Box R1 was originally found to be essential (Weigel et al., 2001), a more efficient recombining technique demonstrated that DnaA Box R1 is also dispensable (Kaur et al., 2014). Surprisingly, only deletion of DnaA Box R3, R4, and the right half of oriC (from position 275 to 352) was reported to result in slow growth relative to wild-type cells (Weigel et al., 2001). Asynchrony, a sensitive measure for perturbations of the initiation process, was observed with the deletion of the IBS, DnaA Box R2, R4, R5, extending the spacer region between R3 and R4 (Weigel et al., 2001), and the deletion of DnaA Box R1 (Kaur et al., 2014). These studies demonstrate that initiation from oriC is very robust and that only major changes in the origin results in loss of function altogether. On the other hand mutant origins fail to compete with their wild-type counterparts as shown by the inability to establish minichromosomes carrying oriC mutations in cells with a wild-type chromosomal copy of oriC (Weigel et al., 2001). It is conceivable that a similar competition takes place between cells in a population and that even small changes in important regions of oriC, that does not affect viability, may result in replication perturbation, loss of fitness and inability to co-exist with wild-type cells and that this explain the high degree of oriC conservation observed.
Chromosomal Position of datA, DARS1, and DARS2
The relative chromosomal locations of the datA, DARS1, and DARS2 regions are conserved among E. coli strains. This is somewhat surprising as E. coli genomes are highly fluidic, i.e., they frequently mutate, change size, and rearrange. The frequency of genome rearrangement, measured between rrn sites, is about 103–104 changes/(generation.genome) (Hill and Gray, 1988). For example, the 1.34 Mb DNA unique to O157:H7 EDL933, is inserted compared to MG1655 in such a way that the chromosomal location of datA, DARS1, and DARS2 relative to oriC, remain unchanged. Similarly, the non-essential DNA that was removed from MG1655 to create MSD42 (Pósfai et al., 2006), was also dispersed between regions so that MSD42 has the same relative chromosomal location of datA, DARS1, and DARS2. There may be at least three reasons for the conserved location of the three regions. First, chromosome asymmetry, i.e., different lengths of the two replication arms leads to slow growth (Hill and Gray, 1988). Second, chromosomal rearrangements resulting in a mixture of different macrodomains have deleterious effects of cell growth (Esnault et al., 2007) which may explain why datA, DARS1 and DARS2 regions located within the Ori MD, the Right MD and NSLeft, respectively (Valens et al., 2004), are always found on the same replichore. Third, the correct chromosomal location of DARS1, DARS2, and datA may be important for proper function and cell cycle progression (see below). As the activity of these regions in modulating DnaA binding to ATP or ADP is dependent on their copy number the proper distance to oriC becomes important for function. The relative copy number of DARS1, DARS2, and datA (replication-associated gene dosage) decreases with distance from oriC (Bremer and Churchward, 1977; Couturier and Rocha, 2006). datA was always found close to oriC. It is therefore conceivable that, datA is duplicated while oriC is still sequestered (Kitagawa et al., 1998; Kasho and Katayama, 2013), in all strains. The datA site promotes DnaAATP to DnaAADP conversion, to prevent re-initiation when the concentration of DnaAATP is high, i.e., just after sequestration ends and this may provide the evolutionary pressure that has resulted in a conserved chromosomal location. In agreement with this relocation of datA to a chromosomal position close to terC resulted in high asynchrony in initiation of replication while other positions closer to oriC resulted in a near wild-type phenotype (Kitagawa et al., 1998). It is likely that the chromosomal positions of DARS1 and DARS2 are also important for cell cycle control as they serve to re-activate the DnaA initiator protein in time for the next initiation. Relocation of DARS sequences has not been experimentally pursued. It is however tempting to speculate that the genomic arrangement of DARS1 and DARS2 will ensure that rejuvenation of DnaAADP to DnaAATP will be accelerated during later stages of the replication cycle and following duplication of these regions. This rejuvenation is important for increasing the DnaAATP level for the following round of initiations.
The datA, DARS1, and DARS2 Regions are Important for Fitness
In the DARS1 and DARS2 regions, all DnaA binding boxes as well as spacer distances were conserved among E. coli species. Especially the DARS1 region had a very low mutation frequency which is consistent with reports that all three DnaA boxes along with the region flanking the last DnaA Box (42 bp spanning from base number 198–239) is required for full ADP-releasing activity of in vitro (Fujimitsu et al., 2009). Similarly DnaA Box 1 and DnaA Box 2 are crucial for ADP-releasing activity of DARS2, while DnaA Box 3 is required for full ADP-releasing activity in vitro (Fujimitsu et al., 2009). IBS1–2 and FBS2–3 are required for DnaAATP regeneration in vivo (Kasho et al., 2014). In four E. coli isolates, FBS-3 has a weaker sequence identity to the Fis consensus sequence than in MG1655. Fis-binding sites are difficult to define due to the lack of an obvious consensus sequence (Finkel and Johnson, 1992), and the effect of the observed weaker identity in FBS-3 is hard to interpret.
DARS2 was previously reported to be more efficient in rejuvenation of DnaAADP to DnaAATP than DARS1 (Fujimitsu et al., 2009) and both the fitness experiment performed in LB medium (compare Figure 5A and Figure 5B) and the dnaA and mioC expression studies agreed with this. The situation was reversed in the mouse model where loss of DARS1 was associated with the biggest fitness cost (compare Figure 5E and Figure 5F). DARS2 is activated by the binding of both IHF and Fis, whereas no protein factors are required for the function of DARS1 (Fujimitsu et al., 2009; Kasho et al., 2014). While IHF is abundant in the cell during every growth phase, although the concentration is highest in the stationary phase (Azam and Ishihama, 1999), the concentration of Fis is dependent on the growth phase; i.e., it is highly abundant (10,000–50,000 molecules/cell) in early exponential phase, but decrease to < 100 molecules/cell from late exponential phase to stationary phase. The level of Fis also varies during steady state growth; i.e., it is low during slow growth and high during fast growth (Nilsson et al., 1992; Flåtten and Skarstad, 2013). Limited data are available on the growth of E. coli in mouse intestines but overall slow growth was reported with doubling times between 80 and 125 min (Rang et al., 1999). It also seems reasonable that cells under these conditions never reaches exponential growth but grows whenever food becomes available, i.e., with relative short growth phases and frequent entries into stationary phase. Therefore, the bacterial Fis level during intestinal colonization may be significantly lower than during fast exponential growth in rich medium. The relative contribution of DARS2 to DnaA rejuvenation may therefore be low in the mouse, and explain the bigger fitness cost associated with loss of DARS1 under these conditions. In agreement with this we only observed a minor further fitness cost associated with deletion of DARS2 in DARS1 deficient cells. Such ΔDARS1 ΔDARS2 cells rely on de novo synthesis of DnaA or the speculated DARS3 to produce DnaAATP during colonization of a mouse (Kasho et al., 2014). The fitness cost associated with loss of DARS1 or DARS2 may readily explain why mutations are rarely observed in these regions, but not the conserved distance to oriC. This needs to further elucidated by relocation to other chromosomal positions.
The activity of datA is absolutely dependent on DnaA Boxes 2 and 3 along with the IBS (Nozaki et al., 2009; Kasho and Katayama, 2013). Also the spacing between DnaA Box 2 and IBS, as well as the spacing between the IBS and DnaA Box 3 has been shown to be important for datA function (Nozaki et al., 2009; Kasho and Katayama, 2013). In accordance with this we found all DnaA boxes as well as the identities to the IHF consensus sequence were conserved. Changes were only observed in the length of the spacer region between DnaA Box 1 and DnaA Box 2 in strain HS and O103:H2 str. 12009 and between the IBS and DnaA Box 3 in strain 536. The effect of the altered spacing is hard to interpret although the latter may lead to a lower efficiency in converting DnaAATP to DnaAADP compared to MG1665 (Nozaki et al., 2009). Cells deficient in datA only had a 5% decrease in dnaA expression correlating with previous reports showing that a datA deletion slightly (i.e., 5–10%) increased the DnaAATP level (Katayama et al., 2001). Loss of datA accompanied overinitiation only resulted in modest fitness cost during fast growth in LB and during colonization. The DDAH and RIDA (Hda dependent) pathways both contribute to convert DnaAATP to DnaAADP in E. coli, but where loss of RIDA is associated with severe overinitiation and inviability unless second site suppressor mutations arise (Riber et al., 2006); loss of DDAH is tolerated. Therefore, DDAH plays a minor role to RIDA and this may explain the limited fitness cost of datA cells. The limited fitness cost of losing datA relates poorly to the high degree of conservation observed between species. We do not have a good explanation for this observation but it may relate to the DDAH process being important during growth conditions other than those employed by us.
Of interest the Gram-positive bacteria Bacillus subtilis and Streptomyces coelicolor contain DnaA box clusters close to oriC that can repress untimely initiation (Smulczyk-Krawczyszyn et al., 2006; Okumura et al., 2012), i.e., a function similar to that of datA in E. coli. In addition, several E. coli related bacterial species contains DARS1-like sequence and DARS2-like sequences in a genomic position similar to that of E. coli (Fujimitsu et al., 2009; Kasho et al., 2014). These observations indicates that both datA and DARSs mechanism, and genomic positions, maybe common to many bacterial species whose genomes contain DnaA box clusters.
Author Contributions
JF and AL planned the experiments. JF performed the experiments. JF, GC, KK, and AL analyzed data. JF and AL wrote the manuscript.
Funding
This work was supported by grant PIRG05-GA-2009-247241 from the European Union, by grant 09-064250/FNU from the Danish Research Council for Natural sciences, by grant 09-067075 from the Danish Strategic Research Council and by grants from the Lundbeck Foundation and the Novo Nordisk Foundation.
Conflict of Interest Statement
The authors declare that the research was conducted in the absence of any commercial or financial relationships that could be construed as a potential conflict of interest.
Acknowledgments
We thank Shiraz Shah for help with the bioinformatics analysis and Michaela Lederer for technical assistance.
Supplementary Material
The Supplementary Material for this article can be found online at: http://journal.frontiersin.org/article/10.3389/fmicb.2015.01011
References
Armengod, M. E., García-Sogo, M., and Lambíes, E. (1988). Transcriptional organization of the dnaN and recF genes of Escherichia coli K-12. J. Biol. Chem. 263, 12109–12114.
Azam, T. A., and Ishihama, A. (1999). Twelve species of the nucleoid-associated protein from Escherichia coli. Sequence recognition specificity and DNA binding affinity. J. Biol. Chem. 274, 33105–33113. doi: 10.1074/jbc.274.46.33105
Bergthorsson, U., and Ochman, H. (1998). Distribution of chromosome length variation in natural isolates of Escherichia coli. Mol. Biol. Evol. 15, 6–16. doi: 10.1093/oxfordjournals.molbev.a025847
Bigot, S., Saleh, O. A., Lesterlin, C., Pages, C., El Karoui, M., Dennis, C., et al. (2005). KOPS: DNA motifs that control E. coli chromosome segregation by orienting the FtsK translocase. EMBO J. 24, 3770–3780. doi: 10.1038/sj.emboj.7600835
Bogan, J. A., and Helmstetter, C. E. (1997). DNA sequestration and transcription in the oriC region of Escherichia coli. Mol. Microbiol. 26, 889–896. doi: 10.1046/j.1365-2958.1997.6221989.x
Braun, R. E., O'Day, K., and Wright, A. (1985). Autoregulation of the DNA replication gene dnaA in E. coli K-12. Cell 40, 159–169. doi: 10.1016/0092-8674(85)90319-8
Bremer, H., and Churchward, G. (1977). An examination of the Cooper-Helmstetter theory of DNA replication in bacteria and its underlying assumptions. J. Theor. Biol. 69, 645–654. doi: 10.1016/0022-5193(77)90373-3
Buss, J., Coltharp, C., Shtengel, G., Yang, X., Hess, H., and Xiao, J. (2015). A multi-layered protein network stabilizes the Escherichia coli FtsZ-ring and modulates constriction dynamics. PLoS Genet. 11:e1005128. doi: 10.1371/journal.pgen.1005128
Campbell, J. L., and Kleckner, N. (1990). E. coli oriC and the dnaA gene promoter are sequestered from dam methyltransferase following the passage of the chromosomal replication fork. Cell 62, 967–979. doi: 10.1016/0092-8674(90)90271-F
Campo, N., Dias, M. J., Daveran-Mingot, M. L., Ritzenthaler, P., and Le Bourgeois, P. (2004). Chromosomal constraints in Gram-positive bacteria revealed by artificial inversions. Mol. Microbiol. 51, 511–522. doi: 10.1046/j.1365-2958.2003.03847.x
Cherepanov, P. P., and Wackernagel, W. (1995). Gene disruption in Escherichia coli: TcR and KmR cassettes with the option of Flp-catalyzed excision of the antibiotic-resistance determinant. Gene 158, 9–14. doi: 10.1016/0378-1119(95)00193-A
Couturier, E., and Rocha, E. P. (2006). Replication-associated gene dosage effects shape the genomes of fast-growing bacteria but only for transcription and translation genes. Mol. Microbiol. 59, 1506–1518. doi: 10.1111/j.1365-2958.2006.05046.x
Datsenko, K. A., and Wanner, B. L. (2000). One-step inactivation of chromosomal genes in Escherichia coli K-12 using PCR products. Proc. Natl. Acad. Sci. U.S.A. 97, 6640–6645. doi: 10.1073/pnas.120163297
Eisen, J. A., Heidelberg, J. F., White, O., and Salzberg, S. L. (2000). Evidence for symmetric chromosomal inversions around the replication origin in bacteria. Genome Biol. 1:RESEARCH0011. doi: 10.1186/gb-2000-1-6-research0011
Esnault, E., Valens, M., Espéli, O., and Boccard, F. (2007). Chromosome structuring limits genome plasticity in Escherichia coli. PLoS Genet. 3:e226. doi: 10.1371/journal.pgen.0030226
Espeli, O., Borne, R., Dupaigne, P., Thiel, A., Gigant, E., Mercier, R., et al. (2012). A MatP-divisome interaction coordinates chromosome segregation with cell division in E. coli. EMBO J. 31, 3198–3211. doi: 10.1038/emboj.2012.128
Fekete, R. A., and Chattoraj, D. K. (2005). A cis-acting sequence involved in chromosome segregation in Escherichia coli. Mol. Microbiol. 55, 175–183. doi: 10.1111/j.1365-2958.2004.04392.x
Finkel, S. E., and Johnson, R. C. (1992). The Fis protein: it's not just for DNA inversion anymore. Mol. Microbiol. 6, 3257–3265. doi: 10.1111/j.1365-2958.1992.tb02193.x
Flåtten, I., and Skarstad, K. (2013). The Fis protein has a stimulating role in initiation of replication in Escherichia coli in vivo. PLoS ONE 8:e83562. doi: 10.1371/journal.pone.0083562
Fujimitsu, K., Senriuchi, T., and Katayama, T. (2009). Specific genomic sequences of E. coli promote replicational initiation by directly reactivating ADP-DnaA. Genes Dev. 23, 1221–1233. doi: 10.1101/gad.1775809
Fuller, R. S., Funnell, B. E., and Kornberg, A. (1984). The dnaA protein complex with the E. coli chromosomal replication origin (oriC) and other DNA sites. Cell 38, 889–900. doi: 10.1016/0092-8674(84)90284-8
Grimwade, J. E., Ryan, V. T., and Leonard, A. C. (2000). IHF redistributes bound initiator protein, DnaA, on supercoiled oriC of Escherichia coli. Mol. Microbiol. 35, 835–844. doi: 10.1046/j.1365-2958.2000.01755.x
Groisman, E. A., and Ochman, H. (1997). How Salmonella became a pathogen. Trends Microbiol. 5, 343–349. doi: 10.1016/S0966-842X(97)01099-8
Hales, L. M., Gumport, R. I., and Gardner, J. F. (1994). Determining the DNA sequence elements required for binding integration host factor to two different target sites. J. Bacteriol. 176, 2999–3006.
Hansen, E. B., Hansen, F. G., and Von Meyenburg, K. (1982). The nucleotide sequence of the dnaA gene and the first part of the dnaN gene of Escherichia coli K-12. Nucleic Acids Res. 10, 7373–7385. doi: 10.1093/nar/10.22.7373
Hansen, F. G., Christensen, B. B., and Atlung, T. (2007). Sequence characteristics required for cooperative binding and efficient in vivo titration of the replication initiator protein DnaA in E. coli. J. Mol. Biol. 367, 942–952. doi: 10.1016/j.jmb.2007.01.056
Hayashi, K., Morooka, N., Yamamoto, Y., Fujita, K., Isono, K., Choi, S., et al. (2006). Highly accurate genome sequences of Escherichia coli K-12 strains MG1655 and W3110. Mol. Syst. Biol. 2:2006.0007. doi: 10.1038/msb4100049
Hendrickson, H., and Lawrence, J. G. (2007). Mutational bias suggests that replication termination occurs near the dif site, not at Ter sites. Mol. Microbiol. 64, 42–56. doi: 10.1111/j.1365-2958.2007.05596.x
Hill, C. W., and Gray, J. A. (1988). Effects of chromosomal inversion on cell fitness in Escherichia coli K-12. Genetics 119, 771–778.
Hill, T. M., Henson, J. M., and Kuempel, P. L. (1987). The terminus region of the Escherichia coli chromosome contains two separate loci that exhibit polar inhibition of replication. Proc. Natl. Acad. Sci. U.S.A. 84, 1754–1758. doi: 10.1073/pnas.84.7.1754
Kaper, J. B., Nataro, J. P., and Mobley, H. L. (2004). Pathogenic Escherichia coli. Nat. Rev. Microbiol. 2, 123–140. doi: 10.1038/nrmicro818
Kasho, K., Fujimitsu, K., Matoba, T., Oshima, T., and Katayama, T. (2014). Timely binding of IHF and Fis to DARS2 regulates ATP-DnaA production and replication initiation. Nucleic Acids Res. 42, 13134–13149. doi: 10.1093/nar/gku1051
Kasho, K., and Katayama, T. (2013). DnaA binding locus datA promotes DnaA-ATP hydrolysis to enable cell cycle-coordinated replication initiation. Proc. Natl. Acad. Sci. U.S.A. 110, 936–941. doi: 10.1073/pnas.1212070110
Katayama, T., Fujimitsu, K., and Ogawa, T. (2001). Multiple pathways regulating DnaA function in Escherichia coli: distinct roles for DnaA titration by the datA locus and the regulatory inactivation of DnaA. Biochimie 83, 13–17. doi: 10.1016/S0300-9084(00)01206-2
Kato, J., and Katayama, T. (2001). Hda, a novel DnaA-related protein, regulates the replication cycle in Escherichia coli. EMBO J. 20, 4253–4262. doi: 10.1093/emboj/20.15.4253
Kaur, G., Vora, M. P., Czerwonka, C. A., Rozgaja, T. A., Grimwade, J. E., and Leonard, A. C. (2014). Building the bacterial orisome: high-affinity DnaA recognition plays a role in setting the conformation of oriC DNA. Mol. Microbiol. 91, 1148–1163. doi: 10.1111/mmi.12525
Kawakami, H., Keyamura, K., and Katayama, T. (2005). Formation of an ATP-DnaA-specific initiation complex requires DnaA Arginine 285, a conserved motif in the AAA+ protein family. J. Biol. Chem. 280, 27420–27430. doi: 10.1074/jbc.M502764200
Keyamura, K., Fujikawa, N., Ishida, T., Ozaki, S., Su'Etsugu, M., Fujimitsu, K., et al. (2007). The interaction of DiaA and DnaA regulates the replication cycle in E. coli by directly promoting ATP DnaA-specific initiation complexes. Genes Dev. 21, 2083–2099. doi: 10.1101/gad.1561207
Kitagawa, R., Ozaki, T., Moriya, S., and Ogawa, T. (1998). Negative control of replication initiation by a novel chromosomal locus exhibiting exceptional affinity for Escherichia coli DnaA protein. Genes Dev. 12, 3032–3043. doi: 10.1101/gad.12.19.3032
Köhler, C. D., and Dobrindt, U. (2011). What defines extraintestinal pathogenic Escherichia coli? Int. J. Med. Microbiol. 301, 642–647. doi: 10.1016/j.ijmm.2011.09.006
Kurokawa, K., Nishida, S., Emoto, A., Sekimizu, K., and Katayama, T. (1999). Replication cycle-coordinated change of the adenine nucleotide-bound forms of DnaA protein in Escherichia coli. EMBO J. 18, 6642–6652. doi: 10.1093/emboj/18.23.6642
Leatham, M. P., Stevenson, S. J., Gauger, E. J., Krogfelt, K. A., Lins, J. J., Haddock, T. L., et al. (2005). Mouse intestine selects nonmotile flhDC mutants of Escherichia coli MG1655 with increased colonizing ability and better utilization of carbon sources. Infect. Immun. 73, 8039–8049. doi: 10.1128/IAI.73.12.8039-8049.2005
Leatham-Jensen, M. P., Frimodt-Møller, J., Adediran, J., Mokszycki, M. E., Banner, M. E., Caughron, J. E., et al. (2012). The streptomycin-treated mouse intestine selects Escherichia coli envZ missense mutants that interact with dense and diverse intestinal microbiota. Infect. Immun. 80, 1716–1727. doi: 10.1128/IAI.06193-11
Leimbach, A., Hacker, J., and Dobrindt, U. (2013). E. coli as an all-rounder: the thin line between commensalism and pathogenicity. Curr. Top. Microbiol. Immunol. 358, 3–32. doi: 10.1007/978-3-662-45793-1_303
Liu, S. L., and Sanderson, K. E. (1995a). The chromosome of Salmonella paratyphi A is inverted by recombination between rrnH and rrnG. J. Bacteriol. 177, 6585–6592.
Liu, S. L., and Sanderson, K. E. (1995b). I-CeuI reveals conservation of the genome of independent strains of Salmonella typhimurium. J. Bacteriol. 177, 3355–3357.
Løbner-Olesen, A., Atlung, T., and Rasmussen, K. V. (1987). Stability and replication control of Escherichia coli minichromosomes. J. Bacteriol. 169, 2835–2842.
Løbner-Olesen, A., Skarstad, K., Hansen, F. G., von Meyenburg, K., and Boye, E. (1989). The DnaA protein determines the initiation mass of Escherichia coli K-12. Cell 57, 881–889. doi: 10.1016/0092-8674(89)90802-7
Lu, M., Campbell, J. L., Boye, E., and Kleckner, N. (1994). SeqA: a negative modulator of replication initiation in E. coli. Cell 77, 413–426. doi: 10.1016/0092-8674(94)90156-2
Margulies, C., and Kaguni, J. M. (1998). The FIS protein fails to block the binding of DnaA protein to oriC, the Escherichia coli chromosomal origin. Nucleic Acids Res. 26, 5170–5175. doi: 10.1093/nar/26.22.5170
McGarry, K. C., Ryan, V. T., Grimwade, J. E., and Leonard, A. C. (2004). Two discriminatory binding sites in the Escherichia coli replication origin are required for DNA strand opening by initiator DnaA-ATP. Proc. Natl. Acad. Sci. U.S.A. 101, 2811–2816. doi: 10.1073/pnas.0400340101
Medini, D., Donati, C., Tettelin, H., Masignani, V., and Rappuoli, R. (2005). The microbial pan-genome. Curr. Opin. Genet. Dev. 15, 589–594. doi: 10.1016/j.gde.2005.09.006
Mercier, R., Petit, M. A., Schbath, S., Robin, S., El Karoui, M., Boccard, F., et al. (2008). The MatP/matS site-specific system organizes the terminus region of the E. coli chromosome into a macrodomain. Cell 135, 475–485. doi: 10.1016/j.cell.2008.08.031
Miller, C. P., and Bohnhoff, M. (1963). Changes in the mouse's enteric microflora associated with enhanced susceptibility to salmonella infection following streptomycin treatment. J. Infect. Dis. 113, 59–66. doi: 10.1093/infdis/113.1.59
Miller, J. (1972). Experiments in Molecular Genetics. Cold Spring Harbor, NY: Cold Spring Harbor Laboratory.
Niki, H., Yamaichi, Y., and Hiraga, S. (2000). Dynamic organization of chromosomal DNA in Escherichia coli. Genes Dev. 14, 212–223. doi: 10.1101/gad.14.2.212
Nilsson, L., Verbeek, H., Vijgenboom, E., Van Drunen, C., Vanet, A., and Bosch, L. (1992). FIS-dependent trans activation of stable RNA operons of Escherichia coli under various growth conditions. J. Bacteriol. 174, 921–929.
Nozaki, S., Yamada, Y., and Ogawa, T. (2009). Initiator titration complex formed at datA with the aid of IHF regulates replication timing in Escherichia coli. Genes Cells 14, 329–341. doi: 10.1111/j.1365-2443.2008.01269.x
Ogawa, T., and Okazaki, T. (1994). Cell cycle-dependent transcription from the gid and mioC promoters of Escherichia coli. J. Bacteriol. 176, 1609–1615.
Okumura, H., Yoshimura, M., Ueki, M., Oshima, T., Ogasawara, N., and Ishikawa, S. (2012). Regulation of chromosomal replication initiation by oriC-proximal DnaA-box clusters in Bacillus subtilis. Nucleic Acids Res. 40, 220–234. doi: 10.1093/nar/gkr716
Ozaki, S., and Katayama, T. (2012). Highly organized DnaA-oriC complexes recruit the single-stranded DNA for replication initiation. Nucleic Acids Res. 40, 1648–1665. doi: 10.1093/nar/gkr832
Perna, N. T., Plunkett, G. III., Burland, V., Mau, B., Glasner, J. D., Rose, D. J., et al. (2001). Genome sequence of enterohaemorrhagic Escherichia coli O157:H7. Nature 409, 529–533. doi: 10.1038/35054089
Pósfai, G., Plunkett, G. III., Fehér, T., Frisch, D., Keil, G. M., Umenhoffer, K., et al. (2006). Emergent properties of reduced-genome Escherichia coli. Science 312, 1044–1046. doi: 10.1126/science.1126439
Rang, C. U., Licht, T. R., Midtvedt, T., Conway, P. L., Chao, L., Krogfelt, K. A., et al. (1999). Estimation of growth rates of Escherichia coli BJ4 in streptomycin-treated and previously germfree mice by in situ rRNA hybridization. Clin. Diagn. Lab. Immunol. 6, 434–436.
Rasko, D. A., Rosovitz, M. J., Myers, G. S., Mongodin, E. F., Fricke, W. F., Gajer, P., et al. (2008). The pangenome structure of Escherichia coli: comparative genomic analysis of E. coli commensal and pathogenic isolates. J. Bacteriol. 190, 6881–6893. doi: 10.1128/JB.00619-08
Riber, L., Fujimitsu, K., Katayama, T., and Lobner-Olesen, A. (2009). Loss of Hda activity stimulates replication initiation from I-box, but not R4 mutant origins in Escherichia coli. Mol. Microbiol. 71, 107–122. doi: 10.1111/j.1365-2958.2008.06516.x
Riber, L., Olsson, J. A., Jensen, R. B., Skovgaard, O., Dasgupta, S., Marinus, M. G., et al. (2006). Hda-mediated inactivation of the DnaA protein and dnaA gene autoregulation act in concert to ensure homeostatic maintenance of the Escherichia coli chromosome. Genes Dev. 20, 2121–2134. doi: 10.1101/gad.379506
Rozgaja, T. A., Grimwade, J. E., Iqbal, M., Czerwonka, C., Vora, M., and Leonard, A. C. (2011). Two oppositely oriented arrays of low-affinity recognition sites in oriC guide progressive binding of DnaA during Escherichia coli pre-RC assembly. Mol. Microbiol. 82, 475–488. doi: 10.1111/j.1365-2958.2011.07827.x
Ryan, V. T., Grimwade, J. E., Camara, J. E., Crooke, E., and Leonard, A. C. (2004). Escherichia coli prereplication complex assembly is regulated by dynamic interplay among Fis, IHF and DnaA. Mol. Microbiol. 51, 1347–1359. doi: 10.1046/j.1365-2958.2003.03906.x
Ryan, V. T., Grimwade, J. E., Nievera, C. J., and Leonard, A. C. (2002). IHF and HU stimulate assembly of pre-replication complexes at Escherichia coli oriC by two different mechanisms. Mol. Microbiol. 46, 113–124. doi: 10.1046/j.1365-2958.2002.03129.x
Schaper, S., and Messer, W. (1995). Interaction of the initiator protein DnaA of Escherichia coli with its DNA target. J. Biol. Chem. 270, 17622–17626. doi: 10.1074/jbc.270.29.17622
Sekimizu, K., Bramhill, D., and Kornberg, A. (1987). ATP activates dnaA protein in initiating replication of plasmids bearing the origin of the E. coli chromosome. Cell 50, 259–265. doi: 10.1016/0092-8674(87)90221-2
Sherratt, D. J., Søballe, B., Barre, F. X., Filipe, S., Lau, I., Massey, T., et al. (2004). Recombination and chromosome segregation. Philos. Trans. R. Soc. Lond. B Biol. Sci. 359, 61–69. doi: 10.1098/rstb.2003.1365
Skarstad, K., Boye, E., and Steen, H. B. (1986). Timing of initiation of chromosome replication in individual Escherichia coli cells. EMBO J. 5, 1711–1717.
Skarstad, K., and Katayama, T. (2013). Regulating DNA replication in bacteria. Cold Spring Harb. Perspect. Biol. 5:a012922. doi: 10.1101/cshperspect.a012922
Smulczyk-Krawczyszyn, A., Jakimowicz, D., Ruban-Osmialowska, B., Zawilak-Pawlik, A., Majka, J., Chater, K., et al. (2006). Cluster of DnaA boxes involved in regulation of Streptomyces chromosome replication: from in silico to in vivo studies. J. Bacteriol. 188, 6184–6194. doi: 10.1128/JB.00528-06
Speck, C., and Messer, W. (2001). Mechanism of origin unwinding: sequential binding of DnaA to double- and single-stranded DNA. EMBO J. 20, 1469–1476. doi: 10.1093/emboj/20.6.1469
Speck, C., Weigel, C., and Messer, W. (1999). ATP- and ADP-dnaA protein, a molecular switch in gene regulation. EMBO J. 18, 6169–6176. doi: 10.1093/emboj/18.21.6169
Valens, M., Penaud, S., Rossignol, M., Cornet, F., and Boccard, F. (2004). Macrodomain organization of the Escherichia coli chromosome. EMBO J. 23, 4330–4341. doi: 10.1038/sj.emboj.7600434
Weigel, C., Messer, W., Preiss, S., Welzeck, M., Morigen, and Boye, E. (2001). The sequence requirements for a functional Escherichia coli replication origin are different for the chromosome and a minichromosome. Mol. Microbiol. 40, 498–507. doi: 10.1046/j.1365-2958.2001.02409.x
Wold, S., Crooke, E., and Skarstad, K. (1996). The Escherichia coli Fis protein prevents initiation of DNA replication from oriC in vitro. Nucleic Acids Res. 24, 3527–3532. doi: 10.1093/nar/24.18.3527
Keywords: E. coli, oriC, non-coding replication control regions, datA, DARS1 and DARS2, fitness in vitro and in vivo
Citation: Frimodt-Møller J, Charbon G, Krogfelt KA and Løbner-Olesen A (2015) Control regions for chromosome replication are conserved with respect to sequence and location among Escherichia coli strains. Front. Microbiol. 6:1011. doi: 10.3389/fmicb.2015.01011
Received: 06 August 2015; Accepted: 07 September 2015;
Published: 24 September 2015.
Edited by:
Feng Gao, Tianjin University, ChinaReviewed by:
Dhruba Chattoraj, National Institutes of Health, USATsutomu Katayama, Kyushu University, Japan
Copyright © 2015 Frimodt-Møller, Charbon, Krogfelt and Løbner-Olesen. This is an open-access article distributed under the terms of the Creative Commons Attribution License (CC BY). The use, distribution or reproduction in other forums is permitted, provided the original author(s) or licensor are credited and that the original publication in this journal is cited, in accordance with accepted academic practice. No use, distribution or reproduction is permitted which does not comply with these terms.
*Correspondence: Anders Løbner-Olesen, Department of Biology, Section for Functional Genomics and Center for Bacterial Stress Response and Persistence, University of Copenhagen, Ole Maaløe's Vej 5, 2200 Copenhagen, Denmark,bG9ibmVyQGJpby5rdS5kaw==