- 1State Key Laboratory of Animal Nutrition, Institute of Animal Sciences, Chinese Academy of Agricultural Sciences, Beijing, China
- 2Animal Science Unit, Gembloux Agro-Bio Tech, University of Liège, Gembloux, Belgium
Urea, a non-protein nitrogen for dairy cows, is rapidly hydrolyzed to ammonia by urease produced by ureolytic bacteria in the rumen, and the ammonia is used as nitrogen for rumen bacterial growth. However, there is limited knowledge with regard to the ureolytic bacteria community in the rumen. To explore the ruminal ureolytic bacterial community, urea, or acetohydroxamic acid (AHA, an inhibitor of urea hydrolysis) were supplemented into the rumen simulation systems. The bacterial 16S rRNA genes were sequenced by Miseq high-throughput sequencing and used to reveal the ureoltyic bacteria by comparing different treatments. The results revealed that urea supplementation significantly increased the ammonia concentration, and AHA addition inhibited urea hydrolysis. Urea supplementation significantly increased the richness of bacterial community and the proportion of ureC genes. The composition of bacterial community following urea or AHA supplementation showed no significant difference compared to the groups without supplementation. The abundance of Bacillus and unclassified Succinivibrionaceae increased significantly following urea supplementation. Pseudomonas, Haemophilus, Neisseria, Streptococcus, and Actinomyces exhibited a positive response to urea supplementation and a negative response to AHA addition. Results retrieved from the NCBI protein database and publications confirmed that the representative bacteria in these genera mentioned above had urease genes or urease activities. Therefore, the rumen ureolytic bacteria were abundant in the genera of Pseudomonas, Haemophilus, Neisseria, Streptococcus, Actinomyces, Bacillus, and unclassified Succinivibrionaceae. Insights into abundant rumen ureolytic bacteria provide the regulation targets to mitigate urea hydrolysis and increase efficiency of urea nitrogen utilization in ruminants.
Introduction
The use of urea in feeds of ruminants is increasing to reduce the supplementation of true protein and the costs of rations. The recommendations of urea would be for no more than 1% in the concentrate, ~135 g/cow daily (Kertz, 2010). In the rumen, ureolytic bacteria produce urease to hydrolyze urea to ammonia, which is subsequently used for the synthesis of amino acids and microbial protein. Normally, the rate of urea hydrolysis exceeds the rate of ammonia utilization, which leads to poor efficiency of urea utilization in the rumen and explosion of toxic ammonia in the blood (Patra, 2015). Acetohydroxamic acid (AHA), an inhibitor of urease activity that prevents the rapid hydrolysis of urea and consequent explosion of ammonia in rumen, is commonly applied in the rations of ruminants (Upadhyay, 2012).
Ureolytic bacteria play an important role in the hydrolysis of urea in the rumen. Previous studies have isolated some ureolytic bacteria from the rumen including Succinovibrio dextrinosolvens, Treponema sp., Ruminococcus bromii, Butyrivibrio sp., Bifidobacterium sp., Prevotella ruminicola, and Peptostreptococcus productus (Wozny et al., 1977). However, due to the difficulty in cultivating the rumen bacteria, those that have been isolated represent only 6.5% of the community (Kim et al., 2011). Thus, sequencing and phylogenetic analysis of 16S rRNA genes and functional genes have been extensively used in studies focused on members of the uncultured bacteria. By sequencing, ureolytic bacterial diversity has been observed in the environment including open oceans (Collier et al., 2009), groundwater (Gresham et al., 2007), sponges (Su et al., 2013), and soil (Singh et al., 2009). We have previously studied rumen ureolytic bacteria using a urease gene clone library, and found that ureolytic bacterial composition in the rumen was distinct from that in the environment (Zhao et al., 2015). Therefore, it is interesting and meaningful to explore the rumen ureolytic bacterial communities further.
Rumen simulation systems have been developed and used in the evaluation of feeds nutrients degradation and rumen fermentation manipulation in order to avoid the use of animals or decrease study costs (Hristov et al., 2012). We invented a dual-flow continuous rumen simulation system with real-time monitoring of pH, temperature, gas production, methane, and carbon dioxide concentration (Figure S1). We demonstrated that the conditions of microbial fermentation in the system were similar to those in the rumen of dairy cows (Shen et al., 2012), making it a powerful and practical tool for the study of rumen microbes or fermentation.
The objective of this study was to reveal abundant ureolytic bacterial community by high-throughput sequencing in a rumen simulation system when treated with an activator (urea) or inhibitor (AHA) of ureolytic bacteria.
Materials and Methods
Experimental Design and Continuous Cultivation
The rumen simulation system with eight fermenters were used in two replicated periods of 10 d each (7 d for adaptation and 3 d for sampling; Shen et al., 2012). The basic total mixed ration (TMR) was ground down to 1 mm for subsequent use. Fermenters were assigned to four treatments: U0_A0 (basic diet only), U0_A0.45 [basic diet plus AHA of 0.45 g/kg dry matter (DM)], U5_A0 (basic diet plus urea of 5 g/kg DM), U5_A0.45 (basic diet plus urea of 5 g/kg DM and AHA of 0.45 g/kg DM). Two fermenters were randomly assigned to each treatment in each period. A total of 40 g feed (DM based) was placed into each fermenter daily in two equal portions at 09:00 and 21:00. Urea and AHA were dissolved in artificial saliva (Weller and Pilgrim, 1974) and were added directly into the fermenters after each feeding. The basic diet (DM based) primarily consisted of alfalfa hay (17.72%), corn silage (17.50%), oaten hay (5.09%), cotton seed (5.61%), apple pulp (3.74%), sugar beet pulp (6.71%), and compound packet (40.95%). The compound packet provided the following per kg of diets: steam corn 180.39 g, soybean skin 55.84 g, soybean meal 64.43 g, extruded soybean 38.66 g, distillers dried grains with soluble (DDGS) 24.48 g, double-low rapeseed meal 25.77 g, Ca(HCO3)2 2.58 g, CaCO3 2.58 g, NaCl 3.44 g, and NaHCO3 6.01 g (Table S1).
On the first day of each period, all fermenters were inoculated with ruminal fluid obtained from three rumen-fistulated cows fed the same TMR diet as used in the in vitro study. Animals involved in this study were cared for according to the principles of the Chinese Academy of Agricultural Sciences Animal Care and Use Committee (Beijing, China). Ruminal fluid was strained through four layers of cheesecloth and transferred to the laboratory in a sealed container. A total 500 mL of the strained ruminal fluid was added to each of the eight fermenters, which also contained 500 mL of artificial saliva. Anaerobic conditions were established by flushing the headspace of the fermenters with N2 at a rate of 20 mL min−1. The artificial saliva was continuously infused into the flasks. The temperature of the fermenters was maintained at 39°C by circulating water, and the fermenter content was stirred continuously at 25 rpm.
Rumen Fluid Sampling and DNA Extraction
During the last 3 days of each period, 3 mL of fermenter liquid was collected from each fermenter at 0, 2, 4, 6, 8, and 10 h after morning feeding. Collected samples were stored at −80°C for detection of ammonia nitrogen (NH3-N) and urea nitrogen (urea-N) concentrations. The NH3-N concentration was determined using the method based on the Berthelot (phenol–hypochlorite) reaction (Broderick and Kang, 1980). Urea nitrogen (urea-N) concentration was determined using the diacetyl monoxime method with a commercial kit (Nanjing Jiancheng Co., Nanjing, China). Rumen fluid collected at 2 h was used to extract microbial DNA with a cetyl trimethylammonium bromide (CTAB) plus bead beating method (Minas et al., 2011). Extracted DNA was assessed by agarose gel (1%) electrophoresis and quantified using a Nanodrop™ spectrometer (Thermo Scientific, Waltham, MA, USA).
Quantitative PCR of Urease and 16S rRNA Genes
The urease alpha subunit encoding gene (ureC) primers UreC-F (5′-TGGGCCTTAAAATHCAYGARGAYTGGG-3′) and UreC-R (5′-SGGTGGTGGCACACCATNANCATRTC-3) were used to quantify the ureC gene copies (Reed, 2001). 16S rRNA gene of total bacteria were quantified using 338-F (5′-ACTCCTACGGGAGGCAGCAG-3′) and 533-R (5′-TTA CCGCGGCTGCTGGCAC -3′) as primers (Huse et al., 2008). The assays were performed in an iQ™5 Multicolor Real-Time PCR Detection System (Bio-Rad, Hercules, CA, USA) using SYBR® Premix Ex Taq™ II (Takara, Dalian, China). Standard curves were generated using plasmids DNA cloned with ureC gene or 16S rRNA gene (Figure S2). Copy number of ureC gene or 16S rRNA gene in per ng of DNA was determined by relating the CT value to the standard curves. The proportion of ureC gene copies was calculated as the ratio of ureC gene copies to total 16S rRNA gene copies. The detailed qPCR protocols were provided in the Supplementary Material. The proportion of ureC gene copies in each treatment were shown in a boxplot constructed using R (R Core Team, 2013).
Bacterial 16S rRNA Genes Amplification and Illumina Sequencing
Microbial DNA was used as a template for amplification of partial 16S rDNA sequence using the universal bacterial primers 515F (5′-GTGCCAGCMGCCGCGGTAA-3′) and 806R (5′- GGACTACHVGGGTWTCTAAT-3′; Nelson et al., 2014) with both primers tagged with unique barcode sequences for each sample. All polymerase chain reactions (PCRs) were carried out in 50 μL reactions with 0.5 μL of PrimeSTAR® HS DNA Polymerase (TaKaRa, Dalian, China), 10 μL 5 × PrimeSTAR Buffer (plus Mg2+) (TaKaRa), 0.2 μM of the forward and reverse primers, 200 μM dNTP (TaKaRa), and 100 ng microbial DNA. Thermal cycling consisted of initial denaturation at 98°C for 1 min, followed by 30 cycles of denaturation at 98°C for 10 s, annealing at 50°C for 30 s, and elongation at 72°C for 60 s, and a final elongation at 72°C for 5 min. Unique bands were identified using agarose gel (2%) electrophoresis of PCR amplicons (Figure S3). The bands were cut and purified with a QIAGEN MinElute PCR Purification Kit (Qiagen, Valencia, CA, USA). Amplicon libraries were generated using NEB Next® Ultra™ DNA Library Prep Kit for Illumina (New England Biolabs, Ipswich, MA, USA) following the manufacturer's recommendations, with the addition of index codes. Library quality was assessed on the Qubit® 2.0 Fluorometer (Thermo Scientific) and Agilent Bioanalyzer 2100 system. The library was sequenced on an Illumina MiSeq platform (2 × 250 bp).
Sequencing Data Processing and Analysis
Paired-end reads were merged using FLASH (Magoè and Salzberg, 2011). Merged reads were assigned to each sample based on the unique barcode, after which the barcodes and primers were removed. The quality of raw reads was checked, and reads were truncated at any site of >3 sequential bases receiving a quality score of < Q20, and reads with < 75% (of total read length) consecutive high quality base calls were removed (Caporaso et al., 2010; Bokulich et al., 2013). Chimeric sequences were detected and removed using UCHIME (Haas et al., 2011). Operational taxonomic units (OTU) were generated by aligning the reads to the GreenGenes database released in May 2013 (DeSantis et al., 2006) and clustered at 97% sequence identity using the PyNAST tool (Caporaso et al., 2010) and the UCLUST algorithm (Edgar et al., 2011). The OTUs were filtered based on the total observation count of an OTU < 10 and the number of samples in an OTU < 2 in QIIME (Caporaso et al., 2010). The OTUs were further assigned to taxa using the RDP classifier (Wang et al., 2007). The OTU table was rarified for alpha diversity analysis. Simpson, Shannon, Chao1, and the PD_whole_tree index were calculated for each sample. Good's coverage was used to estimate the percentage of the total species that were sequenced in each sample (Caporaso et al., 2010). QIIME was used to calculate the weighted UniFrac distances, which are phylogenetic measures of beta diversity. The weighted UniFrac distance was used for Principal Coordinate Analysis (PCoA; Lozupone et al., 2007). The significance of grouping in the PCoA plot was tested by analysis of similarity (ANOSIM) in QIIME with 999 permutations (R Core Team, 2013; Mahnert et al., 2015). The relative abundance of bacteria was expressed as the percentage. The potential ureolytic bacteria were selected using the criterion that their abundance increased with urea treatment and decreased with AHA treatment. The urease alpha subunit sequences of representative species from potential ureolytic bacteria were checked against the NCBI protein database and the urease activities of these bacteria were verified by published studies.
Statistical Analysis
Urea-N, ammonia, proportion of ureC gene copies, bacterial abundance, and diversity index were statistical analyzed using the SAS MIXED procedure (SAS Institute, Inc, Cary, NC) as shown in the following model: Yijk = μ + ai + bj + abij + eijk, where Yijk is the dependent variable, μ is the overall mean, ai is the effect of urea treatment i, bj is the effect of AHA treatment j, abij is the interaction between ai and bj (Both factors and their interaction are considered fixed effects), and eijk is the residual, assumed to be normally distributed. Data of bacterial abundance were transformed to log10 (n+1) if necessary to ensure normal distribution. Mean separation was conducted by using Fisher's least significant difference test. Differences were declared significant at P < 0.05. Tukey's test was used to determine where the differences occurred.
Nucleotide Sequence Accession Number
All the raw sequences after assembling and filtering were submitted to the NCBI Sequence Read Archive (SRA; http://www.ncbi.nlm.nih.gov/Traces/sra/), under accession number SRP074113.
Results
Changes of Urea, Ammonia Concentrations, and Proportion of ureC Genes
The urea-N concentrations in the two urea treated groups were higher (P < 0.01) than the other two groups at 2 h after morning feeding (Figure 1). In the two urea treated groups, Group U5_A0.45 exhibited a higher (P < 0.01) urea concentration than group U5_A0, indicating a decreased urea hydrolysis rate with AHA inhibition (Figure 1). The NH3-N concentrations of all four treatments showed a peak value after fermentation for 2 h. Urea supplementation significantly increased (P < 0.01) NH3-N concentration during whole sampling period, while in the two urea-treated groups, AHA addition also decreased NH3-N concentration significantly (P < 0.01). Two hours after the morning feeding, the proportion of ureC genes was higher (P < 0.05) in urea-treated groups than in non-urea treated groups. The addition of AHA did not have a significant effect on the proportion of ureC genes (Figure 2).
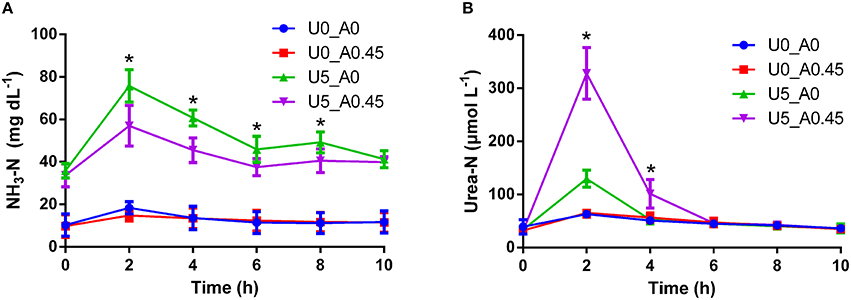
Figure 1. Changes of NH3-N and urea-N concentrations induced by urea and AHA supplementation. (A) Changes of NH3-N concentration. (B) Changes of urea-N concentration. U0_A0, basic diet only; U0_A0.45, basic diet plus AHA of 0.45 g/kg DM; U5_A0, basic diet plus urea of 5 g/kg DM; U5_A0.45, basic diet plus urea of 5 g/kg DM and AHA of 0.45 g/kg DM. *Means values in group U5_A0 was significantly different from that in group U5_A0.45 (P < 0.05).
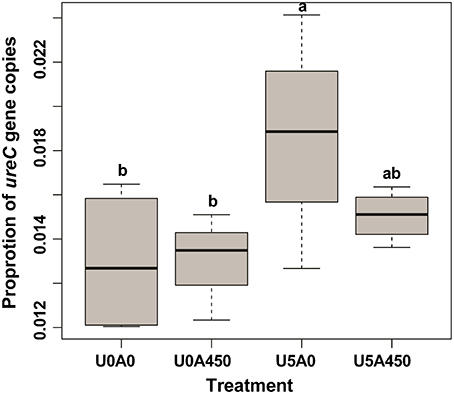
Figure 2. Changes in the proportion of ureC gene copies induced by urea and AHA supplementation. The proportion of ureC gene copies was calculated as the ratio of ureC gene copies to total 16S rRNA gene copies. U0_A0, basic diet only; U0_A0.45, basic diet plus AHA of 0.45 g/kg DM; U5_A0, basic diet plus urea of 5 g/kg DM; U5_A0.45, basic diet plus urea of 5 g/kg DM and AHA of 0.45 g/kg DM. a,bDifferent letters for different treatments indicate statistically significant differences (P < 0.05).
Changes of Ureolytic Bacterial Diversity
A total of 2,105,448 merged sequences were acquired from 16 samples, and 1,672,529 high-quality sequences, with an average read length of 253 bases were obtained. After removing chimeric sequences, the remaining 1,603,997 sequences were used to generate OTUs with 97% sequence similarity across all samples. The OTU table was filtered, leaving 5075 OTUs for subsequent analysis. Collectively, 24 bacterial phyla were identified. Bacteroidetes, Firmicutes, and Proteobacteria were the three predominant phyla, representing 35, 28, and 23% of all sequences, respectively (Figure 3). Genera that were each represented by ≥ 0.1% of the total sequences in at least 1 of the 16 samples were selected for further analysis. The 10 predominant genera were Prevotella, Treponema, YRC22, Succinivibrio, Porphyromonas, Oscillospira, Roseburia, Bacteroides, Butyrivibrio, and Coprococcus (Figure 4).
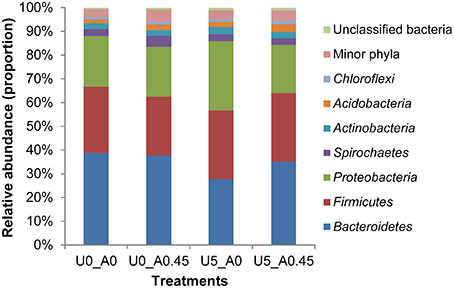
Figure 3. Composition of the most predominant bacterial phyla in the rumen. U0_A0, basic diet only; U0_A0.45, basic diet plus AHA of 0.45 g/kg DM; U5_A0, basic diet plus urea of 5 g/kg DM; U5_A0.45, basic diet plus urea of 5g/kg DM and AHA of 0.45 g/kg DM.
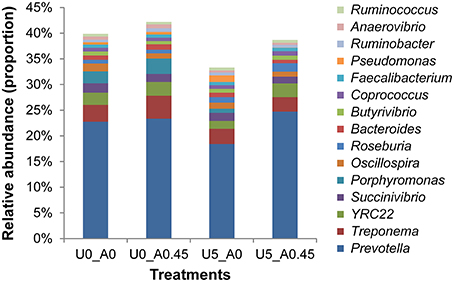
Figure 4. Composition of the most predominant bacterial genera in the rumen. U0_A0, basic diet only; U0_A0.45, basic diet plus AHA of 0.45 g/kg DM; U5_A0, basic diet plus urea of 5 g/kg DM; U5_A0.45, basic diet plus urea of 5 g/kg DM and AHA of 0.45 g/kg DM. The top 15 abundant bacteria genera were shown and the others were not shown. Other genera accounted for 60.11% in group U0_A0, 57.81% in group U0_A0.45, 66.68% in group U5_A0, and 61.31% in group U5_A0.45.
After rarefaction, 9000 sequences per sample were used for diversity analysis. Alpha bacterial diversity was presented in Table 1. Group U5_A0 had the highest Chao 1 and PD_whole_tree estimates, followed by groups U5_A0.45, U0_A0.45, and U0_A0. No significant differences were observed among the four groups based on the results of the Simpson and Shannon diversity index. PCoA analysis of overall diversity based on the unweighted UniFrac metrics was performed to compare the four treatments (Figure 5). ANOSIM (cutoff = 0.01) showed no significant differences in bacterial community composition between treatments U0_A0 and U0_A0.45 (R = −0.198, P = 0.925) or between treatments U5_A0 and U5_A0.45 (R = −0.135, P = 0.888). A tendency of difference was found between treatments U0_A0 and U5_A0 (R = 0.323, P = 0.091). Principal Coordinate 1 and 2 accounted for 44.19 and 25.14% of the total variation, respectively.
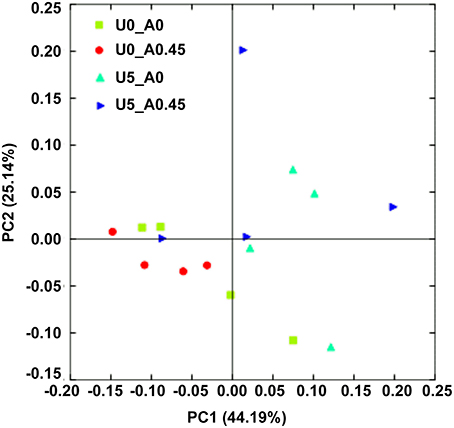
Figure 5. Principal coordinate analysis (PCoA) of the rumen bacterial community. The principal coordinate analysis is based on the weighted UniFrac distances between the microbiome profiles. U0_A0, basic diet only; U0_A0.45, basic diet plus AHA of 0.45 g/kg DM; U5_A0, basic diet plus urea of 5 g/kg DM; U5_A0.45, basic diet plus urea of 5 g/kg DM and AHA of 0.45 g/kg DM.
Changes of the Relative Abundance of Ureolytic Bacteria
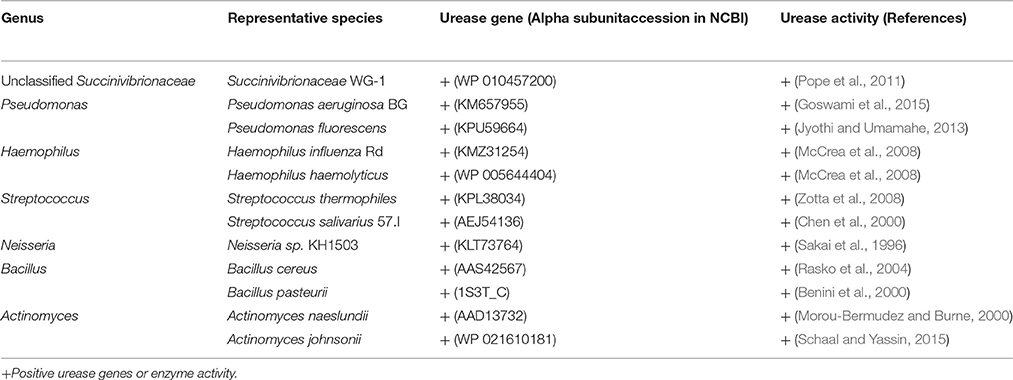
At the phylum level, the group treated with urea only had the highest proportion of Proteobacteria and Actinobacteria, and the lowest proportion of Bacteroidetes compared with the other three groups (Figure 3). Both of the two urea-treated groups had relatively high proportions of Acidobacteria and low proportions of Spirochaetes compared with the other two groups. In addition, the two urea-treated groups had higher percentages of unclassified bacteria than the other two groups. At the genus level, the relative abundance represented by ≥0.1% of the total sequences in at least one of the whole samples were further analyzed (Table 2). Pseudomonas (1.25%) from Proteobacteria and Streptococcus (1.00%) from Firmicutes were more predominant in group U5_A0 compared to the other three groups (P < 0.01). Haemophilus and Neisseria from Proteobacteria, and Actinomyces from Actinobacteria were the most abundant in the U5_A0 group compared with the other three groups (P < 0.05). The relative abundance of Bacillus from Firmicutes and unclassified Succinivibrionaceae were higher in the two urea-treated groups compared with the other two groups (P < 0.01). According to the results retrieved from the NCBI protein database and reported in previous studies, the representative species from Pseudomonas, Haemophilus, Streptococcus, Neisseria, Bacillus, Actinomyces, and unclassified Succinivibrionaceae were identified as containing urease genes and having urease activity (Table 3).
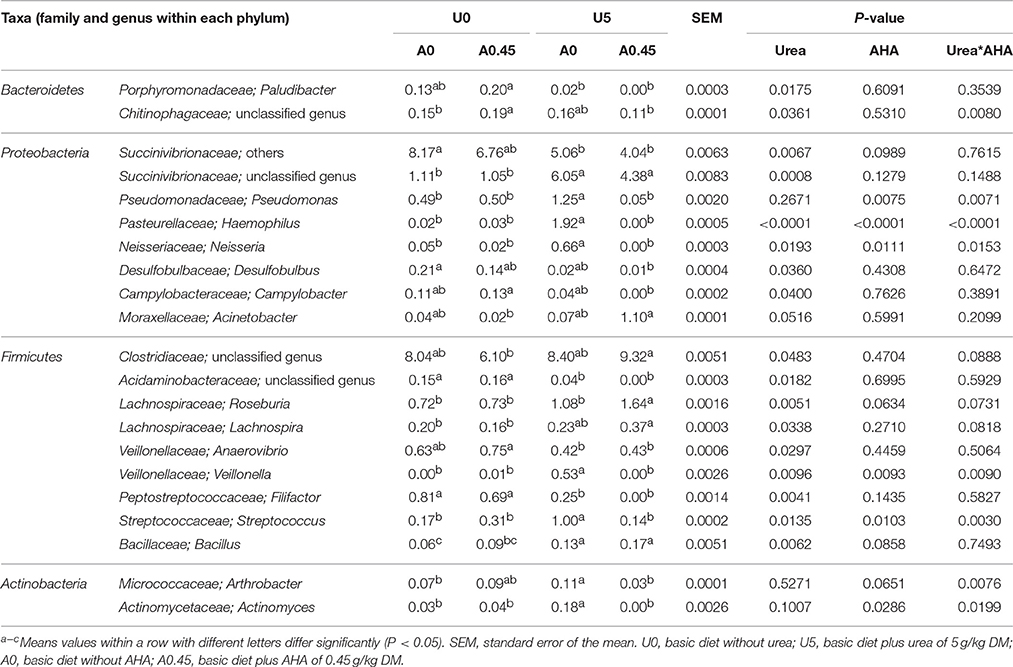
Table 2. Bacterial genera that accounted for ≥0.1% of the total sequences in at least one of the samples with significant variation under different treatments (abundance of the genera was expressed as %).
Discussion
In the rumen, urea is a source of nitrogen for the growth of ureolytic bacteria. AHA, an inhibitor of urease, inhibits urea usage by ureolytic bacteria, and results in insufficient nitrogen source for bacterial growth. In this study, we used urea and AHA to promote or inhibit the growth of rumen ureolytic bacteria, respectively. We observed that AHA is a useful inhibitor for slowing down the hydrolysis of urea within the rumen fluid. This is consistent with previously published studies in vivo (Jones and Milligan, 1975; Makkar et al., 1981).
Urea supplementation significantly increased bacterial community richness and the number of bacterial species. AHA supplementation resulted in no changes of richness and diversity of bacterial community. The proportion of urease gene copies was served as a proxy to observe changes in the proportion of ureolytic bacteria. Urea supplementation significantly increased the proportion of ureolytic bacteria, which suggested that urea stimulated the growth of rumen ureolytic bacteria. In addition, ANOSIM revealed that the composition of the entire bacterial community in urea-treated groups showed a trend of difference from those in non-urea treated groups (P < 0.10). Changes of the bacterial community in response to urea treatment were possibly related to urease activity and the production of ammonia. Kim et al. (2014) found that urease genes and enzyme activities were regulated by the level of ammonia in ruminal cellulytic bacteria Ruminococcus albus 8. The lack of a significant effect by AHA on the diversity of the rumen bacterial community may be due to microbial adaption of AHA. Previous studies found that rumen microbe could adapt to chronic AHA supplementation, while AHA was capable of short-term inhibition of urease activity in the rumen (Zhang et al., 2001).
Across the four groups, three phyla (Bacteroidetes, Firmicutes, and Proteobacteria) were predominant. Similar to our results previously published studies have reported that the distribution of phylotypes of rumen bacterial communities fell predominantly into these three phyla (Hook et al., 2011; Wu et al., 2012; Zhang et al., 2014). The bacterial community from our in vitro simulation system was thus similar to the communities observed in vivo. The group treated with urea only had the highest proportion of Proteobacteria and the lowest proportion of Bacteroidetes. In accordance, Collier et al. (2009) investigated the diversity of ureolytic microorganisms in open ocean and estuarine planktonic communities, and found that ureolytic microorganisms were most commonly found in Proteobacteria and rare in Bacteroidetes.
Bacillus was in higher abundance in the two groups supplemented with urea, indicating it was more responsive to urea. Bacillus spp. in the rumen is able to degrade hemicellulose, and produce polysaccharidases and glycoside hydrolases to utilize polysaccharide (Williams and Withers, 1983). B. pasteurii, B. lentus, and B. cereus have proven to be ureolytic bacteria (Benini et al., 2000; Rasko et al., 2004; Sarda et al., 2009), and the urease activity of B. pasteurii is inhibited by AHA (Benini et al., 2000). The unclassified Succinivibrionaceae was also observed at a higher relative abundance in the two urea-treated groups. In the rumen, Succinivibrionaceae is very common and important for degradation of starch, pectin, and dextrin to succinate and propionate (Santos and Thompson, 2014). Succinivibrionaceae WG-1 isolated from the foregut of tammar wallaby produced urease for urea catabolism (Pope et al., 2011). Several isolates of S. dextrinosolvens from the rumen were also shown to have urease activity (Wozny et al., 1977).
Pseudomonas and Streptococcus were both relatively more abundant in the group treated with urea only, but these bacteria had lower abundance in AHA-treated groups. These results confirmed the urea stimulating and AHA inhibiting effects on the microbial community. Several species of Pseudomonas and Streptococcus are able to hydrolyze cellulose (Lynd et al., 2002; Oyeleke and Okusanmi, 2008). In the genus Pseudomonas, species such as P. fluorescens (isolated from soil) and P. aeruginosa (isolated from ocean) possess urease activity (Jyothi and Umamahe, 2013; Goswami et al., 2015). In addition, two Streptococcal species, S. thermophiles and S. salivarius, also produce urease (Chen et al., 2000; Zotta et al., 2008). Kakimoto et al. (1989) assayed about 16,000 isolates from animal feces and intestines for production of acid urease, and found 370 urease-positive strains belonging to the genus Streptococcus. This is consistent with the results of our study in which Streptococcus were found in higher abundance in response to urea supplementation.
The relative abundance of genera Haemophilus, Neisseria, and Actinomyces increased in response to urea and decrease in response to AHA supplementation. The members of Haemophilus ferment glucose (Kilian, 2015), and H. haemolyticus and H. influenzae Rd have urease activity (McCrea et al., 2008). The H. somnus strains of ruminants have varying urea hydrolysis ability (Garcia-Delgado et al., 1977). Neisseria, a Gram-negative aerobic cocci, produces acid from different types of sugars, and some species are disease-causing (Marri et al., 2010). N. sicca strains SB and SC isolated from soil have proven to be urease positive (Sakai et al., 1996). Neisseria had a higher proportion in groups treated with urea, suggesting the potential of bacterial species in the rumen to have urea hydrolysis activity. Actinobacteria, a group of Gram-positive bacteria, represent up to 3.00% of the total rumen bacteria (Pandya et al., 2010; Šul'ák et al., 2012). Some strains of A. meyeri, A. radicidentis, and A. johnsonii are known to have urease activity (Schaal and Yassin, 2015), and A. naeslundii had urease gene and activity (Morou-Bermudez and Burne, 1999, 2000). However, An et al. (2006) described a novel species, Actinomyces ruminicola sp., from cattle rumen, was unable to hydrolyze urea. So it needs to be verified for ureolytic activity of different Actinomyces species.
Conclusion
The composition of bacterial community following urea or AHA supplementation treatment showed no significant difference compared to the groups without supplementation. In the rumen, the ureolytic bacteria were abundant in the genera including Pseudomonas, Streptococcus, Haemophilus, Bacillus, Neisseria, Actinomyces, and unclassified Succinivibrionaceae. The insights into abundant ureolytic bacteria provide the basis for designing strategies to efficiently manipulate the bacterial community or function and improve urea utilization in ruminant production.
Author Contributions
JW, DB, and SZ designed the experiments. DJ and PW performed the experiments. SZ and DJ analyzed the data. DJ wrote the paper. SZ, NZ, and YB revised the paper. All authors agree to be accountable for all aspects of the work.
Conflict of Interest Statement
The authors declare that the research was conducted in the absence of any commercial or financial relationships that could be construed as a potential conflict of interest.
Acknowledgments
This research was supported by the funds from National Natural Science Foundation of China (31430081 and 31261140365), the Agricultural Science and Technology Innovation Program (ASTIP-IAS12) and Modern Agro-Industry Technology Research System of the PR China (nycytx-04-01). We thank the University of Liège-Gembloux Agro-Bio Tech and more specifically the research platform Agriculture Is Life for the funding of the scientific stay in Belgium that made this paper possible.
Supplementary Material
The Supplementary Material for this article can be found online at: http://journal.frontiersin.org/article/10.3389/fmicb.2016.01006
References
An, D., Cai, S., and Dong, X. (2006). Actinomyces ruminicola sp. nov., isolated from cattle rumen. Int. J. Syst. Evol. Microbiol. 56, 2043–2048. doi: 10.1099/ijs.0.64059-0
Benini, S., Rypniewski, W. R., Wilson, K. S., Miletti, S., Ciurli, S., and Mangani, S. (2000). The complex of Bacillus pasteurii urease with acetohydroxamate anion from X-ray data at 1.55 Å resolution. J. Biol. Inorg. Chem. 5, 110–118. doi: 10.1007/s007750050014
Bokulich, N. A., Subramanian, S., Faith, J. J., Gevers, D., Gordon, J. I., Knight, et al. (2013). Quality-filtering vastly improves diversity estimates from Illumina amplicon sequencing. Nat. Meth. 10, 57–59. doi: 10.1038/nmeth.2276
Broderick, G. A., and Kang, J. H. (1980). Automated simultaneous determination of ammonia and total amino acids in ruminal fluid and in vitro media. J. Dairy Sci. 63, 64–75. doi: 10.3168/jds.S0022-0302(80)82888-8
Caporaso, J. G., Kuczynski, J., Stombaugh, J., Bittinger, K., and Bushman, F. D. (2010). QIIME allows analysis of highthroughput community sequencing data. Nat. Methods 7, 336–336. doi: 10.1038/nmeth.f.303
Chen, Y.-Y. M., Weaver, C. A., and Burne, R. A. (2000). Dual functions of Streptococcus salivarius urease. J. Bacteriol. 182, 4667–4669. doi: 10.1128/JB.182.16.4667-4669.2000
Collier, J. L., Baker, K. M., and Bell, S. L. (2009). Diversity of urea-degrading microorganisms in open-ocean and estuarine planktonic communities. Environ. Microbiol. 11, 3118–3131. doi: 10.1111/j.1462-2920.2009.02016.x
DeSantis, T. Z., Hugenholtz, P., Larsen, N., Rojas, M., Brodie, E. L., Keller, K., et al. (2006). Greengenes, a chimera-checked 16S rRNA gene database and workbench compatible with ARB. Appl. Environ. Microbiol. 72, 5069–5072. doi: 10.1128/AEM.03006-05
Edgar, R. C., Haas, B. J., Clemente, J. C., Quince, C., and Knight, R. (2011). UCHIME improves sensitivity and speed of chimera detection. Bioinformatics 27, 2194–2200. doi: 10.1093/bioinformatics/btr381
Garcia-Delgado, G., Little, P., and Barnum, D. (1977). A comparison of various haemophilus somnus strains. Can. J. Comp. Med. 41, 380.
Goswami, D., Patel, K., Parmar, S., Vaghela, H., Muley, N., Dhandhukia, P., et al. (2015). Elucidating multifaceted urease producing marine Pseudomonas aeruginosa BG as a cogent PGPR and bio-control agent. Plant Growth Regul. 75, 253–263. doi: 10.1007/s10725-014-9949-1
Gresham, T. L. T., Sheridan, P. P., Watwood, M. E., Fujita, Y., and Colwell, F. S. (2007). Design and validation ofurec-based primers for groundwater detection of urea-hydrolyzing bacteria. Geomicrobiol. J. 24, 353–364. doi: 10.1080/01490450701459283
Haas, B. J., Gevers, D., Earl, A. M., Feldgarden, M., Ward, D. V., Giannoukos, G., et al. (2011). Chimeric 16S rRNA sequence formation and detection in Sanger and 454-pyrosequenced PCR amplicons. Genome Res. 21, 494–504. doi: 10.1101/gr.112730.110
Hook, S. E., Steele, M. A., Northwood, K. S., Dijkstra, J., France, J., Wright, A. D., et al. (2011). Impact of subacute ruminal acidosis (SARA) adaptation and recovery on the density and diversity of bacteria in the rumen of dairy cows. FEMS Microbiol. Ecol. 78, 275–284. doi: 10.1111/j.1574-6941.2011.01154.x
Hristov, A. N., Lee, C., Hristova, R., Huhtanen, P., and Firkins, J. L. (2012). A meta-analysis of variability in continuous-culture ruminal fermentation and digestibility data. J. Dairy Sci. 95, 5299–5307. doi: 10.3168/jds.2012-5533
Huse, S. M., Dethlefsen, L., Huber, J. A., Welch, D. M., Relman, D. A., and Sogin, M. L. (2008). Exploring microbial diversity and taxonomy using SSU rRNA hypervariable tag sequencing. PLoS Genet. 4:e1000255. doi: 10.1371/journal.pgen.1000255
Jones, G. A., and Milligan, J. D. (1975). Influence on some rumen and blood parameters of feeding acetohydroxamic acid in a urea- containing ration for lambs. Can. J. Anim. Sci. 55, 39–47. doi: 10.4141/cjas75-006
Jyothi, N., and Umamahe, S. (2013). Production of protease and urease by kerosene utilizing fluorescent Pseudomonads isolated from local red latirite soil. Bioscan 8, 353–357.
Kakimoto, S., Okazaki, K., Sakane, T., Imai, K., Sumino, Y., Akiyama, S. I., et al. (1989). Isolation and taxonomie characterization of acid urease-producing bacteria. Agric. Biol. Chem. 53, 1111–1117. doi: 10.1080/00021369.1989.10869439
Kertz, A. F. (2010). Review: urea feeding to dairy cattle: a historical perspective and review. Prof. Anim. Sci. 26, 257–272. doi: 10.15232/s1080-7446(15)30593-3
Kilian, M. (2015). “Haemophilus,” in Bergey's Manual of Systematics of Archaea and Bacteria, ed W. B. Whitman (New York, NY: Springer), 1–47. doi: 10.1002/9781118960608.gbm01198
Kim, J. N., Henriksen, E. D., Cann, I. K., and Mackie, R. I. (2014). Nitrogen utilization and metabolism in Ruminococcus albus 8. Appl. Environ. Microbiol. 80, 3095–3102. doi: 10.1128/AEM.00029-14
Kim, M., Morrison, M., and Yu, Z. (2011). Status of the phylogenetic diversity census of ruminal microbiomes. FEMS Microbiol. Ecol. 76, 49–63. doi: 10.1111/j.1574-6941.2010.01029.x
Lozupone, C. A., Hamady, M., Kelley, S. T., and Knight, R. (2007). Quantitative and qualitative beta diversity measures lead to different insights into factors that structure microbial communities. Appl. Environ. Microbiol. 73, 1576–1585. doi: 10.1128/AEM.01996-06
Lynd, L. R., Weimer, P. J., van Zyl, W. H., and Pretorius, I. S. (2002). Microbial cellulose utilization: fundamentals and biotechnology. Microbiol. Mol. Biol. R 66, 506–577. doi: 10.1128/MMBR.66.3.506-577.2002
Magoè, T., and Salzberg, S. L. (2011). FLASH: fast length adjustment of short reads to improve genome assemblies. Bioinformatics 27, 2957–2963. doi: 10.1093/bioinformatics/btr507
Mahnert, A., Moissl-Eichinger, C., and Berg, G. (2015). Microbiome interplay: plants alter microbial abundance and diversity within the built environment. Front. Microbiol. 6:887. doi: 10.3389/fmicb.2015.00887
Makkar, H. P., Sharma, O. P., Dawra, R. K., and Negi, S. S. (1981). Effect of acetohydroxamic acid on rumen urease activity in vitro. J. Dairy Sci. 64, 643–648. doi: 10.3168/jds.S0022-0302(81)82624-0
Marri, P. R., Paniscus, M., Weyand, N. J., Rendon, M. A., Calton, C. M., Hernandez, D. R., et al. (2010). Genome sequencing reveals widespread virulence gene exchange among human Neisseria species. PLoS ONE 5:e11835. doi: 10.1371/journal.pone.0011835
McCrea, K. W., Xie, J., LaCross, N., Patel, M., Mukundan, D., Murphy, T. F., et al. (2008). Relationships of nontypeable Haemophilus influenzae strains to hemolytic and nonhemolytic Haemophilus haemolyticus strains. J. Clin. Microbiol. 46, 406–416. doi: 10.1128/JCM.01832-07
Minas, K., McEwan, N. R., Newbold, C. J., and Scott, K. P. (2011). Optimization of a high-throughput CTAB-based protocol for the extraction of qPCR-grade DNA from rumen fluid, plant and bacterial pure cultures. FEMS Microbiol. Lett. 325, 162–169. doi: 10.1111/j.1574-6968.2011.02424.x
Morou-Bermudez, E., and Burne, R. A. (1999). Genetic and physiologic characterization of urease of Actinomyces naeslundii. Infect. Immun. 67, 504–512.
Morou-Bermudez, E., and Burne, R. A. (2000). Analysis of urease expression in Actinomyces naeslundii WVU45. Infect. Immun. 68, 6670–6676. doi: 10.1128/IAI.68.12.6670-6676.2000
Nelson, M. C., Morrison, H. G., Benjamino, J., Grim, S. L., and Graf, J. (2014). Analysis, optimization and verification of Illumina-generated 16S rRNA gene amplicon surveys. PLoS ONE 9:e94249. doi: 10.1371/journal.pone.0094249
Oyeleke, S., and Okusanmi, T. (2008). Isolation and characterization of cellulose hydrolysing microorganism from the rumen of ruminants. Afr. J. Biotechnol. 7, 1503–1504. doi: 10.5897/AJB08.142
Pandya, P., Singh, K., Parnerkar, S., Tripathi, A., Mehta, H., Rank, D., et al. (2010). Bacterial diversity in the rumen of Indian Surti buffalo (Bubalus bubalis), assessed by 16S rDNA analysis. J. Appl. Genet. 51, 395–402. doi: 10.1007/BF03208869
Patra, A. K. (2015). “Urea/Ammonia metabolism in the rumen and toxicity in ruminants,” in Rumen Microbiology: From Evolution to Revolution, eds A. K. Puniya, R. Singh, and D. N. Kamra (New Delhi; Heidelberg; New York, NY; Dordrecht; London: Springer), 329–341.
Pope, P., Smith, W., Denman, S., Tringe, S., Barry, K., Hugenholtz, P., et al. (2011). Isolation of Succinivibrionaceae implicated in low methane emissions from Tammar wallabies. Science 333, 646–648. doi: 10.1126/science.1205760
Rasko, D. A., Ravel, J., Økstad, O. A., Helgason, E., Cer, R. Z., Jiang, L., et al. (2004). The genome sequence of Bacillus cereus ATCC 10987 reveals metabolic adaptations and a large plasmid related to Bacillus anthracis pXO1. Nucleic Acids Res. 32, 977–988. doi: 10.1093/nar/gkh,258
R Core Team (2013). R: A Language and Environment for Statistical Computing. R Foundation for Statistical Computing. Vienna. Available online at: http://www.R-project.org/
Reed, K. E. (2001). Restriction enzyme mapping of bacterial urease genes: using degenerate primers to expand experimental outcomes. Biochem. Mol. Biol. Educ. 29, 239–244. doi: 10.1111/j.1539-3429.2001.tb00131.x
Sakai, K., Yamauchi, T., Nakasu, F., and Ohe, T. (1996). Biodegradation of cellulose acetate by Neisseria sicca. Biosci. Biotechnol. Biochem. 60, 1617–1622. doi: 10.1271/bbb.60.1617
Santos, E., and Thompson, F. (2014). “The Family Succinivibrionaceae,” in The Prokaryotes, eds M. Dworkin, S. Falkow, E. Rosenberg, K. H. Schleifer and E. Stackebrandt (Berlin; Heidelberg: Springer), 639–648.
Sarda, D., Choonia, H. S., Sarode, D., and Lele, S. (2009). Biocalcification by Bacillus pasteurii urease: a novel application. J. Ind. Microbiol. Biot. 36, 1111–1115. doi: 10.1007/s10295-009-0581-4
Schaal, K. P., and Yassin, A. A. (2015). “Actinomyces,” in Bergey's Manual of Systematics of Archaea and Bacteria, ed W. B. Whitman (New York, NY: Springer), 1–112.
Shen, W., Jiang, Y., Wang, J., Bu, D., Sun, P., Jin, E., et al. (2012). Design and testing of rumen simulation system with discharging solid chime, liquid, and gas respectively. Trans. Chin. Soc. Agric. Eng. 28, 20–26. doi: 10.3969/j.issn.1002-6819.2012.03.004
Singh, B. K., Nunan, N., and Millard, P. (2009). Response of fungal, bacterial and ureolytic communities to synthetic sheep urine deposition in a grassland soil. FEMS Microbiol. Ecol. 70, 109–117. doi: 10.1111/j.1574-6941.2009.00731.x
Su, J., Jin, L., Jiang, Q., Sun, W., Zhang, F., and Li, Z. (2013). Phylogenetically diverse ureC genes and their expression suggest the urea utilization by bacterial symbionts in marine sponge Xestospongia testudinaria. PLoS ONE 8:e64848. doi: 10.1371/journal.pone.0064848
Šul'ák, M., Sikorová, L., Jankuvová, J., Javorskı, P., and Pristaš, P. (2012). Variability of Actinobacteria, a minor component of rumen microflora. Folia Microbiol. 57, 351–353. doi: 10.1007/s12223-012-0140-7
Wang, Q., Garrity, G. M., Tiedje, J. M., and Cole, J. R. (2007). Naive Bayesian classifier for rapid assignment of rRNA sequences into the new bacterial taxonomy. Appl. Environ. Microbiol. 73, 5261–5267. doi: 10.1128/AEM.00062-07
Weller, R. A., and Pilgrim, A. F. (1974). Passage of protozoa and volatile fatty acids from the rumen of the sheep and from a continuous in vitro fermentation system. Br. J. Nutr. 32, 341–351. doi: 10.1079/BJN19740087
Williams, A., and Withers, S. E. (1983). Bacillus spp. in the rumen ecosystem. Hemicellulose depolymerases and glycoside hydrolases of Bacillus spp. and rumen isolates grown under anaerobic conditions. J. Appl. Microbiol. 55, 283–292. doi: 10.1111/j.1365-2672.1983.tb01325.x
Wozny, M. A., Bryant, M. P., Holdeman, L. V., and Moore, W. E. (1977). Urease assay and urease-producing species of anaerobes in the bovine rumen and human feces. Appl. Environ. Microbiol. 33, 1097–1104.
Wu, S., Baldwin, R. L., Li, W., Li, C., Connor, E. E., and Li, R. W. (2012). The bacterial community composition of the bovine rumen detected using pyrosequencing of 16S rRNA Genes. Metagenomics 1, 1–11. doi: 10.4303/mg/235571
Zhang, R., Zhu, W., Zhu, W., Liu, J., and Mao, S. (2014). Effect of dietary forage sources on rumen microbiota, rumen fermentation and biogenic amines in dairy cows. J. Sci. Food Agric. 94, 1886–1895. doi: 10.1002/jsfa.6508
Zhang, Y. G., Shan, A. S., and Bao, J. (2001). Effect of hydroquinone on ruminal urease in the sheep and its inhibition kinetics in vitro. Asian Aust. J. Anim. Sci. 14, 1216–1220. doi: 10.5713/ajas.2001.1216
Zhao, S., Wang, J., Zheng, N., Bu, D., Sun, P., and Yu, Z. (2015). Reducing microbial ureolytic activity in the rumen by immunization against urease therein. BMC Vet. Res. 11:94. doi: 10.1186/s12917-015-0409-6
Keywords: rumen, ureolytic bacteria, urea, acetohydroxamic acid, high-throughput sequencing
Citation: Jin D, Zhao S, Wang P, Zheng N, Bu D, Beckers Y and Wang J (2016) Insights into Abundant Rumen Ureolytic Bacterial Community Using Rumen Simulation System. Front. Microbiol. 7:1006. doi: 10.3389/fmicb.2016.01006
Received: 19 January 2016; Accepted: 13 June 2016;
Published: 28 June 2016.
Edited by:
Christine Moissl-Eichinger, Medical University Graz, AustriaReviewed by:
Simon M. Dittami, Station Biologique de Roscoff, FranceSudeep Perumbakkam, Michigan State University, USA
Copyright © 2016 Jin, Zhao, Wang, Zheng, Bu, Beckers and Wang. This is an open-access article distributed under the terms of the Creative Commons Attribution License (CC BY). The use, distribution or reproduction in other forums is permitted, provided the original author(s) or licensor are credited and that the original publication in this journal is cited, in accordance with accepted academic practice. No use, distribution or reproduction is permitted which does not comply with these terms.
*Correspondence: Jiaqi Wang, amlhcWl3YW5nQHZpcC4xNjMuY29t
†These authors have contributed equally to this work.
 Di Jin
 Shengguo Zhao
 Pengpeng Wang1
 Yves Beckers
 Jiaqi Wang
