 Patricia Munsch-Alatossava
 Susanna Jääskeläinen1
 Tapani Alatossava
 Jean-Pierrre Gauchi
- 1Department of Food and Environmental Sciences, University of Helsinki, University of Helsinki, Finland
- 2MaIAGE, INRA, Université Paris-Saclay, Jouy en Josas, France
Antibiotic resistance has been noted to be a major and increasing human health issue. Cold storage of raw milk promotes the thriving of psychrotrophic/psychrotolerant bacteria, which are well known for their ability to produce enzymes that are frequently heat stable. However, these bacteria also carry antibiotic resistance (AR) features. In places, where no cold chain facilities are available and despite existing recommendations numerous adulterants, including antibiotics, are added to raw milk. Previously, N2 gas flushing showed real potential for hindering bacterial growth in raw milk at a storage temperature ranging from 6 to 25°C. Here, the ability of N2 gas (N) to tackle antibiotic- resistant bacteria was tested and compared to that of the activated lactoperoxidase system (HT) for three raw milk samples that were stored at 6°C for 7 days. To that end, the mesophiles and psychrotrophs that were resistant to gentamycin (G), ceftazidime (Ce), levofloxacin (L), and trimethoprim-sulfamethoxazole (TS) were enumerated. For the log10 ratio (which is defined as the bacterial counts from a certain condition divided by the counts on the corresponding control), classical Analyses of Variance (ANOVA) was performed, followed by a mean comparison with the Ryan-Einot-Gabriel-Welsch multiple range test (REGWQ). If the storage “time” factor was the major determinant of the recorded effects, cold storage alone or in combination with HT or with N promoted a sample-dependent response in consideration of the AR levels. The efficiency of N in limiting the increase in AR was highest for fresh raw milk and was judged to be equivalent to that of HT for one sample and superior to that of HT for the two other samples; moreover, compared to HT, N seemed to favor a more diverse community at 6°C that was less heavily loaded with antibiotic multi-resistance features. Our results imply that N2 gas flushing could strengthen cold storage of raw milk by tackling the bacterial spoilage potential while simultaneously hindering the increase of bacteria carrying antibiotic resistance/multi-resistance features.
Introduction
The statement is unanimous among the highest international authorities: the increasing prevalence of antibiotic-resistant bacteria constitutes one of the most serious threats to human health; both the WHO and FAO have issued action plans to tackle antibiotic resistance (AR), which is perceived as a global and increasing threat (WHO, 2015; FAO, 2016). In Europe, it is estimated that AR already induces extra health costs and productivity losses amounting to at least 1,500 million euros, and it leads to 25,000 deaths annually (WHO, 2015). Although, the European Union already placed a ban on using antibiotics as growth promoters in 2006, some countries still sell more antibiotics for animal use than for treating humans. Due to the simultaneous presence of spoilage microorganisms in food materials, of food-borne pathogens and antibiotic-resistant bacteria, food production systems face great challenges. The warning that “the resistance problem in human medicine will not be solved if there is a constant influx of resistance genes into the human microflora via the food chain” was already made earlier (Teuber, 1999). Food has been identified as one main direct vehicle for the transmission of antibiotic-resistant bacteria from animals to humans and AR genes that are carried by zoonotic bacteria (Perreten et al., 1997; SØrum and L'Abbé Lund, 2002; Aquilanti et al., 2007; Garofalo et al., 2007; Wang et al., 2012; Rolain, 2013; ECDC/EFSA/EMA, 2015). Wichmann et al. (2014) also demonstrated that the cow microbiome was a significant reservoir of AR genes; however, the scientific community still remains divided regarding the contribution of antibiotic use on food production, despite the fact that more evidence points to the anthropogenic causes of increasing AR in both human or environmental microbiomes (Forslund et al., 2014).
Although milk is considered to be sterile when it is secreted from a healthy udder, various contamination sources increase its bacterial level. Depending on the production area, the farm type and the milk handling practices, the types and levels of bacteria vary greatly in raw milk (Chambers, 2002; Frank and Hassan, 2002). In developed countries, recommendations state that the bacterial load in raw milk should not exceed 105 cfu/ml and 3 × 10⁵ cfu/ml “total bacterial counts” in the farm and dairy tanks, respectively. These counts are determined under mesophilic incubation conditions (3 d at 30°C) (Anonymous, 2004); there are no recommendations concerning AR in raw milk. With regards to antibiotics (ABs), the dairy industry states that raw milk should not contain AB residues (which could compromise the growth of the starter strains that form the bases of yogurt or cheese production). If ABs are present in milk, then the farmer is not allowed to sell this milk, which is then used to feed cattle, with the risk that the bacteria that have become resistant may enter the food chain (Pereira et al., 2014; Andremont, 2015).
Two options are recommended for the preservation of raw milk: either cold storage (at approximately 4°C/below 6°C) or the activation of the lactoperoxidase system (HT) when economical or technical constraints prevent the use of cooling facilities (FAO, 1991, 2005). When raw milk is cold-stored, psychrotrophic/psychrotolerant bacteria take over within a few days and promote the spoilage of the raw milk due to the production of varied and mostly heat-stable enzymes (Chambers, 2002). On the other side, in the absence of a cold chain infrastructure, many adulterating substances, including antibiotics, are used to prevent excessive bacterial growth in raw milk (Bari et al., 2015; Botelho et al., 2015).
During earlier analyses of bacterial isolates that were involved in raw milk spoilage, resistance to several classes of antibiotics (or multi-resistance) seemed to increase during the cold storage of raw milk (Munsch-Alatossava and Alatossava, 2006, 2007). Further investigations revealed that psychrotrophic bacterial populations exhibited higher AR levels compared to their corresponding mesophilic populations; most importantly, based on their AR profiles, distinct bacterial populations succeeded one another during cold storage; strangely enough, the AR was highest at the time when the “total bacterial counts” had reached approximately 105 cfu/ml; after that, the relative AR level was lower but the milk was spoiled (Munsch-Alatossava et al., 2012a).
The limitations of raw milk cold storage, together with the observation that cold storage seems to promote an increase in AR (Munsch-Alatossava and Alatossava, 2007; Munsch-Alatossava et al., 2012a,b), motivated research efforts to attempt to control bacterial growth in raw milk more effectively. Two studies examined the use of N2 gas to prevent bacterial growth in raw milk that was kept in a “closed system” (Murray et al., 1983; Dechemi et al., 2005). By considering an “open system,” both culture-dependent investigations and DNA barcoding studies revealed that no pathogen, no spoilage bacteria or any anaerobe was clearly advantaged by the N2 gas flushing treatment when it was applied to raw milk at the laboratory scale, despite the fact that 104- fold lower bacterial counts differentiated the N2-flushed from non-flushed cold-stored raw milk samples (Munsch-Alatossava et al., 2010a,b; Gschwendtner et al., 2016). Recently, the efficiency of N2 gas flushing and the activated lactoperoxidase system in controlling bacterial growth in raw milk samples stored at 15 and 25°C was compared; overall, the gas treatment showed a time-limited effect that was comparable to the effect of the activated lactoperoxidase system (Munsch-Alatossava et al., 2016). Because the N2 gas flushing inhibited the mesophilic and psychrotrophic populations in cold-stored raw milk, we undertook an investigation as to whether the N2 gas-based treatment could also inhibit the growth of antibiotic-resistant bacteria in raw milk stored at 6°C, and its efficiency was compared to that of the activated lactoperoxidase system for both mesophiles and psychrotrophs. Consequently, bacteria that were resistant to gentamycin (G), ceftazidime (Ce), levofloxacine (L), and trimethoprim-sulfamethoxazole (TS) were enumerated from three cold-stored raw milk samples while they were subjected to the following three conditions: the application of N2 gas flushing, the activation of the lactoperoxidase system (HT) and no additional treatment as the control (C). For the statistical treatment of the data, we defined the ratio as the amounts of colonies that were recovered in the presence of one antibiotic type divided by the number of colonies enumerated from the corresponding control. During the whole study, the decimal logarithm of the ratio, i.e., the log10 (ratio), was analyzed with the Ryan-Einot-Gabriel-Welsch (REGWQ) multiple range test (Hsu, 1996).
Materials and Methods
Materials and Treatment of Raw Milk Samples
Three bovine raw milk samples (S1, S2, and S3), which represent commingled lorry milk delivered to Helsinki Dairy Ltd. in Helsinki (Finland) in November and December 2015, were subjected. After the raw milk arrived, 100 ml of each sample were added to 250 ml sterile bottles and placed on a multi-place magnetic stirrer (Variomag, Oberschleißheim, Germany). The bottles were partially immersed in a refrigerated water bath (MGW Lauda MS/2), which allowed, with the help of an immersion thermostat, a constant temperature to be maintained (Munsch-Alatossava et al., 2010a). The raw milk samples were mixed continuously at 220 rpm and kept at 6 ± 0.1°C for 7 days. The activation of the lactoperoxidase system (HT) consisted in the addition of both hydrogen peroxide and thiocyanate at 10 ppm each (FAO, 2005); the source of H2O2 was a 30% H2O2 solution (Perdrogen R 30 Gew%, Riedel de Häen, Seelze, Germany). The thiocyanate anion SCN− took the form of NaSCN (Sigma-Aldrich, Steinheim, Germany) and a 1% (w/v) stock solution was sterile-filtered and cold- stored until use. The N2 gas (AGA Ltd, Riihimäki, Finland) was 99.999% pure and the flow rate for the continuous N2 gas flushing treatments (N) was adjusted to 120 ml/min (Munsch-Alatossava et al., 2010a). The description of the conditions (which were applied to every sample) is as follows: C, control; HT, H2O2+ SCN− (for the activated lactoperoxidase system); and N, N2 gas flushing.
Microbiological Analyses
Antibiotic resistance was quantified by enumerating bacterial colonies on agar plates that contained one of each of the considered antibiotics (ABs) (each one is representative of one AB class) and by comparing their levels to the corresponding “no AB” (no antibiotics) control. The analyses were performed at day 0 (shortly after the samples were received) and after 3 and 7 days of cold storage. All the bacterial counts were determined mostly from triplicate if not duplicate platings on Mueller-Hinton agar (Lab M, Ltd, Lancashire, UK). The antimicrobial agents [gentamycin (aminoglycosides), ceftazidime (β-lactams, cephems), levofloxacin (quinolones) and trimethoprim-sulfamethoxazole (at a ratio of 1/19, a folate pathway inhibitor) (Sigma-Aldrich, Steinheim, Germany)] which are abbreviated G, Ce, L, and TS, respectively, were added to the agar in accordance with the EUCAST guidelines (EUCAST, 2000). The AB solutions were freshly prepared by dissolving the powders into the following solvents: MilliQ water for G, 0.1M phosphate buffer (pH 7) for Ce, 0.1M NaOH for L, 0.1M lactic acid for T, and 95% ethanol for S (EUCAST, 2000). With the exception of S, all the AB solutions were filter-sterilized prior to their addition to adequately cooled agar. The final AB concentrations in the agar plates were 16 mg/L for G, 32 mg/L for Ce, 8 mg/L for L and 8 mg/L trimethoprim together with 152 mg/L sulfamethoxazole for TS. These concentrations correspond to 4-fold of the MIC for G, Ce and L, or 2-fold the MIC for TS, as indicated by EUCAST for pseudomonads (EUCAST, 2010). All the agar plates were stored overnight at 4°C and protected from light before use. Following the analyses performed as described before (Munsch-Alatossava et al., 2012a,b), the plates were incubated under aerobic conditions for 2–3 days at 30°C, or for 10 days at 7°C to enumerate the “total” bacterial mesophilic and psychrotrophic counts, respectively.
Statistical Analyses
Statistical analyses were performed independently for every raw milk sample. To compare the efficiency of the treatments, the analyses employed the ratio that was defined as “the counts obtained in the presence of one of the four antibiotic (AB) types divided by the counts enumerated on the corresponding control.” To overcome the variability of microbiological data (excessively low or high bacterial counts), the decimal logarithm of the ratio [log10 (ratio)] was analyzed. When the ratio denominator of the bacterial counts was “zero,” “zero” was replaced with “one.” To overcome the situations in which the ratios were equal to zero and to allow for log transformation, 0.0001 was added to all the values. The statistical analyses relied on a classical Analysis of Variance (ANOVA) followed by a multiple comparison of the means with the Ryan-Einot-Gabriel-Welsch test (REGWQ) (Hsu, 1996) with an alpha risk of 0.05, as applied previously (Munsch-Alatossava et al., 2016). All the calculations were performed with SAS/STAT software version 9.4/ GLM procedure (SAS Institute, NC, USA). Low vs. high values of the log10(ratio) indicate that the bacterial populations were strongly or poorly controlled by the applied treatments. The statistical analyses determined the influence of the following three factors: (1) the “time” or duration of cold storage (which addressed the trends in the counts between days 0 and 3, and between days 0 and 7) visualized by two levels “day 3” and “day 7”; (2) the ”treatment type” of either non-treated raw milk, which accounts for the control (C), or where the lactoperoxidase system was activated (HT), or for N2-flushed milk (N); and (3) the “AB type,” which considered the response to the following five conditions: the absence of any antibiotic (no AB), or the presence of one of the antibiotics (whether G, Ce, L, or TS). Moreover, two-factor and three-factor interactions were evaluated for the log10 (ratio).
Results
Impact of the Treatments on the Raw Milk pH
For all three raw milk samples (S1, S2, and S3) in which the lactoperoxidase (HT) was activated, the pH values that were measured after 7 days of cold storage were nearly equal to the initial pH values (Table 1). In addition, the 7-day-N2 gas flushing (N) did not greatly alter the initial pH values of the samples, given that the drop ranged between 0.02 and 0.14. As expected, the non-treated raw milk samples (C) showed the largest pH decreases (from 0.3 to 0.5 unit) at the end of the storage period (Table 1).
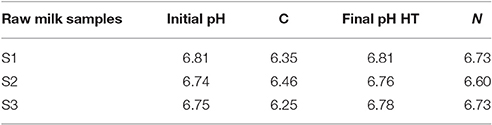
Table 1. pH values for raw milk samples (S1 to S3), determined at initial and final stages (after 7d storage at 6°C), for the three conditions: non treated raw milk (C), activated lactoperoxidase system (HT), and N2 gas flushed (N) milk.
Growth Trend in Resistant Bacteria during Cold Storage
Bacterial Levels in Non-treated Raw Milk (C)
At the beginning of the storage period, all three samples presented initial “total” mesophilic counts (S1M, S2M, and S3M) that ranged between 734 and 3,700 cfu/ml (2.86 and 3.57 log-units) (Figure 1). Despite having rather similar initial counts, the samples revealed different bacterial growth kinetics for the “no AB” condition after 3 days of cold storage given that the counts were below 104 cfu/ml for S2M, below the limit (3 × 10⁵ cfu/ml or 5.48 log units) for S3M and close to 106 for S1M; the additional 4 days of cold storage promoted 3 to 5 log-units of additional increases in the counts for all three samples (Figure 1). At the initial stage, all the samples showed detectable levels of mesophilic-resistant bacteria, which were highest with Ce and TS for S1M and highest with Ce for both S2M and S3M. After 3 days of cold storage for all the samples, the TS-resistant mesophiles had increased and even reached an equal level to that of “no AB” for S1M and S2M; the G-, Ce-, and L-resistant bacterial levels largely remained constant out of a 1 log-unit drop for L-resistant bacteria for S3M (Figure 1). After 7 days of cold storage, the G-, Ce-, and L-resistant counts had increased moderately for S1M compared to that of “no AB”; between 3 and 7 days, the resistant bacterial counts mostly increased for S2M and S3M. For G and L, the levels were equivalent for both S2M and S3M (slightly below or approximately 4 log-units). The Ce-resistant counts were also at this level for S2M, but they were considerably higher for S3M for which the levels were “equal” to that of the TS-resistant bacteria. For all three samples, at the end of the storage period, the levels of resistant mesophiles were below 3 × 10⁵ cfu/ml (5.48 log units) for the controls (C), with the exception of TS-resistant bacteria, and of Ce-resistant bacteria in addition for S3M (Figure 1).
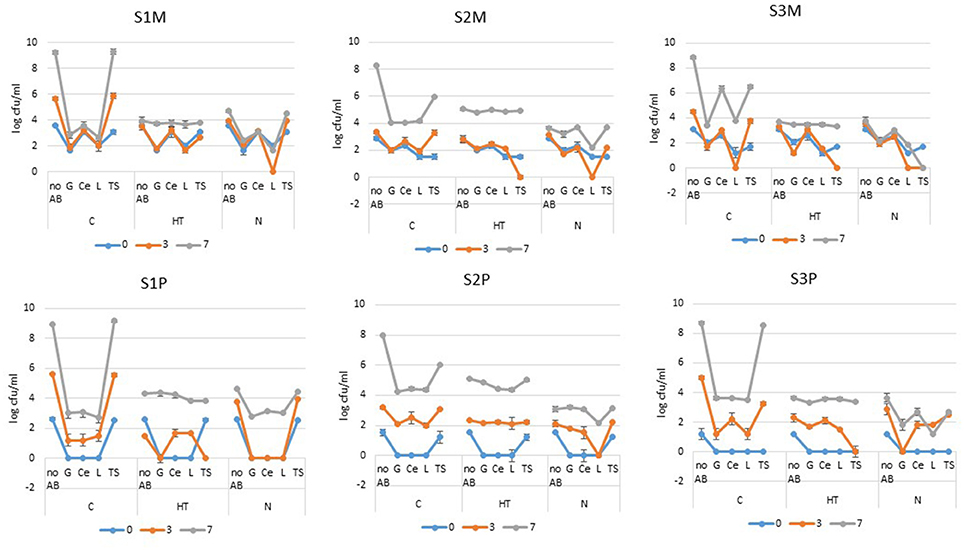
Figure 1. Mesophilic (M) and psychrotrophic (P) bacterial counts (expressed in log cfu/ml) from raw milk samples S1, S2, and S3 that were stored for 7 days at 6°C (C), cold-stored while the lactoperoxidase system was activated (HT) or cold-stored while flushed with N2(N). The colonies were enumerated on Mueller-Hinton agar plates that contained no antibiotics (“no AB”) or one of the following ABs: G (gentamycin), Ce (ceftazidime), L (levofloxacin) and TS (trimethoprim-sulfamethoxazole) (the error bars correspond to standard deviations).
Psychrotrophs that were resistant to G, Ce, and L were initially below the detection levels for all three samples, whereas TS-resistant bacteria were recovered at levels equivalent to the “no AB” counts for S1P and S2P (Figure 1). In contrast to the mesophiles, for which “day 3” was rather equivalent to “day 0,” resistant psychrotrophs increased notably in all three samples (Figure 1). The augmentation continued until the end of the storage period; by that time, the Ce-resistant counts had increased by approximately 3-fold for G, Ce and L for S1P, over 4-fold for S2P and over 3-fold for S3P. However, out of the TS-resistant psychrotrophs that culminated in 109, 106, or above 108 cfu/ml for S1P, S2P, and S3P, respectively, all the other psychrotrophic counts remained below 3 × 10⁵ cfu/ml at day 7 (Figure 1).
Bacterial Levels in Raw Milk under the Activated Lactoperoxidase System (HT)
After 3 days under cold storage, the “no AB” condition revealed that the mesophilic counts remained unchanged at approximately 3 log-units for S2M and they were slightly above the initial levels for S1M and S3M. Compared to the corresponding controls (C), the counts for “no AB” were approximately 2 log-units below the levels recorded for S1M and S3M, whereas no drop was recorded for S2M. After 7 days, HT had provoked a large inhibition of approximately 5 log-units of bacterial growth for S1M and S3M compared to approximately 3 log-units lower counts for S2M (Figure 1). For resistant mesophiles, rather minor changes occurred during the first 3 days: this finding is well illustrated for S1M under the activated lactoperoxidase system (HT), when in the presence of G, Ce and L, the mesophilic counts remained unchanged during the first 3 days and were at the level of the corresponding control (C); for S1M, day 7 was primarily characterized by a moderate increase in Ce- and TS-resistant bacteria, a greater increase in G- and L-resistant bacteria, and all the counts, including those of “no AB,” were at approximately 4 log-units. If for S1M, the counts for “no AB” and TS were clearly lower for HT compared to the control (C), the G- and L-resistant bacteria were moderately higher compared to the levels of the corresponding control (C) (Figure 1). For S2M at day 3, the counts for “no AB,” G-, Ce-, and L- resistant bacteria were at approximately their initial levels. However, the activated lactoperoxidase (HT) system triggered a notable change at day 3 concerning TS-resistant bacteria, which were reduced to a non-detectable level (Figure 1). Day 7 was characterized by a large increase (of approximately 5 log-units) of bacteria that were resistant to TS, which were only one log-unit lower than the level attained by TS-resistant bacteria for C. Although the counts that were enumerated on the G-, Ce-, and L-plates had increased by approximately 3 log-units, they were still below 3 × 10⁵ cfu/ml, but they exceeded the levels recovered for the corresponding control (C) by approximately 1 log-unit (Figure 1). For S3M, HT promoted a drop in G- and TS-resistant mesophiles (to an undetectable level in the latter case) at the intermediate storage time; with the exception of the mesophilic counts recovered on Ce containing agar (for which the counts remained fairly equivalent during the course of the experiment), the bacteria that were resistant to G, L and TS greatly increased between 3 and 7 days for S3M, and they were approximately 3.5 log-units, which corresponded to the levels of G- and L-resistant bacteria that were found for the control (C) (Figure 1).
At the initial stage under the activated lactoperoxidase (HT), G-, Ce-, and L-resistant psychrotrophs were below the detectable levels in all three samples (Figure 1). For TS-resistant bacteria, the situation was most contrasted given that the counts were below the detectable level for S3P, and at the “no AB” level for S1P and S2P. Among the psychrotrophic populations, the sharpness of the increase in resistant bacteria was highest for S2P (Figure 1). For S1, contrary to the mesophiles, the psychrotrophs (S1P) showed lower counts at day 3 than the “no AB” condition as compared to day 0. During the 3-day storage period, the psychrotrophs that were resistant to G, Ce and L increased in all the samples with the exception of G for S1P. TS still promoted the most distinctive response. Regarding the increase in resistant counts for S2P, the counts remained at an undetectable level for S3P and showed a considerable drop in the counts between days 0 and 3 for S1P (to an undetectable level) (Figure 1). The additional 4 days of cold storage promoted a considerable increase in the AR for all three samples; irrespective of the AB type, the resistant psychrotrophs reached more or less approximately the same level as the counts from the “no AB” condition. However, HT prevented the excessive growth of TS-resistant psychrotrophs, especially for S1P and S3P (Figure 1).
Bacterial Levels in N2-Flushed Raw Milk (N)
For the N2 gas flushing treatment (N) at day 7, the “no AB” condition revealed a moderate increase in bacterial counts that was equivalent to HT for S3M, slightly above that of HT for S1M, and below HT for S2M, but also below the levels encountered for the controls (C) (Figure 1). The 7- day-cold storage period, together with the N2 gas flushing, promoted fairly minor changes in AR- resistant mesophiles considering S1M and S3M, compared to S2M (Figure 1). After 3 days of cold storage, quite similar patterns in the responses were observed for G-, Ce-, and L-resistant bacteria for all three raw milk samples. The level of G-resistance was lower than that of Ce, whereas L-resistant bacteria were reduced to non-detectable levels in all three samples. The TS-resistant bacteria either increased moderately for S1M and S2M, or were reduced to a non-detectable level during the first 3 days of cold storage for S3M (Figure 1). After 7 days, the highest counts were observed in TS for S1M, with Ce and TS in the case of S2M. The maximum inhibitory effect was recorded for S3M, because all of the resistant bacteria were equivalent to or below 103 cfu/ml; the resistant mesophiles were largely less numerous under N compared to HT (Figure 1).
Compared to the mesophiles, more changes were observed for the psychrotrophs for all three samples under the N2 flushing treatment for the “no AB” condition; at day 0, no colonies that were resistant to G, Ce or L were detected in S1P, S2P, and S3P. If TS-resistant bacteria were present in S1P and S2P (equivalent to levels of “no AB”), none were detected for S3P (Figure 1). After 3 days of storage, G-, Ce-, or L-resistant colonies remained under the detectable level for S1P; the same was observed in L-resistant bacteria for S2P and for G-resistant bacteria for S3P (Figure 1). By contrast, the TS-resistant colonies increased over the 3 days for all 3 samples, and they reached the levels that were observed for the “no AB” condition. At the end of the storage period, S1P and S2P showed a more homogeneous picture (for 3 ABs out of 4), whereas for S3P, the resistant populations were at approximately the same level with G and L on one side, and with C and TS on the other side. The resistant psychrotrophic counts from N were mostly below the AR levels recorded from the corresponding controls (C) or from the activated lactoperoxidase system (HT) (Figure 1).
Statistical Analyses
Impact of the Storage “Time” Factor on Bacterial Growth
The Ryan-Einot-Gabriel-Welsch (REGWQ) multiple range test was applied to the variable log10 (ratio), which enabled us to quantify the changes that occurred during the storage period. The results showed a decrease in the bacterial counts, depicted by “negative” values, which were indicative of an effective control for mesophiles from samples S2 and S3 and for psychrotrophs from sample S1 at day 3 only (Figure 2). For all three samples, the mean log10 (ratio) values were considerably and significantly higher at day 7 compared to day 3, which confirmed that the additional four days of cold storage favored the proliferation of mesophilic and psychrotrophic bacterial populations. However, the increase in psychrotrophs (+4.73/S1, +3.54/S2, and +3.22/S3) supplanted the increase in mesophiles (+1.91/S1, +3.33/S2, and +2.75/S3) (Figure 2).
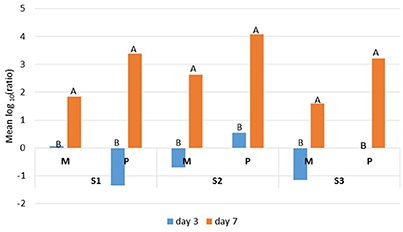
Figure 2. REGWQ results depicting the impact of either 3 or 7 days of storage at 6°C on mesophilic (M) and psychrotrophic (P) populations that were recovered from the raw milk samples S1, S2, and S3. Means with different letters indicate significant differences (alpha risk = 0.05).
Efficiency of the Activated Lactoperoxidase System (HT) and the N2-Flushing (N) Treatments for Inhibiting Bacterial Growth
For the three samples (S1, S2, and S3), the REGWQ test revealed that the applied treatments (HT or N) including the cold storage alone (the control condition C) promoted rather similar responses regarding the ranking of mesophiles (M) and their corresponding psychrotrophs (P) (Figure 3). The test also highlighted a sample-dependent response based on the ranking of the treatments (HT and N), which appeared to be mostly discriminatory for sample S3 because the treatments together with the control (C) were ascribed to three distinct categories (A, B, and C), unlike the samples S1 and S2, for which only two categories (A and B) were distinguished (Figure 3).
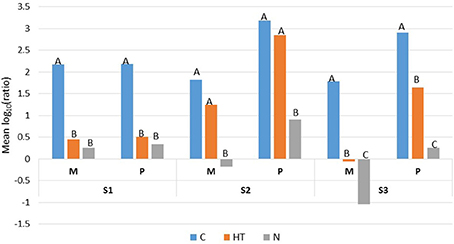
Figure 3. REGWQ results describing the overall inhibitory efficiency of HT (the activated lactoperoxidase system) and N (N2 gas flushing) treatments, compared to the control (C) for the raw milk samples S1, S2, and S3 when stored at 6°C for 7 days. Means with the same letter are not significantly different (alpha risk = 0.05).
For sample S1, HT and N were evaluated as very effective and equally inhibitory as outlined by the ranking of the treatments (and grouped into category B) compared to the control (C) (ascribed to category A) (Figure 3). If HT yielded lower mean values compared to C for mesophiles and psychrotrophs, the inhibition was variable and significantly different from the control (C) only for samples S1 and S3 (Figure 3). Compared to the corresponding controls (C) and to HT, all the mean values were lowest with N; for both the mesophiles and psychrotrophs, the inhibitory effect was either equivalent to HT (for sample S1) or prevailed over HT (for samples S2 and S3). The highest inhibitory effect was recorded for mesophiles from sample S3 which was N2-flushed (Figure 3). For both samples S2 and S3, irrespective of the conditions (control, HT or N), the mean values for the psychrotrophs exceeded the corresponding levels for mesophiles (Figure 3).
Ranking of the Considered Antibiotics (ABs)
For all three samples, the results from the REGWQ test showed altogether rather similar mean values for mesophiles for the “no AB” condition, which ranged between 1.44 and 1.60; by contrast, higher and more variable mean values between 2.05 and 3.8 were observed for psychrotrophs (Table 2). For sample S1, the means were mostly and moderately higher for mesophiles compared to psychrotrophs outside the conditions “no AB” and “L,” whereas the S2 and S3 samples showed the highest means for psychrotrophs irrespective of the AB type (Table 2). The means for “no AB” supplanted all the conditions in which ABs were present, with two exceptions (TS-resistant mesophiles for sample S1 and G-resistant psychrotrophs for sample S2). The same order for the AB rankings (G, L, Ce and TS, from the lowest to the highest) was observed under four conditions (Table 2). The mean value was highest for TS-resistant bacteria for mesophiles and psychrotrophs in sample S1, for mesophiles in sample S2, and for psychrotrophs in sample S3 (Table 2). For both mesophiles and psychrotrophs, the ranking of the ABs was most discriminatory for sample S1, because the REGWQ test highlighted three categories (A, B, and C). For sample S2, if the mean values for the different ABs ranged between 1.70 and 3.07 for the psychrotrophs (with G-resistant psychrotrophs far above all other conditions) and between 0.67 and 1.16 for mesophiles, the statistical treatment revealed that these values were not significantly different from those of “no AB” for both population types (Table 2). For sample S3, if no significant difference was recorded with three ABs, the TS condition was not judged to be significantly different from the “no AB” condition for psychrotrophs. For mesophiles, if the Ce condition was not significantly different from that of “no AB,” then the remaining three ABs (G, TS, and L) (which all yielded negative means) were ranked at the same level. That level was distinct from the “no AB” level (Table 2). The ranking based on the “AB type” illustrated sample and AB-type dependent responses.
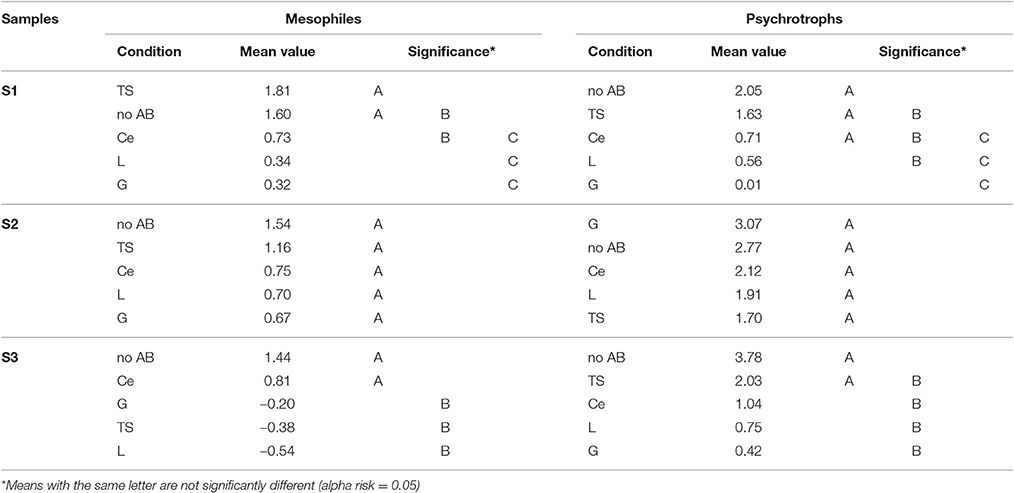
Table 2. Ranking of the log10 (ratio) considering the antibiotics (G, Ce, L, TS) compared to the “no AB” condition by the REGWQ test.
Trends in the log10 (Ratio) Mean Values for Mesophiles (M) and Psychrotrophs (P)
Despite some decreases in the means at the intermediate storage time, the AR largely increased concomitantly with the increase in “total” bacterial counts which was obvious for most conditions with the exception of the TS- resistant mesophiles that were recovered from S3M with N (Figure 4). The REGWQ test revealed that the means were highest for S3M because seven conditions (five from C and two from HT) exceeded a value of 4, compared to only two conditions for S1M and one for S2M (Figure 4). All the controls (C) were characterized by high mean values with TS, which was nearly equivalent to the “no AB” condition (Figure 4). For S1M, the means were lower for HT, compared to the control (C), for the “no AB” condition and for TS, but they were higher for G and L, and moderately higher for Ce after 7 days of storage. For N, if the mean values were slightly higher for “no AB” and TS, compared to HT, all the other cases were below the levels encountered for HT or C (Figure 4). The greatest changes between the sampling points were observed for S2M, because 13 out of 15 means were negative at day 3 (with the lowest levels from HT-TS or N-L) (Figure 4). Compared to C, HT showed higher mean values for G, Ce, and L at day 7 and lower values for the conditions “no AB” and TS. By contrast, all the mean values were lower for N after 7 days under cold storage compared to the corresponding levels recorded for C but also for HT (Figure 4). The mean values were lower at day 3 in HT for S3M, compared to C for “no AB,” G and TS, and lower at day 7 for “no AB,” Ce, L, and TS. With N, the mean values at day 3 were, relative to the control (C), lower for “no AB,” Ce, and TS but higher for G and equivalent for L. However, at day 7, all the means were lowest for N compared to C, and also to HT when considering resistant bacteria (Figure 4).
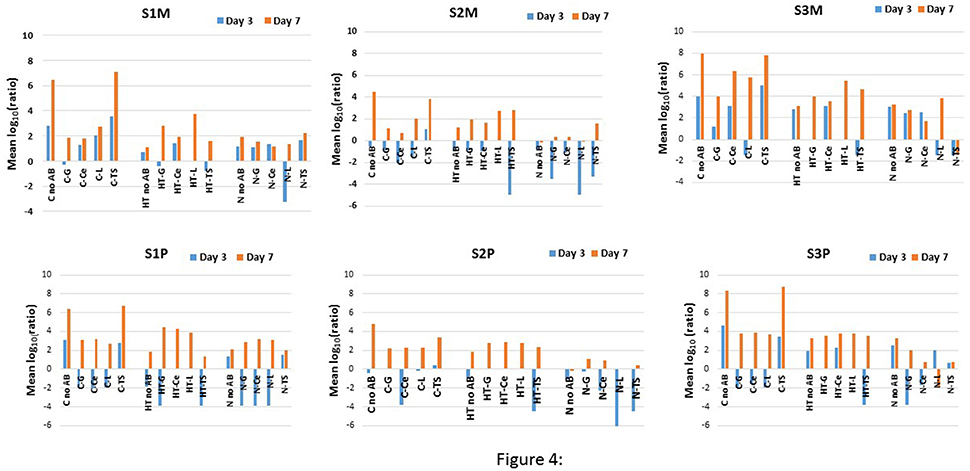
Figure 4. REGWQ results showing the impact of the HT (the activated lactoperoxidase system) and N (N2 flushed milk) treatments, compared to the control (C), on the three raw milk samples S1, S2, and S3 when considering the mesophiles (S1M, S2M, and S3M) and the psychrotrophs (S1P, S2P, and S3P) for the “no AB” condition, and in the presence of the antibiotics G (gentamycin), Ce (ceftazidime), L (levofloxacin), and TS (trimethoprim-sulfamethoxazole).
The results from the REGWQ test confirmed the rise of psychrotrophs and of AR-resistant psychrotrophs under all the conditions with the exception of L-resistant bacteria for S3P with N (Figure 4). A high-growth dynamic was recorded for psychrotrophs (S1P) as many mean values shifted from negative to positive values during the storage period. After 3 days, the means were lower for HT compared to the control (C) for “no AB,” G and TS (Figure 4). The four additional storage days showed still lower means for “no AB” and for TS, but higher ones for G, Ce, and L compared to the control (C) (Figure 4). At day 3, all the means were lower for N compared to the control (C), and at day 7, still lower mean values were encountered for “no AB” and TS. The levels were moderately higher for L and equivalent for G and Ce (Figure 4). Compared to C, the means were lower for S2P in HT for “no AB” and TS and equivalent for G, Ce, and L at day 3. After 7 days of cold storage, the means were still lower for “no AB” and for TS, but higher for G, Ce, and L compared to the control (C) (Figure 4). For N, irrespective of the AB type, including the “no AB” condition, all the means were lower for S2P compared to the levels obtained for C and HT (out of one exception) (Figure 4). For S3P, HT showed lower mean values, compared to C, for “no AB” and for TS after 3 and 7 days of storage, in contrary to the results for G, Ce and L for which the means were equivalent to the levels recorded for the control (C) after 7 days (Figure 4). With one exception (L at day 3), all the mean values were lower for N compared to C at both sampling days; compared to HT, the means were equivalent for N considering “no AB” but lower for all the other conditions (Figure 4).
Incidence of the Storage “Time,” “Treatment” Type and Antibiotic (“AB”) Type Factors
The contribution of the storage “time” and “treatment” type factors on the recorded effects was highly significant under all conditions; whereas the storage “time” prevailed, it also displayed great heterogeneity. For example, this factor greatly affected S1P and impacted more moderately S1M or S3P (Table 3). With the exception of S2M, the “AB” type factor had a minor and also variable contribution to the recorded effects. The ANOVA tables did not reveal any significant triple interactions between the tested storage “time,” “treatment” type and “AB” type factors. However, double interactions, that were significant at an alpha risk factor of 5%, were often recorded, even though their effects were lower compared to the effects due to the different factors that were considered individually (Table 3). For both population types from samples S1 and S2, the “treatment*AB” interaction was highest compared to sample S3 in which the storage “time*treatment” interaction dominated; the highest and nearly equivalent double interactions were recorded for S3M (Table 3).
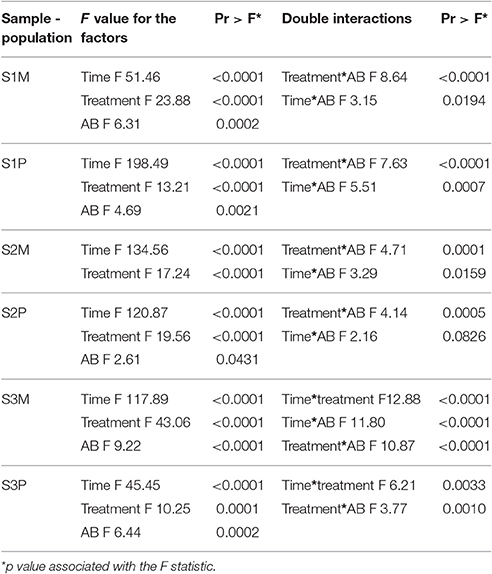
Table 3. Factors and significant double interactions that determined the recorded effects evaluated for log10 (ratio) on mesophiles (M) and psychrotrophs (P) for raw milk samples S1, S2, and S3.
Discussion
The trend in AR over time was evaluated here for mesophilic and psychrotrophic bacteria that were present in three bovine raw milk samples, which were subjected to a 7-day cold storage period at 6°C. Single cold storage, which counted as the control (C), was combined with either the activated lactoperoxidase system (HT) or with a continuous N2 gas flushing treatment (N). At the initial stage of the analyses, because the “total bacterial counts” (“no AB” condition) ranged between 2.86 and 3.57 log-units (Figure 1), the raw milk samples can be considered to be of very good bacteriological quality (Anonymous, 2004). This point is also corroborated by the initial pH values (Table 1) that are indicative of fresh raw milk (Tetra Pak, 2003).
Single cold storage largely promoted bacterial growth in a sample-dependent matter (Figures 1–4). The three samples were characterized by initial psychrotroph/mesophile ratios of 11.3, 4.5, and 1.3% for samples S1, S2, and S3, respectively, which suggests a shorter cold storage period prior to the start of the analyses for samples S3 and S2 compared to that of sample S1. The idea, that sample S1 probably underwent a longer cold storage prior to analyses is also corroborated by the observation of the growth kinetic for mesophiles (S1M) and especially psychrotrophs (S1P), which was highest for the “no AB” condition for sample S1 because the counts exceeded 105 cfu/ml already after 3 days of storage at 6°C (Figure 1). By contrast, sample S2 showed the slowest growth kinetics for both mesophiles (S2M) and psychrotrophs (S2P) because the counts were only slightly above 3 log-units for both population types after 3 days (Figure 1); however, after 7 days, both the mesophiles and psychrotrophs reached approximately 8 or 9 log-units cfu/ml and were nearly equivalent in all three samples (Figure 1). If an altogether similar growth dynamic characterized the psychrotrophs and mesophiles from sample S1 [as estimated from the mean log10 (ratio) values of approximately 2.2 for both population types (Figure 3), which further tends to confirm a longer cold storage period for S1 prior to the analyses], it was distinct from the results for samples S2 and S3 in which the overall growth dynamic for the psychrotrophs was most vigorous [with mean log10 (ratio) values of 3.19 and 2.91, respectively] compared to the mesophiles [with mean log10 (ratio) values of 1.83 and 1.79, respectively; Figure 3]. After 7 days in cold storage, the control milk samples (C) were spoiled, exhibited the lowest pH values and emitted bad odors, whereas the pH values for HT- treated milk or N2-flushed samples were not greatly altered (Table 1), and were in line with previous observations (Gaya et al., 1991; Dechemi et al., 2005; Munsch-Alatossava et al., 2010a).
Indisputably, the rise in bacteria in the raw milk during cold storage corresponded to an increase in resistant mesophilic and psychrotrophic bacterial populations (Figures 1–4), confirming earlier observations; shifts in the AR profiles over time, together with very high TS- resistance levels at the end of the storage period were also previously observed for cold-stored raw milk samples (Munsch-Alatossava et al., 2012a,b). Moreover, the highest AR increase for psychrotrophs compared to mesophiles as noted here for samples S2 and S3 (Figures 1, 4) is also in line with previous observations which showed that AR, that was evaluated from psychrotrophs, supplanted AR from the corresponding mesophiles in cold-stored raw milk (Munsch-Alatossava et al., 2012a); this point also highlights the difficulty of judging the quality of raw milk with the sole mesophilic bacteriological standard, in which psychrotrophs may be partially overlooked due to their growth optima as not all psychrotrophs grow under mesophilic conditions.
The ranking of the ABs (Table 2) occurred in accordance with the frequency of AB usage (Kools et al., 2008).
The activation of the lactoperoxidase (an oxidoreductase that is naturally present in bovine raw milk), which is recommended by the FAO to preserve raw milk in developing countries, triggers a bacteriostatic type of action against Gram-positive bacteria such as streptococci or lactobacilli and a bactericidal type of action for Gram-negative such as coliforms or Pseudomonas spp. (Björck et al., 1975; Wolfson and Sumner, 1993; FAO, 2005; Seifu et al., 2005). The temperature-dependent inhibitory effect allows for an extension of the keeping quality for raw milk by 11–12 h at 25°C or by 5–6 days at 4°C (FAO, 2005). The described inhibitory effect with HT was especially noticeable here for samples S1 and S3, where, for “no AB,” both the mesophilic and psychrotrophic counts were below the counts from the control (C) at day 3, and still below 3 × 10⁵ cfu/ml after 7 days (Figure 1), which is consistent with the literature (FAO, 2005). A bactericidal type of effect due to HT could be suspected for psychrotrophs from S1 (S1P) (Figures 1, 4).
For all three samples, the activated lactoperoxidase system revealed two effects that succeeded one another over time. Specifically, based on the “total counts” level, the initial storage phase until day 3 showed an AB type-dependent AR level; but at day 7, even though the “total counts” (for “no AB”) were still below or approximately 3 × 10⁵ cfu/ml (for mesophiles) for all the conditions, both the psychrotrophic and mesophilic bacterial types resistant to G, Ce, L and TS were often plateauing at approximately the same level, contrary to that of the control (C) or to the N2-flushed milk samples (N) (Figure 1). Surprisingly, the resistant bacterial counts enumerated under the activated lactoperoxidase system (HT) could even exceed the resistant colony levels encountered from the corresponding controls (C) as noticeable for mesophiles in sample S2 (Figure 1). All the preceding observations highlight an altogether greater growth dynamic under the activated lactoperoxidase system combined with cold storage (HT), when compared to the single cold storage (C), which resulted in a selection of bacterial populations that were recovered at similar levels from different AB platings, implying that these bacterial types carry AB multi-resistance features.
The continuous N2 gas flushing kept both the mesophilic and psychrotrophic “total” counts (condition “no AB”) below 105 cfu/ml over 7 days for all three samples (Figure 1) as observed previously (Munsch-Alatossava et al., 2010a; Gschwendtner et al., 2016). The recorded inhibitory effects due to N2 gas flushing were also more “sample or initial microbiota than initial total bacterial level”-dependent (Figure 1); this point is well illustrated for S2M and S3M. Compared to sample S2, sample S3 presented the lowest psychrotrophic bacterial level at the initial stage and showed the highest sensitivity to N2-flushing with a 5-fold lower mean for S3, despite the fact that both samples presented approximately similar initial bacterial counts (Figures 1, 3). Notably, the study showed that N2 flushing was always efficient at controlling bacterial growth and the increases in AR as the mean log10 (ratio) values were judged to be significantly different for N compared to C for the three samples, or from HT for two samples (Figure 3); additionally, the means were mostly lowest for the N2-flushed milk samples irrespective of the AB type (Figure 4). As frequently reported, Pseudomonas and Acinetobacter are key spoilers of raw milk (Cousin, 1982; Wiedmann et al., 2000; Chambers, 2002; Munsch-Alatossava and Alatossava, 2006; Rasolofo et al., 2010); isolates from both genera, that were retrieved from raw milk samples, also exhibited AB multiresistant traits (Munsch-Alatossava and Alatossava, 2007). Both of these genera host nosocomial pathogens and are well known for their intrinsic resistance to ABs together with a remarkable ability to acquire genes encoding resistance determinants (Bonomo and Szabo, 2006). The results from the present cultivation-dependent approach, together with the NGS based study which revealed that both Pseudomonas and Acinetobacter were negatively affected by the N2 flushing (Gschwendtner et al., 2016), are further heightening the potential of the N2 gas-based treatment.
For the first time, the inhibitory effect of N2 was “quantified” by the log10 (ratio) variable, which reflects the growth trend over a cold storage period of 7 days. Compared to the single cold storage, N2 gas flushing was here, 81, 97, and 693-fold more efficient in controlling the growth of mesophiles in raw milk for samples S1, S2 and S3, respectively. The comparative analyses of sample S3 on one side and of S1 on the other side suggest that an earlier gas application is most appropriate for preventing a massive bacterial increase and a simultaneous increase in AR (Figure 3). Some conditions yielded negative mean values (Figures 3, 4), which suggests that N2 gas flushing could also trigger a bactericidal-type of effect in addition to exhibiting an overall bacteriostatic type of effect. To date, no clear bactericidal action was highlighted out of the observation that for Bacillus weihenstephanensis (a Gram-positive representative found in pasteurized milk), the cells were considerably damaged according to electron microscopic observations that were taken following the N2 gas flushing treatment (Lechner et al., 1998; Munsch-Alatossava et al., 2013; Munsch-Alatossava and Alatossava, 2014).
Taken together, the trends in the mean values from both treatments (HT and N), including the cold storage alone (C), illustrated the sample or bacterial population type-, treatment type-, antibiotic type-, and time-dependent responses. As expected, the bacterial populations were best controlled at day 3 compared to day 7 for both treatments (Figures 1, 2).
It was previously observed that the effectiveness of N2 in controlling bacterial growth in raw milk samples stored at 15 or 25°C was somehow equivalent to that of HT (Munsch-Alatossava et al., 2016); surprisingly, at 6°C, the N2-based treatments seemed to be more efficient at inhibiting bacterial growth and also at tackling AR in bacterial populations compared to HT (Figures 1–4). At 6°C, the “storage time” factor was preponderant over the “treatment type” under all the conditions (Table 3), in contrast to the study at 15/25°C in which the “treatment type or condition“ factor seemed to be the major determinant of the inhibitory effects for 4 of 7 samples (Munsch-Alatossava et al., 2016). A notable difference between HT and N relied on the observation that at sampling day 3, the activated lactoperoxidase system (HT) reduced TS-resistant bacterial levels to non-detectable levels under four conditions (S1P, S2M, S3M, and S3P) (Figure 1) whereas N experienced a reduction in the L-resistant bacterial types under four conditions (S1M, S2M, S2P, and S3M) (Figure 1).
Because a “plateau situation” was observed less frequently with N2 compared to HT, it can be reasonably assumed that both treatments do not target the same bacterial types and that the mode of action of the two treatments is different. As shown in Figure 1, the N2 gas treatment seems to trigger more moderate changes compared to HT in which large dynamic changes such as a 105-fold increase for TS-resistant bacteria could occur within 4 days.
We hypothesize that the activation of the lactoperoxidase system as an enzymatic type of reaction occurs rapidly and creates a “biological emptiness” that can be exploited by certain bacterial types that clearly dominated at the end of the cold storage phase and were characterized by the ability to express resistance to four classes of antibiotics simultaneously (Figures 1–3). Cold storage promotes an increase of Gram-negative bacteria in raw milk (Chambers, 2002); the opportune action of HT that reportedly exerts primarily bactericidal action on Gram-negative representatives is therefore most appropriate for reducing the bacterial load. For all three samples considered here, the activated lactoperoxidase system clearly favored the growth of multi-resistant bacterial populations (Figures 1, 4), which suggests that the activated lactoperoxidase system may not confer full benefits to all raw milk samples; whether initial good intentions are diverted by bacterial activities requires further clarifications.
Microorganisms, which are present in freshly drawn raw milk, are subjected to a cold shock (from 37°C to 3–4°C). After that, cold storage promotes considerable changes in bacterial populations with a reduction in bacterial diversity, including the decay of some genera (Lafarge et al., 2004; Raats et al., 2011; Munsch-Alatossava et al., 2012b; Gschwendtner et al., 2016).
The graphs in Figure 1 showed that the N treatment seems to preserve the bacterial diversity better during cold storage because the growth trend, under the different conditions, mostly reflects a “shift of a certain initial AR pattern” over time. The point that N2 gas alleviated the loss of bacterial diversity during cold storage was already highlighted by the NGS approach (Gschwendtner et al., 2016); we hypothesize that by better preserving bacterial diversity during cold storage, the N2 gas flushing may better prevent the occurrence of a “favorable to a few” niche and consequently better prevent the rise of antibiotic multi-resistance in raw milk.
Bacterial genomes carry between 1 and 15 ribosomal RNA operons (rrn) (Klappenbach et al., 2000; Větrovsky and Baldrian, 2013). Pal et al. (2016) found a relative abundance of AR genes at 0.035 copies per 16S rRNA gene by investigating the human, animal and environmental resistomes; by considering a 105 cfu/ml raw milk sample and assuming an average of seven ribosomal RNA operons per bacterial cell, this level would correspond to as many as 24,500 AR genes in one milliliter of raw milk.
Further studies are needed to examine whether “most fresh raw milk” is under conditions that call for N2 gas flushing to maximize the efficiency of blocking the increase in both “total counts” and in AR bacteria in raw milk during its cold storage.
Conclusions
Bovine raw milk as a highly perishable food material is the target of many different bacterial types with both spoilage and AR features. Here, N2 gas flushing (N) kept the “total counts” of bacteria below 3 × 10⁵ cfu/ml for three samples over 7 days of storage at 6°C, but also demonstrated real potential in preventing high increases in mesophiles or psychrotrophs carrying AR or multi-resistant features. The efficiency, evaluated by the log10 (ratio), was maximal for the milk sample that carried low mesophilic counts and the lowest psychrotrophic initial counts. Compared to the activated lactoperoxidase system (HT), the quantified inhibitory effect revealed equal or superior efficiency for N; if the bacterial levels were also kept below the 3 × 10⁵ cfu/ml limit for HT, the treatment combined with cold storage was selective for highly multi-resistant populations in all three samples. By contrast, if N2 gas flushing conferred benefits in terms of keeping quality of raw milk by maintaining bacterial “total counts” under the 3 × 10⁵ cfu/ml limit, it did not favor that frequent and massive proliferation of antibiotic multi-resistant bacteria.
Author Contributions
PMA and TA conceived and designed the experiments; PMA and SJ performed the experiments; JPG analyzed the data; TA and JPG contributed reagents/materials/analysis tools; PMA, TA, and JPG wrote the paper. All authors approved the final version.
Conflict of Interest Statement
The authors declare that the research was conducted in the absence of any commercial or financial relationships that could be construed as a potential conflict of interest.
Acknowledgments
We gratefully acknowledge Antti Alavuotunki/Helsingin Meijeriliike Ltd. for the gift of the raw milk samples. We thank both reviewers for their valuable comments and suggestions to improve our manuscript. PMA dedicates this work to all misfortune companions who were swept away by restructuring at Helsinki university.
Abbreviations
S1, S2, S3, raw milk samples; M, mesophiles; P, psychrotrophs; C, control; HT, activated lactoperoxidase system; N, N2 gas flushing; AR, antibiotic resistance; AB, antibiotic; G, gentamycin; Ce, ceftazidime; L, levofloxacin; TS, trimethoprim-sulfamethoxazole.
References
Andremont, A. (2015). What to do about resistant bacteria in the food chain? Bull. World Health Organ. 93, 217–218. doi: 10.2471/BLT.15.030415
Anonymous (2004). Regulation (EC) No 853/2004 of the European parliament and of the council of 29 April 2004 laying down specific hygiene rules for on the hygiene of foodstuffs. Official J. Eur. Union L 139/55, 151.
Aquilanti, L., Garofalo, C., Osimani, A., Silvestri, G., Vignaroli, C., and Clementi, F. (2007). Isolation and molecular characterization of antibiotic-resistant lactic acid bacteria from poultry and swine meat products. J. Food Prot. 70, 557–565. doi: 10.4315/0362-028X-70.3.557
Bari, L., Hoque, M. R., Reza, M. S. A., Hossain, M. A., and Islam, A. (2015). Adulteration of raw milk in selected regions of Tangail district of Bangladesh. J. Environ. Sci. 8, 41–44. doi: 10.3329/jesnr.v8i1.24662
Björck, L., Rosén, C. G., Marshall, V., and Reiter, B. (1975). Antibacterial activity of the lactoperoxidase system in milk against Pseudomonads and other Gram-negative bacteria. App. Microbiol. 30, 199–204.
Bonomo, R. A., and Szabo, D. (2006). Mechanisms of multidrug resistance in Acinetobacter species and Pseudomonas aeruginosa. Clin. Infect. Dis. 43(Suppl. 2), S49–S56. doi: 10.1086/504477
Botelho, B. G., Reis, N., Oliveira, L. S., and Sena, M. M. (2015). Development and analytical validation of a screening method for simultaneous detection of five adulterants in raw milk using mid-infrared spectroscopy and PLS-DA. Food Chem. 181, 31–37. doi: 10.1016/j.foodchem.2015.02.077
Chambers, J. V. (2002). “The microbiology of raw milk,” in Dairy Microbiology Handbook, ed R. K. Robinson (New York, NY: Wiley-Interscience), 39–89.
Cousin, M. A. (1982). Presence and activity of psychrotrophic microorganisms in milk and dairy products: a review. J. Food Prot. 45, 172–207. doi: 10.4315/0362-028X-45.2.172
Dechemi, S., Benjelloun, H., and Lebeault, J. M. (2005). Effect of modified atmospheres on the growth and extracellular enzymes of psychrotrophs in raw milk. Eng. Life Sci. 5, 350–356. doi: 10.1002/elsc.200520082
EUCAST (2000). European Committee on Antimicrobial Susceptibility Testing. Determination of minimum inhibitory concentrations (MICs) of antibacterial agents by agar dilution. Clin. Microbiol. Infect. 6, 509–515. doi: 10.1046/j.1469-0691.2000.00142.x
EUCAST (2010). AST of Bacteria: EUCAST Breakpoint Tables v1.1. Available online at: www.eucast.org
ECDC (European Centre for Disease Prevention Control) EFSA (European Food Safety Authority), EMA (European Medicines Agency). (2015). ECDC/EFSA/EMA First Joint Report on the Integrated Analysis of the Consumption of Antimicrobial Agents and Occurrence of Antimicrobial Resistance in Bacteria from Humans and Food-Producing Animals. Stockholm; Parma; London: ECDC/EFSA/EMA, 2015. EFSA J. 13 (1), 4006.
FAO (1991). Guidelines for the Preservation of Raw Milk by the Use of the Lactoperoxidase System. Rome: CAC/GL 13-1991.
FAO (2016). Antimicrobial Resistance. FAO. Available online at: http://www.fao.org/antimicrobial-resistance/en/
FAO (2005). “Benefits and potential risks of the lactoperoxidase system of raw milk preservation,” in Report of an FAO/WHO Technical Meeting. FAO Headquarters (Rome).
Forslund, K., Sunagawa, S., Coelho, L. P., and Bork, P. (2014). Metagenomic insights into the human gut resistome and the forces that shape it. Bioessays 36, 316–329. doi: 10.1002/bies.201300143
Frank, J. F., and Hassan, A. N. (2002). “Microorganisms associated with milk,” in Encyclopedia of Dairy Sciences, Vol 3, eds H. Roginski, J. W. Fuquay, and P. F. Fox (London: Academic Press), 1786–1796.
Garofalo, C., Vignaroli, C., Zandri, G., Aquilanti, L., Bordoni, D., Osimani, A., et al. (2007). Direct detection of antibiotic resistance genes in specimens of chicken and pork meat. Int. J. Food Microbiol. 113, 75–83. doi: 10.1016/j.ijfoodmicro.2006.07.015
Gaya, P., Medina, M., and Nuñez, M. (1991). Effect of the lactoperoxidase system on Listeria monocytogenes behavior in raw milk at refrigeration temperatures. Appl. Environ. Microbiol. 57, 3355–3360.
Gschwendtner, S., Alatossava, T., Kublik, S., Fuka, M. M., Schloter, M., and Munsch-Alatossava, P. (2016). N2 gas flushing alleviates the loss of bacterial diversity and inhibits psychrotrophic Pseudomonas during the cold storage of bovine raw milk. PLoS ONE 11:e0146015. doi: 10.1371/journal.pone.0146015
Klappenbach, J. A., Dunbar, S. N., and Schmidt, T. M. (2000). rRNA operon copy number reflects ecological strategies of bacteria. Appl. Environ. Microbiol. 66, 1328–1333. doi: 10.1128/AEM.66.4.1328-1333.2000
Kools, S. A. E., Moltmann, J. F., and Knacker, T. (2008). Estimating the use of veterinary medicines in the European Union. Regul. Toxicol. Pharmacol. 50, 59–65. doi: 10.1016/j.yrtph.2007.06.003
Lafarge, V., Ogier, J. C., Girard, V., Maladen, V., Leveau, J. Y., Gruss, A., et al. (2004). Raw cow milk bacterial populations shifts attributable to refrigeration. App. Environ. Microbiol. 70, 5644–5650. doi: 10.1128/AEM.70.9.5644-5650.2004
Lechner, S., Mayr, R., Francis, K. P., Prüβ, B. M., Kaplan, T., and Wieβner-Gunkel, et al. (1998). Bacillus weihenstephanensis sp. nov. is a new psychrotolerant species of the Bacillus cereus group. Int. J. Syst. Bacteriol. 48, 1373–1382. doi: 10.1099/00207713-48-4-1373
Munsch-Alatossava, P., and Alatossava, T. (2006). Phenotypic characterization of raw-milk associated psychrotrophic bacteria. Microbiol. Res. 161, 334–346. doi: 10.1016/j.micres.2005.12.004
Munsch-Alatossava, P., and Alatossava, T. (2007). Antibiotic resistance of raw-milk associated psychrotrophic bacteria. Microbiol. Res. 162, 115–123. doi: 10.1016/j.micres.2006.01.015
Munsch-Alatossava, P., and Alatossava, T. (2014). Nitrogen gas flushing can be bactericidal: the temperature-dependent destiny of Bacillus weihenstephanensis KBAB4 under a pure N2 atmosphere. Front. Microbiol. 5:619. doi: 10.3389/fmicb.2014.00619
Munsch-Alatossava, P., Gauchi, J. P., Chamlagain, B., and Alatossava, T. (2012a). Trends of antibiotic resistance in mesophilic and psychrotrophic bacterial populations during cold storage of raw milk. ISRN Microbiol. 2012:918208. doi: 10.5402/2012/918208
Munsch-Alatossava, P., Ghafar, A., and Alatossava, T. (2013). Potential of nitrogen gas (N2) flushing to extend the shelf life of cold stored pasteurised milk. Int. J. Mol. Sci. 14, 5668–5685. doi: 10.3390/ijms14035668
Munsch-Alatossava, P., Gursoy, O., and Alatossava, T. (2010a). Potential of nitrogen gas (N2) to control psychrotrophs and mesophiles in raw milk. Microbiol. Res. 165, 122–132. doi: 10.1016/j.micres.2009.02.002
Munsch-Alatossava, P., Gursoy, O., and Alatossava, T. (2010b). Exclusion of phospholipases (PLs)-producing bacteria in raw milk flushed with nitrogen gas (N2). Microbiol. Res. 165, 61–65. doi: 10.1016/j.micres.2008.07.001
Munsch-Alatossava, P., Ikonen, V., Alatossava, T., and Gauchi, J. P. (2012b). “Trends of antibiotic resistance (AR) in mesophilic and psychrotrophic bacterial populations during cold storage of raw milk, produced by organic and conventional farming systems,” in Antibiotic Resistant Bacteria, A Continuous Challenge in the New Millenium, ed M. Pana (Rijeka: Intech), 105–124.
Munsch-Alatossava, P., Quintyn, R., De Man, I., Alatossava, T., and Gauchi, J. P. (2016). Efficiency of N2 gas flushing compared to the lactoperoxidase system at controlling bacterial growth in bovine raw milk stored at mild temperatures. Front. Microbiol. 7:839. doi: 10.3389/fmicb.2016.00839
Murray, S. K., Kwan, K. K. H., Skura, B. J., and Mc Kellar, R. C. (1983). Effect of nitrogen flushing on the production of proteinase by psychrotrophic bacteria in raw milk. J. Food Sci. 48, 1166–1169. doi: 10.1111/j.1365-2621.1983.tb09183.x
Pal, C., Bengtsson-Palme, J., Kristiansson, E., and Larsson, D. G. (2016). The structure and diversity of human, animal and environmental resistomes. Microbiome 4, 54. doi: 10.1186/s40168-016-0199-5
Pereira, R. V., Siler, J. D., Bicalho, R. C., and Warnick, L. D. (2014). In vivo selection of resistant E. coli after ingestion of milk with added drug residues. PLoS ONE 9:e115223. doi: 10.1371/journal.pone.0115223
Perreten, V., Schwarz, F., Cresta, L., Boeglin, M., Dasen, G., and Teuber, M. (1997). Antibiotic resistance spread in food. Nature 389, 801–802. doi: 10.1038/39767
Raats, D., Offek, M., Minz, D., and Halpern, M. (2011). Molecular analysis of bacterial communities in raw cow milk and the impact of refrigeration on its structure and dynamics. Food Microbiol. 28, 465–471. doi: 10.1016/j.fm.2010.10.009
Rasolofo, E. A., St-Gelais, D., La Pointe, G., and Roy, D. (2010). Molecular analysis of bacterial population structure and dynamics during cold storage of untreated and treated milk. Int. J. Food Microbiol. 138, 108–118. doi: 10.1016/j.ijfoodmicro.2010.01.008
Rolain, J. M. (2013). Food and human gut as reservoirs of transferable antibiotic resistance encoding genes. Front. Microbiol. 4:173. doi: 10.3389/fmicb.2013.00173
Seifu, E., Buys, E. M., and Donkin, E. F. (2005). Significance of the lactoperoxidase system in the dairy industry and its potential applications: a review. Trends Food Sci. Technol. 16, 137–154. doi: 10.1016/j.tifs.2004.11.002
SØrum, H., and L'Abbé Lund, T. M. (2002). Antibiotic resistance in food-related bacteria- a result of interfering with the global web of bacterial genetics. Int. J. Food Microbiol. 78, 43–56. doi: 10.1016/S0168-1605(02)00241-6
Tetra Pak (2003). Dairy Processing Handbook, 2nd Revised Edn. Lund: Tetra Pak Processing Systems AB.
Teuber, M. (1999). Spread of antibiotic resistance with food-borne pathogens. Cell Mol. Life Sci. 56, 755–763. doi: 10.1007/s000180050022
Větrovsky, T., and Baldrian, P. (2013). The variability of the 16S rRNA gene in bacterial genomes and its consequences for bacterial community analyses. PLoS ONE 8:e557923. doi: 10.1371/journal.pone.0057923
Wang, H., McEntire, J. C., Zhang, L., Li, X., and Doyle, M. (2012). The transfer of antibiotic resistance from food to humans: facts, implications and future directions. Rev. Sci. Tech. 31, 249–260. doi: 10.20506/rst.31.1.2117
Wichmann, F., Udikovic-Kolic, N., Andrew, S., and Handelsmann, J. (2014). Diverse antibiotic resistance genes in dairy cow manure. mBio 5, e01017–e01013. doi: 10.1128/mBio.01017-13
Wiedmann, M., Weilmeier, D., Dineen, S. S., Ralyea, R., and Boor, K. J. (2000). Molecular and phenotypic characterization of Pseudomonas spp. isolated from milk. App. Environ. Microbiol. 66, 2085–2095. doi: 10.1128/AEM.66.5.2085-2095.2000
Keywords: antibiotic resistance (AR), raw milk, cold storage, N2 gas, lactoperoxidase system, Ryan-Einot-Gabriel-Welsch test
Citation: Munsch-Alatossava P, Jääskeläinen S, Alatossava T and Gauchi J-P (2017) N2 Gas Flushing Limits the Rise of Antibiotic-Resistant Bacteria in Bovine Raw Milk during Cold Storage. Front. Microbiol. 8:655. doi: 10.3389/fmicb.2017.00655
Received: 11 January 2017; Accepted: 30 March 2017;
Published: 19 April 2017.
Edited by:
Javier Carballo, University of Vigo, SpainReviewed by:
Cristiana Garofalo, Università Politecnica delle Marche, ItalyDavid Rodriguez-Lazaro, University of Burgos, Spain
Copyright © 2017 Munsch-Alatossava, Jääskeläinen, Alatossava and Gauchi. This is an open-access article distributed under the terms of the Creative Commons Attribution License (CC BY). The use, distribution or reproduction in other forums is permitted, provided the original author(s) or licensor are credited and that the original publication in this journal is cited, in accordance with accepted academic practice. No use, distribution or reproduction is permitted which does not comply with these terms.
*Correspondence: Patricia Munsch-Alatossava, cGF0cmljaWFfbXVuc2NoQHlhaG9vLmZy