 Melanie Schären1
 Kerstin Kiri2Susanne Riede2
 Mark Gardener3Ulrich Meyer1*Jürgen Hummel4
 Tim Urich5Gerhard Breves2Sven Dänicke1
- 1Institute of Animal Nutrition, Friedrich-Loeffler-Institute, Federal Research Institute for Animal Health, Brunswick, Germany
- 2Department of Physiology, University of Veterinary Medicine Hannover, Hannover, Germany
- 3Environment, Earth & Ecosystems, The Open University, Milton Keynes, UK
- 4Department of Animal Sciences, University of Goettingen, Goettingen, Germany
- 5Institute of Microbiology, University of Greifswald, Greifswald, Germany
In spring dairy cows are often gradually transitioned from a silage- and concentrate-based ration (total mixed ration, TMR) to pasture. Rumen microbiota adaptability is a key feature of ruminant survival strategy. However, only little is known on the temporal and spatial microbial alterations involved. This study aims to investigate how the rumen liquid (LAAB), particle (PAAB), and epithelium (EAAB) associated archaea and bacteria are influenced by this nutritional change. A 10-wk trial was performed, including 10 rumen-fistulated dairy cows, equally divided into a pasture- and a confinement- group (PG and CG). The CG stayed on a TMR-based ration, while the PG was gradually transitioned from TMR to pasture (wk 1: TMR-only, wk 2: 3 h/day on pasture, wk 3 & 4: 12 h/day on pasture, wk 5–10: pasture-only). In wk 1, wk 5, and wk 10 samples of solid and liquid rumen contents, and papillae biopsies were collected. The DNA was isolated, and PCR-SSCP and 16S rRNA gene amplicon sequencing analysis were performed. Cluster analysis revealed a higher similarity between LAAB and PAAB, compared to the EAAB, characterized by higher species diversity. At all three locations the microbiota was significantly influenced by the ration change, opposite the generally acknowledged hypothesis that the EAAB remain more consistent throughout dietary changes. Even though the animals in the PG were already on a full-grazing ration for 4–6 days in wk 5, the microbiota at all three locations was significantly different compared to wk 10, suggesting an adaptation period of several days to weeks. This is in line with observations made on animal level, showing a required time for adaptation of 2–3 weeks for production and metabolic variables. A large part of the rumen prokaryote species remained unaltered upon transition to pasture and exhibited a strong host influence, supporting the hypothesis that the rumen microbiota consists of a core and a variable microbiota. For the effect of the location as well as the ration change either very similar or opposite trends among member species of common taxa were observed, demonstrating that microbes that are phylogenetically close may still exhibit substantially different phenotypes and functions.
Introduction
In temperate climate zones dairy cows often receive a silage and concentrate-based ration (total mixed ration, TMR) during winter time and are then gradually transitioned to a pasture-based ration in spring. Since the two systems (confinement and pasture) do not only differ substantially in ration composition, but also how feed is acquired, considerable metabolic as well as behavioral adaptations are required upon this nutritional change (Osuji, 1974; Kolver, 2003). The adaptability of rumen microbiota is a key feature of ruminant physiology and survival strategy (Russell and Rychlik, 2001; McCann et al., 2014a; Zanton, 2015). It has been shown that whenever cows undergo a ration change rumen microbiota needs between 1 day and sometimes even longer than 3 weeks to adapt and stabilize, depending on the group of bacteria, archaea, fungi, or protozoa, the extent of diet change and the behavioral adaptation required (Hackmann, 2015). de Menezes et al. (2011) have shown in a cross-over design, with 2 weeks for diet adaptation, that the liquid and solid rumen bacterial and archaeal community of TMR and pasture fed dairy cows differs significantly. Furthermore, Nakano et al. (2013) showed that rumen microbiota needs 3–4 weeks to adapt to a pasture-based ration when no gradual adaptation to the new nutritional situation is granted. In both studies Prevotellaceae were more prevalent on pasture and a possible key role of this bacterial family in reducing methane production and in transitioning cows to a pasture-based ration was suggested (de Menezes et al., 2011; Nakano et al., 2013; McCann et al., 2014a). However, further data on time required for adaptation of rumen microbiota during the gradual transition from a TMR to a pasture-based ration, and the prokaryotes playing a key role during this nutritional change are lacking.
Aside the particle- and liquid-associated, a third rumen bacterial community has been described. The epithelium-associated or “epimural” microbiota has been investigated in few studies and it has been suggested that it is associated with fermentation end-products, volatile fatty acid (VFA) absorption, maintaining an anaerobe environment, recycling of endogenous nitrogen, and tissue (Cheng et al., 1979; Wallace et al., 1979; McCann et al., 2014a). It has been further speculated whether this microbial community may remain more consistent through dietary changes compared with the particle- and liquid-associated bacterial community (Sadet et al., 2007; McCann et al., 2014a).
In previous publications, we described the alterations in production and rumen variables during a gradual transition from a TMR- to a pasture-based ration (Schären et al., 2016a,b). Primarily a decrease in rumen fermentation activity during the initial phase of transition was observed, most likely due to a decreased intake of fermentable organic matter. After 2–3 weeks on a full-grazing ration an increase in rumen fermentation activity occurred indicated by a decrease in mean daily pH and acetate/propionate ratio as well as an increase in daily pH variation and total VFA concentrations. This was also mirrored in the development of different other rumen (increase of VFA absorption capacity and rumen papillae surface area), performance (stabilization of milk yield and increase in BW) and metabolic (serum non-esterified fatty acid concentrations) variables. We suggested a behavioral and metabolic adaptation after 2–3 weeks on a full-grazing ration leading to an increased intake of fermentable organic matter and therefore rumen fermentation activity and stabilization of milk production. Since rumen microbiota plays a key role in adaptation to a new ration we hypothesized that the effects of a transition from a TMR- to a pasture-based ration observed in other performance, rumen and metabolic variables would also be mirrored in the different rumen archaea and bacteria communities. To investigate whether the archaea and bacteria communities are differently affected by this ration change, polymerase-chain-reaction-single-strand-conformation-polymorphism (PCR-SSCP)- and amplicon sequencing-analysis were performed on samples of the liquid and solid fraction, as well as rumen papillae.
Materials and Methods
Experimental work was conducted at the experimental station of the Institute of Animal Nutrition of the Friedrich-Loeffler-Institute (FLI) in Brunswick, Germany. The experiment was carried out in accordance with the German Animal Welfare Act approved by the LAVES (Lower Saxony State Office for Consumer Protection and Food Safety, Germany; approval number: 33.09-42502-04-11/0444).
Experimental Design and Treatments
A 10-wk trial (wk 1–10) was performed from April 21st until June 27th 2014 including 10 rumen-fistulated German Holstein cows (182 ± 24 days in milk, 23.5 ± 3.5 kg milk/d; parity: 4.5 ± 2.2; mean ± SD; at the beginning of the trial). The full trial included 60 dairy cows (166 ± 23 days in milk and 23.5 ± 3.7 kg milk/day; parity: 1.9 ± 1.6; mean ± SD; at the beginning of the trial); the experimental design, treatments, rations, climate data, animal performance, urine variables, clinical chemistry, and total blood counts have been reported previously (Schären et al., 2016a). The rumen fermentation, VFA absorption characteristics and morphology variables assessed in the fistulated animals, as well as their performance data have been separately described (Schären et al., 2016b). The experimental work and data of the present paper have been exclusively conducted and collected in these 10 fistulated animals. At the beginning of the trial the animals were randomly assigned to either a pasture group (PG, n = 5) or a confinement group (CG, n = 5). The CG stayed in a confinement system and received a TMR throughout the whole trial (35% corn silage, 35% grass silage, 30% concentrate; DM basis), whereas the PG was transitioned from a TMR- to a pasture-based ration (wk 1: TMR-only, wk 2: TMR and 3 h/d on pasture, wk 3 and 4: TMR and 12 h/d on pasture, wk 5–10: pasture and 1.75 kg DM concentrate/d offered in 2 equal meals in troughs after morning and evening milking). A continuous grazing system was implemented on ryegrass dominated pasture. The cows were milked two times per day at 05:30 and 15:00 h and the TMR was fed daily at ~11:00 h. Individual TMR and water intake was continuously recorded in the confinement system using electronic weighing throughs (Insentec, B.V., Markenesse, The Netherlands). Dry matter intake (DMI) on pasture was estimated using the n-alkane method in wk 7 and wk 9 (described in detail in Schären et al., 2016a).
Sample Collection
Sample collection took place at three points in time: at the beginning of the trial (TMR-only, wk1), during the transitional period (PG being 4–6 days on a full-grazing ration, wk 5) and at the end of the trial (PG being 6 weeks on a full-grazing ration, wk 10). All animals were sampled within 3 days of the particular week, between 07:30 and 14:30 h. Firstly, a sample of approximately 200 g rumen solid content was collected at the height of the rumen fistula aperture (pool sample of grab-samples collected from cranial to caudal in the upper half of the rumen fiber mat). Thereafter a 250 mL rumen fluid sample was collected from the ventral site of the rumen (saccus ventralis) using a manual pump. Both samples were stored at −20°C within 30 min. Subsequently the total rumen content was evacuated, transferred into insulated barrels and the rumen was washed twice (2 × 10 L water, 39°C). The rumen papillae were then collected at the most ventral site of the ventral rumen sac (saccus ventralis; ~5 cm adjacent to the pila coronaria ventralis) using a biopsy forceps (Lloyd-Davis biopsy forceps 35 cm, Zepf Instruments, Tuttlingen, Germany). Papillae were immediately washed with a 0.9% NaCl solution, stored in 2 mL cryo tubes (Cryo-Pure Tubes, Sarstedt AG & Co, Nürmbrecht, Germany) and shock frozen using liquid nitrogen. Papillae samples were stored at −80°C until analysis. After the papillae collection a VFA absorption test was performed and the rumen content was reintroduced (detailed protocol in Schären et al., 2016b).
DNA Extraction
Rumen Liquid Content
The separation of the liquid-associated microbes from feed particles and the subsequent DNA extraction have been described by Meibaum et al. (2012) and Schären et al. (2017) (exact protocol). Briefly, several centrifugation steps were performed (once 5 min at 600 g (4°C) to remove feed particles and debris, and four times during 20 min at 27,000 g (4°C); between each centrifugation step the pellet was re-suspended in 40 mL 0.9% NaCl) and the concentrated samples were liquid shock frozen under the form of droplets for storage at −80°C. After a centrifugation step (13,000 g, 5 min, 4°C) the supernatant was discarded and the sample was re-suspended in 1 × tris(hydroxymethyl)-aminomethane-HCl, EDTA (both 10 mM, pH 8.0), and NaCl (150 mM), and a DNA extraction was performed including a mechanical lysis of the cells by bead beating method (Fast Prep, MP Biomedicals, Eschwege, Germany; in two sequences of acceleration, 6.0 and 4.5 m/s, 40 s each). This was followed by different incubation steps including lysozyme and RNaseA (30 min at 37°C), sodiumdodecylsulphate and proteinase K (1 h at 37°C), and 4 M NaCl and cetyltrimethylammoniumbromide (65°C during 10 min). To purify the mixture from proteins phenol-chloroform-isoamylalcohol was added, the mixture was centrifuged (7 min, 13,000 g, 4°C), the supernatants were discarded, chloroform-isoamylalcohol was added, centrifuged again (10 min, 13,000 g, 4°C) and the supernatant was then kept for further processing. As a final step the samples were further purified using the peqGold Tissue-Kit (peqlab, Erlangen, Germany) according to manufacturer's guidelines. The genomic DNA (gDNA) samples were then stored at 4°C until further processing.
Rumen Solid Content
To remove all liquid-associated bacteria from the sample several washing steps were performed per sample (10 g sample, 4–5 washing steps with each 1 L 0.9% NaCl, using a 4 mm sieve, until washing solution was clear). Thereafter the fiber particles were transferred into a 50 mL vessel, immersed in sterile 0.9% NaCl solution and sonicated in an ultrasonic-bath during 30 min to detach the particle associated bacteria. Thereafter the sample was sieved (4 mm sieve), centrifuged at 27,000 g during 20 min (4°C), the supernatant discarded and the pellet was resuspended in 1,000 μl 0.9% NaCl. For DNA extraction and purification 200 μl of the microbe-pellet and the peqGold Tissue-Kit was used (according to manufacturer's guidelines; 1. Incubation: 150 μL TE-Puffer, 50 μL lysozyme, 30 min at 30°C on thermoshaker; 2. Incubation: 400 μL DNA lysis puffer, 20 μL proteinase K, 15 μL RNaseA, 60 min at 50°C on thermoshaker). The gDNA samples were then stored at 4°C until further processing.
Rumen Papillae
Rumen papillae samples were thawed on ice and 120 mg of each sample were washed twice with 1,000 μL sterile 0.9% NaCl. Thereafter DNA extraction (400 μL DNA lysis buffer, 20 μL proteinase K, 15 μL RNaseA, 50 min at 60°C on thermoshaker) and purification was performed using the pegGold Tissue-Kit according to manufacturer's guidelines and samples were then stored at 4°C until further processing.
PCR-SSCP Analysis
After DNA extraction a two-step amplification (initial and nested PCR) of the bacteria specific 16S rRNA gene regions and a single-strand digestion step were performed (protocol and primers described in detail in Meibaum et al., 2012). To compare the bacterial populations at the three different locations in the rumen, as well as the change over time in both groups, 12 different SSCP-gels were created: 6 gels comparing the liquid- (LAB), particle- (PAB), and epithelium- (EAB) associated bacteria at one particular point in time in the PG or CG, 6 gels comparing the LAB, PAB or EAB at the three points in time (wk 1, wk 5, and wk 10) in the PG or CG. Gel-electrophoresis was carried out at 300 V during 22.5 h at 20°C (described in detail in Dohrmann et al., 2004). The gels were digitalized and analyzed using ScanMaker (i800, Mikrotek, Willich, Germany) and GelComparII (Applied Maths, Sint-Martens-Latem, Belgium) as described in Meibaum et al. (2012). For graphical illustration two dimensional principal co-ordinates analysis (PCO) plots based on dissimilarities were created with the cmdscale() command in the R Guide 3.0.2 software package (R-Core-Team, 2013).
Prokaryotic 16S rRNA Gene Amplification, Illumina MiSeq Sequencing and Bioinformatics
For sequencing gDNA samples were sent to Microsynth AG (Balgach, Switzerland). A primer pair with 97.7/98.4% (forward primer) and 96.9/96.5% (reverse primer) coverage (one mismatch) for archaea and bacteria, respectively, was chosen for 16S sequencing library preparation: A519F (S-D-Arch-0519-a-S-15): CAGCMGCCGCGGTAA and 802R (S-D-Bact-0785-b-A-18): TACNVGGGTATCTAATCC (Klindworth et al., 2013). Due to the additional inclusion of the archaea in this approach (in comparison to the PCR-SSCP analysis), samples will be referred to as liquid- (LAAB), particle- (PAAB), and epithelium- (EAAB) associated bacteria and archaea. For 16S rDNA amplification the HiFi HotStart PCR Kit (Kapa Biosystems, Wilmington, MA, USA) was used with following PCR conditions: initial denaturation (95°C, 180 s), denaturation (98°C, 20 s), annealing (50.8°C, 30 s) and elongation (72°C, 30 s) with 30 cycles, and a final elongation step (72°C, 5 min). Further, the Illumina Nextera Libraries were prepared according to the manufacturers instruction (Illumina, San Diego, USA). Sequencing was performed on the Illumina MiSeq Sequencing System using the Illumina MiSeq reagent Kit v2 (2 × 250 bp). Sequence data were demultiplexed and trimmed using the Illumina MiSeq v2.5.1.3. reporter and cutadapt v1.8.1 software package (Martin, 2011). Read stitching was performed using FLASH v1.2.11 (Magoč and Salzberg, 2011) and only stitched reads with an average quality score (whole read) of 25 or higher were used for downstream analysis. Further, de novo Chimera detection, identification and removal was done using the Uchime v4.2 (Edgar et al., 2011) and Usearch v8.1.1861 (Edgar, 2010) software package. The taxonomic assignment and the OTU clustering (based on 97% sequence similarity) were performed using Uclust (Edgar, 2010) and QIIME v1.9.1 (Caporaso et al., 2010), respectively. Only matches with a minimum sequence similarity of ≥90% and a score 0.67 or 1.00 in the greengenes database were used. Singeltons were removed from the dataset to reduce bias introduced by sequencing errors. As a reference database for the taxonomic assignment the SILVA rRNA database v111 was chosen (Quast et al., 2013). For downstream analysis only OTUs with a relative abundance of at least 0.1% were considered. Alpha diversity analysis was performed and PCO plots were created using QIIME. Robustness of clusters displayed in PCO plots was ensured by jackknife resampling (10-fold).
Statistical Analysis
All statistical analyses were performed using the R 3.0.2 software package. In case of the SSCP-gels a PERMANOVA was performed using the adonis() function in the R software package vegan (Oksanen et al., 2015). To evaluate the alterations in similarity of samples on the SSCP gels over the course of the trial [comparing each sample in wk 5 and wk 10 to its reference sample of wk 1 (within the same cow)] a repeated measures ANOVA using the aov() function was performed. Alpha diversity variables (chao1 index, observed species, and Shannon index) were analyzed via a PERMANOVA using the aovp() function of the lmPerm software package (Wheeler, 2010). Beta-diversity was evaluated based on the weighted UniFrac distances via a PERMANOVA using the adonis() function in the software package vegan. For species level comparison a PERMANOVA model using the aovp() function in the software package lmPerm was performed. The model included Group, Time and Location and their interactions as well as the Cow and a Cow × Time interaction as fixed factor and the Cow as random factor. Results were considered significant at P ≤ 0.05 and a trend declared at 0.05 < P ≤ 0.10.
Results
SSCP Analysis
Cluster analysis displayed a clustering of LAB, PAB, and EAB in both ration types and all three points in time, with a higher similarity among LAB and PAB, compared to EAB samples (Figure 1). LAB and PAB had an average similarity of 82 ± 8% and differ strongly from the EAB with a similarity of 39 ± 11% EAB compared to LAB, and 37 ± 10% EAB compared to PAB (mean ± SD). For illustrational purposes the dendrogram and SSCP-gel of the comparison of the samples collected in wk 5 in the CG are depicted in Figure 2. Within the different bacteria communities, a significant influence of time was only observed for the LAB in the PG and the EAB in CG (Figure 3). However, when comparing the samples of the different bacteria populations in wk 5 and wk 10 to their reference sample in wk 1, a significant greater decrease in similarity over time in all three bacteria populations was observed for the PG compared to the CG (Figure 4).
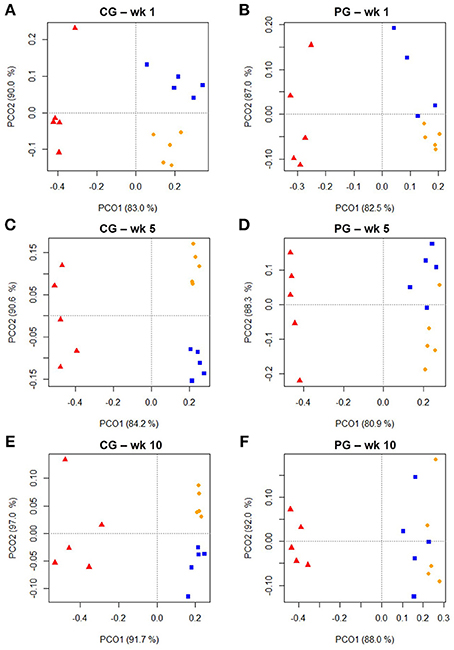
Figure 1. Two dimensional PCO-plots from SSCP-gels of rumen liquid (LAB, orange dot), particle (PAB, blue square) and epithelium (EAB, red triangle) associated bacteria of the confinement group (CG) and pasture group (PG) in wk 1, wk 5, and wk 10 (explained variance indicated in % on x- and y-axis, n = 5). The CG stayed on a TMR based ration during the entire trial while the PG was slowly introduced to a pasture-based ration: wk 1: TMR, wk 2: TMR and 3 h pasture/d, wk 3 and 4: TMR and 12 h pasture/d, wk 5–10: pasture and 1.75 kg DM concentrate/d. Significance: (A) P = 0.001, (B) P = 0.001, (C) P = 0.001, (D) P = 0.001, (E) P = 0.001, (F) P = 0.002.
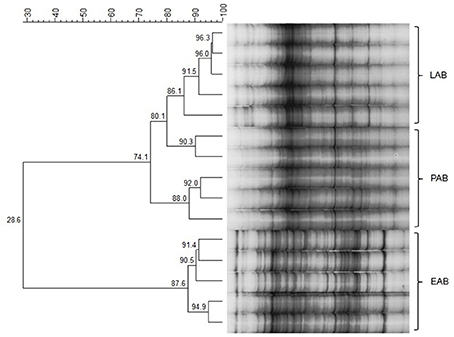
Figure 2. Example of SSCP-Gel and dendrogram of rumen liquid (LAB), particle (PAB), and epithelium (EAB) associated bacteria at one point in time during the trial (wk 5, confinement group, n = 5). Numbers indicate similarity (in %) between samples/clusters.
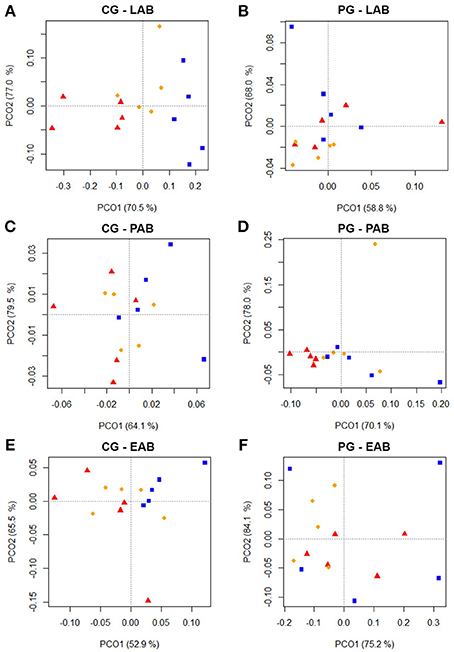
Figure 3. Two dimensional PCO-plots from SSCP-gels of rumen liquid (LAB), particle (PAB), and epithelium (EAB) associated bacteria illustrating changes over the course of the trial (wk 1 = red triangle, wk 5 = orange dot, wk 10 = blue square) in the confinement group (CG) and pasture group (PG; n = 5; explained variance indicated in % on x- and y-axis). The CG stayed on a TMR based ration during the entire trial while the PG was slowly introduced to a pasture-based ration: wk 1: TMR, wk 2: TMR and 3 h pasture/d, wk 3 and 4: TMR and 12 h pasture/d, wk 5–10: pasture and 1.75 kg DM concentrate/d. Significance: (A) P = 0.141, (B) P = 0.001, (C) P = 0.080, (D) P = 0.328, (E) P = 0.013, (F) P = 0.115.
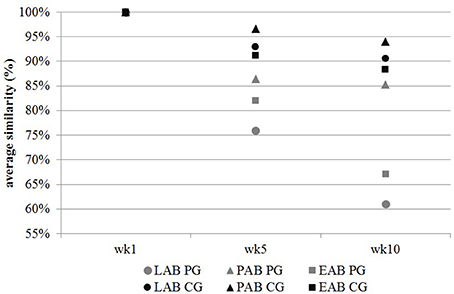
Figure 4. Change in bacterial communities of the liquid- (LAB), particle- (PAB), and epithelium-associated bacteria (EAB) over time expressed in average similarity (in %) of samples compared to their reference sample in wk 1. CG, confinement group, PG, pasture group (n = 5). A significant greater decrease in similarity over time in all three bacteria populations was observed for the PG compared to the CG (PEAB = 0.002, PLAB = 0.008; PPAB = 0.003; SDEAB = 11%; SDLAB = 8%, SDPAB = 16%). The CG stayed on a TMR based ration during the entire trial while the PG was slowly introduced to a pasture-based ration: wk 1: TMR, wk 2: TMR and 3 h pasture/d, wk 3 and 4: TMR and 12 h pasture/d, wk 5–10: pasture and 1.75 kg DM concentrate/d.
16S rRNA Gene Amplicon Analysis
For the LAAB, PAAB and EAAB a total number of 2,151 ± 312, 2,615 ± 338, and 662 ± 161 different OTUs were detected, respectively. Filtering (exclusion of OTUs with a relative abundance < 0.1%) resulted in a total number of 177 different OTUs with an average of 167 ± 5 (LAAB), 162 ± 4 (PAAB), and 74 ± 8 (EAAB) different OTUs per sample (mean ± SD, Table 1), with an average of 12,882 ± 3,389, 11,853 ± 3,433, and 2,129 ± 815 reads per sample (after filtering, mean ± SD), respectively. Four samples from the EAAB were excluded due to an extremely low reads count (wk1 CG, 2x wk 1 PG and wk 5 PG with 942, 590, 859, and 801 reads per sample). Most OTUs could be taxonomically classified to the family level, while their genus or species level affiliation were “uncultured bacterium or archaeon” in many cases (Table 1). One OTU was assigned to an archaeal and 176 OTUs to bacterial taxa.
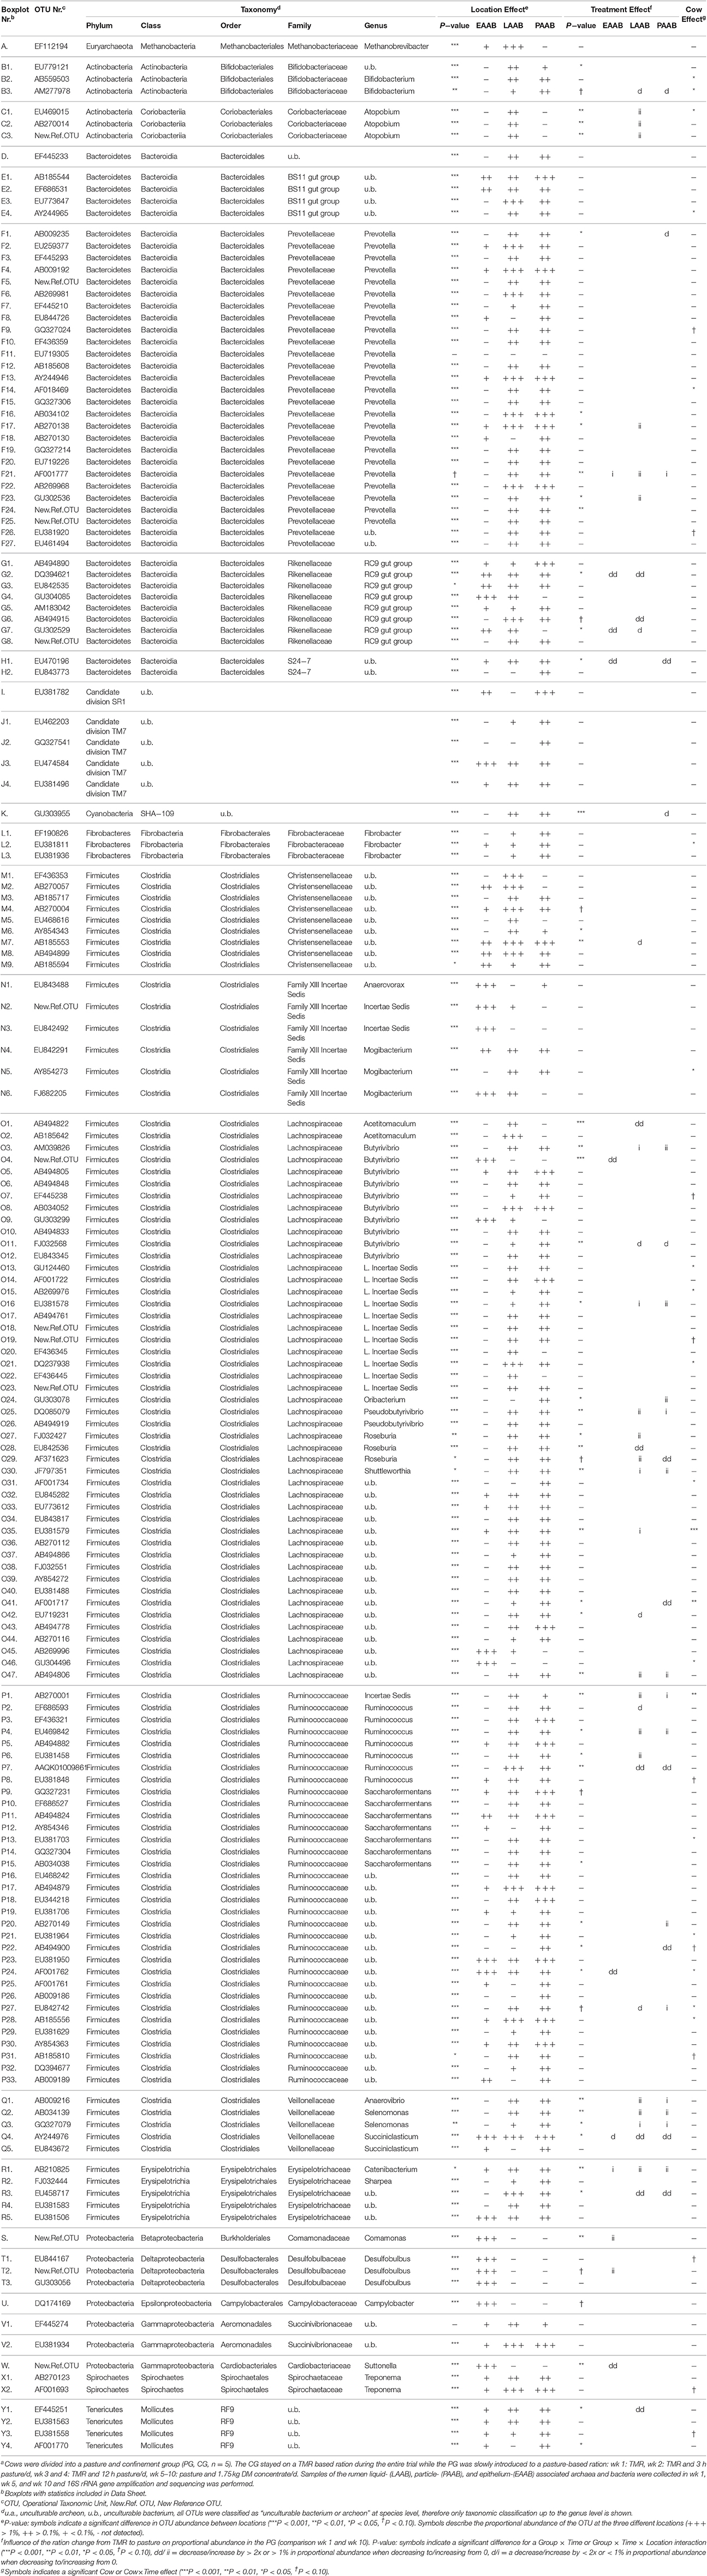
Table 1. Summary of detected OTUs, location and treatment effectsa.
Alpha Diversity
Alpha diversity analysis revealed a lower chao1 and Shannon index as well as lower observed species count in the EAAB compared to the LAAB and PAAB with an average of 73 [30; median (IQR)] compared to 169 (6) and 162 (4) observed species (P < 0.001), a chao1 index of 108 (33) compared to 173 (5) and 168 (7) (P < 0.001), and a Shannon index of 3.0 (0.2) compared to 4.3 (0.2) and 4.6 (0.2) (P < 0.001), respectively (Figure 5). The LAAB further exhibited a higher observed species count (P < 0.001) as well as chao1 index (P = 0.004) compared to the PAAB, whereas the PAAB had a higher Shannon index (P < 0.001). In the PG a significantly lower observed species count in the EAAB compared to the CG was observed (P = 0.035). Further, no significant treatment effects were observed. In two diversity variables (observed species and Shannon index) a significant Cow effect was observed.
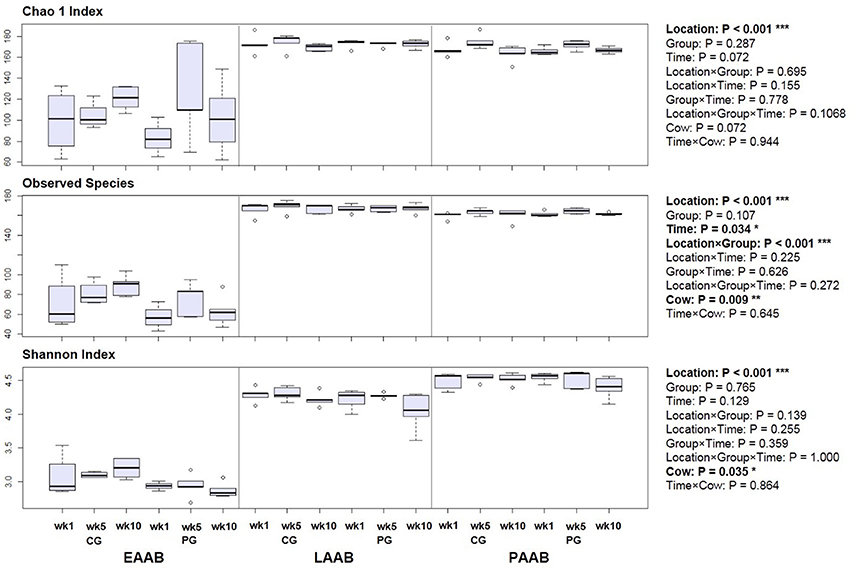
Figure 5. Boxplots of diversity variables of rumen liquid (LAAB), particle (PAAB) and epithelium (EAAB) associated archaea and bacteria in wk 1, wk 5, and wk 10 of the pasture (PG) and confinement (CG, n = 5) group. The CG stayed on a TMR based ration during the entire trial while the PG was slowly introduced to a pasture-based ration: wk 1: TMR, wk 2: TMR and 3 h pasture/d, wk 3 and 4: TMR and 12 h pasture/d, wk 5-10: pasture and 1.75 kg DM concentrate/d.
Beta Diversity
Beta diversity analysis revealed a significant Location (P < 0.001), Group (P < 0.001), Time (P = 0.035) and Cow (P < 0.001) effect, as well as a significant Location × Group (P = 0.011) and Group × Time (P = 0.036) interaction. PCO plots show a clustering of the LAAB, PAAB, and EAAB, with a higher similarity between LAAB and PAAB, compared to the EAAB samples (Figure 6). Taxonomic classification at family level showed broad differences in community composition between the LAAB, PAAB, and EAAB (Figure 7). In the LAAB members of the Prevotellaceae (25%), Lachnospiraceae (18%), Ruminococcaeceae (16%), Christensenellaceae (12%), Veillonellaceae (6%), Rikenellaceae (4%), Erysipelotrichaceae (4%), Coriobacteriaceae (3%), and the uncultured BS11 gut group (Bacteroidales, 2%) contributed to 90% of the relative abundance of 16S rRNA genes. In the PAAB a similar pattern was observed with members of the Ruminococcaceae (28%), Lachnospiraceae (23%), Prevotellaceae (18%), Veillonellaceae (8%), Christensenellaceae (4%), Rikenellaceae (3%), Spirochaetaceae (2%), uncultured BS11 gut group (2%), Erysipelotrichaceae (2%), and Succinivibrionaceae (2%) accounting for 90% of the relative abundance, whereas in the group of the EAAB members of the families Lachnospiraceae (26%), Family XIII Incertae Sedis (Clostridiales, 18%), Desulfobulbaceae (15%), Cardiobacteriaceae (5%), Comamonadaceae (11%), Campylobacteraceae (5%), Ruminococcaceae (5%), and Rikenellaceae (4%) were the dominant community members.
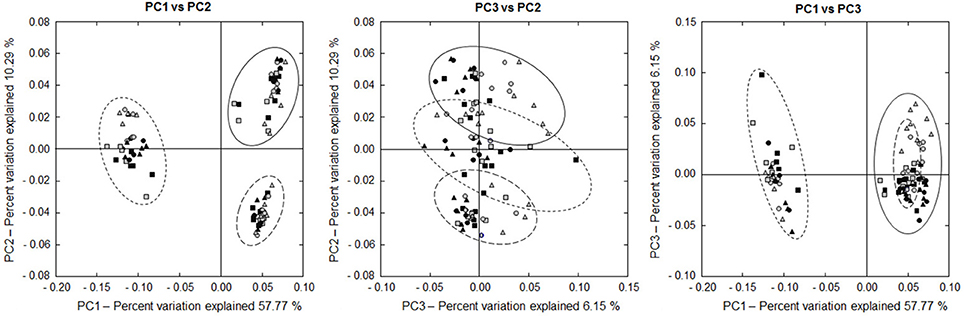
Figure 6. Two dimensional PCO plots of 16S rRNA sequencing results (based on weighted UniFrac distances) of rumen liquid (LAAB, solid line), particle (PAAB, large dashed line), and epithelium (EAAB, small dashed line) associated archaea and bacteria in wk 1 (square), wk 5 (round), and wk 10 (triangle) of the pasture (PG, gray) and confinement (CG, black, n = 5) group. The CG stayed on a TMR based ration during the entire trial while the PG was slowly introduced to a pasture-based ration: wk 1: TMR, wk 2: TMR and 3 h pasture/d, wk 3 and 4: TMR and 12 h pasture/d, wk 5–10: pasture and 1.75 kg DM concentrate/d.
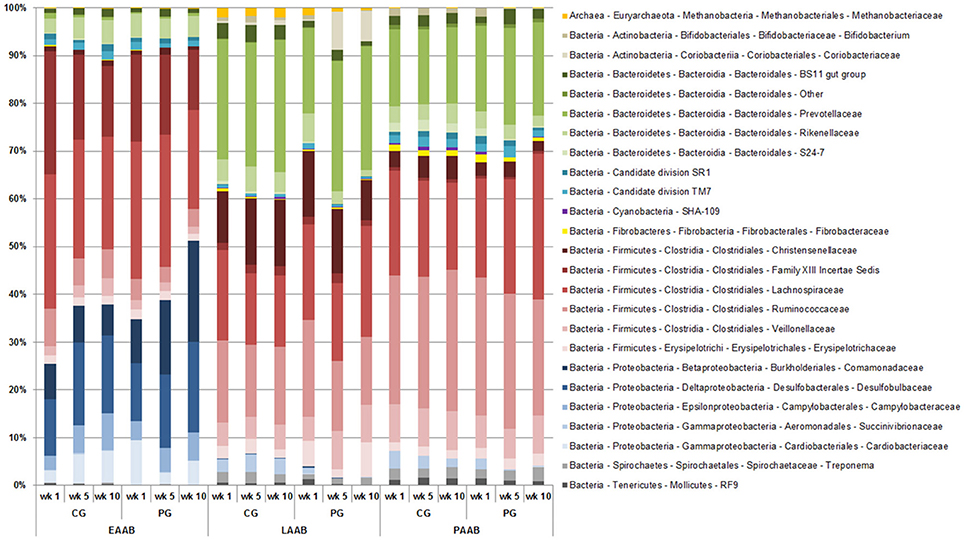
Figure 7. Differences in relative abundances (expressed as percentages) of OTUs derived from 16S rRNA gene sequencing on family level of rumen liquid (LAAB), particle (PAAB), and epithelium (EAAB) associated archaea and bacteria families in wk 1, wk 5, and wk 10 of the pasture (PG) and confinement (CG, n = 5) group. The CG stayed on a TMR based ration during the entire trial while the PG was slowly introduced to a pasture-based ration: wk 1: TMR, wk 2: TMR and 3 h pasture/d, wk 3 and 4: TMR and 12 h pasture/d, wk 5–10: pasture and 1.75 kg DM concentrate/d.
Statistical analysis on OTU level showed a significant location effect (i.e., LAAB, PAAB, and EAAB) for all 177 OTUs, except for two members of Prevotella genus and one member of Succinivibrionaceae family (Table 1 and Data Sheet 1). OTUs within particular families either exhibited a similar distribution pattern (Bifidobacteriaceae, Coriobacteriaceae, Desulfobulbaceae, Succinivibrionaceae, and Spirochaetaceae), a generally similar distribution pattern with few exceptions [Prevotella, Fibrobacteraceae, and members of the order RF9 (Mollicutes)] or a very diverse distribution pattern among the three locations [uncultured BS11 gut group (Bacteroidales), uncultured RC9 gut group (Rikenellaceae), uncultured S24-7 (Bacteroidales), members of the Candidate division TM7 phylum, Christensenellaceae, Family XIII Incertae Sedis (Clostridiales), Lachnospiraceae, Ruminococcaceae, Veillonellaceae, and Erysipelotrichales]. Analysis on OTU level also revealed that the predominant role of the family Lachnospiraceae in the EAAB can be attributed to mainly four OTUs (two of the genus Butyrivibrio and two further unclassified OTUs).
Similar to the location, also for the effect of the ration change from TMR to pasture in the PG variable trends within taxonomic groups were observed (Table 1). In some taxa either a decrease [Bifidobacteriaceae, uncultured RC9 gut group (Rikenellaceae), uncultured S24-7 (Bacteroidales), uncultured SHA-109 (Cyanobacteria), Christensenellaceae, Acetitomaculum (Lachnospiraceae), Succiniclasticum (Veillonellaceae), further unclassified members of the Erysipelotrichaceae, Suttonella (Cardiobacteriaceae), and uncultured RF9 (Mollicutes)], an increase of at least one member species [Atopobium, Incertae Sedis (Lachnospiraceae), Oribacterium, Pseudobutyrivibrio, Shuttleworthia, Incertae Sedis (Ruminococcaceae), Anaerovibrio, Selenomonas, Catenibacterium, Comamonas, and Desulfobulbus], or no alterations [Methanobrevibacter, uncultured BS11 gut group (Bacteroidales), uncultured Candidate division SR1, and TM7, Fibrobacter, uncultured Family XIII Incertae Sedis (Clostridiales), Saccharofermentans, Sharpea, Campylobacter, Succinivibrionaceae, and Treponema] in proportional abundances were observed, whereas others exhibited mixed effects (Prevotellaceae, Butyrivibrio, and Roseburia, Ruminococcus and other further unclassified Ruminococcaceae).
For most OTUs that showed an increase or decrease in proportional abundance over the course of the trial in the PG, a difference between wk 1, wk 5, and wk 10 was observed, mostly exhibiting a gradual increase or decrease over the three points in time (C1-3, F1, F17, F21, F23, G6, K, O1, O3, O16, O24, O25, O27, O28, O30, O35, O41, O42, O47, P1, P2, P4, P7, P20, P22, Q2, Q3, Q4, R1, S, and T2 in Table 1 and Data Sheet 1). A few OTUs, however, exhibited a V-shaped evolution over the course of wk 1, wk 5, and wk 10 (M7, O29, O42, P6, Q1, R3, W, and Y1). And for a few OTUs that differed in abundance between wk 1 and wk 10 in the PG, no alterations between wk 5 and wk 10 were observed (B3, G2, G7, H1, O4, O11, P4, P24, P27, Q1, Q2, Q4, and R3).
In the OTUs where a group effect was observed, the proportional abundance was altered at either all (B3, C1-C3, F21, G7, H1, K, O1, O3, O4, O11, O16, O24, O25, O27, O29, O30, O47, P1, P4, P7, P22, P27, Q1–4, R1, R3, S, T2, and W in Table 1 and Data Sheet 1) or only at a part of the locations (F1, F17, F23, G2, G6, M7, O28, O35, O41, O42, P2, P6, P20, P24, and Y1) where the OTUs exhibited a significant abundance (Table 1).
In case of 28 OTUs a significant or a trend for a Cow or Cow × Time effect was observed. To illustrate the alterations in proportional abundance of each species on cow level, plots including this aspect have been added to the appendix (Data Sheet 2).
Discussion
General Differences between the LAAB, PAAB, and EAAB
-The DNA fingerprinting as well as amplicon sequencing approach revealed distinct differences between the three locations, with a higher similarity between the PAAB and LAAB, compared to the EAAB. This is in line with an earlier study using PCR-DGGE (Sadet et al., 2007) and can be explained by the close spatial relationship and constant interchange between the two communities due to the constant ongoing fiber colonization and degradation. As described in previous publications members of the Prevotellaceae constituted the most dominant family in the LAAB (Kong et al., 2010; Pitta et al., 2010; Singh et al., 2015), whereas in the PAAB a higher abundance of members of taxa were found that are associated with fiber digestion such as Ruminococcaceae and Fibrobacter (Koike and Kobayashi, 2009). This was to be expected, since a key role of the PAAB in the degradation of fiber can be assumed (Kong et al., 2010; McCann et al., 2014a). When analyzing the distribution across the three locations of the individual OTUs, no clear pattern at a higher level than species was observed for most taxa. Some species in a given taxa were detected in all or two communities, whereas others could exclusively be found in one. This finding illustrates that observed effects on phylum, class, order, family, or genus level do not necessarily account for all of its member species, demonstrating that microbes that are phylogenetically close may still exhibit substantially different phenotypes and functions (Morgavi et al., 2013). This discrepancy between taxonomic classification (or genomic commonality) and phenotype has been reported and criticized earlier and can most likely be attributed to differences in gene expression as a result of environmental influences (Achenbach and Coates, 2000; Kampfer and Glaeser, 2012). Weimer (2015) notes that the genetic capability of different degradative functions may reside within a single bacterial strain, but that it is dependent on the presence of potential competitors and symbionts if a particular degradative capability is carried out. Kampfer and Glaeser (2012) therefore suggest revising the polyphasic approach (integration of genotype and phenotype) in prokaryotic taxonomy. Regarding rumen microbiota research, different authors have noted that future studies should focus on the characterization of the functional properties of the rumen microbial ecosystem, aside the different microbial species (Morgavi et al., 2013).
When comparing our results with different studies comparing the LAAB and PAAB, we observed similar as well as different results concerning the abundance of different taxa (Cho et al., 2006; Brulc et al., 2009; Kong et al., 2010; Pei et al., 2010; Pitta et al., 2010; de Menezes et al., 2011; Kim and Yu, 2012; Singh et al., 2015). Further, similar to our results de Menezes et al. (2011) have shown a higher species diversity in the LAAB compared to the PAAB, whereas the results of Kong et al. (2010), Pitta et al. (2010), and Sadet et al. (2007) show the opposite. We suggest that these observed differences among studies can be ascribed to differences in ration composition (Henderson et al., 2015), time the animals received the ration prior to sampling (Hackmann, 2015), number of animals sampled (Weimer, 2015), sample collection (Li et al., 2009), microorganism and DNA isolation (Henderson et al., 2013), microbiota analysis method (DNA fingerprinting vs. amplicon sequencing, Sadet et al., 2007), sequencing platform and depth (Klindworth et al., 2013, also discussed in Schären et al., 2017).
In the EAAB we observed a much less diverse microbiota, with very different species compared to the PAAB and LAAB, which is in line with other studies (Cho et al., 2006; Sadet et al., 2007). Our results are fairly similar to the observations made by Petri et al. (2013) with the Lachnospiraceae, uncultured Family XIII Incertae Sedis (Clostridiales), Ruminococcaceae, Prevotellaceae, Desulfobulbaceae, Erysipelotrichaceae, and Rikenellaceae constituting the core microbiota of the EAAB in their trial. These findings illustrate a mixture of Gram-positive and Gram-negative bacteria, which is in contrast to the findings of older culture- (Wallace et al., 1979) and electron-microscopy-based studies (McCowan et al., 1978; Cheng et al., 1979), describing a mainly Gram-positive community. Earlier studies described the EAAB as being possibly associated with fermentation end-products, VFA absorption, oxygen consumption, urea digestion and initiated breakdown of dead epithelial tissue (Cheng et al., 1979; Wallace et al., 1979; McCann et al., 2014a). The hypothesis of an oxygen scavenging function of the EAAB is supported by the finding that some of the OTUs, that were detected in our trial as being mainly or only present in the EAAB, have been assigned to taxa that were earlier described as being aerobic (Erysipelotrichaceae, Comamonas, and Suttonella) or microaerophilic (Campylobacter) (Garrity et al., 2006; Vos et al., 2009). Further, a part of the OTUs have been assigned to taxa that have been described as being asaccharolytic (Campylobacter and Mogibacterium), nitrate reducing (Comamonas and Campylobacter), complex organic compound degrading (Comamonas), putrescine fermenting (Anaerovorax), and sulfur compounds reducing (Desulfobulbus) (Garrity et al., 2006; Vos et al., 2009). Further research involving cultivation-independent techniques is needed to elucidate the relevance of these functional properties in the rumen and the interrelations between the different microbial species and their host.
Effects of the Ration Change from TMR to Pasture
The DNA fingerprinting as well as the beta-diversity analysis of the amplicon sequencing approach showed that at all three locations the microbiota was significantly influenced by the ration change. However, the hypothesis that the EAAB remain more consistent throughout dietary changes (Sadet et al., 2007; McCann et al., 2014a) was not confirmed. This result is opposite to the findings of Sadet-Bourgeteau et al. (2010) illustrating only minor alterations in the EAAB using a DNA-fingerprinting (PCR-DGGE) method in a trial involving wethers that were consecutively fed forage and different mixed concentrate forage diets. The authors however admitted that this method may not be sensitive enough to detect subtler changes in the community (the PCR-DGGE technique has an relative abundance limit of 1%, it is therefore likely that alterations in less abundant taxa are underestimated Sadet et al., 2007). Contrary to this study, applying a more severe dietary influence, Petri et al. (2013) observed significant alterations in various taxa of the EAAB in a trial involving the transition from a forage to a high grain diet, an acidosis-challenge, and a recovery period, which is in line with our results. Additionally, an earlier study by McCowan et al. (1980) has shown that the distribution pattern of the epithelium adherent bacterial population is diet dependent. This aspect should be included in future studies.
Both analysis techniques (DNA fingerprinting and amplicon sequencing) showed that even though the animals in the PG were already on a full-grazing ration for 4–6 days in wk 5, the microbiota at all three locations was significantly different from that in wk 10. During this trial we also analyzed the ruminal protozoal counts on a weekly basis and observed a gradual increase in holotrich protozoa concentrations from wk 5 on Künzel et al. (2016). After wk 7 a plateau was observed, suggesting also an adaptation in this period. These findings further agree with the observations made on animal level. We observed alterations in different production, metabolic and rumen variables, all pointing toward a decreased rumen fermentation activity in the first weeks on a full-grazing ration due to a decreased DMI. Thereafter, most likely due to a behavioral and metabolic adaptation, DMI and rumen fermentation activity increased again, causing a decrease in energy deficit and stabilization of various variables in wk 8–10 of the trial (Schären et al., 2016a,b). Taken together this data illustrates that the adaption of the cow's rumen microbiota and metabolism to a pasture-based ration most likely required 2–3 weeks in our trial. This is in line with a study of Nakano et al. (2013) showing a stabilization of the rumen microbiota of steers 28 days after being switched onto a full-grazing ration. However, in future trials weekly or even daily sampling should be involved to monitor microbial changes in the rumen upon a ration change more closely and to investigate the delay with which metabolic and production variables follow alterations in the rumen microbiota.
Similar to de Menezes et al. (2011) and Nakano et al. (2013) we observed an increase in most OTUs assigned to Prevotella when cows were transitioned to a pasture-based ration. It has been suggested that members of Prevotella grow rapidly whenever readily fermentable carbohydrates are available (Tajima et al., 2001; Bekele et al., 2010; Pitta et al., 2010). Since fresh grass contains high amounts of water-soluble carbohydrates this could explain their increase in relative abundance. Further, de Menezes et al. (2011) hypothesized whether the increased propionate production on the pasture-based diet was related to the increased abundance of Prevotellaceae and Veillonellaceae. Also in our trial we observed a lower acetate proportion in wk 9 and 10 as well as lower acetate/propionate ratio in wk 9 in the PG (Schären et al., 2016b), along with an increase of these two taxa, supporting this hypothesis. However, we did not observe several alterations described by these other two studies, such as a higher relative abundance of the Fibrobacteraceae on a TMR-based ration, an increase in the abundance of the Erysipelotrichaceae in the LAAB and the Lachnospiraceae in the PAAB, no alterations in the rumen protozoal community (de Menezes et al., 2011) or an increase in OTUs assigned to the Butyrivibrio species (Nakano et al., 2013). Similar to the location effect we suggest that the differences between studies can be attributed to the different rations fed and the time the animals received the rations prior to sampling (14 and 28 d in study of de Menezes et al., 2011 and Nakano et al., 2013) as well as methodological aspects. Further, most studies so far summarized the effects on a higher taxonomic level than the species, possibly mingling effects in some cases. Our results have shown that the location as well as treatment effect can either be very similar throughout member species of a taxa, or exhibit opposite trends. This is in line with a study of Bekele et al. (2010) suggesting the existence of diet-specific members of Prevotella. Future studies should include this aspect by further characterizing the different member species and differentiating functional and taxonomic interrelations.
In the current study a filtering step was applied, in which all OTUs with a relative abundance of <0.1% were excluded. This was done to guarantee a solid differentiation between artifact and true organism. This however also implies that alterations in low abundant species (members of the so called “rare biosphere”) were not captured. It is generally acknowledged that the more dominant species most likely contribute to the key functions in rumen fermentation (Henderson et al., 2015). However, only little is known on the function and relevance of the low abundance members and future studies should involve their identification and functional characterization (Morgavi et al., 2013). Further, due to the different physical properties of the samples three different DNA extraction methods were used Henderson et al. (2013) have shown that depending on the method applied, the abundance of different taxa varies. The authors for example describe an increase in the abundance of the Bacteroidetes phylum and a concurrent decrease in the Firmicutes phylum, when a non-mechanical lysis procedure is used. It was suggested that this can be attributed to their cell wall constitution (Gram-negative vs. Gram-positive). In our data, however, no apparent divergence toward the phylum Bacteroidetes was observed in the samples treated with a non-mechanical procedure (PAAB and EAAB samples). Henderson et al. (2013) also describe an increase in the Fibrobacteres in non-mechanical DNA extraction methods. In our study, we observed a higher abundance of Fibrobacteres in the PAAB, compared to the LAAB, indicating a possible influence of the DNA extraction method in this context. However, as described above, these findings are also in line with the literature, describing the Fibrobacteres as fiber digesting bacteria. We therefore conclude that the possibility of a certain bias due to the different DNA extraction methods applied cannot fully be excluded, and that future studies should involve more uniform DNA extraction methods whenever possible, but its implications might be neglectable in this case. Further, the main focus of this manuscripts lies on the alterations in the three different communities over time. Since the comparisons are performed within sample types, these results are not affected by the different DNA extraction protocols.
The Effect of the Individual Cow
Different studies have shown that the cow itself as an individual has a significant influence on its rumen microbiota, most likely through behavioral and physiological processes, such as rumination, salivation, absorption, and passage of VFA in the rumen, thereby controlling the ruminal chemistry (Sadet-Bourgeteau et al., 2010; de Menezes et al., 2011; Petri et al., 2013; Weimer, 2015). Several of these effects were also confirmed in our trial. The alterations over time in the PG compared to the CG would only emerge properly in the SSCP gels, when samples were compared to their own reference sample collected in wk 1 from the same cow. In the alpha-diversity analysis of the amplicon sequencing data, a significant Cow effect was observed, illustrating that certain cows seem to possess a more diverse rumen microbiota than others. Further, the beta-diversity analysis revealed a significant Cow or Cow × Time effect in 16% of OTUs. Several recent studies illustrate that the rumen microbiota of dairy cows and steers can be linked to different phenotypic characteristics such as milk production and composition (Jami et al., 2014; Lima et al., 2015), feed efficiency (Guan et al., 2008; Zhou et al., 2009, 2010; Hernandez-Sanabria et al., 2010, 2012; Carberry et al., 2012; Rius et al., 2012; McCann et al., 2014b; Myer et al., 2015), and breed (Guan et al., 2008). These and our results suggest that acquired animal behavior through environmental conditions as well as genetics may play a role in the rumen microbiota composition (Henderson et al., 2015).
The significant Cow effect, as well as the finding that a large part of the detected OTUs at all three locations remained unaltered in their abundance upon the ration change, are in line with the generally acknowledged assumption that the rumen microbiota consists of a core and a variable microbiota, but that individual taxa abundances may vary greatly across diets and animals (Jami and Mizrahi, 2012; Wu et al., 2012; Henderson et al., 2015).
In summary, our data illustrated that the LAAB, PAAB, and EAAB are three distinct prokaryote communities, differing in species diversity and composition. The LAAB and PAAB exhibit a higher species diversity and similarity, compared to the EAAB. Where the latter can most likely be attributed to the constant interchange between the two communities due to the ongoing fiber colonization and degradation. Many bacteria species found in the EAAB have earlier been described as possessing functional properties in culture, of which their relevance in rumen fermentation and metabolism is yet to be elucidated. The ration change from TMR to pasture influenced the microbial composition in all three locations significantly, contrary to the earlier stated hypothesis that the EAAB remain more consistent throughout dietary changes. Our data further illustrates that the time for adaptation from TMR to pasture most likely requires several days to weeks. However, future studies should include more frequent sampling. Further, the hypothesis that the rumen microbiota consists of a core and a variable microbiota, exhibiting a strong host influence was confirmed, but future studies should include the description of rare prokaryote species as well. For the effect of location as well as the ration change either very similar or opposite trends among member species of common taxa were observed. This finding highlights the importance of functional aside genomic characterization, and supports earlier studies suggesting that the genotype as well as phenotype should be included in taxonomic classification (polyphasic approach).
Author Contributions
Project acquisition, UM, SD, GB; Trial and project design, MS, UM, SD, GB; Trial implementation and sample collection, MS; Sample Analysis (DNA extraction, PCR-SSCP Analysis), MS, KK, SR; Data Analysis (Statistics and Graphics), MS, MG, SR; Data Interpretation, MS, SR, MG, JH, TU, GB, UM, SD; Writing of manuscript, MS; Revision of manuscript, MS, KK, SR, MG, UM, JH, TU, GB, SD.
Conflict of Interest Statement
The authors declare that the research was conducted in the absence of any commercial or financial relationships that could be construed as a potential conflict of interest.
Acknowledgments
The study was supported by the Ministry for Science and Culture of Lower Saxony (MWK) within the collaborative research project SAM, Analysis of Dairy Production: Grazing versus Indoor Housing of Dairy Cows, Support Code: ZN 2864. The authors want to thank the coworkers at the Institute and the experimental station of the Institute of Animal Nutrition, Friedrich-Loeffler-Institute (FLI, Brunswick, Germany) for caring for the experimental animals, assisting with experimental measurements as well as performing the analyses. Special thanks go to the members of the laboratory staff of the Department of Physiology (University of Veterinary Medicine Hannover, Germany) for their support while performing the microbiota analyses. The support and guidance of Kasper Dieho and Jan Dijkstra during the establishment of the protocol for rumen papillae biopsy collection is greatly acknowledged. Many thanks go to Inga Ruddat and Martin Beyerbach (Institute for Biometrics, University of Veterinary Medicine, Hannover, Germany) for excellent bioinformatical support. The authors also want to thank Christian Hundsrucker and Pascal Weigold from Microsynth AG, as well as Andres Buser for their outstanding consultancy.
Supplementary Material
The Supplementary Material for this article can be found online at: http://journal.frontiersin.org/article/10.3389/fmicb.2017.00744/full#supplementary-material
The sequencing data has been submitted at the European Nucleotide Archive (ENA) under the following accession number: PRJEB19414 and can be accessed using following link: http://www.ebi.ac.uk/ena/data/view/PRJEB19414
Abbreviations
TMR, total mixed ration, VFA, volatile fatty acid, PG, pasture group, CG, confinement group, LAB, liquid associated bacteria, PAB, particle associated bacteria, EAB, epithelium associated bacteria, LAAB, liquid associated archaea and bacteria, PAAB, particle associated archaea and bacteria, EAAB, epithelium associated archaea and bacteria.
References
Achenbach, L. A., and Coates, J. D. (2000). Disparity between bacterial phylogeny and physiology - comparing 16S rRNA sequences to assess relationships can be a powerful tool, but its limitations need to be considered. ASM News 66, 714–715. Available online at: https://www.asm.org/index.php/component/content/article/114-unknown/unknown/3623-forum-disparity-between-bacterial-phylogeny-and-physiology?highlight=YToxOntpOjA7czo5OiJhY2hlbmJhY2giO30=
Bekele, A. Z., Koike, S., and Kobayashi, Y. (2010). Genetic diversity and diet specificity of ruminal Prevotella revealed by 16S rRNA gene-based analysis. FEMS Microbiol. Lett. 305, 49–57. doi: 10.1111/j.1574-6968.2010.01911.x
Brulc, J. M., Antonopoulos, D. A., Miller, M. E. B., Wilson, M. K., Yannarell, A. C., Dinsdale, E. A., et al. (2009). Gene-centric metagenomics of the fiber-adherent bovine rumen microbiome reveals forage specific glycoside hydrolases. Proc. Natl. Acad. Sci. U.S.A. 106, 1948–1953. doi: 10.1073/pnas.0806191105
Caporaso, J. G., Kuczynski, J., Stombaugh, J., Bittinger, K., Bushman, F. D., Costello, E. K., et al. (2010). QIIME allows analysis of high-throughput community sequencing data. Nat. Methods 7, 335–336. doi: 10.1038/nmeth.f.303
Carberry, C. A., Kenny, D. A., Han, S., McCabe, M. S., and Waters, S. M. (2012). Effect of phenotypic residual feed intake and dietary forage content on the rumen microbial community of beef cattle. Appl. Environ. Microbiol. 78, 4949–4958. doi: 10.1128/AEM.07759-11
Cheng, K. J., McCowan, R. P., and Costerton, J. W. (1979). Adherent epithelial bacteria in ruminants and their roles in digestive-tract function. Am. J. Clin. Nutr. 32, 139–148.
Cho, S. J., Cho, K. M., Shin, E. C., Lim, W. J., Hong, S. Y., Choi, B. R., et al. (2006). 16S rDNA analysis of bacterial diversity in three fractions of cow rumen. J. Microb. Biotechn. 16, 92–101. Available online at: http://www.koreascience.or.kr/article/ArticleFullRecord.jsp?cn=E1MBA4_2006_v16n1_92
de Menezes, A. B., Lewis, E., O'Donovan, M., O'Neill, B. F., Clipson, N., and Doyle, E. M. (2011). Microbiome analysis of dairy cows fed pasture or total mixed ration diets. FEMS Microbiol. Ecol. 78, 256–265. doi: 10.1111/j.1574-6941.2011.01151.x
Dohrmann, A. B., Tebbe, C. C., Kowalchuk, G. A., de Bruijn, F. J., Head, I. M., Akkermans, A. D. L., et al. (2004). “Microbial community analysis by PCR-single-strand conformation polymorphism (PCR-SSCP),” in Molecular Microbial Ecology Manual, Vol. 1, 2nd Edn, eds G. A. Kowalchuk, F. J. de Bruijn, I. M. Head, A. D. L. Akkermans, and J. D. Van Elsas (Dordrecht: Kluwer Academic Publisher), 809–838.
Edgar, R. C. (2010). Search and clustering orders of magnitude faster than BLAST. Bioinformatics 26, 2460–2461. doi: 10.1093/bioinformatics/btq461
Edgar, R. C., Haas, B. J., Clemente, J. C., Quince, C., and Knight, R. (2011). UCHIME improves sensitivity and speed of chimera detection. Bioinformatics 27, 2194–2200. doi: 10.1093/bioinformatics/btr381
Garrity, G., Staley, J. T., Boone, D. R., De Vos, P., Goodfellow, M., Rainey, F. A., et al. (2006). Bergey's Manual of Systematic Bacteriology: Vol. 2, The Proteobacteria. New York, NY: Springer Science & Business Media.
Guan, L. L., Nkrumah, J. D., Basarab, J. A., and Moore, S. S. (2008). Linkage of microbial ecology to phenotype: correlation of rumen microbial ecology to cattle's feed efficiency. FEMS Microbiol. Lett. 288, 85–91. doi: 10.1111/j.1574-6968.2008.01343.x
Hackmann, T. (2015). Time required for adaptation of rumen fermentation and the rumen microbiome. Meeting Abstracts ADSA-ASAS Joint Annual Meeting. J. Dairy Sci. 98(Suppl. 2), 312.
Henderson, G., Cox, F., Ganesh, S., Jonker, A., Young, W., Collaborators, G. R. C., et al. (2015). Rumen microbial community composition varies with diet and host, but a core microbiome is found across a wide geographical range. Sci. Rep. 5:14567. doi: 10.1038/srep14567
Henderson, G., Cox, F., Kittelmann, S., Miri, V. H., Zethof, M., Noel, S. J., et al. (2013). Effect of DNA extraction methods and sampling techniques on the apparent structure of cow and sheep rumen microbial communities. PLoS ONE 8:e74787. doi: 10.1371/journal.pone.0074787
Hernandez-Sanabria, E., Goonewardene, L. A., Li, M., Mujibi, D. F., Stothard, P., Moore, S. S., et al. (2010). Correlation of particular bacterial PCR-denaturing gradient gel electrophoresis patterns with bovine ruminal fermentation parameters and feed efficiency traits. Appl. Environ. Microbiol. 76, 6338–6350. doi: 10.1128/AEM.01052-10
Hernandez-Sanabria, E., Goonewardene, L. A., Wang, Z., Durunna, O. N., and Moore, S. S. (2012). Impact of feed efficiency and diet on adaptive variations in the bacterial community in the rumen fluid of cattle. Appl. Environ. Microbiol. 78, 1203–1214. doi: 10.1128/AEM.05114-11
Jami, E., and Mizrahi, I. (2012). Similarity of the ruminal bacteria across individual lactating cows. Anaerobe 18, 338–343. doi: 10.1016/j.anaerobe.2012.04.003
Jami, E., White, B. A., and Mizrahi, I. (2014). Potential role of the bovine rumen microbiome in modulating milk composition and feed efficiency. PLoS ONE 9:e85423. doi: 10.1371/journal.pone.0085423
Kampfer, P., and Glaeser, S. P. (2012). Prokaryotic taxonomy in the sequencing era - the polyphasic approach revisited. Environ. Microbiol. 14, 291–317. doi: 10.1111/j.1462-2920.2011.02615.x
Kim, M., and Yu, Z. T. (2012). Quantitative comparisons of select cultured and uncultured microbial populations in the rumen of cattle fed different diets. J. Anim. Sci. Biotechnol. 3:28. doi: 10.1186/2049-1891-3-28
Klindworth, A., Pruesse, E., Schweer, T., Peplies, J., Quast, C., Horn, M., et al. (2013). Evaluation of general 16S ribosomal RNA gene PCR primers for classical and next-generation sequencing-based diversity studies. Nucleic Acids Res. 41:e1. doi: 10.1093/nar/gks808
Koike, S., and Kobayashi, Y. (2009). Fibrolytic rumen bacteria: their ecology and functions. Asian-Austral. J. Anim. Sci. 22, 131–138. doi: 10.5713/ajas.2009.r.01
Kolver, E. S. (2003). Nutritional limitations to increased production on pasture-based systems. Proc. Nutr. Soc. 62, 291–300. doi: 10.1079/PNS2002200
Kong, Y., Teather, R., and Forster, R. (2010). Composition, spatial distribution, and diversity of the bacterial communities in the rumen of cows fed different forages. FEMS Microbiol. Ecol. 74, 612–622. doi: 10.1111/j.1574-6941.2010.00977.x
Künzel, S., Schären, M., Meyer, U., von Soosten, D., Dänicke, S., Steingass, H., et al. (2016). Rumen protozoal numbers in dairy cows fed total mixed ration or grazing. Proc. Soc. Nutr. Phys. 25, 99.
Li, M., Penner, G. B., Hernandez-Sanabria, E., Oba, M., and Guan, L. L. (2009). Effects of sampling location and time, and host animal on assessment of bacterial diversity and fermentation parameters in the bovine rumen. J. Appl. Microbiol. 107, 1924–1934. doi: 10.1111/j.1365-2672.2009.04376.x
Lima, F. S., Oikonomou, G., Lima, S. F., Bicalho, M. L. K., Ganda, E. K., de Oliveira Filho, J. C., et al. (2015). Prepartum and postpartum rumen fluid microbiomes: characterization and correlation with production traits in dairy cows. Appl. Environ. Microb. 81, 1327–1337. doi: 10.1128/AEM.03138-14
Magoč, T., and Salzberg, S. L. (2011). FLASH: fast length adjustment of short reads to improve genome assemblies. Bioinformatics 27, 2957–2963. doi: 10.1093/bioinformatics/btr507
Martin, M. (2011). Cutadapt removes adapter sequences from high-throughput sequencing reads. EMBnet. J. 17, 10–12. doi: 10.14806/ej.17.1.200
McCann, J. C., Wickersham, T. A., and Loor, J. J. (2014a). High-throughput methods redefine the rumen microbiome and its relationship with nutrition and metabolism. Bioinform. Biol. Insights 8, 109–125. doi: 10.4137/BBI.S15389
McCann, J. C., Wiley, L. M., Forbes, T. D., Rouquette, F. M. Jr., and Tedeschi, L. O. (2014b). Relationship between the rumen microbiome and residual feed intake-efficiency of Brahman bulls stocked on bermudagrass pastures. PLoS ONE 9:e91864. doi: 10.1371/journal.pone.0091864
McCowan, R. P., Cheng, K. J., Bailey, C. B. M., and Costerton, J. W. (1978). Adhesion of bacteria to epithelial-cell surfaces within reticulo-rumen of cattle. Appl. Environ. Microb. 35, 149–155.
McCowan, R. P., Cheng, K. J., and Costerton, J. W. (1980). Adherent bacterial-populations on the bovine rumen wall - distribution patterns of adherent bacteria. Appl. Environ. Microb. 39, 233–241.
Meibaum, B., Riede, S., Schröder, B., Manderscheid, R., Weigel, H., and Breves, G. (2012). Elevated CO2 and drought stress effects on the chemical composition of maize plants, their ruminal fermentation and microbial diversity in vitro. Arch. Anim. Nutr. 66, 473–489. doi: 10.1080/1745039X.2012.735080
Morgavi, D. P., Kelly, W. J., Janssen, P. H., and Attwood, G. T. (2013). Rumen microbial (meta) genomics and its application to ruminant production. Animal 7, 184–201. doi: 10.1017/S1751731112000419
Myer, P. R., Smith, T. P., Wells, J. E., Kuehn, L. A., and Freetly, H. C. (2015). Rumen microbiome from steers differing in feed efficiency. PLoS ONE 10:e0129174. doi: 10.1371/journal.pone.0129174
Nakano, M., S. H., Tohno, M., Matoba, K., Uegaki, R., and Ishizaki, H. (2013). “Variation of rumen bacterial diversity in steers after the beginning of grazing,” in 22nd International Grassland Congress, (Orange, NSW: New South Wales Department of Primary Industry), 591–592.
Oksanen, J., Blanchet, F. G., Kindt, R., Legendre, P., Minchin, P. R., O'Hara, R. B., et al. (2015). vegan: Community Ecology Package. R package version 2.2-1. Available online at: http://CRAN.R-project.org/package=vegan
Osuji, P. O. (1974). Physiology of eating and energy expenditure of ruminant at pasture. J. Range Manage. 27, 437–443. doi: 10.2307/3896717
Pei, C. X., Mao, S. Y., Cheng, Y. F., and Zhu, W. Y. (2010). Diversity, abundance and novel 16S rRNA gene sequences of methanogens in rumen liquid, solid and epithelium fractions of Jinnan cattle. Animal 4, 20–29. doi: 10.1017/S1751731109990681
Petri, R. M., Schwaiger, T., Penner, G. B., Beauchemin, K. A., Forster, R. J., McKinnon, J. J., et al. (2013). Changes in the rumen epimural bacterial diversity of beef cattle as affected by diet and induced ruminal acidosis. Appl. Environ. Microbiol. 79, 3744–3755. doi: 10.1128/AEM.03983-12
Pitta, D. W., Pinchak, E., Dowd, S. E., Osterstock, J., Gontcharova, V., Youn, E., et al. (2010). Rumen bacterial diversity dynamics associated with changing from bermudagrass hay to grazed winter wheat diets. Microb. Ecol. 59, 511–522. doi: 10.1007/s00248-009-9609-6
Quast, C., Pruesse, E., Yilmaz, P., Gerken, J., Schweer, T., Yarza, P., et al. (2013). The SILVA ribosomal RNA gene database project: improved data processing and web-based tools. Nucleic Acids Res. 41, D590–D596. doi: 10.1093/nar/gks1219
R-Core-Team (2013). R: A language and Environment for Statistical Computing. Vienna: R Foundation for Statistical Computing.
Rius, A. G., Kittelmann, S., Macdonald, K. A., Waghorn, G. C., Janssen, P. H., and Sikkema, E. (2012). Nitrogen metabolism and rumen microbial enumeration in lactating cows with divergent residual feed intake fed high-digestibility pasture. J. Dairy Sci. 95, 5024–5034. doi: 10.3168/jds.2012-5392
Russell, J. B., and Rychlik, J. L. (2001). Factors that alter rumen microbial ecology. Science 292, 1119–1122. doi: 10.1126/science.1058830
Sadet, S., Martin, C., Meunier, B., and Morgavi, D. P. (2007). PCR-DGGE analysis reveals a distinct diversity in the bacterial population attached to the rumen epithelium. Animal 1, 939–944. doi: 10.1017/S1751731107000304
Sadet-Bourgeteau, S., Martin, C., and Morgavi, D. P. (2010). Bacterial diversity dynamics in rumen epithelium of wethers fed forage and mixed concentrate forage diets. Vet. Microbiol. 146, 98–104. doi: 10.1016/j.vetmic.2010.04.029
Schären, M., Drong, C., Kiri, K., Riede, S., Gardener, M., Meyer, U., et al. (2017). Differential effects of monensin and a blend of essential oils on rumen microbiota composition of transition dairy cows. J. Dairy Sci. 100, 2765–2783. doi: 10.3168/jds.2016-11994
Schären, M., Jostmeier, S., Ruesink, S., Hüther, L., Frahm, J., Bulang, M., et al. (2016a). The effects of a ration change from a total mixed ration to pasture on health and production of dairy cows. J. Dairy Sci. 99, 1183–1200. doi: 10.3168/jds.2015-9873
Schären, M., Seyfang, G. M., Steingass, H., Dieho, K., Dijkstra, J., Hüther, L., et al. (2016b). The effects of a ration change from a total mixed ration to pasture on rumen fermentation, volatile fatty acid absorption characteristics, and morphology of dairy cows. J. Dairy Sci. 99, 3549–3565. doi: 10.3168/jds.2015-10450
Singh, K. M., Jisha, T. K., Reddy, B., Parmar, N., Patel, A., Patel, A. K., et al. (2015). Microbial profiles of liquid and solid fraction associated biomaterial in buffalo rumen fed green and dry roughage diets by tagged 16S rRNA gene pyrosequencing. Mol. Biol. Rep. 42, 95–103. doi: 10.1007/s11033-014-3746-9
Tajima, K., Aminov, R. I., Nagamine, T., Matsui, H., Nakamura, M., and Benno, Y. (2001). Diet-dependent shifts in the bacterial population of the rumen revealed with real-time PCR. Appl. Environ. Microbiol. 67, 2766–2774. doi: 10.1128/AEM.67.6.2766-2774.2001
Vos, P., Garrity, G., Jones, D., Krieg, N. R., Ludwig, W., Rainey, F. A., et al. (2009). Bergey's Manual of Systematic Bacteriology: Vol. 3, The Firmicutes. New York, NY: Springer Science & Business Media.
Wallace, R. J., Cheng, K. J., Dinsdale, D., and Øskov, E. R. (1979). An independent microbial flora of the epithelium and its role in the ecomicrobiology of the rumen. Nature 279, 424–426. doi: 10.1038/279424a0
Weimer, P. J. (2015). Redundancy, resilience, and host specificity of the ruminal microbiota: implications for engineering improved ruminal fermentations. Front. Microbiol. 6:296. doi: 10.3389/fmicb.2015.00296
Wheeler, B. (2010). lmPerm: Permutation Tests for Linear Models. R package version 1.1-2. Available online at: http://CRAN.R-project.org/package=lmPerm
Wu, S., Wang, G., Angert, E. R., Wang, W., Li, W., and Zou, H. (2012). Composition, diversity, and origin of the bacterial community in grass carp intestine. PLoS ONE 7:e30440. doi: 10.1371/journal.pone.0030440
Zanton, I. (2015). Time required for adaptation of protein metabolism. Meeting Abstracts ADSA-ASAS Joint Annual Meeting. J. Dairy Sci. Vol. 98(Suppl. 2):312.
Zhou, M., Hernandez-Sanabria, E., and Guan, L. L. (2009). Assessment of the microbial ecology of ruminal methanogens in cattle with different feed efficiencies. Appl. Environ. Microbiol. 75, 6524–6533. doi: 10.1128/AEM.02815-08
Zhou, M., Hernandez-Sanabria, E., and Guan, L. L. (2010). Characterization of variation in rumen methanogenic communities under different dietary and host feed efficiency conditions, as determined by PCR-denaturing gradient gel electrophoresis analysis. Appl. Environ. Microbiol. 76, 3776–3786. doi: 10.1128/AEM.00010-10
Keywords: dairy cow nutrition, rumen microbiota, pasture, ration change, PCR-SSCP, amplicon sequencing
Citation: Schären M, Kiri K, Riede S, Gardener M, Meyer U, Hummel J, Urich T, Breves G and Dänicke S (2017) Alterations in the Rumen Liquid-, Particle- and Epithelium-Associated Microbiota of Dairy Cows during the Transition from a Silage- and Concentrate-Based Ration to Pasture in Spring. Front. Microbiol. 8:744. doi: 10.3389/fmicb.2017.00744
Received: 02 December 2016; Accepted: 10 April 2017;
Published: 02 May 2017.
Edited by:
Antonio Faciola, University of Nevada, USAReviewed by:
Elie Jami, Institute of Clinical Molecular Biology (IKMB), GermanyAmélia Camarinha-Silva, University of Hohenheim, Germany
Copyright © 2017 Schären, Kiri, Riede, Gardener, Meyer, Hummel, Urich, Breves and Dänicke. This is an open-access article distributed under the terms of the Creative Commons Attribution License (CC BY). The use, distribution or reproduction in other forums is permitted, provided the original author(s) or licensor are credited and that the original publication in this journal is cited, in accordance with accepted academic practice. No use, distribution or reproduction is permitted which does not comply with these terms.
*Correspondence: Ulrich Meyer, dWxyaWNoLm1leWVyQGZsaS5kZQ==