- 1School of Food Science and Engineering, Hefei University of Technology, Hefei, China
- 2Key Laboratory for Agricultural Products Processing of Anhui Province, Hefei University of Technology, Hefei, China
- 3School of Chemical Engineering and Life Sciences, Chaohu University, Hefei, China
Pyrroquinoline quinone-dependent alcohol dehydrogenase (PQQ-ADH) is a key enzyme in the ethanol oxidase respiratory chain of acetic acid bacteria (AAB). To investigate the effect of PQQ-ADH on acetic acid production by Acetobacter pasteurianus JST-S, subunits I (adhA) and II (adhB) of PQQ-ADH were over-expressed, the fermentation parameters and the metabolic flux analysis were compared in the engineered strain and the original one. The acetic acid production was improved by the engineered strain (61.42 g L−1) while the residual ethanol content (4.18 g L−1) was decreased. Analysis of 2D maps indicated that 19 proteins were differently expressed between the two strains; of these, 17 were identified and analyzed by mass spectrometry and two-dimensional gel electrophoresis. With further investigation of metabolic flux analysis (MFA) of the pathway from ethanol and glucose, the results reveal that over-expression of PQQ-ADH is an effective way to improve the ethanol oxidation respiratory chain pathway and these can offer theoretical references for potential mechanism of metabolic regulation in AAB and researches with its acetic acid resistance.
Introduction
Acetic acid bacteria (AAB) are employed in the industrial production of acetic acid. Their characteristics directly affect the yield and flavor of vinegar (Quintero et al., 2009). The fermentative oxidation of ethanol to acetic acid has been shown to depend on two sequential reactions of membrane-bound pyrrpquinoline quinone-dependent alcohol dehydrogenase (PQQ-ADH) and aldehyde dehydrogenase (ALDH), both of which are localized on the periplasmic side of the inner membrane (Toyama et al., 2004; Yakushi and Matsushita, 2010; Trček and Matsushita, 2013). PQQ-ADH complex in Acetobacter pasteurianus consist in three subunits, a dehydrogenase subunit (subunit I), a cytochrome c subunit (subunit II), the smallest one (subunit III). The subunit I encoded by adhA contains pyrrpquinoline quinone and one heme c; the subunit II encoded by adhB contains three heme c and relates to membrane-binding and ubiquinone reduction; the smallest subunit is encoded adhS, far from the operon coding for adhA and adhB, seems not to be necessary for ethanol oxidation (Kondo et al., 1995; Toyama et al., 2004). Loss of membrane-bound ADH activity resulted in reduced acetic acid resistance (Chinnawirotpisan et al., 2003). Trček et al. (2006) showed that growth characteristics, acid-producing rate, and acetic acid resistance of different strains were closely linked to PQQ-ADH. PQQ-ADH is a unique member of the alcohol dehydrogenase family and is essential for AAB oxidation of ethanol into acetic acid (Chen et al., 2016).
Previous studies of membrane-dependent ethanol oxidation, together with two-dimensional polyacrylamide gel electrophoresis (2D-PAGE) and mass spectrometry, have promoted the use of proteomic analysis to study acetic acid resistance by AAB (Trček et al., 2015; Wang et al., 2015). Proteomic analysis of Acetobacter aceti and Gluconobacter oxydans revealed that eight proteins were up-regulated under acetic acid stress conditions (Lasko et al., 1997). Additionally, at least 50 types of proteins were found to change significantly in response to acetic acid stress in a comprehensive protein expression analysis (Steiner and Sauer, 2001). In A. aceti, two proteins were seen to be significantly up-regulated by 2D-PAGE, one was aconitase and the other was a putative ABC transporter. Further investigations revealed that over-expression or absence of the genes encoding for these two proteins had an important influence on A. aceti acid resistance (Nakano and Fukaya, 2008). Fifty three relevant proteins were identified using 2D-PAGE for comparing the proteome of A. pasteurianus LMG1262T during acetic fermentation, growing A. pasteurianus in ethanol containing broth (Andrés-Barrao et al., 2012). These studies demonstrated the effectiveness of using 2D-PAGE to study the membrane-dependent pathway associated with acetic acid production.
The metabolism of acetic acid in A. pasteurianus mainly includes the Embden-Meyerhof-Parnas (EMP) pathway, pentose phosphate pathway (PPP), pyruvate metabolism pathway, ethanol oxidation respiratory chain pathway, and tricarboxylic acid cycle pathway (TCA) (Illeghems et al., 2013; Wang et al., 2015). The establishment of effective metabolic pathways is the basis of quantitative analysis of metabolic logistics and its regulation, which can provide a guarantee for the successful implementation of Metabolic Flux Analysis (MFA) (Dandekar et al., 2014).
Here, to investigate the effect of PQQ-ADH on acetic acid production, a strain that over-expressed PQQ-ADH subunits I (adhA) and II (adhB) was constructed, and the ethanol tolerance and acetic acid production of the engineered and original strains was compared. Furthermore, to find out differences in protein expression from the two strains, the type and function of the different proteins were inferred by comparison to mass spectrometry databases. And the MFA combined with proteomic analysis was performed to evaluate the relationship between the partial reformation of PQQ-ADH and whole metabolism of intrinsic cells, which was also the biggest innovation and highlights of this study.
Materials and Methods
Materials
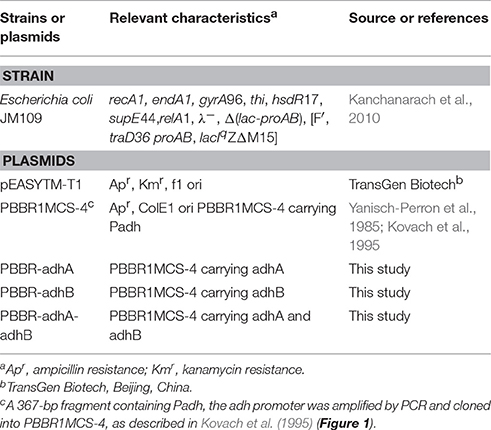
Acetobacter pasteurianus JST-S was previously identified in a screen performed in our laboratory from A. pasteurianus CICC 20001. 16S rDNA gene sequencing had been deposited in the GenBank database (accession number: MF457917). The plasmids used in this study are listed in Table 1 (Krahulec et al., 2003). All bacterial strains and plasmids were obtained from the Collection of the School of Food Science and Engineering, Hefei University of Technology, Hefei, China.
Seeds medium (YG1) contained 11 g L−1 of glucose, 11 g L−1 of yeast extract, 1.1 g L−1 of MgSO4·7H2O, 3.3 g L−1 of K2HPO4, and 2% (v v−1) ethanol. Fermentation medium (YG2) contained 5 g L−1 of glucose, 5 g L−1 of yeast extract, 1.1 g L−1 of MgSO4·7H2O, 3.3 g L−1 of K2HPO4, and different concentrations of ethanol. YPGD medium contained 5 g L−1 yeast extract, 5 g L−1 peptone, 5 g L−1 glucose, 5 g L−1 glycerol, 17 g L−1 agar, and 3.5% (v v−1) ethanol. Media were divided into 50 ml and poured into 250-ml Erlenmeyer flask. Then, they were sterilized at 121°C for 20 min prior to the addition of ethanol. Cells were seeded in YG1 and cultured on intelligent thermostatic shaking incubator (ZHP-Y2102L, Shanghai Sanfa Scientific Instruments Co. Ltd., Shanghai, China) at 30°C for 36 h at 170 rpm. Fermentation cultivations were performed in YG2 medium at 32°C at 170 rpm.
Restriction enzymes, DNA ligases, low melting-point agarose, DNA gel extraction kit, polymerase chain reaction (PCR) purification kit, and other genetic engineering-related reagents were purchased from TaKaRa (TaKaRa Biotechnology Co., Ltd., Dalian, China). 2D-PAGE-related reagents, protein standards, and 17-cm (pH 4-7) IPG pre-prepared adhesive strips were obtained from Bio-Rad (Bio-Rad Laboratories, Inc., Hercules, USA). Chemicals used in this study were provided by Songong Biotech (Shanghai, China) Co., Ltd.
Construction of PQQ-ADH Over-Expression Strain
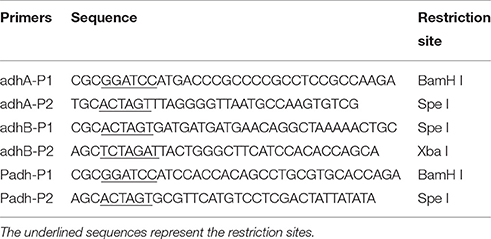
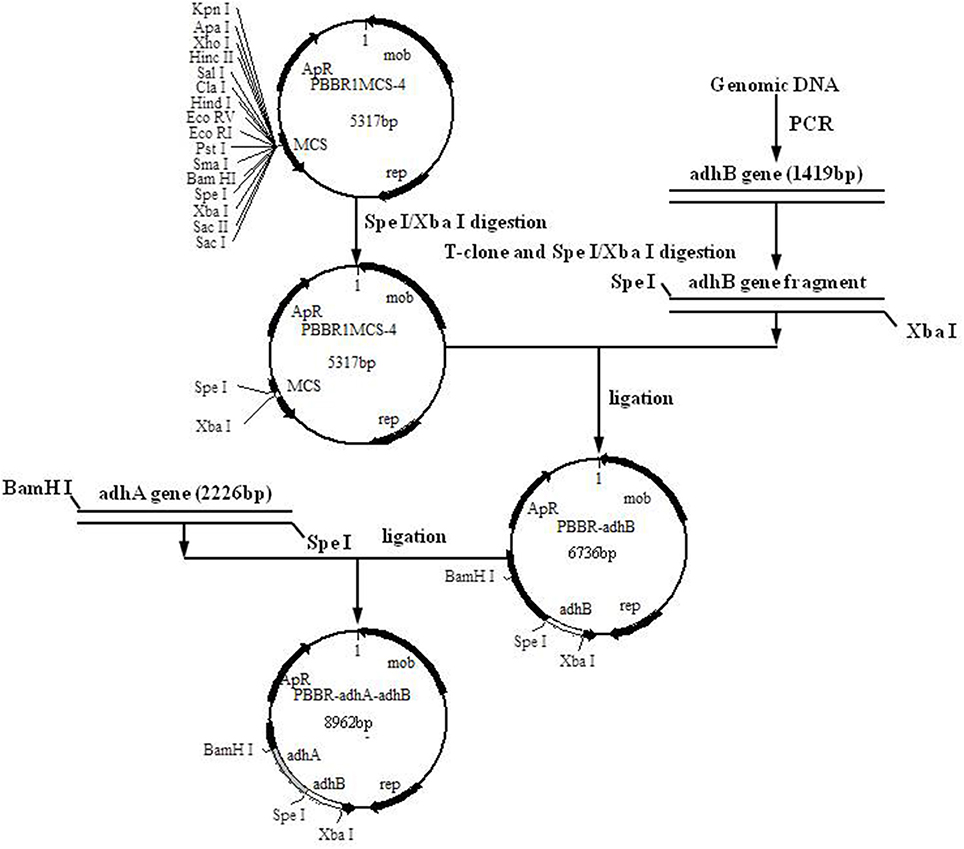
E. coli plasmids were extracted with a MiniBEST Bacterial Genomic DNA extraction kit Ver.2.0 (TaKaRa Biotechnology Co., Ltd., Dalian, China) and stored at −20°C. A Mini BEST Plasmid Purification Kit Ver.4.0 (TaKaRa Biotechnology Co., Ltd., Dalian, China) was used for the preparation and transformation of E. coli competent cells. Standard methods were used for A. pasteurianus JST-S genomic DNA extraction, cell collection, and cell lysis. For amplification of Padh (the promoter region of the operon coding for subunits I and II of PQQ-ADH from A. pasteurianus), adhA and adhB, primer sequences were designed using Primer Premier 5.0 software (Premier Biosoft, CA) (Table 2). PCR and vector construction methods are detailed elsewhere (Matsushita et al., 1992; Krahulec et al., 2003; Andrés-Barrao et al., 2012; Zheng et al., 2014). The construction strategy and sketch map of recombinant plasmids are shown in Figure 1.
Competent A. pasteurianus JST-S cells were prepared according to the references (Matsushita et al., 1992; Andrés-Barrao et al., 2012). Plasmids were introduced into A. pasteurianus JST-S by electroporation using a MicroPulser Electroporation Apparatus (Bio-Rad Laboratories, Inc., Hercules, USA) in an ice-water bath at 2.5 KV. After the shock, cells were quickly transferred to YG1 and cultured at 170 rpm for 2 h at 30°C. Subsequently, the samples were cultured in YPGD medium containing 100 μg ml−1 ampicillin, at 30°C for 48 h to select for strains which containing recombinant plasmid.
Determination of Enzymatic Activity
Strains were incubated in YG2 with a gradient ranging initial ethanol (0, 1, 2, 3, 4, 5, 6, 7, 8%) (v v−1) at 32°C for 48 h at 170 rpm. Then, the fermentation broth was centrifuged by centrifuge (HC-3018R, Anhui USTC Zonkia Scientific Instruments Co., Ltd., Anhui, China) at 8,000 × g for 10 min at 4°C to collect cells. The samples were washed three times with 0.1 M phosphate buffer saline (PBS pH 7.0, 3 ml buffer per one gram of wet bacteria) with the same centrifugal condition and resuspended in the same buffer. Subsequently, the suspension was broken into some active fragments by JY92-II ultrasonic disintegration (220 W, 3s 3s−1) (Ningbo Scientz biotechnology Co., Ltd, Zhejiang, China) for 10 min in ice-water bath. Fractured fluid was further centrifuged at 10,000 × g for 30 min at 4°C to get supernatant fraction as enzyme liquid. The activity of ADH was measured as previously described (Toyama et al., 2004; Trček et al., 2006; Matsushita et al., 2008; Qi et al., 2014). One unit of ADH enzyme activity is defined as the amount of enzyme demanded to catalyze the oxidation of 1 u mol of substrate per minute. Determination of ADH enzyme was performed at 25°C. The protein concentration was measured by the modified Lowry method, with bovine serum albumin as a standard protein (Trček et al., 2006; Yakushi and Matsushita, 2010).
Assays of Total Acid Content and Ethanol Content
The fermentation cultivation was conducted in YG2 with 42 g L−1 ethanol content (EC) and 10 g L−1 acetic acid content, been shaked at 170 rpm at 32°C for 96 h. The acidity of fermentation broth was measured by 0.1 M NaOH with phenolphthalein as pH indicator (Chinnawirotpisan et al., 2003; Krusong et al., 2015). Ethanol content assays were performed by Agilent 7890A GC System (Agilent Technologies Investment Co., Ltd., Shanghai, China) with a 30 m × 1.25 mm × 0.4 μm DB624 capillary column. N-butyl alcohol (0.1 ml n-butyl alcohol per milliliter of fermentation broth) was added as an internal standard. The flow rate of carrier gas (nitrogen) was 30 ml min−1. Injector and detector temperatures were 200°C and 250°C, respectively. The temperature program of capillary column GC finally was set consisted of 100°C for 1 min, ramp to 190°C at 15°C min−1 and hold for 3 min. According to the internal standard curve and the peak area ratio of ethanol and n-butanol alcohol in the sample, ethanol content of fermentation broth was calculated.
Determination of Glucose and Acetic Acid
High performance liquid chromatography (HPLC) was performed for determining the concentration of glucose and acetic acid in the fermentation broth. The sample was centrifuged at 25°C for 10 min at 10,000 × g, and 1 ml of the supernatant was diluted with distil-water and filtered through a 0.22 μm membrane. An Atlantis dC18 150 mm × 4.6 mm (3.0 um) chromatographic column (Waters, USA) was used as analytical column with a flow rate of 0.6 ml min−1, the column temperature was 30°C (Li et al., 2014; Qin et al., 2016; Zhang et al., 2017). 0.05 M NH4H2PO4 buffer adjusted to pH value 2.5 with phosphoric acid was conducted as mobile phase. Concentration of glucose was analyzed by HPLC Waters 600 (American Waters Co., Milford, USA) equipped with UV detector (Waters 2487) at 210 nm, and acetic acid production was measured by HPLC Waters 600 (American Waters Co., Milford, USA) equipped with refractive index detector (Waters 2414) at 40°C. The injection volume of samples was 10 μl.
2D-Page Analysis
Protein samples were extracted as indicated elsewhere (Nakano and Fukaya, 2008; Andrés-Barrao et al., 2012). The different steps of isoelectric focusing were performed as follows: 50 V hydration for 12 ~16 h, 250 V linear run for 30 min, 1,000 V fast run for 1 h, 8,000 V linear run for 5 h, and 8,000 V fast run until a total of 70,000 V h−1. The strips (17 cm, pH 4-7, Limiting current of each strip 30–50 μA) were incubated for 15 min in 10 ml equilibrium solution (0.375 M Tris-HCl pH 8.8, 6 M urea, 2% (w v−1) SDS, 20% (v v−1) glycerol), +2% (w v−1) DDT then, in equilibrium solution +2.5% (w v−1) iodoacetamide. SDS-PAGE was performed in a Protean II electrophoresis tank for 6–8 h at 30 m Agel−1, until the front of the bromophenol blue marker reached the bottom of the glass. After 2D-PAGE, the gel was stained immediately with Coomassie brilliant blue R-250 for 40 min at 25°C on a horizontal shaker, followed by destaining (three times, 30 min each). Once destaining was complete, 2D-PAGE maps were scanned and analyzed using a 2100XL-USB scanner (UMAX, Taiwan) and PDQuest 8.0 software (Bio-Rad, USA), respectively. Differentially expressed spots were sent to the Life Science Laboratory Center of the University of Science and Technology of China for mass spectrometry analysis.
Metabolic Flux Analysis
The suggested metabolic network was constructed by using the substrate utilization and combining our results on enzyme protein expression and genomic information from the Kyoto Encyclopedia of Genes and Genomes (http://www.kegg.jp) (Li et al., 2009; Antoniewicz, 2015; Wallenius et al., 2016). Metabolic flux (MF) analysis, which is based on the pseudo-steady-state assumption that there is no accumulation of any intermediates for a certain period of time, was performed for the calculation of volumetric rates of intracellular metabolite formation (Stephanopoulos, 1999). The total stoichiometric matrix of all reactants and reaction products (A) was calculated as follows:
A represented the total stoichiometric matrix for all reactangts and products of reactions. B stood for the internal reaction rates (mmol gDW™1h−1), and R stood for the net formation rate of metabolites (mmol gDW™1h−1). MF was computed using MINVERSE and MMULT in Excel 2010 (Microsoft Co., Redmond, WA, USA) (Li et al., 2009).
Results and Discussion
Over-Expression of PQQ-ADH in A. pasteurianus JST-S
Cloning and Analysis of Padh, adhA, and adhB Sequences
To over-express PQQ-ADH, we subcloned Padh, adhA, and adhB into a high-expression vector. Previous work had shown that Padh was essential for the expression of adhA and adhB, as its absence prevented acetic acid production. Accordingly, Padh (Zheng et al., 2014) was amplified from A. pasteurianus JST-S and cloned into PBBR1MCS-4 (5317 bp) as shown in Figure 1. Padh, adhA, and adhB were amplified from the genomic DNA of A. pasteurianus JST-S by PCR using previously published primers (Zheng et al., 2014). The PCR products were analyzed by electrophoresis. As shown in Figure 2, Padh, adhA, and adhB were about 367, 2,226, and 1,419 bp in length, respectively. Sequence analysis showed that the adhA fragment contained only a single reading frame (ORF) of 2,226 bp, with an ATG start codon and a TAA stop codon. We reasoned that adhA and adhB ORFs encoded 742 and 473 amino acid residues, respectively. The cloned adhA (GenBank database ID: 1992895 Seq1 KY643658) sequence had 98.7% of identity to the A. pasteurianus adhA sequence deposited in GenBank (GenBank database ID: 16503088) (Zheng et al., 2014), that indicated the cloned fragment was indeed the adhA fragment of A. pasteurianus. The same result of adhB (GenBank database ID: 1983884 Seq1 KY584296).
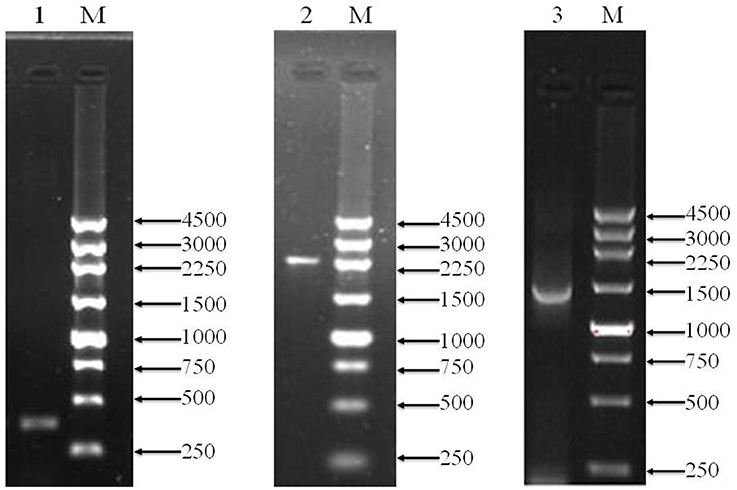
Figure 2. PCR amplification products shown by agarose gel electrophoresis. Lanes M, marker (bp);1, Padh; 2, adhA; 3, adhB.
Construction and Identification of Recombinant Plasmids
To assess cloning accuracy, the recombinant plasmids were verified by double digestion with restriction enzymes (Figure 3). As seen in Lane1, PBBR-adhA produced a band compatible with the expected 2,226-bp fragment. Digestion of PBBR-adhB (Lane 2) produced a band that also matched the expected size (1,419 bp). Finally, PBBR-adhA-adhB digestion with BamH I (Lane 3) generated a large fragment similar to the expected linear plasmid (8,962 bp). In summary, digestion patterns showed that the recombinant plasmids were constructed successfully.
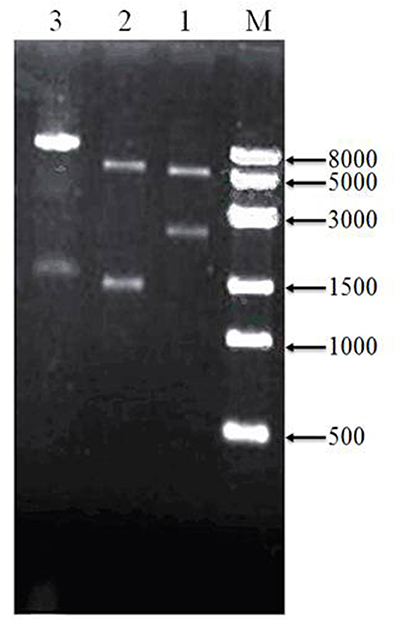
Figure 3. Verification of recombinant plasmids by restriction enzyme digeston. Lanes: M, 8-kbp marker, 1, PBBR-adhA digested with Bam HI and Spe I; 2, PBBR-adhB digested with Spe I and Xba I; and 3, PBBR-adhA-adhB digested with Bam H I.
Assessment of adhA-adhB Over-Expression
Verification of adhA-adhB Over-Expression
Total protein extracts from the original and engineered strains were separated by SDS-PAGE (Figure 4). As can be observed in Lane 3, the engineered strain displayed bands compatible with the size expected for ADH subunits I and II, indicating the successful expression of adhA and adhB.
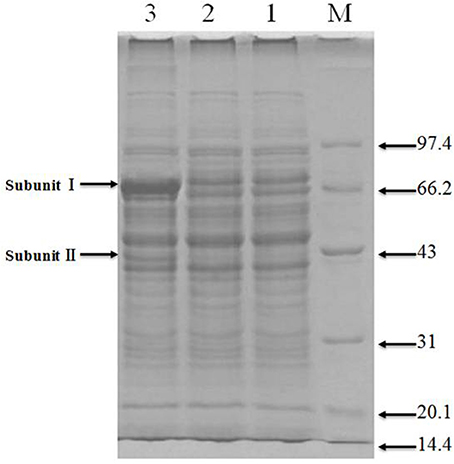
Figure 4. SDS-PAGE of recombinant protiens over-expressed in the genetically engineered strain Lanes: M, molecular weight marker (KDa); 1 and 2, original strain; 3, engineered strain.
Verification of ADH Enzymatic Activity in the Engineered Strain
ADH activity changed under different EC as shown in Figure 5. In the absence of ethanol, ADH activity was 0.40 U mg−1 for the original strain and 0.46 U mg−1 for the engineered one (Figure 5A). When EC increased from 1 to 4%, ADH activity of both strains also increased. The highest activity was observed at 4% of EC, corresponding to 4.23 U mg−1 and 5.28 U mg−1, respectively, for the original and engineered strains (Figure 5A). For EC above 4%, ADH activity decreased rapidly in both strains, reaching its lowest level at 8% of EC. At this point, ADH activity of the engineered strain (1.86 U mg−1) was ~1.9 times that of the original strain (0.96 U mg−1) (Figure 5A). In general, ADH activity of the engineered strain was higher than that of the original strain at any given EC, suggesting that ADH expression was also increased.
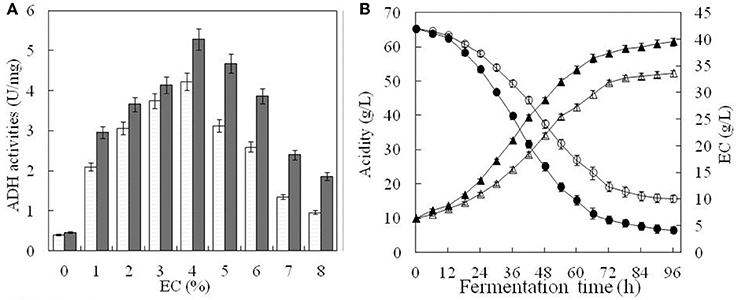
Figure 5. Comparison of fermentation parameters in the original and engineered strains. ADH activity of the original strain(□) and engineered strain(■) were compared under the different content of ethanol in (A). In (B), white triangle and black triangle represent total acid content of the original strain and engineered strain, respectively. Similarly, white circle and black circle represent ethanol content of the original strain and engineered strain, respectively. Error bars show standard deviations of three replicated measurements.
Total Acid Content in the Original and Engineered Strains
Total acid content and ethanol consumption in both strains were relatively low during the first 12 h of cultivation, probably due to A. pasteurianus having adapted to a high concentration of ethanol (Figure 5B). Between 12 and 72 h, acetic acid accumulated rapidly, while EC decreased with a steady rate. After 72 h, nearing the end of fermentation, accumulation of acetic acid slowed and EC remained almost unchanged. For the engineered strain, the final total acid content was 61.42 g L−1 and EC was 4.18 g L−1. For the original strain, total acid content was only 52.23 g L−1 and EC was 10.11 g L−1. This indicated that total acid content and ethanol conversion were higher in the engineered than the original strain under the same conditions. It also suggested that ADH activity was enhanced in the engineered strain.
Proteomic Analysis of Differentially Expressed Proteins
Proteomic Analysis
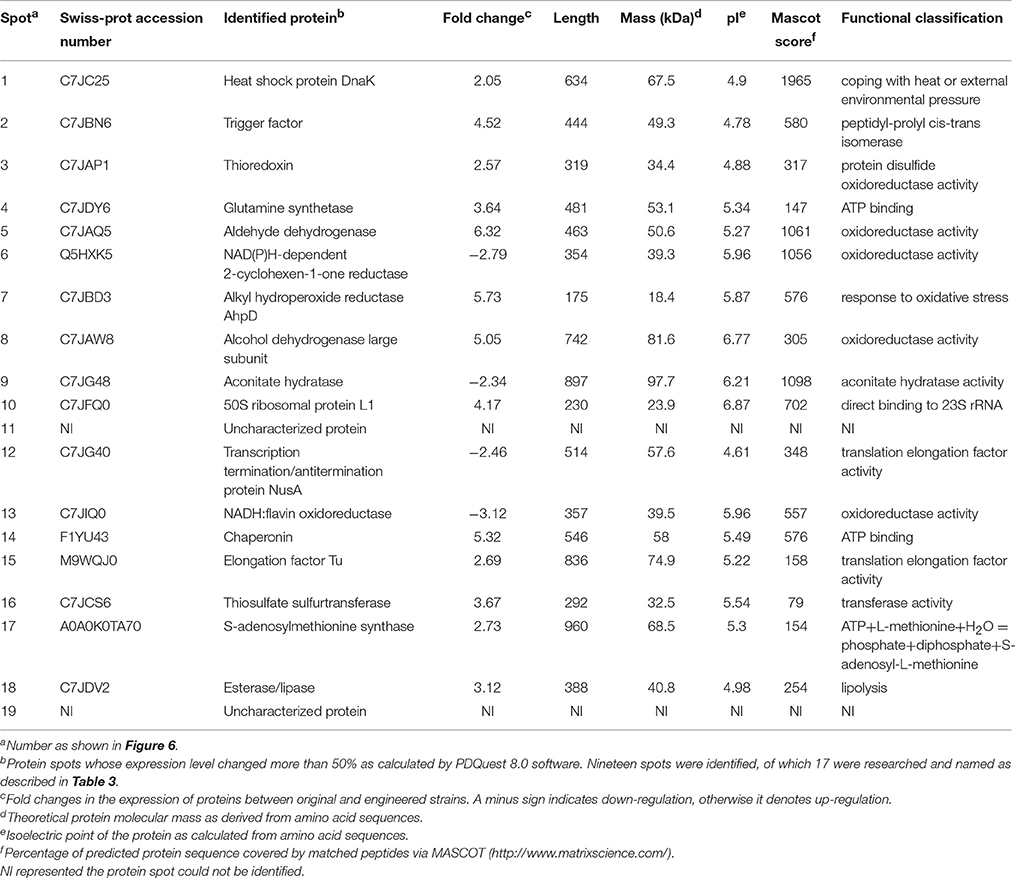
Protein extracts from the original and engineered strains cultivated in YG2 at 170 rpm at 32°C for 48 h were analyzed by 2D-PAGE (IPG 4-7, 17-cm strips followed by SDS-PAGE) (Figure 6). Nineteen representative differentially expressed protein spots were identified.
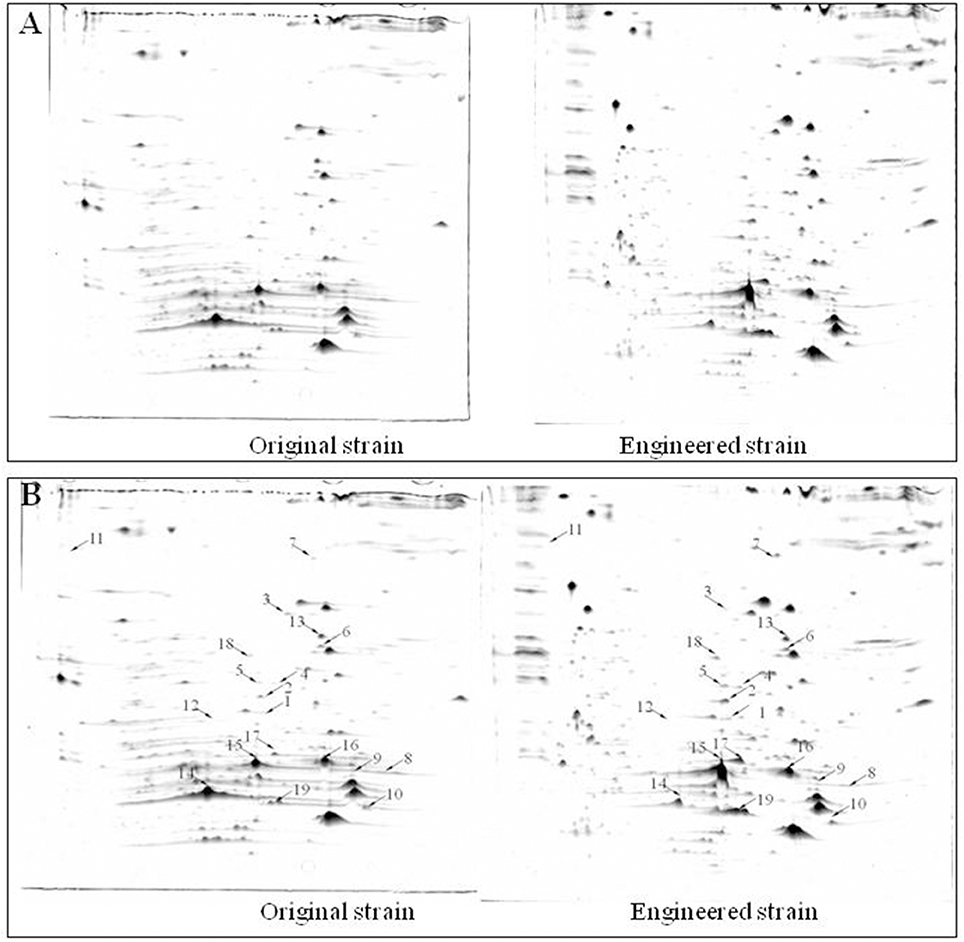
Figure 6. Comparison of 2D-PAGE patterns between original engineered strains. (A) Primary 2D-PAGE maps. (B) 2D-PAGE maps analyzed using PD Quest 8.0 software. Protein spots whose expression level changed more than 50% were identified as differentially expressed proteins.
Functional Analysis of Differentially Expressed Proteins
Differentially expressed protein spots were analyzed by tandem mass spectrometry (MS/MS) and the peptide fingerprint spectrum was identified. The Swiss-Prot protein database (http://www.uniprot.org/) was used to search for peptides; 17 of the 19 queried peptides matched those in the database.
Functional analysis of identified protein spots confirmed significantly higher levels of PQQ-ADH (adhA and adhB) in the engineered compared to the original strain. This was consistent with SDS-PAGE analysis (Figure 4). Overall, we identified 13 up-regulated and four down-regulated protein spots; two additional spots could not be identified (Table 3). PQQ-ADH, chaperonin, and acetaldehyde dehydrogenase were particularly up-regulated, indicating that PQQ-ADH over-expression enhanced the ethanol oxidation respiratory chain (Illeghems et al., 2013).
Spot 1 in Table 3 was identified as a DnaK heat shock protein. DnaK plays an important role in preventing protein denaturation, and restoring the original structure and biological activity, especially under heat shock or other stressful conditions. Heat shock protein up-regulation has been shown to coincide with resistance to external stresses, such as high acetic acid or other harmful environmental factors (Welch, 1993; Hartl and Hayer-Hartl, 2002). The behavior of AAB heat-shock proteins, such as GroES, GroEL, DnaK, and DnaJ, in response to changes in temperature, alcohol content, acidity and prevent protein misfolding have been studied before (Okamoto-Kainuma et al., 2002, 2004). Accordingly, the increased ethanol tolerance of the engineered strain may be explained by the up-regulation of heat shock proteins.
Spot 2 corresponded to a trigger factor with peptidyl-prolyl cis-trans isomerase activity. This factor can interact with short peptide chains by binding to the ribosome and thus facilitate the correct folding of newly synthesized peptides (Hesterkamp et al., 1996; Hartl and Hayer-Hartl, 2002).
Spot 4 corresponded to glutamine synthetase. This enzyme catalyzes the conversion of ammonium and glutamic acid to glutamine, which is involved in protein synthesis and transport of ammonia. The catalytic reaction of glutamine synthetase can be divided in two steps. In the first, ATP reacts with glutamic acid to form γ-glutamic acid. In the second, the phosphate group is replaced by the ammonium ion to yield glutamine (Rhee and Chock, 1976). Recently, glutamine has been shown to control intracellular pH by neutralizing protons under highly acidic conditions in E. coli. The underlying mechanism depends on its conversion into glutamate and the release of ammonia (Lu et al., 2013). The up-regulation of glutamine synthetase may play an important role in preventing intracellular acidification under elevated acid stress.
We observed a down-regulation of oxidoreductases, such as NAD(P)H-dependent 2-cyclohexen-1-one reductase (spot 6) and NADH: flavin oxidoreductase (spot 13). These are known to be involved in bacterial growth; their down-regulation may indicate that ADH over-expression and increased acid production decrease cell growth. Some studies have suggested that the physiological effect induced by changes in environmental stress factors, such as temperature, salt ions, and acidity, is mediated by the oxidoreductase pathway (Richier et al., 2006; Ryter et al., 2007). Furthermore, increased acidity in the environment causes a metabolic imbalance, those results in the production of a large amount of oxygen free radicals, which cause oxidative damage in the cells. Consequently, oxidoreductase activity could be used as an indicator of an organism's response to environmental stress. The up-regulation of thioredoxin (spot 3) responsible for maintaining disulfide bonds, and the corresponding metabolic implications will require further research.
Spot 7 corresponded to alkyl hydroperoxide reductase, a member of the peroxiredoxin family responsible for the detoxification of active substances. To protect the cell and reduce peroxides, alkyl hydroperoxide reductase uses mainly the electrons donated by NADPH and the FAD reductase AhpF.
Aconitase (spot 9) is a coenzyme that catalyzes the conversion of citric acid to isocitrate and participates mainly in the tricarboxylic acid cycle (Nakano and Fukaya, 2008; Andrés-Barrao et al., 2012). Down-regulation of aconitase suggested reduced tricarboxylic acid cycle activity, possibly explaining why at the beginning of fermentation the engineered strain grew more slowly than the parent one. It has been suggested that improving aconitase expression could effectively increase acid producing by AAB (Nakano et al., 2004), however we found that PQQ-ADH over-expression actually down-regulated aconitase. Therefore, the link between aconitase levels and acid production in AAB will require further investigation.
Spot 15 was identified as a translation elongation factor Tu (EF-Tu) showed an up-regulated expression level, as shown in Table 3. It has a conserved structure spanning 836 amino acid residues. EF-Tu, an essential factor for protein synthesis promoted the GTP-dependent translocation of the nascent protein chain from the A-site to the P-site of the ribosome (Lariviere et al., 2001). This differential expression was associated with the significant increase in protein translation by constructing a engineered strain that over-expressed PQQ-ADH subunits I (adhA) and II (adhB).
Proteomic analysis revealed that aldehyde dehydrogenase (ALDH) (spot 5), the large subunit of ethanol dehydrogenase (spot 8), and a chaperonin (spot 14) were up-regulated. This was likely due to PQQ-ADH over-expression and increased flux through the ethanol oxidation respiratory chain pathway. Heat shock protein (spot 1), trigger factor (spot 2), glutamine synthetase (spot 4), alkyl hydroperoxide reductase (spot 7), and elongation factor Tu (spot 15) were also up-regulated in the engineered strain, possibly explaining its improved tolerance of environment stresses, such as acid, heat, and alcohol. However, aconitase, a key enzyme of the tricarboxylic acid cycle, was down-regulated, which could lead to lower tricarboxylic acid cycle activity and lower growth of AAB.
Metabolic Flux Analysis
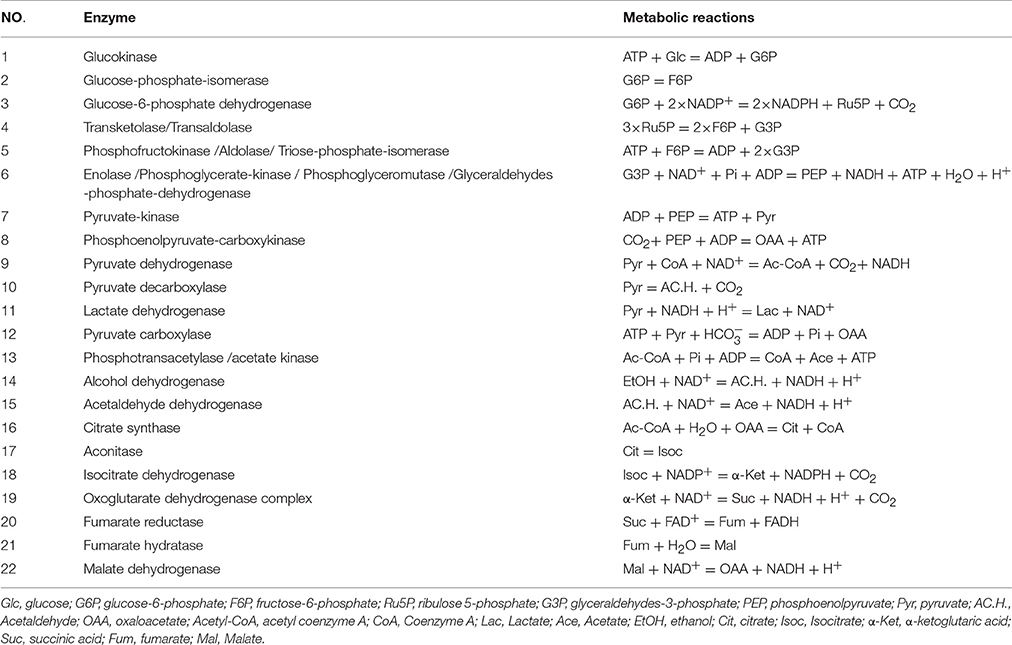
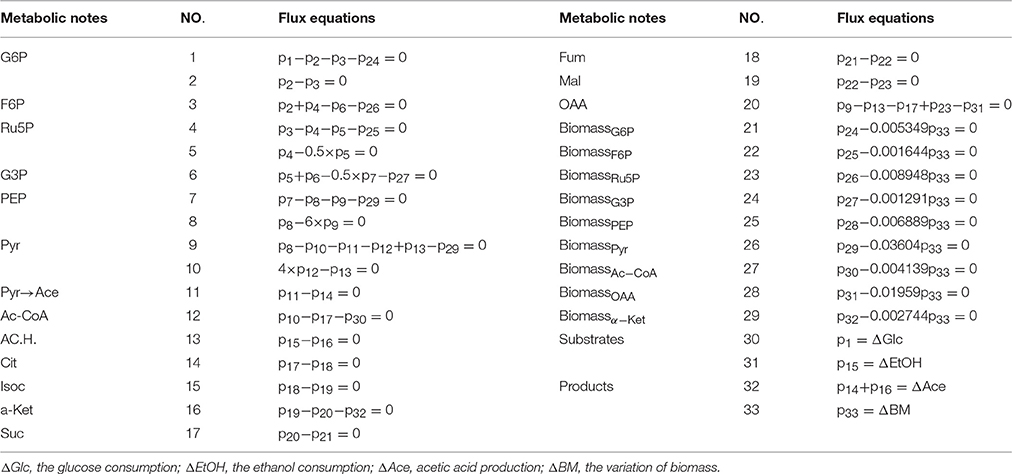
The suggested metabolic network of A. pasteurianus JST-S with ethanol and glucose was shown in Figure 7 (Illeghems et al., 2013). All the biochemical reactions and enzymes are presented in Table 4, metabolic flux equations of A. pasteurianus JST-S corresponding to these reactions are shown in Table 5. A total of 33 equations were obtained from those biochemical reactions, following the basal mass balance. The coefficient of nine equations was obtained from previous studies (Longacre et al., 1997; Li et al., 2014), whereas that of all others was computed by dividing the net change in the concentration of metabolite during a short period of the nearly stationary phase by the duration of this phase. At 48–60 h, the fermentation rate was very high (As shown in Figure 5B), but the synthesis of cell biomass was almost stationary (data not show). Therefore, we selected the fermentation time of original strain and engineered strain for 48 h for the analysis of fluxes and identified a total of 33 fluxes, a number that was equal to that of biochemical reactions.
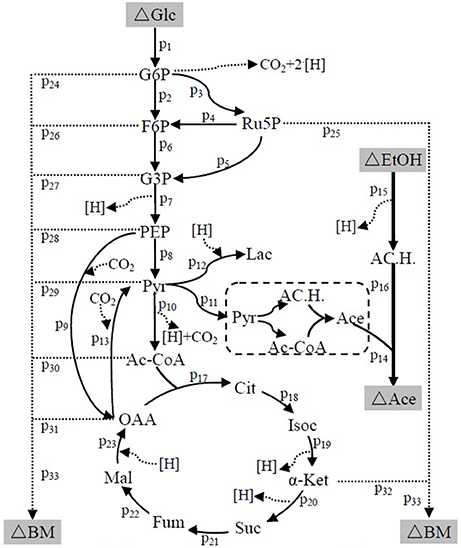
Figure 7. The metabolic network of A. pasteurianus JST-S Glc, glucose; G6P, glucose-6-phhospahte; F6P, fructose-6-phosphate; Ru5P, ribulose 5-posphate; G3P, glyceraldehydes-3-phosphate; PEP, poshonolpyruvate; Pyr, pyruvate; Pyr, pyruvate; AC.H., Acetaldehyde; OAA, oxaloacetate; Acetyl-CoA, acetyl coenzyme A; CoA, Coenzyme A; Lac, Lactate; Ace, Acetate; EtOH, ethanol; Cit, citrate; Isoc, Isocitrate; α-Ket, α-ketoglutaric acid; Suc, succinic acid; Fum, fumarate; Mal, Malate; BM, biomass.
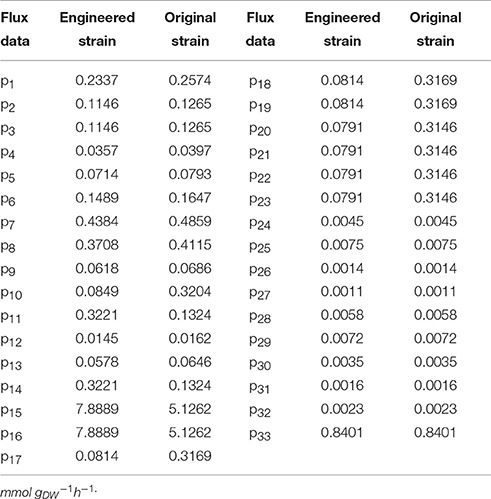
Wet body weight of original strain and engineered strain was respectively 1.6 g L−1 and 1.54 g L−1 when fermentation time was 48 h at 32°C for 170 rpm. Original flux data of engineered strain and original strain was shown as in Table 6. The total flux of acetic acid production in engineered strain (8.2110 mmol gDW™1h−1) was higher than that of the original strain (5.2586 mmol gDW™1h−1), this was the result of the modification of ADH genes in A. pasteurianus JST-S. Thus, this further explained that the up-regulated expression of key enzymes in ethanol oxidation respiratory chain was in accord with the total flux data of acetic acid production. In Table 6, the flux of ethanol uptake in the original strain (5.1262 mmol gDW™1h−1) was lower that of engineered strain (7.8889 mmol gDW™1h−1), which meant the ethanol tolerance of engineered strain was better than that of original strain. That was what heat shock protein, trigger factor, glutamine synthetase, alkyl hydroperoxide reductase, and elongation factor Tu were up-regulated in the engineered strain (as shown in Figure 6, Table 3). The flux of glucose uptake in the original strain (0.2574 mmol gDW™1h−1) was higher than that of engineered strain (0.2337 mmol gDW™1h−1), indicating that the biomass of original strain was higher than that of engineered strain in the same fermentation time, this was consistent with the analysis of down-regulated oxidoreductases, such as NAD(P)H-dependent 2-cyclohexen-1-one reductase and flavin oxidoreductase (as shown in Figure 6, Table 3). The alcohol dehydrogenase gene of A. pasteurianus JST-S was modified by gene engineering might disturb the integrity of a bacterial gene sequence so that cell growth rate slowed down and the fluxes of various organic acids in TCA decreased comparing with the original strain (as shown in Table 6). The decrease in the fluxes of various organic acids in TCA might be due to the down-regulation of aconitase as a key enzyme of the tricarboxylic acid cycle (as shown in Figure 6, Table 3). These studies, combining proteome analysis with MFA, will make us easier to understand the effect of over-expressed PQQ-ADH on the metabolism of internal substances and may provide a reference for theory analysis of the metabolic mechanism with AAB.
Conclusions
To study PQQ-ADH over-expression, A. pasteurianus JST-S adhA and adhB were amplified by PCR, subcloned into a vector, and transformed back into A. pasteurianus JST-S. A comparison of the fermentation parameters indicated that acid production and ethanol conversion were higher in the engineered than in the original strain. The metabolic network was constructed and the MFA of the pathway from ethanol and glucose was also further investigated by comparing with original strain and engineered strain. Our study demonstrated that PQQ-ADH over-expression is an effective way to improve the acetic acid production in A. pasteurianus. Future experiments should aim at finding and analyzing the relative metabolic mechanism that are responsible for the tolerance of environment stresses.
Author Contributions
XW designed the study and wrote the protocol. HY conducted all experiments. MZ, XC, and JC took part in materials preparation. ZZ and LP took part in the manuscript preparation. LC and SJ performed the data analysis. ZW took part in polishing the manuscript. XL wrote and revised the manuscript.
Funding
This work was supported by National Natural Science Foundation of China (31601465), Anhui Provincial Natural Science Foundation (1408085MKL17), Anhui Science and Technology Project (15CZZ03100), Projects of Hefei University of Technology (JZ2014HGQC0124, JZ2015HGBZ0524), and the Key Laboratory for Agricultural Products Processing of Anhui Province, School of Food Science and Engineering, Hefei University of Technology.
Conflict of Interest Statement
The authors declare that the research was conducted in the absence of any commercial or financial relationships that could be construed as a potential conflict of interest.
References
Andrés-Barrao, C., Saad, M. M., Chappuis, M. L., Boffa, M., Perret, X., Pérez, R. O., et al. (2012). Proteome analysis of Acetobacter pasteurianus, during acetic acid fermentation. J. Proteomics 75, 1701–1717. doi: 10.1016/j.jprot.2011.11.027
Antoniewicz, M. R. (2015). Methods and advances in metabolic flux analysis: a mini-review. J. Ind. Microbiol. Biotechnol. 42, 317–325. doi: 10.1007/s10295-015-1585-x
Chen, Y., Bai, Y., Li, D., Wang, C., Xu, N., Wu, S., et al. (2016). Correlation between ethanol resistance and characteristics of PQQ-dependent ADH in acetic acid bacteria. Eur. Food. Res. Technol. 242, 837–847. doi: 10.1007/s00217-015-2589-5
Chinnawirotpisan, P., Theeragool, G., Limtong, S., Toyama, H., Adachi, O. O., and Matsushita, K. (2003). Quinoprotein alcohol dehydrogenase is involved in catabolic acetate production, while NAD-dependent alcohol dehydrogenase in ethanol assimilation in Acetobacter pasteurianusSKU1108. J. Biosci. Bioeng. 96, 564–571. doi: 10.1016/S1389-1723(04)70150-4
Dandekar, T., Fieselmann, A., Majeed, S., and Ahmed, Z. (2014). Software applications toward quantitative metabolic flux analysis and modeling. Brief. Bionform. 15, 91–107. doi: 10.1093/bib/bbs065
Hartl, F. U., and Hayer-Hartl, M. (2002). Molecular chaperones in the cytosol: from nascent chain to folded protein. Science 295, 1852–1858. doi: 10.1126/science.1068408
Hesterkamp, T., Hauser, S., Lütcke, H., and Bukau, B. (1996). Escherichia coli trigger factor is a prolyl isomerase that associates with nascent polypeptide chains. Proc. Natl. Acad. Sci. U.S.A. 93, 4437–4441. doi: 10.1073/pnas.93.9.4437
Illeghems, K., De, V. L., and Weckx, S. (2013). Complete genome sequence and comparative analysis of Acetobacter pasteurianus 386B, a strain well-adapted to the cocoa bean fermentation ecosystem. BMC Genomics 14:526. doi: 10.1186/1471-2164-14-526
Kanchanarach, W., Theeragool, G., Yakushi, T., Toyama, H., Adachi, O., and Matsushita, K. (2010). Characterization of thermotolerant Acetobacter pasteurianus strains and their quinoprotein alcohol dehydrogenases. Appl. Microbiol. Biot. 85, 741–751. doi: 10.1007/s00253-009-2203-5
Kondo, K., Beppu, T., and Horinouchi, S. (1995). Cloning, sequencing, and characterization of the gene encoding the smallest subunit of the three-component membrane-bound alcohol dehydrogenase from Acetobacter pasteurianus. J. Bacteriol. 177, 5048–5055. doi: 10.1128/jb.177.17.5048-5055.1995
Kovach, M. E., Elzer, P. H., Hill, D. S., Robertson, G. T., Farris, M. A., Roop II, R. M., et al. (1995). Four new derivatives of the broad-host-range cloning vector pBBR1MCS, carrying different antibiotic-resistance cassettes. Gene 166, 175–176. doi: 10.1016/0378-1119(95)00584-1
Krahulec, J., Kretov, M., and Grones, J. (2003). Characterisation of plasmids purified from Acetobacter pasteurianus 2374. Biochem. Biophys. Res. Commun. 310, 94–97. doi: 10.1016/j.bbrc.2003.08.125
Krusong, W., Kerdpiboon, S., Jindaprasert, A., Yaiyen, S., Pornpukdeewatana, S., and Tantratian, S. (2015). Influence of calcium chloride in the high temperature acetification by strain Acetobacter aceti WK for vinegar. J. Appl. Microbiol. 119, 1291–1300. doi: 10.1111/jam.12930
Lariviere, F. J., Wolfson, A. D., and Uhlenbeck, O. C. (2001). Uniform binding of aminoacyl-tRNAs to elongation factor Tu by thermodynamic compensation. Science 294, 165–168. doi: 10.1126/science.1064242
Lasko, D. R., Schwerdel, C., Bailey, J. E., and Sauer, U. (1997). Acetate-specific stress response in acetate-resistant bacteria: an analysis of protein patterns. Biotechnol. Progr. 13, 519–523. doi: 10.1021/bp970075f
Li, X. J., Liu, Y., Yang, Y., Zhang, H., Wang, H. L., Wu, Y., et al. (2014). High levels of malic acid production by the bioconversion of corn straw hydrolyte using an isolated Rhizopus Delemar Strain. Biotechnol. Bioproce. E. 19, 478–492. doi: 10.1007/s12257-014-0047-z
Li, X. J., Zheng, Z., Wei, Z. J., Jiang, S. T., Pan, L. J., and Weng, S. B. (2009). Screening, breeding and metabolic modulating of a strain producing succinic acid with corn straw hydrolyte. World J. Microbiol. Biotechnol. 25, 667–677. doi: 10.1007/s11274-008-9936-7
Longacre, A., Reimers, J. M., Gannon, J. E., and Wright, B. E. (1997). Flux analysis of glucose metabolism in Rhizopus oryzae for the purpose of increasing lactate yields. Fungal Genet. Biol. 21, 30–39. doi: 10.1006/fgbi.1996.0952
Lu, P., Ma, D., Chen, Y., Guo, Y., Chen, G. Q., Deng, H., et al. (2013). L-glutamine provides acid resistance for Escherichia coli through enzymatic release of ammonia. Cell Res. 23, 635–644. doi: 10.1038/cr.2013.13
Matsushita, K., Kobayashi, Y., Mizuguchi, M., Toyama, H., Adachi, O., Sakamoto, K., et al. (2008). A tightly bound quinone functions in the ubiquinone reaction sites of quinoprotein alcohol dehydrogenase of an acetic acid bacterium, Gluconobacter suboxydans. Biosci. Biotech. Bioch. 72, 2723–2731. doi: 10.1271/bbb.80363
Matsushita, K., Takaki, Y., Shinagawa, E., Ameyama, M., and Adachi, O. (1992). Ethanol oxidase respiratory chain of acetic acid bacteria. reactivity with ubiquinone of pyrroloquinoline quinone-dependent alcohol dehydrogenases purified from Acetobacter aceti and Gluconobacter suboxydans. Biosci. Biotech. Bioch. 56, 304–310. doi: 10.1271/bbb.56.304
Nakano, S., and Fukaya, M. (2008). Analysis of proteins responsive to acetic acid in acetobacter: molecular mechanisms conferring acetic acid resistance in acetic acid bacteria. Int. J. Food Microbio. 125, 54–59. doi: 10.1016/j.ijfoodmicro.2007.05.015
Nakano, S., Fukaya, M., and Horinouchi, S. (2004). Enhanced expression of aconitase raises acetic acid resistance in Acetobacter aceti. Fems. Microbio. Lett. 235, 315–322. doi: 10.1111/j.1574-6968.2004.tb09605.x
Okamoto-Kainuma, A., Wang, Y., and Ishikawa, M. (2004). Cloning and characterization of the dnaKJ operon in Acetobacter aceti. J. Biosci. Bioeng. 97, 339–342. doi: 10.1016/S1389-1723(04)70216-9
Okamoto-Kainuma, A., Yan, W., Kadono, S., Tayama, K., Koizumi, Y., and Yanagida, F. (2002). Cloning and characterization of groESL operon in Acetobacter aceti. J. Biosci. Bioeng. 94, 140–147. doi: 10.1016/S1389-1723(02)80134-7
Qi, Z. L., Wang, W., Yang, H. L., Xia, X. L., and Yu, X. B. (2014). Mutation of Acetobacter pasteurianus, by UV irradiation under acidic stress for high-acidity vinegar fermentation. Int. J. Food Sci. Techno. 49, 468–476. doi: 10.1111/ijfs.12324
Qin, H., Sun, Q., Pan, X., Qiao, Z., and Yang, H. (2016), Microbial diversity and biochemical analysis of Suanzhou: a traditional Chinese fermented cereal gruel. Front. Microbiol. 7:1311. doi: 10.3389/fmicb.2016.01311
Quintero, Y., Poblet, M., Guillamón, J. M., and Mas, A. (2009). Quantification of the expression of reference and alcohol dehydrogenase genes of some acetic acid bacteria in different growth condition. J. Appl. Microbio. 106, 666–674. doi: 10.1111/j.1365-2672.2008.04046.x
Rhee, S. G., and Chock, P. B. (1976). Mechanistic studies of glutamine synthetase from Escherichia coli: kinetic evidence for two reaction intermediates in biosynthetic reaction. Proc. Natl. Acad. Sci. U.S.A. 73, 476–480. doi: 10.1073/pnas.73.2.476
Richier, S., Sabourault, C., Courtiade, J., Zucchini, N., Allemand, D., and Furla, P. (2006). Oxidative stress and apoptotic events during thermal stress in the symbiotic sea anemone, anemonia viridis. FEBS J. 273, 4186–4198. doi: 10.1111/j.1742-4658.2006.05414.x
Ryter, S. W., Kim, H. P., Hoetzel, A., Park, J. W., Nakahira, K., Wang, X., et al. (2007). Mechanisms of cell death in oxidative stress. Antioxid. Redox Sign. 9, 49–89. doi: 10.1089/ars.2007.9.49
Steiner, P., and Sauer, U. (2001). Proteins induced during adaptation of Acetobacter aceti to high acetate concentrations. Appl. Environ. Microb. 67, 5474–5481. doi: 10.1128/AEM.67.12.5474-5481.2001
Stephanopoulos, G. (1999). Metabolic fluxes and metabolic engineering. Metab. Eng. 1, 1–11. doi: 10.1006/mben.1998.0101
Toyama, H., Mathews, F. S., Adachi, O., and Matsushita, K. (2004). Quinohemoprotein alcohol dehydrogenases: structure, function, and physiology. Arch. Bioch. Biophys. 428, 10–21. doi: 10.1016/j.abb.2004.03.037
Trček, J., and Matsushita, K. (2013). A unique enzyme of acetic acid bacteria, PQQ-dependent alcohol dehydrogenase, is also present in frateuria aurantia. Appl. Microbiol. Biot. 97, 7369–7376. doi: 10.1007/s00253-013-5007-6
Trček, J., Mira, N. P., and Jarboe, L. R. (2015). Adaptation and tolerance of bacteria against acetic acid. Appl. Microbiol. Biot. 99, 6215–6129. doi: 10.1007/s00253-015-6762-3
Trček, J., Toyama, H., Czuba, J., Misiewicz, A., and Matsushita, K. (2006). Correlation between acetic acid resistance and characteristics of PQQ-dependent ADH in acetic acid bacteria. Appl. Microbio. Biot. 70, 366–373. doi: 10.1007/s00253-005-0073-z
Wallenius, J., Maaheimo, H., and Eerikäinen, T. (2016). Carbon 13-metabolic flux analysis derived constraint-based metabolic modelling of Clostridium acetobutylicum in stressed chemostat conditions. Bioresour. Technol. 219, 378–386. doi: 10.1016/j.biortech.2016.07.137
Wang, Z., Ning, Z., Shi, J., Feng, W., Liu, Y., and Liang, X. (2015). Comparative proteome of Acetobacter pasteurianus Ab3 during the high acidity rice vinegar fermentation. Appl. Biochem. Biotech. 177, 1573–1588. doi: 10.1007/s12010-015-1838-1
Welch, N. J. (1993). “Heat shock proteins functioning as molecular chaperones: their roles in normal and stressed cells,” in Molecular Chaperones, eds R. J. Ellis, R. A. Laskey, and G. H. Lorimer (Netherlands: Springer Netherlands), 71–77.
Yakushi, T., and Matsushita, K. (2010). Alcohol dehydrogenase of acetic acid bacteria: structure, mode of action, and applications in biotechnology. Appl. Microbiol. Biot. 86, 1257–1265. doi: 10.1007/s00253-010-2529-z
Yanisch-Perron, C., Vieira, J., and Messing, J. (1985). Improved M13 phage cloning vectors and host strains: nucleotide sequences of the M13mpl8 and pUC19 vectors. Gene 33, 103–119. doi: 10.1016/0378-1119(85)90120-9
Zhang, J. G., Zhang, F., Thakur, K., Hu, F., and Wei, Z. J. (2017). Valorization of Spent Escherichia coli media using green microalgae Chlamydomonas reinhardtii and feedstock production. Front. Microbiol. 8:1026. doi: 10.3389/fmicb.2017.01026
Zheng, Y., Wang, M., Shen, Y. B., Niu, D. D., Luo, J. M., Nie, Z. Q., et al. (2014). Genetic Engineering Acetic Acid Bacteria of Overexpressing Coenzyme PQQ (Pyrroloquinoline Quinone) Synthetic Proteins and Application of Bacteria. CN, CN 103740629 A. Tianjin, CN. State Intellectual Property Office of the P.R.C.
Keywords: Pyrroquinoline quinone-dependent alcohol dehydrogenase, Acetobacter pasteurianus JST-S, two-dimensional gel electrophoresis, metabolic flux analysis
Citation: Wu X, Yao H, Cao L, Zheng Z, Chen X, Zhang M, Wei Z, Cheng J, Jiang S, Pan L and Li X (2017) Improving Acetic Acid Production by Over-Expressing PQQ-ADH in Acetobacter pasteurianus. Front. Microbiol. 8:1713. doi: 10.3389/fmicb.2017.01713
Received: 10 July 2017; Accepted: 24 August 2017;
Published: 06 September 2017.
Edited by:
Qiang Wang, Institute of Hydrobiology (CAS), ChinaReviewed by:
Cheng-Lin Hou, Capital Normal University, ChinaNaresh Singhal, University of Auckland, New Zealand
Copyright © 2017 Wu, Yao, Cao, Zheng, Chen, Zhang, Wei, Cheng, Jiang, Pan and Li. This is an open-access article distributed under the terms of the Creative Commons Attribution License (CC BY). The use, distribution or reproduction in other forums is permitted, provided the original author(s) or licensor are credited and that the original publication in this journal is cited, in accordance with accepted academic practice. No use, distribution or reproduction is permitted which does not comply with these terms.
*Correspondence: Xingjiang Li, aGZ1dC1saXhpbmdqaWFuZ0Bob3RtYWlsLmNvbQ==
 Xuefeng Wu
 Hongli Yao1
 Zhaojun Wei
 Xingjiang Li