 Srinivasan Vijay1,2
 Dao N. Vinh1
 Hoang T. Hai1Vu T. N. Ha1Vu T. M. Dung1Tran D. Dinh1
 Hoang N. Nhung1
 Trinh T. B. Tram1Bree B. Aldridge3,4Nguyen T. Hanh1Do D. A. Thu1Nguyen H. Phu5Guy E. Thwaites1,2
 Nguyen T. T. Thuong1,2*
- 1Oxford University Clinical Research Unit, Ho Chi Minh City, Vietnam
- 2Centre for Tropical Medicine and Global Health, Nuffield Department of Medicine, University of Oxford, Oxford, United Kingdom
- 3Department of Molecular Biology and Microbiology, Tufts University School of Medicine, Boston, MA, United States
- 4Department of Biomedical Engineering, Tufts University School of Engineering, Medford, MA, United States
- 5Hospital for Tropical Diseases, Ho Chi Minh City, Vietnam
Mycobacterial cellular variations in growth and division increase heterogeneity in cell length, possibly contributing to cell-to-cell variation in host and antibiotic stress tolerance. This may be one of the factors influencing Mycobacterium tuberculosis persistence to antibiotics. Tuberculosis (TB) is a major public health problem in developing countries, antibiotic persistence, and emergence of antibiotic resistance further complicates this problem. We wanted to investigate the factors influencing cell-length distribution in clinical M. tuberculosis strains. In parallel we examined M. tuberculosis cell-length distribution in a large set of clinical strains (n = 158) from ex vivo sputum samples, in vitro macrophage models, and in vitro cultures. Our aim was to understand the influence of clinically relevant factors such as host stresses, M. tuberculosis lineages, antibiotic resistance, antibiotic concentrations, and disease severity on the cell size distribution in clinical M. tuberculosis strains. Increased cell size and cell-to-cell variation in cell length were associated with bacteria in sputum and infected macrophages rather than liquid culture. Multidrug-resistant (MDR) strains displayed increased cell length heterogeneity compared to sensitive strains in infected macrophages and also during growth under rifampicin (RIF) treatment. Importantly, increased cell length was also associated with pulmonary TB disease severity. Supporting these findings, individual host stresses, such as oxidative stress and iron deficiency, increased cell-length heterogeneity of M. tuberculosis strains. In addition we also observed synergism between host stress and RIF treatment in increasing cell length in MDR-TB strains. This study has identified some clinical factors contributing to cell-length heterogeneity in clinical M. tuberculosis strains. The role of these cellular adaptations to host and antibiotic tolerance needs further investigation.
Introduction
Tuberculosis (TB) remains as an important and difficult to treat human disease. Prolonged antimicrobial treatment is required to prevent clinical complications and cure the infection. Antimicrobial resistance further increases the risk of treatment failure and poor clinical outcomes (Stewart et al., 2003; Gomez and McKinney, 2004; Mitchison and Davies, 2012). In addition bacterial population heterogeneity generates antibiotic tolerant subpopulations which may contribute to clinical persistence (Balaban et al., 2004; Veening et al., 2008). Several recent studies have studied the complexity of persister sub-populations, revealing different mechanisms for generating antibiotic persistence, their role in treatment failure, and possible approaches to eradicating such persister populations (Van den Bergh et al., 2017). Recently bacterial antibiotic tolerance has also been implicated in the emergence of antibiotic-resistant strains (Levin-Reisman et al., 2017). Thus, the presence of such tolerant subpopulations in Mycobacterium tuberculosis may augment the clinical complications associated with TB.
In some studies mycobacterial cell length and elongation rates are associated with differential susceptibility to host- and antibiotic-induced stress (Aldridge et al., 2012; Richardson et al., 2016; Vijay et al., 2017). The exact mechanisms contributing to such stress tolerance is not clear. M. smegmatis divides asymmetrically, producing daughter cells with different characteristics. For example, the daughter cell which is shorter and elongates slower is more tolerant to cell wall inhibiting antibiotics (Aldridge et al., 2012) than its sister which is longer and elongates faster. On the other hand, the longer, faster-growing daughter is more tolerant to rifampicin (RIF), than the shorter, slower daughter at the early stages of cell division (Richardson et al., 2016). However, other studies have not observed differential susceptibility to antibiotics based on cell length and elongation rates (Santi et al., 2013). In M. smegmatis both short and long size resting cells were generated under different starvation models, and both the types of cells were found to be tolerant to antibiotics (Wu et al., 2016). In M. smegmatis sub-populations of cells were observed to grow, divide, and die during the persistence phase of isoniazid killing, and this was independent of single-cell growth rates (Wakamoto et al., 2013). It is also observed that cell size- and density-specific subpopulations exist in mycobacteria, and long cell size is associated with tolerance to host and antibiotic stress conditions (Vijay et al., 2017). Antibiotic tolerant cells can also give rise to antibiotic-resistant cells in M. tuberculosis during antibiotic treatment, possibly due to growth under antibiotic selection pressure (Wakamoto et al., 2013; Sebastian et al., 2017).
Mechanisms explaining heterogeneity in mycobacterial cell length are emerging from recent studies on mycobacterial cell biology (Kieser and Rubin, 2014). Asymmetric cell division is commonly observed in mycobacteria increasing cell-length heterogeneity in the population (Kieser and Rubin, 2014). Asymmetric cell division is due to mechanisms unique to mycobacteria which have only been partly clarified (Hett and Rubin, 2008). These include differential elongation rates of mycobacterial cell poles (Hett and Rubin, 2008; Aldridge et al., 2012; Kieser and Rubin, 2014), asymmetric localization of cell division proteins (Joyce et al., 2012; Singh et al., 2013), and asymmetric positioning of the septum toward the new cell pole and size-dependent growth, where the longer old-pole daughter elongates at faster velocity than its shorter new-pole sibling (Santi et al., 2013). It has also been observed that mycobacterial cells inheriting an old pole are able to elongate faster than the cells inheriting a new pole (Aldridge et al., 2012). Cells inheriting an old pole have longer cell length at birth and elongate faster compared to cells inheriting a new pole (Santi et al., 2013). Study of the distribution of irreversibly oxidized proteins (IOPs) in M. smegmatis and M. tuberculosis has revealed that the IOPs are associated with chaperone ClpB, and get asymmetrically distributed between progeny cells during cell division (Vaubourgeix et al., 2015). The progeny cells inheriting a higher level of IOPs grow slowly and are more susceptible to antibiotics (Vaubourgeix et al., 2015). In both M. smegmatis and M. tuberculosis segresomes asymmetry may also contribute to asymmetric growth and division of cells (Ginda et al., 2017). Supporting these observations deletion of mycobacterial cellular factor LamA involved in asymmetry in cell pole growth reduces both cell size heterogeneity and antibiotic tolerance in M. smegmatis and M. tuberculosis strains (Rego et al., 2017). Ultrastructural studies have revealed enhanced asymmetric cell division, and other cellular adaptations associated with multidrug resistance (Farnia et al., 2010). Hence, cell-length heterogeneity in mycobacterial population is established during cell elongation and division, generating long and short cells, contributing to antibiotic tolerance (Vijay et al., 2014a,b, 2017).
In addition, host stress factors may further increase the phenotypic heterogeneity in mycobacterial population. As observed in a murine M. tuberculosis infection model system, presence of host interferon-gamma results in a subpopulation of M. tuberculosis cells which can persist during isoniazid (INH) treatment (Manina et al., 2015). In this study increased M. tuberculosis cell length and heterogeneity in size distribution were also observed in wild-type mice compared to in vitro culture or in interferon-gamma-deficient mice (Manina et al., 2015). Host immune activation of macrophages also induces antibiotic tolerance in M. tuberculosis cells (Liu et al., 2016).
Thus, various studies suggest that cell-length heterogeneity exists in M. tuberculosis and possibly contributes to host and antibiotic stress tolerance. There is, however, limited knowledge regarding the manifestations of cell-length distribution in clinical M. tuberculosis strains, the impact of host stress on the cell-length distribution, and the clinical consequences. Most of the research conducted on mycobacterial cell size heterogeneity has used laboratory strains of mycobacteria, which may not represent the disease-causing strains freshly isolated from patients. In clinical conditions M. tuberculosis also grows and divides in human macrophages, evading macrophage-mediated killing. Thus, it is important to replicate the stress factors induced by macrophages on the bacteria when studying the consequences to the cell-length distribution.
We hypothesized that the host environment influences the cell-length distribution in clinical M. tuberculosis strains. In addition to the host stress, we also investigated the antibiotic-resistant phenotype which alters cellular physiology (Koch et al., 2014) and may also contribute to the cellular heterogeneity. We studied the cell-length distribution in 158 clinical M. tuberculosis strains including MDR strains, under different host stress conditions. We investigated M. tuberculosis cell-length distribution in sputum from pulmonary TB (PTB) patients. M. tuberculosis strains cultured from these sputum samples were examined for their cell-length distributions in a macrophage infection model, compared to their respective in vitro culture. We also investigated the associations of M. tuberculosis cell-length distribution with M. tuberculosis lineages, oxidative stress, iron deficiency, antibiotic-resistant strains, and TB severity in patients.
Materials and Methods
Bacterial Isolates
Mycobacterium tuberculosis isolates used in this study (Figure 1) were collected from patients with PTB. Between January 2015 and October 2016, 158 PTB patients were recruited from two district TB control units in Ho Chi Minh City (HCMC), Vietnam. Patients were ≥18 years of age, had clinical symptoms of active PTB, which was confirmed by chest X-ray and positive sputum culture, and all were HIV uninfected.
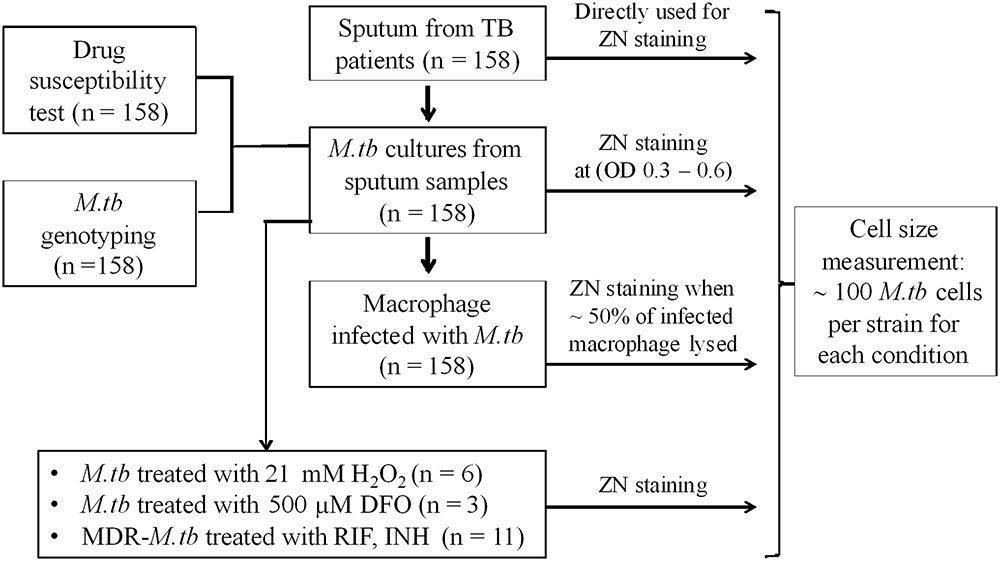
FIGURE 1. Study design.
Ethics Statement
All patients recruited for the study were ≥18 years of age, written informed consent was obtained from each patient in accordance with the Declaration of Helsinki. Protocols were approved by the human subjects review committees, at the Hospital for Tropical Diseases HCMC, Vietnam (124/BVBNÐ.HÐÐÐ) and the Oxford Tropical Research Ethics Committee, United Kingdom (OxTREC Reference: 16-14). Baseline characteristics of patients were collected during the recruitment for the study.
Sputum Collection and Bacterial Growth
Sputum was collected from 158 PTB patients, before initiation of anti-tuberculosis treatment, all the M. tuberculosis samples were handled in biosafety level-3 laboratory. All sputum samples were subject to Ziehl-Neelsen (ZN) staining and microscopy. M. tuberculosis strains were then isolated from sputum by culture in 7H9 liquid medium. These clinical strains were stored as glycerol stocks and were used for further experiments with limited number (∼2–3) of sub-culturing to avoid phenotypic/genotypic changes. For mid-log culture conditions, 50 ml culture tubes with 10 ml 7H9T medium [7H9 broth supplemented with 10% Oleic acid/Albumin/Dextrose/Catalase (OADC) enrichment, and 0.05% Tween 80, BD DifcoTM] were inoculated with the clinical isolates and a laboratory strain H37Rv, incubated at 37°C with shaking. Samples for ZN staining and microscopy were performed at OD600 of 0.3–0.6.
Mycobacterium tuberculosis lineage identification: M. tuber culosis lineages were identified by large sequence polymorphism (LSP) typing (Gagneux et al., 2006). M. tuberculosis DNA was extracted from cultures on LJ media (Becton Dickinson, United States) by cetyltrimethyl ammonium bromide (CTAB) method. M. tuberculosis cells were dispersed in 600 μl TE buffer (10 mM Tris pH 8.0 and 1 mM EDTA), followed by heating the tube at 80°C for 20 min. Fifty microliters of lysozyme 10 mg/ml was added; the cell suspension was mixed well by vortexing and incubated overnight at 37°C. Next, 10 μl of proteinase K (10 mg/ml) and 35 μl of SDS 20% were added and incubated at 55°C for 30 min. Following this, to the suspension 100 μl 5 M NaCl and 100 μl 5% CTAB solution (5% CTAB and 0.5 M NaCl) were added and incubated at 60°C for 15 min. Two phases of DNA and protein-cell debris were separated by the addition of 700 μl chloroform and centrifugation at 12,000 × g for 5–10 min. The DNA phase was separated and precipitated with 0.6 volume of isopropanol by centrifugation at 13,000 × g for 15 min. DNA was washed with 70% ethanol, air-dried, and re-suspended in 40–80 μl TE buffer or distilled water.
Large sequence polymorphisms were then defined by the following method (Tsolaki et al., 2005; Caws et al., 2008); all the strains were first characterized for RD239 and RD105 deletion by PCR, as the majority of isolates were anticipated to contain one of these two deletions. Isolates bearing RD239 deletion were defined as Indo-Oceanic genotype while isolates bearing RD105 deletion were defined as East-Asia/Beijing genotype. The amplification using RD105 primers produced a product of 4 kb in the control H37Rv while it was 850 kb in isolates bearing RD105 deletion. Likewise, product from amplification using RD239 primers was 1.8 kb in control H37Rv and was shorter in isolates bearing RD239 deletion. Isolates without RD105 or RD239 were further defined for the Euro-American lineage by PCR to detect the deletion of 7 bp in the pks gene. Isolates bearing a deletion of 7 bp produced two bands of 520 and 259 bp whereas isolates without the deletion produced a single band of 520 bp.
Macrophage Growth and Infection
J774 mouse macrophages (J774 murine cell line, J774A.1, ATCC TIB-67) were infected with the clinical M. tuberculosis strains and H37Rv. One day prior to infection, 24-well plates were seeded with 8 × 10⁴ J774 cells (measured from slides with grid chamber, KOVA Glasstic Slide) in 1 ml complete medium [RPMI 1640 medium plus 10% FBS, 1% L-glutamine, 1% penicillin, and streptomycin (STR), Sigma–Aldrich]. On the day of infection, old medium was removed and fresh pre-warmed infection medium (RPMI 1640 medium plus 10% FBS, 1% L-glutamine) was added. M. tuberculosis cultures at OD600 of 0.5–0.6 were vortexed with beads to remove the clumps, and this culture was diluted in pre-warmed uptake buffer to obtain a multiplicity of infection 4 (MOI) in macrophages. Plates were incubated at 37°C and 5% CO2. After 3 days post-infection, extracellular M. tuberculosis cells were washed off and the new infection medium was added. Infected macrophages were observed by light microscopy daily, to ascertain host cell lysis. When ∼50% of J774 cells were lysed (6–7 days post-infection), cells were collected by trypsinization and smears were prepared for ZN staining. For macrophage infection along with RIF treatment of MDR-TB strains, 24-well plates were seeded with 2.5 × 10⁵ THP1 cells (THP1 human cell line, 88081201, Sigma–Aldrich) (measured from slides with grid chamber, KOVA Glasstic Slide). THP1 cells were induced by 100 nM phorbol 12-myristate 13-acetate (PMA, Sigma–Aldrich) for 48 h and then grown in PMA-free complete medium for at least 24 h. Prior to the infection, M. tuberculosis cells grown in 7H9 medium to OD600 0.5–0.8 were bead beaten to remove the clumps and then diluted to final volume of 1 ml in uptake buffer for THP1 infection at MOI = 1. Plates were incubated at 37°C and 5% CO2. After 4 h post-infection, extracellular M. tuberculosis cells were removed by washing and new infection medium was added. Twenty-four hours post-infection, infected THP1 macrophages were treated with the fresh medium containing RIF (Sigma–Aldrich) at a final concentration of 1 μg/ml representing 1× minimum inhibitory concentration (MIC). For RIF untreated control set the old medium was replaced with the fresh medium alone. Daily observation of cell lysis was performed with light microscopy. Once cell lysis reached ∼50% in both THP1 sets with and without RIF treatment, then they were harvested as described above.
H2O2 Stress and Iron Deficiency
Liquid cultures of M. tuberculosis clinical strains and H37Rv in 7H9T medium at OD600 of 0.3–0.4 were treated with H2O2 (Merck) at a concentration of 21 mM for 48 h at 37°C, as described with slight modification in the concentration (Voskuil et al., 2011). M. tuberculosis smears were prepared from the treated and untreated control samples for ZN staining. For iron deficiency M. tuberculosis strains were grown in 7H9T medium containing an iron chelator, deferoxamine (DFO) mesylate salt (Sigma–Aldrich), at a final concentration of 500 μM (Pal et al., 2015) in 10 ml liquid medium in 50 ml culture tubes and incubated at 37°C. When the cultures reached OD600 0.3–0.4, smears were prepared along with untreated control for ZN staining.
Drug Susceptibility Test (DST)
Drug susceptibility test was performed using BACTECTM MGITTM 960 SIRE Kit (BD), according to the manufacturer guidelines. Drug susceptibility was tested for STR (1.0 μg/ml), INH (0.1 μg/ml), RIF (1.0 μg/ml), and ethambutol (EMB, 5.0 μg/ml).
Rifampicin and Isoniazid Treatment
Multidrug-resistant-tuberculosis strains were grown on LJ medium and colonies were scraped and re-suspended in 15 ml Falcon tube containing 5 ml 0.9% NaCl, 0.2% Tween 80, and 10 glass beads. The tube was vortexed and absorbance of suspension was measured at OD600 and turbidity was adjusted to 0.08–0.1 OD (equivalent to 0.5 McFarland). Hundred microliters of the suspension was transferred into a tube containing 10 ml of 7H9T broth supplemented with 10% OADC, to give an inoculum of ∼1 × 10⁵ cfu/ml. From this inoculum, 100 μl was dispensed into each well of UKMYC3 Sensititre Plates (Thermo scientific) containing different concentrations of RIF and INH. The plates were incubated for 14 days at 37°C and M. tuberculosis cells grown in the wells were harvested for ZN smears.
Cell-Length Measurements and Statistical Analysis
Ziehl-Neelsen stained slides were observed by light microscopy (Olympus) with a 100× oil immersion objective. Images were acquired using a DP21 Olympus camera and cellScens imaging software (Olympus). Cell-length measurements were carried out using ImageJ (Schneider et al., 2012), individual cell lengths were measured manually using segmented line in ImageJ by tracking along the cell as the sum of short linear segments (Santi et al., 2013). About 100 cell-length measurements were taken in each M. tuberculosis strain under each growth condition. To evaluate the cell size heterogeneity of M. tuberculosis strains in different environments, values of mean, standard deviation (SD), and coefficient of variation (CV, defined by the SD divided by the mean) were employed. We either combined cell-length measurements from all M. tuberculosis strains or represented individual M. tuberculosis strains under a specific growth condition or group in the cell size heterogeneity analysis. We presented M. tuberculosis cell-length distribution with a 0.02 μm window of cell size histogram. Furthermore, we perform maximum-likelihood estimation for the observed M. tuberculosis cell length with the assumption that M. tuberculosis cell length has log normal distribution. The estimates are shown in Supplementary Table S1. To directly compare M. tuberculosis cell size among strains and different growth conditions, we grouped individual M. tuberculosis strains in sputum based on mean and SD of cell size using convex hull (where the convex hull of a data set is defined as minimal convex set that contains all of its data points). To understand adaptations of M. tuberculosis clinical isolates in different environments at the population level, we collected a large number of M. tuberculosis cells and measured the length of more than 45,000 cells (158 strains × 100 cells per isolate × 3 in sputum samples, infected macrophages, and cultures). We applied a non-parametric comparative distribution test (e.g., Kruskal–Wallis) and it gave very small P-values (<10-10) in all comparisons between different environments. To focus on biological significance, instead of using the Kruskal–Wallis test, we used the Bootstrap method and reported the confidence interval (CI) values. To determine the extent of cell-length variation or effect size between different growth conditions we measured the differences in the mean cell length between groups by using a bootstrapping method (Nakagawa and Cuthill, 2007). We fixed the number of iteration at 1000 and subsample size at 300. At each iteration, we recorded the difference in mean cell length between groups. In our analysis, we used 300 cells for subsample size because we performed the test with 250, 300, and 400 cells and we did not observe any significant difference between them. The 95% CI is defined by the 2.5 to 97.5% quantile. When difference in mean cell length and 95% CI for a group does not include zero then there is a significant difference in mean cell length between that group and control group (Nakagawa and Cuthill, 2007). All analyses and plots generation were implemented in Matlab R2013a (Georgescu et al., 2012). For individual M. tuberculosis strains, P-values of cell size distribution were determined by using ANOVA for comparison of more than two groups, and Mann–Whitney to compare two groups in GraphPad Prism software.
Results
M. tuberculosis Cell-Length Distribution in Sputum, Macrophage Infection, and Liquid Culture
We analyzed M. tuberculosis cell-length distribution in ZN stained smears directly from the sputum samples from 158 untreated PTB patients. Cell-length distribution of M. tuberculosis strains isolated from these sputum samples were also analyzed in infected macrophages, and in their corresponding liquid cultures (Figure 1). This allowed us to determine and compare the extent of M. tuberculosis cell-length distribution in both intracellular and extracellular host environments (Figure 2 and Supplementary Figure S1). To quantify M. tuberculosis cell-length distribution in different growth conditions, we analyzed the mean, SD, and CV of M. tuberculosis cell-length distribution and compared these values between different growth conditions. Cell-length measurements from clinical M. tuberculosis strains were combined (n ∼158 × 100) in each growth condition and compared between host conditions and liquid culture (Figure 2A). M. tuberculosis cells under host conditions had a wider range of cell lengths, with a CV (mean and SD) of 0.44 (3.0 ± 1.3 μm) in sputum and 0.49 (3.2 ± 1.5 μm) under macrophage infection (Figure 2A), compared with the narrow cell-length distribution seen in liquid culture 0.42 (2.2 ± 0.9 μm) (Figure 2A). As the cell lengths of M. tuberculosis strains were increased in host conditions than in culture, we further analyzed the differences in mean cell length between different conditions. This revealed the extent of difference in the cell-length distribution of M. tuberculosis between culture versus sputum or macrophage infection (Figure 2B). M. tuberculosis cell length increased in sputum and macrophage infection compared to liquid culture, with mean cell-length differences of 0.8 μm (95% CI = 0.63–1.06) in sputum and 1.0 μm (95% CI = 0.78–1.28) in macrophage infection (Figure 2B). Indicating that, increased cell length in M. tuberculosis is associated with host conditions compared to liquid culture.
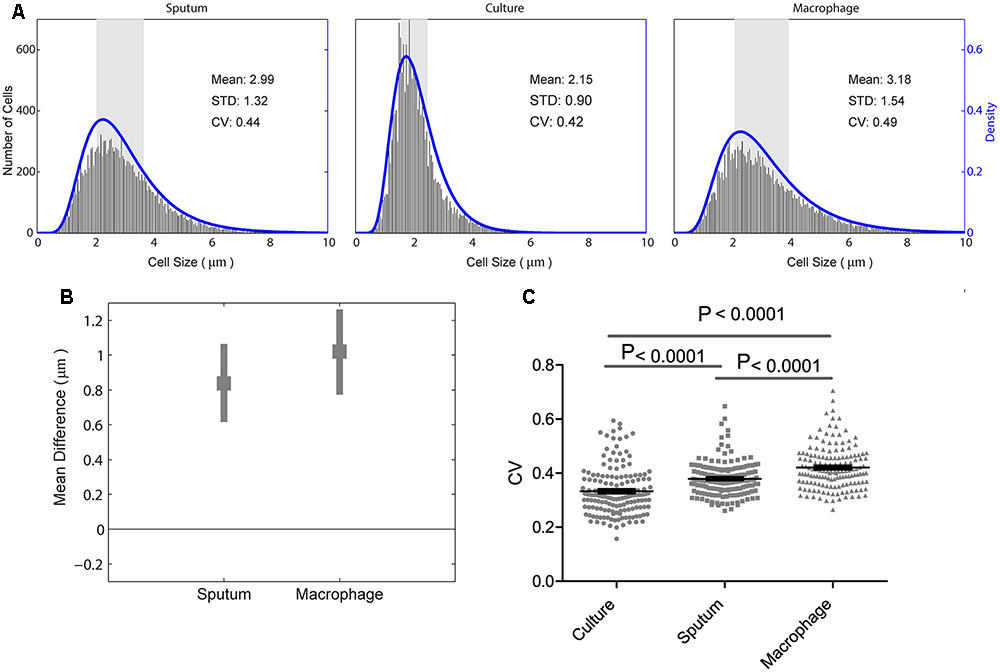
FIGURE 2. Mycobacterium tuberculosis cell-length distribution and CV between sputum, macrophage infection, and culture. (A) Absolute number of M. tuberculosis cell-length distribution (corresponding to right y-axis) combined from all the strains in sputum, culture, and infected macrophages (macrophage) are shown. The blue lines (corresponding to the right y-axis) are maximum-likelihood estimation for M. tuberculosis cell-length distribution. The gray rectangle represents the interquartile range of cell length. (B) Difference in mean M. tuberculosis cell length was compared between liquid culture and host conditions such as sputum and infected macrophages. Average mean difference (gray square dots) and 95% confidence interval (CI) (gray bars) of cell length in sputum, infected macrophages compared to liquid culture (base line corresponding to zero) by bootstrap method. If the average mean difference and 95% CI does not include zero for a group, then there is a significant difference in the mean cell length between that group and the base line. (C) Individual M. tuberculosis strains CV in culture, sputum, and infected macrophages, P-values by ANOVA, and Mann–Whitney test. SD, standard deviation; CV, coefficient of variation.
Individual M. tuberculosis strains displayed a wide range of CVs from 0.2 to 0.7 in different growth conditions (Figure 2C) and increased CV under host conditions like sputum and macrophage infection than culture (P < 0.0001) (Figure 2C). To investigate if there is any correlation in the cell length of individual M. tuberculosis strains between different growth conditions, we plotted the mean and SD of each strain (n = 158, Supplementary Figure S2). We observed that the individual M. tuberculosis strains cell length can be divided into three groups as short, medium, and long in sputum based on their mean and SD of cell-length distribution (Supplementary Figure S2). From these three groups, individual M. tuberculosis strains cell length was correlated with their respective cell length under macrophage infection and in culture (Supplementary Figure S2). Individual M. tuberculosis strains in these three cell length groups from sputum underwent significant redistribution, as observed by the change in their respective mean and SD of cell length under macrophage infection and culture (Supplementary Figure S2). Indicating that individual clinical M. tuberculosis strains display a wide range of cell-length distribution, and for a given M. tuberculosis strain, cell-length distribution in one condition does not correlate with the distribution seen in another growth condition. Whereas by combining their cell lengths in each condition, we can investigate the overall association of cell length with different growth conditions.
The Cell-Length Distribution of M. tuberculosis Strains Is Independent of Lineage
To measure lineage-specific correlation with M. tuberculosis cell-length distribution, we analyzed the cell-length distribution of major M. tuberculosis lineages prevalent in Vietnam, under host-like growth conditions including sputum and macrophage infection as well as in nutrient rich growth medium. We observed that there was no significant difference in the cell lengths between Euro-American or Indo-Oceanic versus East Asian (Beijing) lineage in sputum with mean cell-length differences of 0.0 and 0.3 μm (95% CI = -0.25 to 0.22 and 0.11–0.63), in culture -0.1 and 0.1 μm (95% CI -0.31 to -0.01 and -0.04 to 0.31) and under macrophage infection 0.1 and 0.0 μm (95% CI -0.17 to 0.43 and -0.30 to 0.28), respectively (Supplementary Figure S3A). The CV (mean and SD) of cell-length distribution combined from all M. tuberculosis strains in each of East-Asian (Beijing), Euro-American, and Indo-Oceanic M. tuberculosis lineages was determined under sputum [0.44 (2.8 ± 1.2 μm), 0.42 (2.8 ± 1.2 μm), and 0.43 (3.2 ± 1.3 μm)], culture [0.39 (2.1 ± 0.8 μm), 0.39 (1.9 ± 0.7 μm), and 0.43 (2.2 ± 0.9 μm)], and macrophage infection [0.48 (3.1 ± 1.5 μm), 0.51 (3.2 ± 1.6 μm), and 0.46 (3.1 ± 1.4 μm)], respectively (Supplementary Figure S3B). Indicating that mean cell length did not show any significant increase between different lineages, but in each lineage we also observed increased M. tuberculosis cell length under host conditions like sputum and macrophage infection compared to culture (Supplementary Figure S3B). Thus, M. tuberculosis cell-length distribution is independent of M. tuberculosis lineages, but strongly dependent on growth conditions like host conditions and liquid culture.
Drug Resistance Increased M. tuberculosis Cell Length in Sputum and Macrophage Infection Compared to Culture
Because mycobacterial cell length may be one of the factors contributing to drug tolerance in laboratory strains of antibiotic sensitive mycobacteria (Richardson et al., 2016; Vijay et al., 2017), we next examined whether MDR strains have different cell-length distributions than drug-sensitive strains by analyzing the cell-length distribution of drug-sensitive and -resistant M. tuberculosis strains. We measured drug susceptibility in each strain to STR, INH, RIF, and EMB. Using these drug resistance profiles we grouped M. tuberculosis strains as (1) susceptible to all four drugs (n = 72), (2) resistant to at least one drug but not to INH and RIF (n = 75), and (3) MDR resistant to at least to INH and RIF (n = 11). MDR strains displayed increased cell lengths in sputum with mean cell-length differences of 0.5 μm (95% CI = 0.25–0.81) and in macrophage infection 0.3 μm (95% CI = 0.05–0.70) compared to sensitive strains (Figure 3A and Supplementary Figure S1B). Whereas other resistant strains did not show any such significant difference in cell length in sputum with mean cell-length differences of 0.0 μm (95% CI = -0.30 to 0.22) and in macrophage infection 0.0 μm (95% CI = -0.33 to 0.25) compared to sensitive strains (Figure 3A). Further under liquid culture condition no such significant difference in cell length was observed between resistant and MDR strains with the mean cell-length differences of 0.0 and -0.0 μm (95% CI = -0.14 to 0.21 and -0.24 to 0.08), respectively, compared to sensitive strains (Figure 3A). The CV (mean and SD) of cell size distribution combined from all M. tuberculosis strains in each of sensitive, resistant, and MDR groups was determined under sputum [0.43 (3.0 ± 1.3), 0.45 (3.0 ± 1.4), and 0.45 (3.5 ± 1.6)], culture [0.42(2.2 ± 0.9), 0.42 (2.2 ± 0.9), and 0.43 (2.1 ± 0.9)], and macrophage infection [0.48 (3.2 ± 1.5), 0.47 (3.2 ± 1.5), and 0.47(3.5 ± 1.7)], respectively (Supplementary Figure S4A). Thus, MDR strains displayed increased cell lengths under host conditions like sputum and macrophage infection compared to sensitive and other resistant strains. Indicating that host stress and antibiotic resistance phenotype can increase the cell lengths of clinical M. tuberculosis strains.
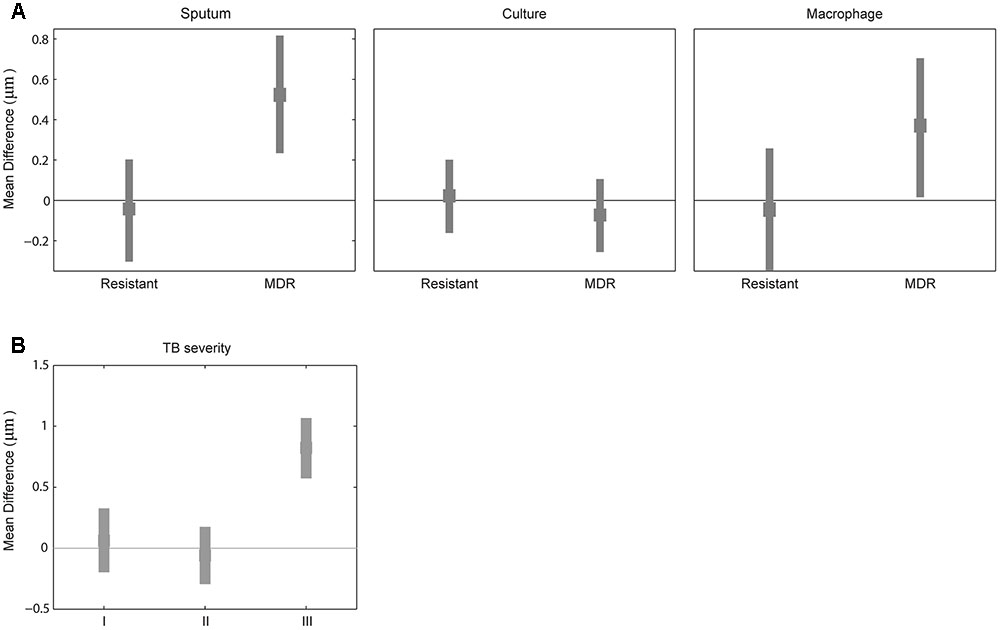
FIGURE 3. Difference in mean cell length between sensitive and resistant strains or by TB severity. (A) Difference in mean M. tuberculosis cell length between sensitive (line corresponding to zero) and other two (resistant and MDR) M. tuberculosis strains from sputum, culture, and macrophage. (B) Difference in mean M. tuberculosis cell length between patients sputum without blood and cavitary lesions (base line corresponding to zero) and different TB severity (I) with bloody sputum and without cavitary lesions, (II) without bloody sputum but with cavitary lesions, and (III) with both bloody sputum and cavitary lesions by bootstrap method.
MDR-TB and Severe Tuberculosis Patients with Bloody Sputum and Lung Cavitary Lesions Exhibit Increased M. tuberculosis Cell Length
We classified tuberculosis patients based on clinical severity at the beginning of treatment into four groups: subjects with non-bloody sputum and cavitary lesions on chest X-ray (n = 111 cases including five MDR-TB), those with bloody sputum and no cavitary lesions (n = 10 cases including two MDR-TB); those without bloody sputum and with cavitary lesions (11 cases without any MDR-TB); and with bloody sputum and cavitary lesions (three cases including two MDR-TB). We observed increased M. tuberculosis cell length in sputum from patients with bloody sputum and cavitary lesions (Supplementary Figures S1C,D), with a mean cell-length difference of 0.8 μm (95% CI = 0.56–1.07) compared to baseline and other two clinical severities groups with mean cell-length differences of 0.0 μm (95% CI = -0.18 to 0.33) and 0.0 μm (95% CI = -0.28 to 0.19) (Figure 3B). We also observed that patients with both bloody sputum and cavitary lesions displayed increased mean cell-length distribution (3.7 μm ± 1.4) compared to other three groups (2.9 μm ± 1.3, 2.8 μm ± 1.3 and 2.9 μm ± 1.4) (Supplementary Figure S4B). Although we had very few severe TB cases analyzed in our study (n = 3), it indicated that severe TB conditions may be associated with increased M. tuberculosis cell-length distribution. This needs to be further validated by analyzing more patients with severe TB.
Oxidative Stress and Iron Deficiency Increased Cell-Length Distribution in Clinical M. tuberculosis Strains
We found host environments such as sputum and macrophage infection were associated with increased cell length in M. tuberculosis strains; we next investigated the influence of specific host factors on M. tuberculosis cell-length distribution. The mid-log culture of five clinical M. tuberculosis strains and H37Rv was treated with 21 mM concentration of H2O2 for oxidative stress and cell length was measured. We observed that H2O2 treatment resulted in significant increase of cell-length distribution and CV in clinical M. tuberculosis strains compared to untreated control (Figures 4A,C,D). But lab strain H37Rv in response to H2O2 treatment did not show such an increase in cell-length distribution and CV compared to clinical M. tuberculosis strains (Figures 4A,D). Similarly, clinical M. tuberculosis strains grown in the presence of iron deficiency induced by DFO mesylate salt at 500 μM concentration displayed increase in cell-length distribution and CV (Figures 4B–D); H37Rv grown in the presence of iron deficiency also displayed increase in cell-length distribution and CV, but to a lesser extent compared to clinical M. tuberculosis strains (Figures 4B,D). These results illustrate that host stress factors such as oxidative stress and iron deficiency can induce increased cell-length distribution and CV in M. tuberculosis, similar to that seen under sputum and macrophage infection.
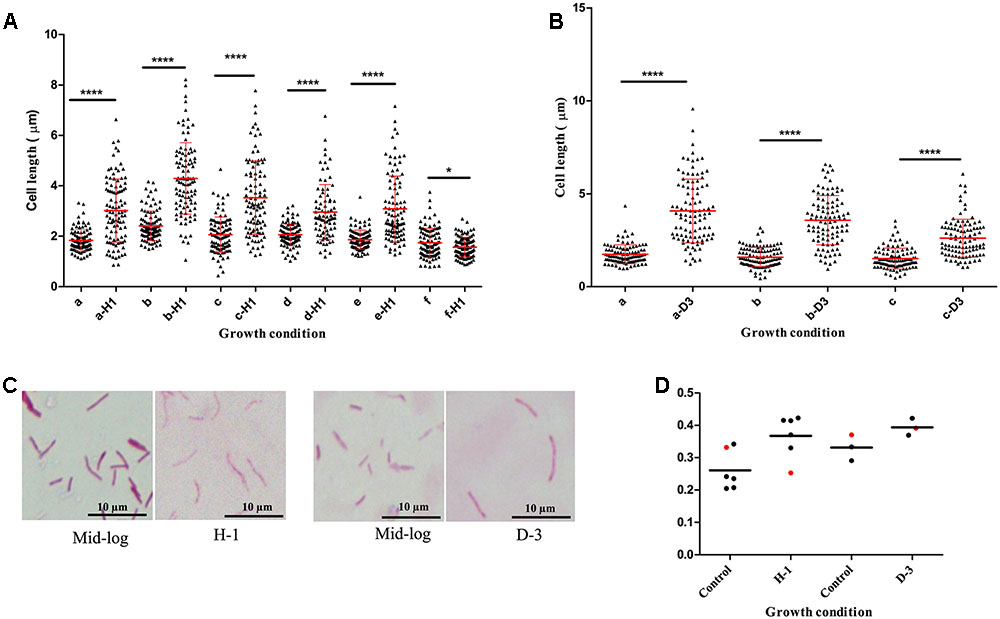
FIGURE 4. Mycobacterium tuberculosis cell-length distribution in individual strains under oxidative stress and iron deficiency. (A) M. tuberculosis cell-length distribution under oxidative stress (a-H1 to e-H1) five clinical M. tuberculosis strains and (f-H1) laboratory strain H37Rv treated with 21 mM H2O2 along with respective untreated mid-log controls (a–f). (B) M. tuberculosis cell-length distribution under iron deficiency (a-D3 and b-D3) two clinical M. tuberculosis strains, and (c-D3) laboratory strain H37Rv treated with 500 μM DFO along with respective untreated mid-log controls (a–c). In each strain n = 100 cell length in each condition. P-values by Mann–Whitney U-test, ∗P < 0.05, ∗∗P < 0.01, ∗∗∗P < 0.001, and ∗∗∗∗P < 0.0001. (C) ZN staining of a clinical M. tuberculosis strain from oxidative stress (H-1) and iron deficiency (D-3) along with mid-log controls. (D) CV of M. tuberculosis strains from oxidative stress (H-1) and iron deficiency (D-3), black circle indicates clinical M. tuberculosis strains and red circle represents H37Rv. DFO, deferoxamine mesylate salt.
Rifampicin Treatment Increased Cell-Length Distribution in MDR-TB Strains
To probe the influence of antibiotic treatment on the cell-length distribution in M. tuberculosis strains, we cultured selected clinical MDR-TB strains with below MIC, MIC, and above MIC concentrations of RIF and INH (Figure 5A and Supplementary Figure S5). Since MDR-TB strains can grow and divide in the presence of these antibiotics and exhibit the influence of RIF and INH treatment on their cell-length distribution. When four individual MDR-TB strains were cultured under different concentrations of RIF and INH (Figure 5A and Supplementary Figure S5), we observed that treatment with different RIF concentrations significantly (P ≤ 0.0001, ANOVA) increased cell-length distributions in two of the MDR-TB strains compared to respective untreated control (Figure 5A). In other two MDR-TB strains, only moderate increase in the cell-length distributions was observed (P = 0.01 and 0.40, ANOVA) (Figure 5A). For three of the MDR-TB strains treated with different concentrations of INH, we observed only moderate increases in cell length compared to untreated control (P = 0.001, 0.002, and 0.16) (Supplementary Figure S5). But one MDR-TB strain grown under different concentrations of INH showed significant increase in cell-length distribution (P < 0.0001, ANOVA) (Supplementary Figure S5). These results indicate a possible role of RIF treatment in increasing cell-length distribution in MDR-TB strains.
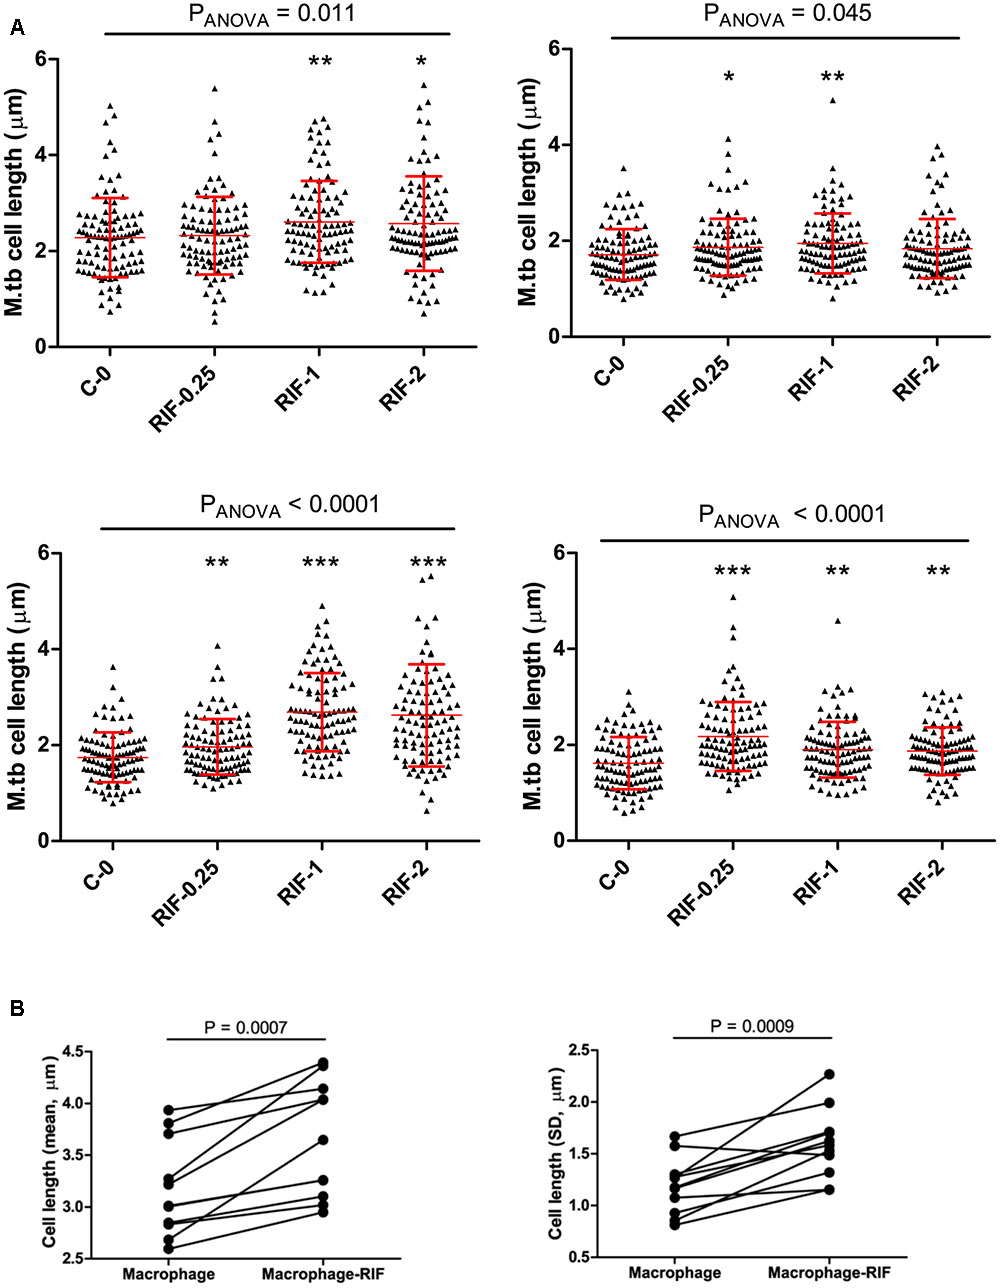
FIGURE 5. Cell length of MDR-TB strains under rifampicin and macrophage infection with Rif treatment. (A) MDR-TB strains (n = 4) cell-length distribution under different concentrations of RIF (μg/ml), MIC = 1.0 μg/ml, C-0 indicates no Rif. Comparisons across multiple groups of RIF concentrations were performed by one-way analysis of variance (ANOVA), comparisons of two groups by Mann–Whitney test. P-values by Mann–Whitney U-test between C-0 and RIF treatment, ∗P < 0.05, ∗∗P < 0.01, and ∗∗∗P < 0.001. (B) Mean and standard deviation (SD) of cell lengths of MDR-TB strains (n = 11) under macrophage infection and macrophage infection with RIF treatment at 1 μg/ml. Around 100 cells were measured in each MDR-TB strains. P-values by Mann–Whitney test.
Rifampicin and Macrophage Infection Synergistically Increase Cell-Length Distributions in MDR-TB Strains
Because we observed that both host stress conditions and RIF treatment enhanced cell length in MDR-TB strains, we next investigated is there any synergistic effect between the two conditions in increasing cell length in MDR-TB strains. Individual MDR-TB strain cell length in macrophage infection was compared with cell length in macrophage infection along with RIF treatment at 1 μg/ml concentration (Figure 5B). The results indicated that macrophage infection along with RIF treatment displayed synergism in increasing the cell lengths of MDR-TB strains than macrophage infection alone in MDR-TB strains (n = 11, P = 0.0007 and 0.0009) (Figure 5B).
Discussion
Mycobacterium tuberculosis cell-length variations may be one of the factors influencing tolerance to host and antibiotics stress (Richardson et al., 2016; Vijay et al., 2017). We hypothesized that the host factors and antibiotic-resistant phenotype can influence M. tuberculosis cell-length distribution. Using an extensive analysis of cell-length variation in a large number of clinical isolates, we found that host conditions such as sputum and macrophage infection display increased M. tuberculosis cell length compared to in vitro culture. Under host conditions, host stress may be associated with increased cell length in M. tuberculosis strains. Oxidative stress and iron deficiency are some of the prominent host stresses encountered by M. tuberculosis during its growth inside the host (Lee et al., 2008; Chawla et al., 2012; Wells et al., 2013). We analyzed M. tuberculosis cell-length distribution under these host stress conditions and found increased cell-length distribution in M. tuberculosis strains. The results indicate that host stress is associated with increased cell length in M. tuberculosis strains as also observed in M. tuberculosis infection in mice (Manina et al., 2015). In the laboratory strain H37Rv we did not observe a similar increase in cell-length distribution as measured in clinical M. tuberculosis strains, indicating possible differential regulation of cellular processes in clinical M. tuberculosis strains under host stress conditions, as clinical M. tuberculosis strains are adapted to the host environment better than laboratory strains.
Other factors contributing to increased cell-length distribution were MDR/RIF-resistant phenotype under host conditions and during growth under RIF treatment. In addition to MDR-TB, there may also be RIF and INH heteroresistance where subpopulations of RIF- and INH-resistant M. tuberculosis cells can coexist with predominantly sensitive strains as observed in TB patients (Hofmann-Thiel et al., 2009). Both MDR-TB strains under host conditions and RIF heteroresistance under RIF treatment may contribute to increasing M. tuberculosis cell-length distribution in patients. INH treatment of sensitive M. tuberculosis strains in vitro resulted in cell size reduction (Manina et al., 2015), whereas MDR-TB strains cultured under INH did not exhibit any cell size reduction. Further we have observed synergistic increase in cell-length distribution among MDR-TB strains under macrophage infection along with RIF treatment. Supporting these observations, M. tuberculosis infection of macrophages along with anti-TB drugs treatment increased redox heterogeneity in both sensitive and resistant clinical isolates. Redox heterogeneity in M. tuberculosis cells also generates sub-populations with differential susceptibility to antibiotics (Bhaskar et al., 2014). Another factor influencing growth rate of M. tuberculosis during macrophage infection was MOI of infection. As low and high MOI of M. tuberculosis infection of macrophages resulted in different intracellular growth rate but similar level of antibiotic susceptibility (Raffetseder et al., 2014). The link between MOI of infection, growth rate, and cell-length distribution of M. tuberculosis during macrophage infection needs further investigation. Clinically, we also observed increased M. tuberculosis cell-length distribution in sputum samples from patients with severe form of TB, having both blood in sputum and lung cavitary lesions compared to patients lacking such severe TB symptoms. These observations reveal that M. tuberculosis strains exhibit increased cell-length distribution under diverse clinically associated conditions.
Evidence for the advantages of such cellular adaptations for the emergence of stress-tolerant subpopulations is emerging in microorganisms. Recent studies in Escherichia coli have shown differential partitioning of efflux pumps between parental and daughter cells, depending on the age of cell pole in rod-shaped bacteria, leading to cell-to-cell variations in antibiotic tolerance (Bergmiller et al., 2017). Asymmetric distribution of IOPs in progeny cells of mycobacteria also leads to differential susceptibility to antibiotics (Vaubourgeix et al., 2015). It has also been observed that there is difference in the density of membrane vesicles between long and short cells in mycobacteria (Vijay et al., 2017). These observations indicate that emergence and increase in cell-to-cell variations facilitate differential susceptibility to stress conditions in bacteria.
Currently, we have limited understanding about the influence of host factors on the cell elongation and division of M. tuberculosis cells. Recently, it has been observed that changing to less optimal carbon sources results in reduced cell elongation rate and increased interdivision time resulting in mean cell size differences in M. smegmatis cells (Priestman et al., 2017). Our study shows that host factors such as oxidative stress and iron deficiency may influence cell growth and division in M. tuberculosis strains, their influence on M. tuberculosis cell biology needs to be investigated further in detail. Host stress and antibiotic resistance may also induce stringent response in M. tuberculosis cells, which may contribute to increased cell-length distribution. It has been shown that in mycobacteria, modified nucleotide (p)ppGpp is synthesized by Rel enzyme during stringent response under starvation (Avarbock et al., 2005), which acts as a bacterial alarmone, and enables to regulate cell size and morphogenesis (Gupta et al., 2016; Wu et al., 2016). Interestingly, RIF resistance is also associated with induction of (p)ppGpp synthesis as an adaptation associated with antibiotic resistance (Koch et al., 2014). In our study, cell-length distribution was increased in MDR strains, and the role of (p)ppGpp in cell size regulation of MDR strains needs further investigation. Recently, mycobacterial cellular factor LamA has been shown to regulate differential polar growth which also generates cellular heterogeneity and differential susceptibility to antibiotics (Rego et al., 2017). It will be interesting to investigate how host factors influence such mycobacterial cellular factors and regulate the cell-length distribution in M. tuberculosis.
The ability of M. tuberculosis cells to persist in the host during antibiotic treatment and the emergence of MDR-TB are currently major clinical complications associated with TB treatment. In this study, we show that M. tuberculosis cell-length distribution in clinical strains is closely associated with host factors. Host factors like oxidative stress is regulated by tumor necrosis factor (TNF), as TNF regulates mitochondrial reactive oxygen species from infected macrophages (Roca and Ramakrishnan, 2013). TNF is transcriptionally regulated by factors like LTA4H gene, which encodes enzymes involved in the synthesis of leukotriene B4 and its polymorphism in the human population is implicated in susceptibility and resistance to TB infection (Tobin et al., 2010). Thus, host factors variation in humans can also be a potential source of variations in cell-length distribution in clinical M. tuberculosis strains.
Further detailed investigation of these cellular adaptions and their variations among clinical and MDR M. tuberculosis strains are required and their mechanisms need to be delineated. These adaptions also need to be correlated with antibiotic tolerance and persistence so that their consequences for tuberculosis treatment can be determined.
Author Contributions
SV, NT, NP, and GT conceived and designed the experiments. SV, HH, and DT did the experiments and SV, HH, DT, VH, VD, TD, HN, TT, and NH collected the data. DV, SV, GT, BA, and NT analyzed and interpreted the data. SV, HH, DT, VH, VD, TD, HN, TT, NH, NP, NT, GT, and BA drafted, revised the manuscript, and approved the final version.
Funding
This work was supported by the Wellcome Trust (https://wellcome.ac.uk/) Training Fellowship in Public Health and Tropical Medicine (grant 097124/Z/11/Z to NT); the Wellcome Trust supporting the Major Overseas Program in Vietnam (grant 106680/Z/14/Z to GT). BA is supported by National Institutes of Health (https://www.nih.gov/) Director’s New Innovator Award 1DP2LM011952-01 and National Institutes of Health P50GM107618-01A1 award.
Conflict of Interest Statement
The authors declare that the research was conducted in the absence of any commercial or financial relationships that could be construed as a potential conflict of interest.
Acknowledgments
We acknowledge the work of staff from the District TB units in District 4 and 8, HCMC, particularly Drs. Pham Thi Thuy Lieu and Nguyen Van Thom, who initially diagnosed and studied the patients. We would like to thank all patients who participated in this study.
Supplementary Material
The Supplementary Material for this article can be found online at: https://www.frontiersin.org/articles/10.3389/fmicb.2017.02296/full#supplementary-material
References
Aldridge, B. B., Fernandez-Suarez, M., Heller, D., Ambravaneswaran, V., Irimia, D., Toner, M., et al. (2012). Asymmetry and aging of mycobacterial cells lead to variable growth and antibiotic susceptibility. Science 335, 100–104. doi: 10.1126/science.1216166
Avarbock, A., Avarbock, D., Teh, J. S., Buckstein, M., Wang, Z. M., and Rubin, H. (2005). Functional regulation of the opposing (p)ppGpp synthetase/hydrolase activities of RelMtb from Mycobacterium tuberculosis. Biochemistry 44, 9913–9923. doi: 10.1021/bi0505316
Balaban, N. Q., Merrin, J., Chait, R., Kowalik, L., and Leibler, S. (2004). Bacterial persistence as a phenotypic switch. Science 305, 1622–1625. doi: 10.1126/science.1099390
Bergmiller, T., Andersson, A. M. C., Tomasek, K., Balleza, E., Kiviet, D. J., Hauschild, R., et al. (2017). Biased partitioning of the multidrug efflux pump AcrAB-TolC underlies long-lived phenotypic heterogeneity. Science 356, 311–315. doi: 10.1126/science.aaf4762
Bhaskar, A., Chawla, M., Mehta, M., Parikh, P., Chandra, P., Bhave, D., et al. (2014). Reengineering redox sensitive GFP to measure mycothiol redox potential of Mycobacterium tuberculosis during infection. PLOS Pathog. 10:e1003902. doi: 10.1371/journal.ppat.1003902
Caws, M., Thwaites, G., Dunstan, S., Hawn, T. R., Lan, N. T., Thuong, N. T., et al. (2008). The influence of host and bacterial genotype on the development of disseminated disease with Mycobacterium tuberculosis. PLOS Pathog. 4:e1000034. doi: 10.1371/journal.ppat.1000034
Chawla, M., Parikh, P., Saxena, A., Munshi, M., Mehta, M., Mai, D., et al. (2012). Mycobacterium tuberculosis WhiB4 regulates oxidative stress response to modulate survival and dissemination in vivo. Mol. Microbiol. 85, 1148–1165. doi: 10.1111/j.1365-2958.2012.08165.x
Farnia, P., Mohammad, R. M., Merza, M. A., Tabarsi, P., Zhavnerko, G. K., Ibrahim, T. A., et al. (2010). Growth and cell-division in extensive (XDR) and extremely drug resistant (XXDR) tuberculosis strains: transmission and atomic force observation. Int. J. Clin. Exp. Med. 3, 308–314.
Gagneux, S., DeRiemer, K., Van, T., Kato-Maeda, M., de Jong, B. C., Narayanan, S., et al. (2006). Variable host-pathogen compatibility in Mycobacterium tuberculosis. Proc. Natl. Acad. Sci. U.S.A. 103, 2869–2873. doi: 10.1073/pnas.0511240103
Georgescu, W., Wikswo, J. P., and Quaranta, V. (2012). CellAnimation: an open source MATLAB framework for microscopy assays. Bioinformatics 28, 138–139. doi: 10.1093/bioinformatics/btr633
Ginda, K., Santi, I., Bousbaine, D., Zakrzewska-Czerwinska, J., Jakimowicz, D., and McKinney, J. (2017). The studies of ParA and ParB dynamics reveal asymmetry of chromosome segregation in mycobacteria. Mol. Microbiol. 105, 453–468. doi: 10.1111/mmi.13712
Gomez, J. E., and McKinney, J. D. (2004). M. tuberculosis persistence, latency, and drug tolerance. Tuberculosis 84, 29–44. doi: 10.1016/j.tube.2003.08.003
Gupta, K. R., Baloni, P., Indi, S. S., and Chatterji, D. (2016). Regulation of growth, cell shape, cell division, and gene expression by second messengers (p)ppGpp and cyclic Di-GMP in Mycobacterium smegmatis. J. Bacteriol. 198, 1414–1422. doi: 10.1128/JB.00126-16
Hett, E. C., and Rubin, E. J. (2008). Bacterial growth and cell division: a mycobacterial perspective. Microbiol. Mol. Biol. Rev. 72, 126–156. doi: 10.1128/MMBR.00028-07
Hofmann-Thiel, S., van Ingen, J., Feldmann, K., Turaev, L., Uzakova, G. T., Murmusaeva, G., et al. (2009). Mechanisms of heteroresistance to isoniazid and rifampin of Mycobacterium tuberculosis in Tashkent, Uzbekistan. Eur. Respir. J. 33, 368–374. doi: 10.1183/09031936.00089808
Joyce, G., Williams, K. J., Robb, M., Noens, E., Tizzano, B., Shahrezaei, V., et al. (2012). Cell division site placement and asymmetric growth in mycobacteria. PLOS ONE 7:e44582. doi: 10.1371/journal.pone.0044582
Kieser, K. J., and Rubin, E. J. (2014). How sisters grow apart: mycobacterial growth and division. Nat. Rev. Microbiol. 12, 550–562. doi: 10.1038/nrmicro3299
Koch, A., Mizrahi, V., and Warner, D. F. (2014). The impact of drug resistance on Mycobacterium tuberculosis physiology: what can we learn from rifampicin? Emerg. Microbes Infect. 3:e17. doi: 10.1038/emi.2014.17
Lee, P. P., Chan, K. W., Jiang, L., Chen, T., Li, C., Lee, T. L., et al. (2008). Susceptibility to mycobacterial infections in children with X-linked chronic granulomatous disease: a review of 17 patients living in a region endemic for tuberculosis. Pediatr. Infect. Dis. J. 27, 224–230. doi: 10.1097/INF.0b013e31815b494c
Levin-Reisman, I., Ronin, I., Gefen, O., Braniss, I., Shoresh, N., and Balaban, N. Q. (2017). Antibiotic tolerance facilitates the evolution of resistance. Science 355, 826–830. doi: 10.1126/science.aaj2191
Liu, Y., Tan, S., Huang, L., Abramovitch, R. B., Rohde, K. H., Zimmerman, M. D., et al. (2016). Immune activation of the host cell induces drug tolerance in Mycobacterium tuberculosis both in vitro and in vivo. J. Exp. Med. 213, 809–825. doi: 10.1084/jem.20151248
Manina, G., Dhar, N., and McKinney, J. D. (2015). Stress and host immunity amplify Mycobacterium tuberculosis phenotypic heterogeneity and induce nongrowing metabolically active forms. Cell Host Microbe 17, 32–46. doi: 10.1016/j.chom.2014.11.016
Mitchison, D., and Davies, G. (2012). The chemotherapy of tuberculosis: past, present and future. Int. J. Tuberc. Lung Dis. 16, 724–732. doi: 10.5588/ijtld.12.0083
Nakagawa, S., and Cuthill, I. C. (2007). Effect size, confidence interval and statistical significance: a practical guide for biologists. Biol. Rev. Camb. Philos. Soc. 82, 591–605. doi: 10.1111/j.1469-185X.2007.00027.x
Pal, R., Hameed, S., and Fatima, Z. (2015). Iron deprivation affects drug susceptibilities of mycobacteria targeting membrane integrity. J. Pathog. 2015:938523. doi: 10.1155/2015/938523
Priestman, M., Thomas, P., Robertson, B. D., and Shahrezaei, V. (2017). Mycobacteria modify their cell size control under sub-optimal carbon sources. Front. Cell Dev. Biol. 5:64. doi: 10.3389/fcell.2017.00064
Raffetseder, J., Pienaar, E., Blomgran, R., Eklund, D., Patcha Brodin, V., Andersson, H., et al. (2014). Replication rates of Mycobacterium tuberculosis in human macrophages do not correlate with mycobacterial antibiotic susceptibility. PLOS ONE 9:e112426. doi: 10.1371/journal.pone.0112426
Rego, E. H., Audette, R. E., and Rubin, E. J. (2017). Deletion of a mycobacterial divisome factor collapses single-cell phenotypic heterogeneity. Nature 546, 153–157. doi: 10.1038/nature22361
Richardson, K., Bennion, O. T., Tan, S., Hoang, A. N., Cokol, M., and Aldridge, B. B. (2016). Temporal and intrinsic factors of rifampicin tolerance in mycobacteria. Proc. Natl. Acad. Sci. U.S.A. 113, 8302–8307. doi: 10.1073/pnas.1600372113
Roca, F. J., and Ramakrishnan, L. (2013). TNF dually mediates resistance and susceptibility to mycobacteria via mitochondrial reactive oxygen species. Cell 153, 521–534. doi: 10.1016/j.cell.2013.03.022
Santi, I., Dhar, N., Bousbaine, D., Wakamoto, Y., and McKinney, J. D. (2013). Single-cell dynamics of the chromosome replication and cell division cycles in mycobacteria. Nat. Commun. 4:2470. doi: 10.1038/ncomms3470
Schneider, C. A., Rasband, W. S., and Eliceiri, K. W. (2012). NIH image to ImageJ: 25 years of image analysis. Nat. Methods 9, 671–675. doi: 10.1038/nmeth.2089
Sebastian, J., Swaminath, S., Nair, R. R., Jakkala, K., Pradhan, A., and Ajitkumar, P. (2017). De novo emergence of genetically resistant mutants of Mycobacterium tuberculosis from the persistence phase cells formed against antituberculosis drugs in vitro. Antimicrob. Agents Chemother. 61:e01343-16. doi: 10.1128/AAC.01343-16
Singh, B., Nitharwal, R. G., Ramesh, M., Pettersson, B. M., Kirsebom, L. A., and Dasgupta, S. (2013). Asymmetric growth and division in Mycobacterium spp.: compensatory mechanisms for non-medial septa. Mol. Microbiol. 88, 64–76. doi: 10.1111/mmi.12169
Stewart, G. R., Robertson, B. D., and Young, D. B. (2003). Tuberculosis: a problem with persistence. Nat. Rev. Microbiol. 1, 97–105. doi: 10.1038/nrmicro749
Tobin, D. M., Vary, J. C. Jr., Ray, J. P., Walsh, G. S., Dunstan, S. J., Bang, N. D., et al. (2010). The lta4h locus modulates susceptibility to mycobacterial infection in zebrafish and humans. Cell 140, 717–730. doi: 10.1016/j.cell.2010.02.013
Tsolaki, A. G., Gagneux, S., Pym, A. S., Goguet de la Salmoniere, Y. O., Kreiswirth, B. N., Van Soolingen, D., et al. (2005). Genomic deletions classify the Beijing/W strains as a distinct genetic lineage of Mycobacterium tuberculosis. J. Clin. Microbiol. 43, 3185–3191. doi: 10.1128/JCM.43.7.3185-3191.2005
Van den Bergh, B., Fauvart, M., and Michiels, J. (2017). Formation, physiology, ecology, evolution and clinical importance of bacterial persisters. FEMS Microbiol. Rev. 41, 219–251. doi: 10.1093/femsre/fux001
Vaubourgeix, J., Lin, G., Dhar, N., Chenouard, N., Jiang, X., Botella, H., et al. (2015). Stressed mycobacteria use the chaperone ClpB to sequester irreversibly oxidized proteins asymmetrically within and between cells. Cell Host Microbe 17, 178–190. doi: 10.1016/j.chom.2014.12.008
Veening, J. W., Smits, W. K., and Kuipers, O. P. (2008). Bistability, epigenetics, and bet-hedging in bacteria. Annu. Rev. Microbiol. 62, 193–210. doi: 10.1146/annurev.micro.62.081307.163002
Vijay, S., Mukkayyan, N., and Ajitkumar, P. (2014a). Highly deviated asymmetric division in very low proportion of mycobacterial mid-log phase cells. Open Microbiol. J. 8, 40–50. doi: 10.2174/1874285801408010040
Vijay, S., Nagaraja, M., Sebastian, J., and Ajitkumar, P. (2014b). Asymmetric cell division in Mycobacterium tuberculosis and its unique features. Arch. Microbiol. 196, 157–168. doi: 10.1007/s00203-014-0953-7
Vijay, S., Nair, R. R., Sharan, D., Jakkala, K., Mukkayyan, N., Swaminath, S., et al. (2017). Mycobacterial cultures contain cell size and density specific sub-populations of cells with significant differential susceptibility to antibiotics, oxidative and nitrite stress. Front. Microbiol. 8:463. doi: 10.3389/fmicb.2017.00463
Voskuil, M. I., Bartek, I. L., Visconti, K., and Schoolnik, G. K. (2011). The response of Mycobacterium tuberculosis to reactive oxygen and nitrogen species. Front. Microbiol. 2:105. doi: 10.3389/fmicb.2011.00105
Wakamoto, Y., Dhar, N., Chait, R., Schneider, K., Signorino-Gelo, F., Leibler, S., et al. (2013). Dynamic persistence of antibiotic-stressed mycobacteria. Science 339, 91–95. doi: 10.1126/science.1229858
Wells, R. M., Jones, C. M., Xi, Z., Speer, A., Danilchanka, O., Doornbos, K. S., et al. (2013). Discovery of a siderophore export system essential for virulence of Mycobacterium tuberculosis. PLOS Pathog. 9:e1003120. doi: 10.1371/journal.ppat.1003120
Keywords: Mycobacterium tuberculosis, cell-length variation, macrophage infection, sputum, multidrug resistance, oxidative stress, rifampicin, iron deficiency
Citation: Vijay S, Vinh DN, Hai HT, Ha VTN, Dung VTM, Dinh TD, Nhung HN, Tram TTB, Aldridge BB, Hanh NT, Thu DDA, Phu NH, Thwaites GE and Thuong NTT (2017) Influence of Stress and Antibiotic Resistance on Cell-Length Distribution in Mycobacterium tuberculosis Clinical Isolates. Front. Microbiol. 8:2296. doi: 10.3389/fmicb.2017.02296
Received: 28 August 2017; Accepted: 07 November 2017;
Published: 21 November 2017.
Edited by:
Frank Schreiber, Bundesanstalt für Materialforschung und prüfung (BAM), GermanyReviewed by:
Giulia Manina, Institut Pasteur, FranceHesper Rego, Yale School of Medicine, United States
Copyright © 2017 Vijay, Vinh, Hai, Ha, Dung, Dinh, Nhung, Tram, Aldridge, Hanh, Thu, Phu, Thwaites and Thuong. This is an open-access article distributed under the terms of the Creative Commons Attribution License (CC BY). The use, distribution or reproduction in other forums is permitted, provided the original author(s) or licensor are credited and that the original publication in this journal is cited, in accordance with accepted academic practice. No use, distribution or reproduction is permitted which does not comply with these terms.
*Correspondence: Nguyen T. T. Thuong, dGh1b25nbnR0QG91Y3J1Lm9yZw==