- Center for Food Safety, Department of Food Science, University of Arkansas, Fayetteville, AR, United States
Commercial poultry abattoirs were evaluated to determine the efficacy of the multi-hurdle antimicrobial strategy employed to reduce the microbial load present on incoming broilers from the farm. As next generation sequencing (NGS) has been recently employed to characterize the poultry production system, this study utilized 16S High throughput sequencing (HTS) and quantitative plating data to profile the microbiota of chicken carcasses and determine the efficacy of the multi-hurdle antimicrobial system. Aerobic plate count (APC) and Enterobacteriaceae (EB) microbial counts were quantified from whole bird carcass rinsates (WBCR). The remaining rinsates underwent microbiome analysis using 16S rRNA gene fragments on an Illumina MiSeq and were analyzed by Quantitative Insights into Microbial Ecology (QIIME). The key stages of processing were determined to be at rehang, pre-chill, and post-chill as per the Salmonella Reduction Regulation (75 Fed. Reg. 27288–27294). The APC microbial data from rehang, pre-chill, and post-chill were mean log 4.63 CFU/mL, 3.21 CFU/mL, and 0.89 CFU/mL and EB counts were mean log 2.99 CFU/mL, 1.95 CFU/mL, and 0.35 CFU/mL. NGS of WBCR identified 222 Operational Taxonomic Units’ (OTU’s) of which only 23 OTU’s or 10% of the population was recovered post-chill. Microbiome data suggested a high relative abundance of Pseudomonas at post-chill. Additionally, Pseudomonas, Enterobacteriaceae, and Weeksellaceae Chryseobacterium have been identified as potential indicator organisms having been isolated from all processing abattoirs and sampling locations. This study provides insight into the microbiota of commercial broilers during poultry processing.
Introduction
The meat processing industry is subject to many regulatory requirements due to the association of foodborne illness outbreaks in which Salmonella spp. has been the etiological agent in an estimated 1.0 million food borne illness cases (Scallan et al., 2011; 75 Fed. Reg. 27288–27294). Regulatory requirements established in 1996, set forth by the United States Department of Agriculture Food Safety Inspection Service (USDA-FSIS), required broiler processors to implement both a Hazard Analysis Critical Control Point System (HACCP) and to comply with performance standards for Salmonella spp. and Escherichia coli Biotype I (Food Safety and Inspection Service USDA, 1996a,b,c). The Food Safety and Inspection Service USDA (2010), introduced modifications to the regulation that both updated existing performance standards and added Campylobacter spp. performance standards for broilers (75 Fed. Reg. 27288–27294). Within the Code of Federal Regulations, 9 CFR 381.94 (Food Safety and Inspection Service USDA, 1996b), poultry abattoirs are to test carcasses to demonstrate process control. Additionally, the HACCP plan must be validated annually per 9 CFR 417 (Food Safety and Inspection Service USDA, 1996a) and interventions are a part of the HACCP plan.
Aside from the regulatory requirments, monitoring the microbial intervention will ensure optimal performance in reducing the bacterial load from live hang to post-chill (Stopforth et al., 2007). Broilers brought into the slaughterhouse have been recorded as having aerobic bacterial levels ranging from mean log10 6 to 9 CFU/mL or 4 × 10⁸ to 4 × 10¹¹ CFU/carcass (Lillard, 1989, 1990; Kotula and Pandya, 1995). In order to reduce the microbial load effectively, research efforts have focused on the reduction and elimination of both pathogenic and spoilage bacteria (Mulder et al., 1987; Izat et al., 1990; Dickens et al., 1994; Lillard, 1994; Doyle and Waldroup, 1996; Yang et al., 1998; Stopforth et al., 2007; Bauermeister et al., 2008; Northcutt et al., 2008; Millilo et al., 2011; Purnell et al., 2014; Kim et al., 2017). Therefore, antimicrobials commonly undergo evaluations by researchers, both academic and industry, to investigate the efficacy and for improvements to the current system. A method to measure the intervention process is to perform bio-mapping.
Bio-mapping measures the microbial recovery pre- and post-intervention for the whole process. Thus, a systematic analysis of each individual hurdle comprising the whole system. This map will effectively reveal where intervention strategies are successful or failing. In order to measure the effectiveness of commercial intervention strategies against potential pathogens, the employment of indicator organism can prove useful (Russell, 2000; Whyte et al., 2004; James et al., 2006; Handley et al., 2015; Kim et al., 2017). For instance, Enterobacteriaceae is a family of bacteria that contains pathogens such E. coli O157:H7 and Salmonella spp. (Whyte et al., 2004). An indicator organism would ideally be a non-pathogenic microorganism that behaves similarly to the environmental conditions as a target human pathogen and the population present in large enough quantities to be detected using cost effective microbiological techniques.
Carcasses entering the abattoir yield high levels of bacteria capable of degrading the product quality and/or causing human pathogenesis (Lillard, 1989, 1990; Kotula and Pandya, 1995; Stopforth et al., 2007). The identified microbiota present through various stages of food processing should enable researchers and industry experts to better develop product and intervention strategies (Solow, 1993; Stern et al., 2001; Hunter et al., 2009). The bacterial populations that are present can be indicative of contamination or it may be inherent to the product. Employing next generation sequencing (NGS) tools, such as 16s RNA gene based microbiome sequencing could allow researchers to gain further insight into the microbial populations present through various niches in processing.
In this study, 16S high throughput sequencing (HTS) was utilized to establish a typical microbiome of commercially processed broilers. Furthermore, establishing NGS as an applicable tool, in conjunction with currently available plating techniques, was done to validate and measure the reduction in microorganisms by the antimicrobial multi-hurdle system of commercial processors. Lastly, this study evaluated the microbiome profile to identify potential indicator organisms that could benefit the broiler industry during bio-mapping.
Materials and Methods
Sample Collection
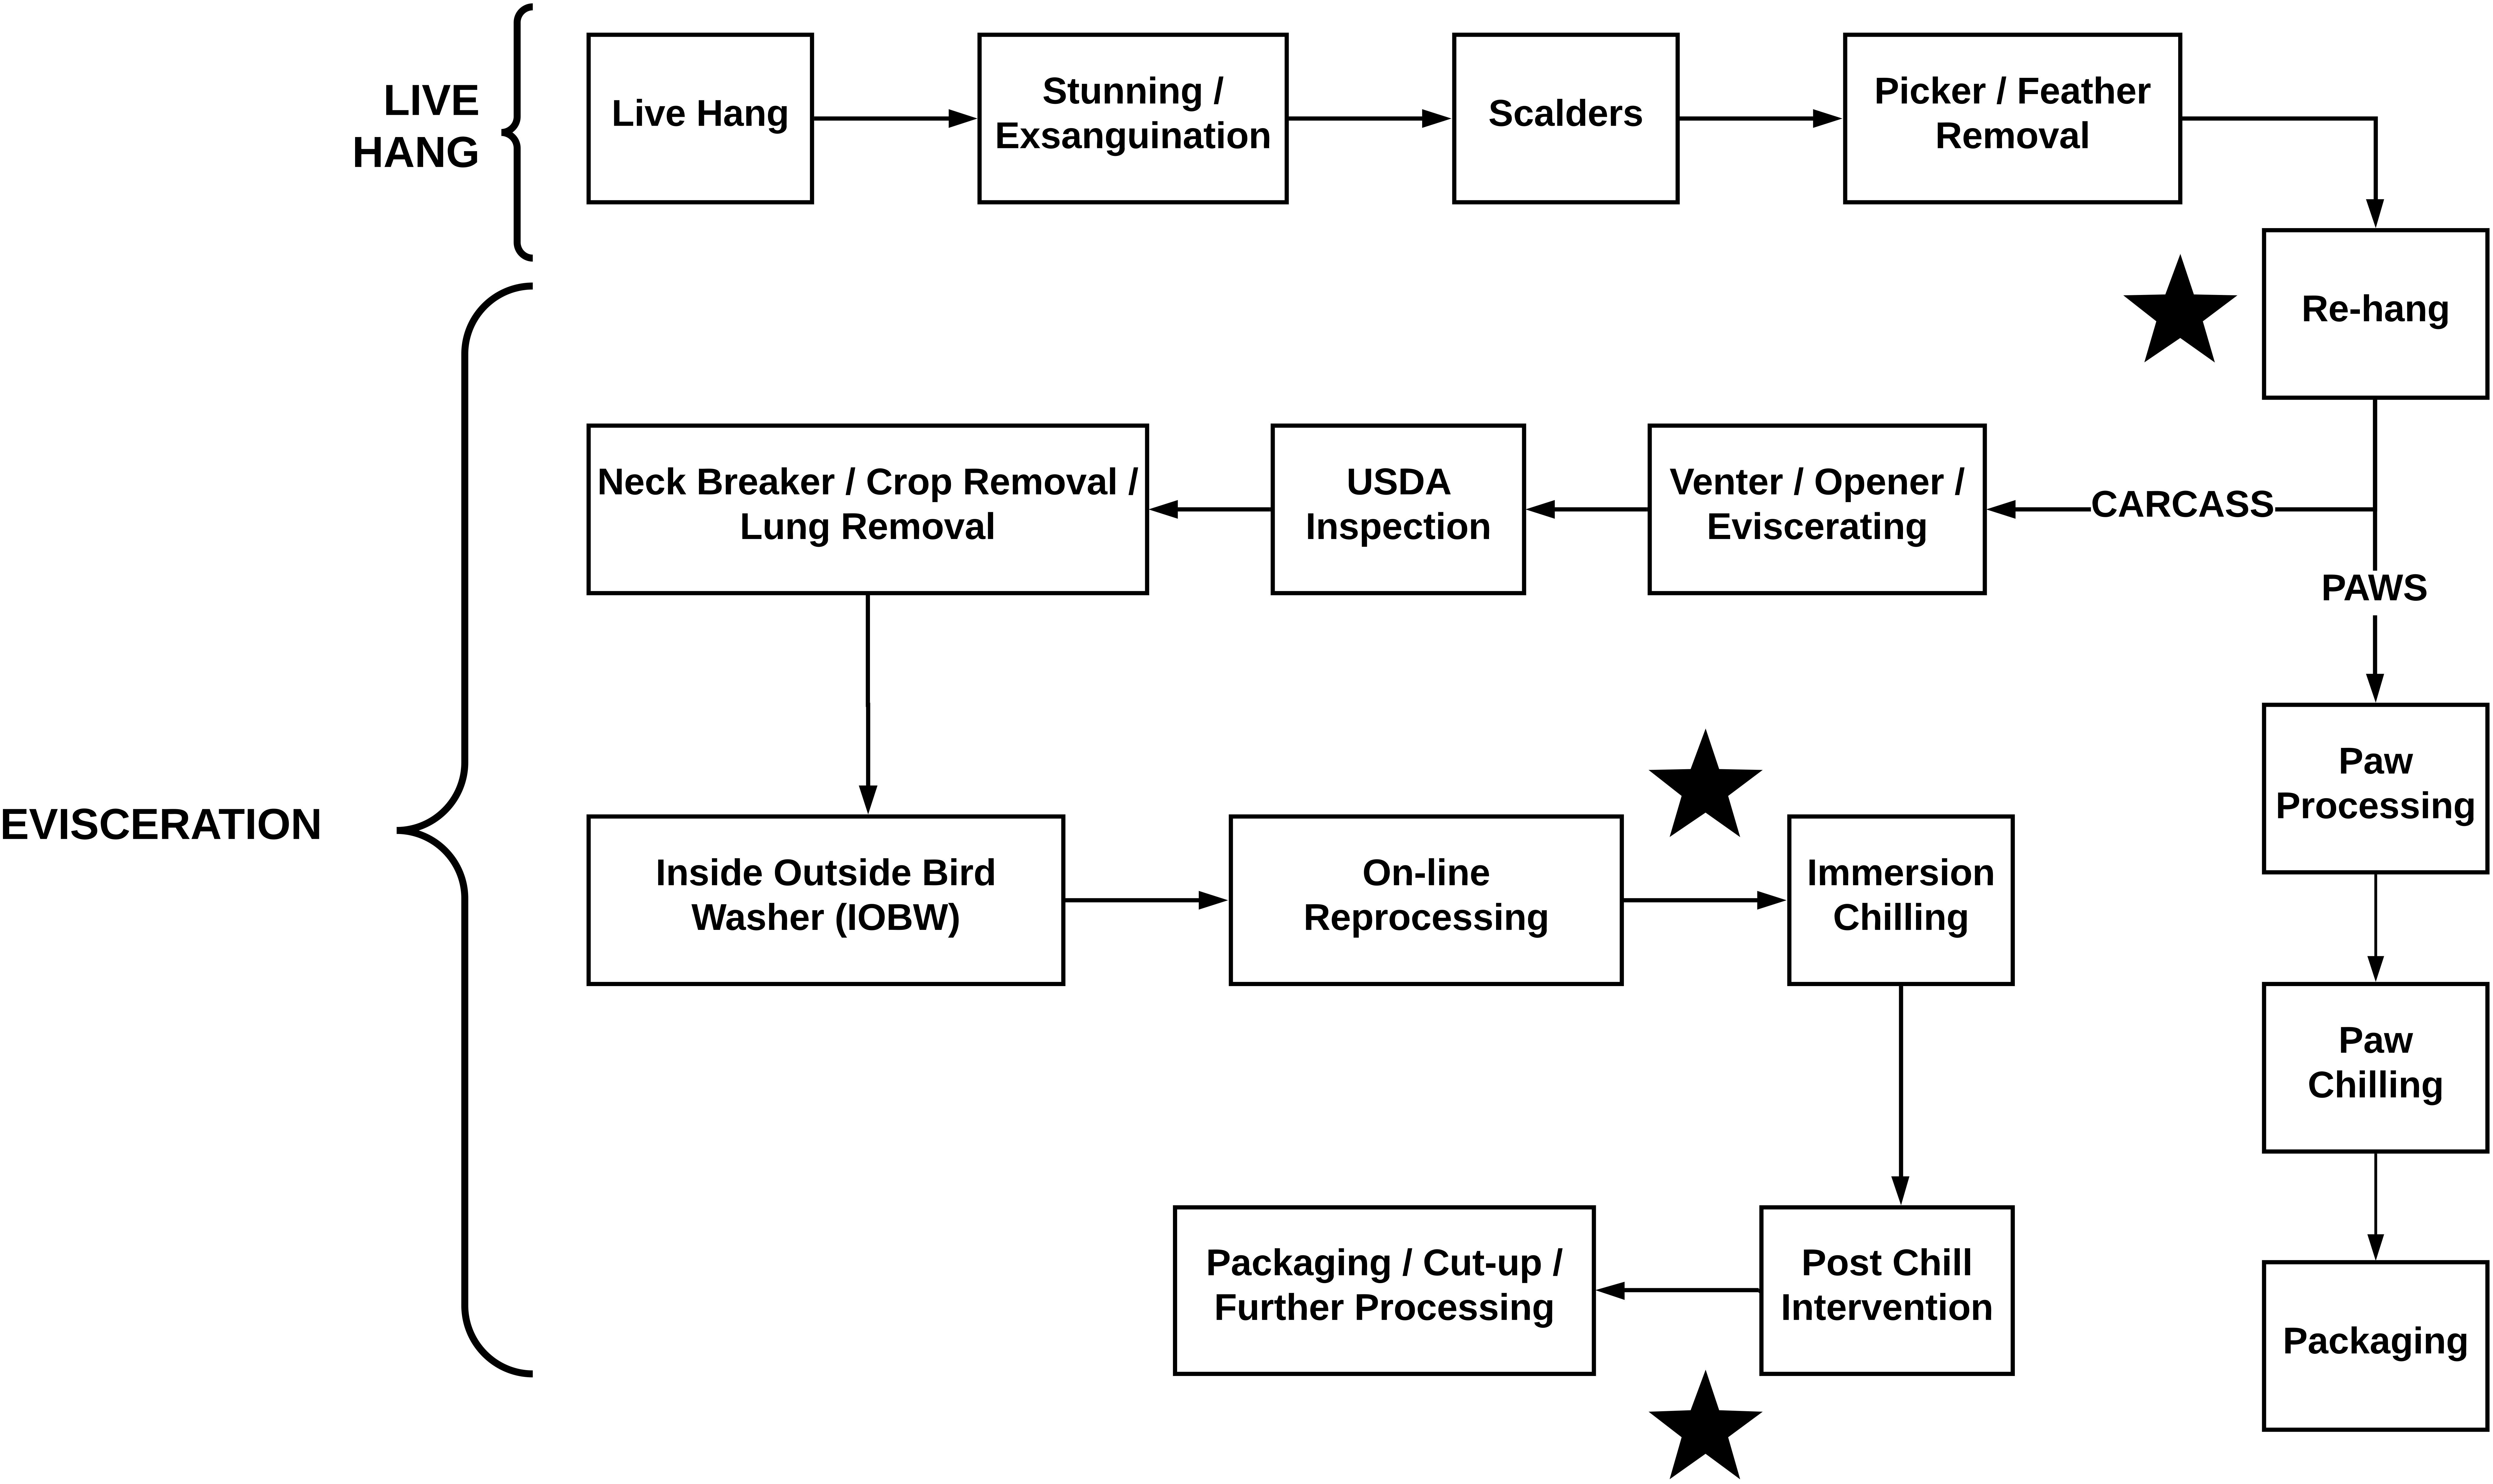
Whole chicken carcass rinsates were collected from three commercial broiler abattoirs. The birds were aseptically removed from the production line shackles during 1st shift production; each location had been processing for a minimum of 3 h prior to sampling. A total of 30 rinsates were collected at each slaughter facility and each facility had 3 sampling points (Figure 1) defined as rehang, pre-chill, or post-chill. In all, 90 carcasses were aseptically collected from the processing line and rinsed in pre-chilled 400 mL Butterfield’s Phosphate diluent as prescribed in the Microbiological Laboratory Guidebook (MLG) Food Safety and Inspection Service USDA (2017). The rinsates was placed back into the original Butterfield’s Phosphate diluent container with screw lids sealed. They were placed on ice for transport and returned to the testing lab for analysis. Upon arrival the samples were placed into the refrigerator.
Bacterial Enumeration
All samples were plated as described by the USDA MLG Chapters 3 and 41.5 on following media: 3M Aerobic Plate Count (APC) PetriFilm and 3M Enterobacteriaceae PetriFilm (3M Microbiology, Saint Paul, MN, United States). Prior to enumeration, samples were re-suspended in their respective jars by shaking vigorously and subsequently performing 1:10 serial dilutions in Butterfield’s Diluent (BF’s) (Edge Biologicals Inc., Memphis, TN, United States). One milliliter aliquots were directly plated from the sample and dilution tubes onto the corresponding PetriFilm. PetriFilm plates were incubated at 35°C in aerobic conditions per the manufacturer’s directions. Samples were incubated per the manufacturer’s directions and colonies were enumerated and calculated as total colony forming units (CFU) per mL for each dilution.
DNA Extraction
A 50 mL subsample of the original 400 mL WBCR was transferred into a sterile 60 mL conical tube. The conical tubes were spun down using an Thermo Scientific Sorvall Lynx 6000 (Langenselbold, Germany) at 8,000 × g for 15 min. The supernatants were poured off and the pellets were subsequently re-suspended in 2 mL of phosphate buffered saline (PBS). DNA extractions were performed using a Fisher Scientific AccuSpin Micro 17 (Langenselbold, Germany) and a QIAamp DNA Stool Mini Kit (Qiagen, Valencia, CA, United States) with modifications to increase DNA yield (Park et al., 2014, 2016). The specific modifications were performed prior to the QIAamp Stool Mini Kit (Qiagen, Valencia, CA, United States) and included the addition of 0.7 mm garnet beads (MO BIO Laboratories Inc., Carlsbad, CA, United States) and vortexing for 1 min. The samples were centrifuged and the supernatant was transferred to a fresh 2 mL microcentrifuge tube containing 0.1 mm glass beads (MO BIO Laboratories Inc., Carlsbad, CA, United States). Those tubes underwent horizontal vortexing for 10 min. and then incubated in a 95°C heat block for 6 min (Park et al., 2014). QIAamp DNA Stool Mini Kit was performed as prescribed by the manufacturer. All samples were analyzed on a Qubit® 2.0 Fluorometer (Life Technologies, Carlsbad, CA, United States) to determine the isolated DNA concentration followed by dilution to 10 ng/μL.
Library Preparation
The isolated DNA aliquots were utilized to construct a sequencing library that targeted the V4 region of 16S rRNA as suggested by Kozich et al. (2013). Individual DNA samples were amplified with dual-index primers through PCR and amplicons were normalized using the SequalPrepTM Normalization Kit (Life Technologies) per the manufacturer’s recommendation. Each sample contained unique barcode sequences, at both the front and end of the PCR amplicon, to distinguish each sample sequence in a pooled library. The pooled library contained a 5 μL aliquot of each normalized sample and was used for further assays. Once pooled, the library concentration and the exact DNA product size were measured using a KAPA Library Quantification Kit (Kapa Biosystems, Woburn, MA, United States) through quantitative PCR (qPCR, Eppendorf, Westbury, NY, United States) assay and an Agilent 2100 Bioanalyzer System (Agilent, Santa Clara, CA, United States), respectively. Based on the qPCR and bioanalyzer results, the pooled library was subsequently diluted to 4 nM prior to sequencing.
Sequencing via an Illumina MiSeq Platform 157
A pooled library (20 nM) and a PhiX control v3 (20 nM) (Illumina) were mixed with 0.2 N fresh NaOH and HT1 buffer (Illumina) to produce the final concentration of 12 pM’s each. The resulting library was mixed with the PhiX control v3 (5%, v/v) (Illumina) and 600 μL loaded on a MiSeq® v2 (500 cycle) Reagent cartridge for sequencing. All sequencing procedures were monitored through the Illumina BaseSpace® website.
Sequencing Data Processing
Both demultiplexed R1 and R2 sequencing read (approximately 250 bp in length) files were acquired from the Illumina BaseSpace® website and data processing was performed using the QIIME pipeline (version 1.9.1) (Caporaso et al., 2010; Park et al., 2016). Clustered sequences were used to assemble Operational Taxonomic Units (OTUs) tables with 93.93% identity and classified into the respective taxonomical level from domain to genus based on the Greengenes 16s rRNA gene database. Within the QIIME 1.9.1 package, both alpha diversity and beta diversity data were obtained. Alpha diversity data included rarefaction curves for OTUs and Chao1, while beta diversity data included weighted and unweighted UniFrac distances to characterize the microbial population.
Statistical Analysis
All bacterial counts were log 10 transformed, prior to analyzing the mean and standard deviation of each individual plant. A One-way Analysis of Variance (ANOVA) or Tukey’s Honest Significant Difference Test was performed using JMP® (version 13.1.0). Microbiome alpha and beta diversity were calculated by using QIIME pipeline (version 1.9.1). Additionally, quality metrics from the Illumina Mi-seq runs were obtained from Illumina BaseSpace® website.
Results
Quantitative Bio-Mapping Results
The log means of individual and all evisceration microbial data for both APC and Enterobacteriaceae are presented in Table 1. The microbial reduction from rehang to post-chill did have a statistically significant reduction, p-value < 0.001, as indicated by Table 2. The APC all plant mean log CFU/mL bacterial counts for rehang, pre-chill, and post-chill were 4.63, 3.15, and 0.81, respectively; Enterobacteriaceae was 2.99, 1.79, and 0.12, respectively. This data was utilized to build the bio-map in Figure 2. The reduction from rehang to post-chill for APC was 3.82 log CFU/mL and Enterobacteriaceae was 2.86 log CFU/mL. Each step reduced the microbial populations significantly and Figure 2 illustrates the reduction throughout the evisceration process. In summary, bacterial counts continued to drop significantly from rehang to post-chill which yielded a negative slope, indicative of a processing system in control.
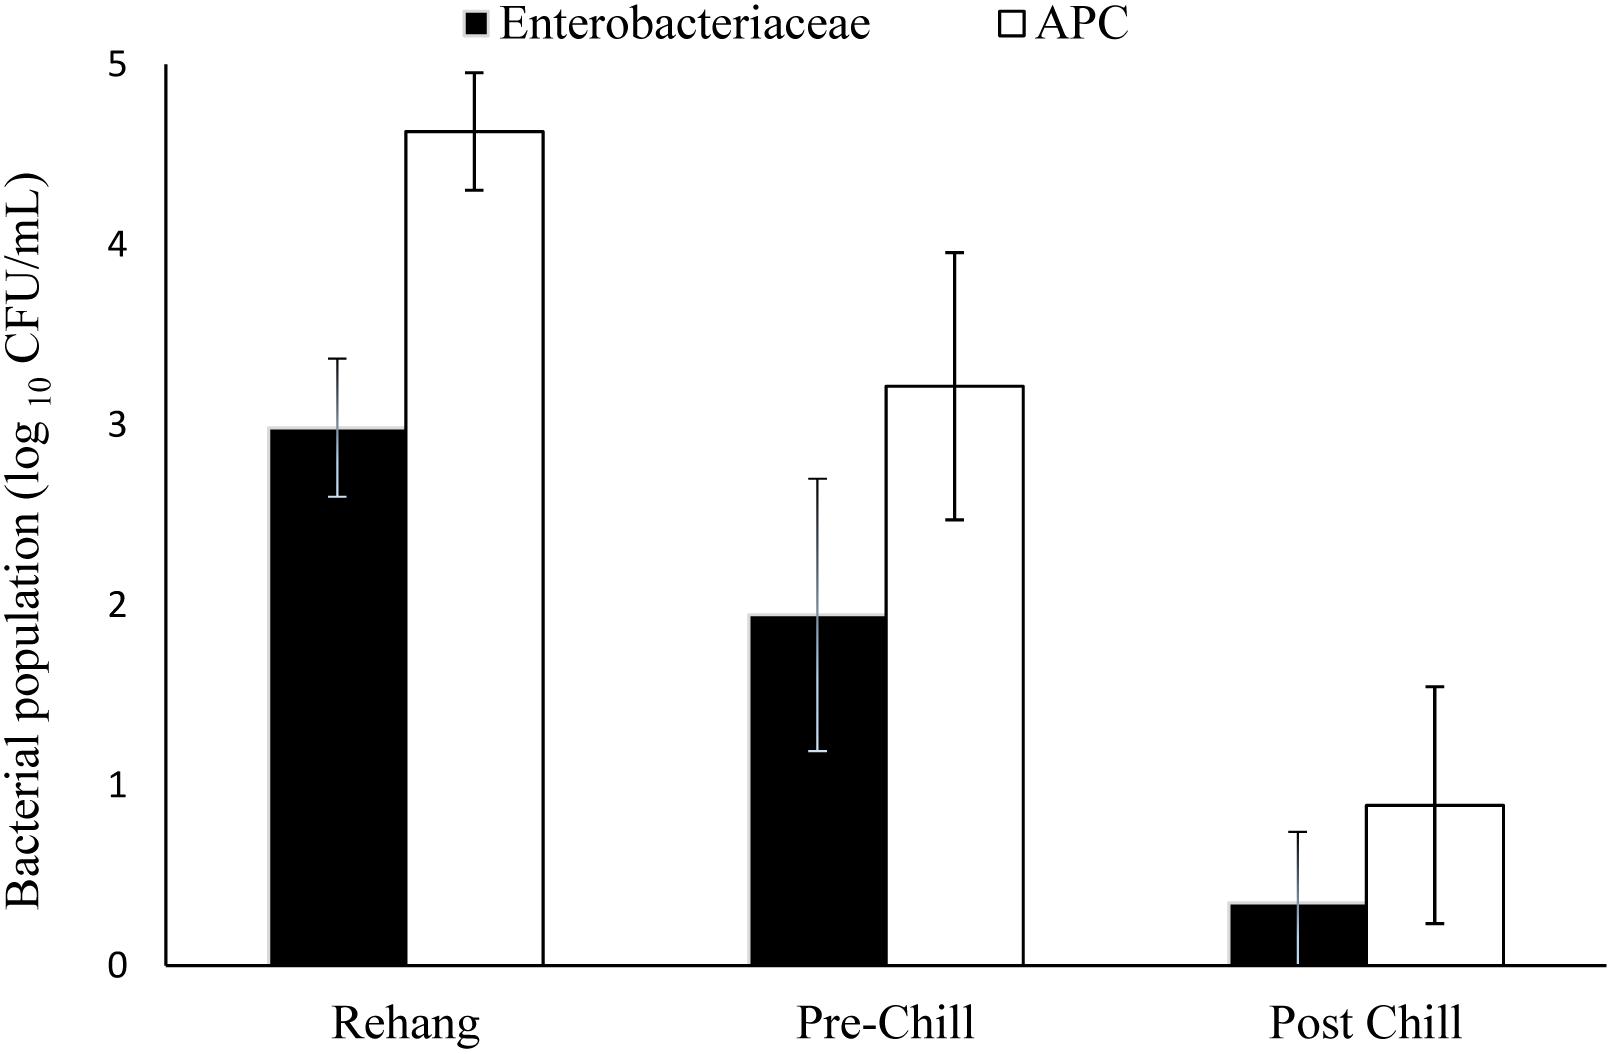
FIGURE 2. Bio-map of evisceration. The bacterial mean log CFU/mL counts for both Enterobacteriaceae and aerobic plate counts (APC).
Taxonomic Summary
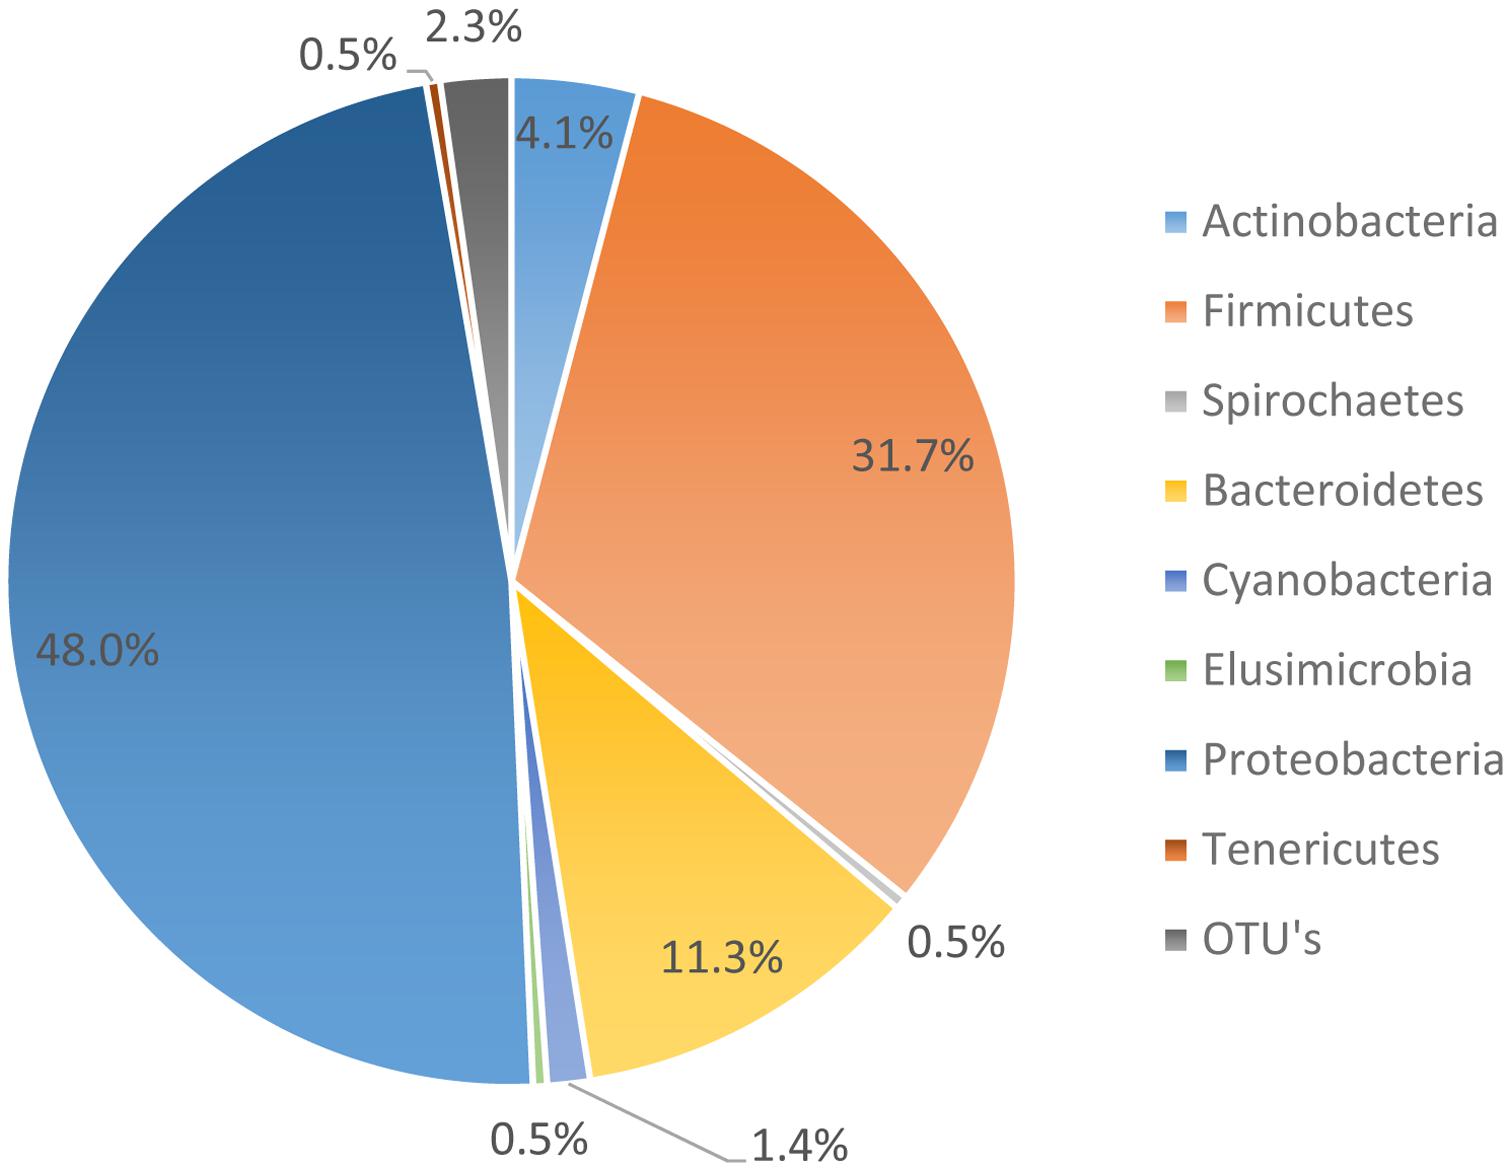
The microbiome data suggests that 95.01% of the organisms present were identified as organisms from the phyla Bacteroides, Firmicutes, Proteobacteria, and Actinobacteria. However, the most abundant phyla, as noted in Figure 3, was Proteobacteria. Proteobacteria represented 48.0% of all genomes recovered, followed by Firmicutes with 31.7%, and Bacteroidetes with 11.3%. During the genome analysis of all the rinsates collected at the genus level, a total of 222 OTU’s were identified and only 23 OTU’s or 9.65% was recovered after post-chill.
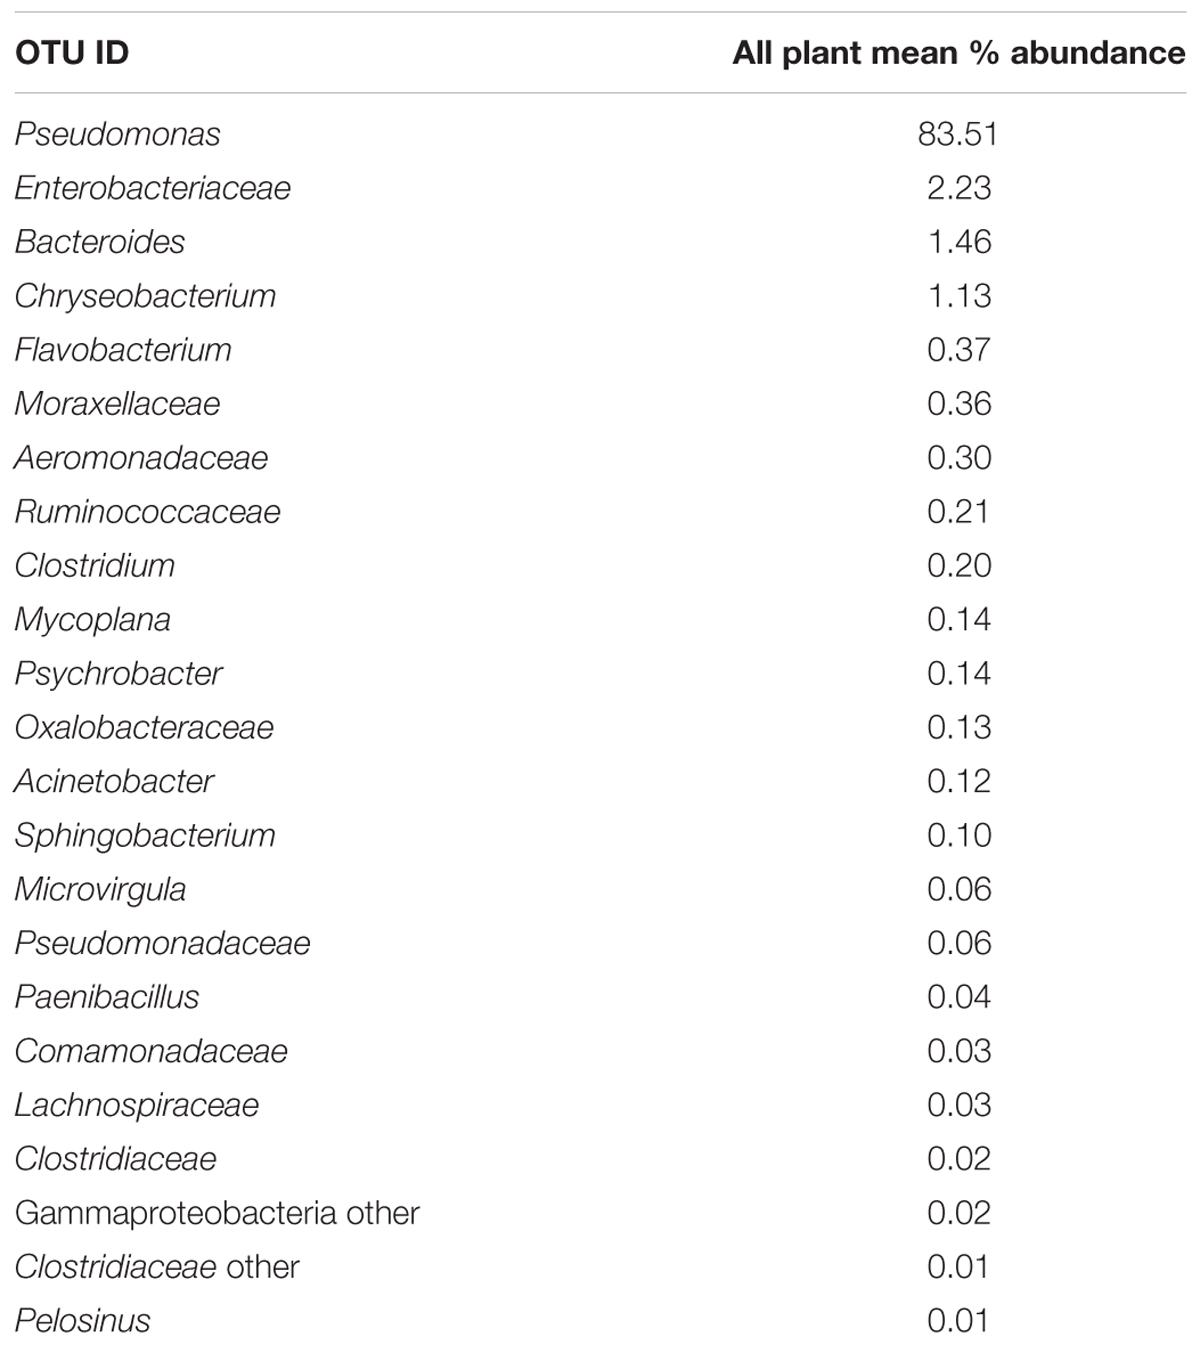
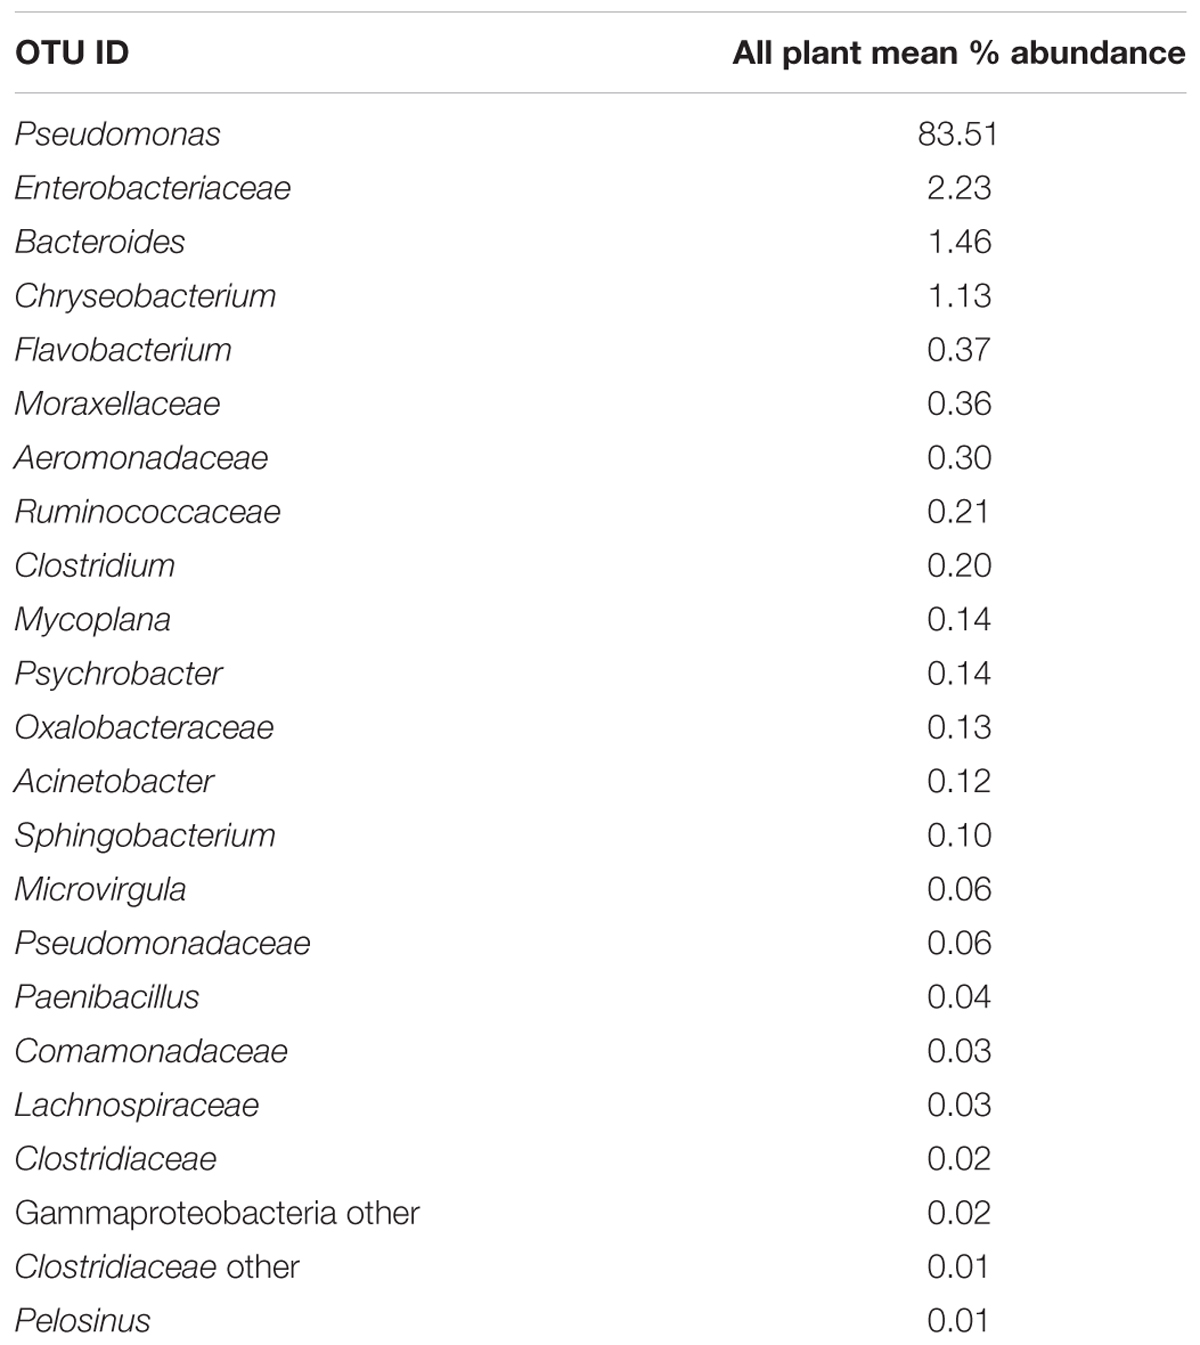
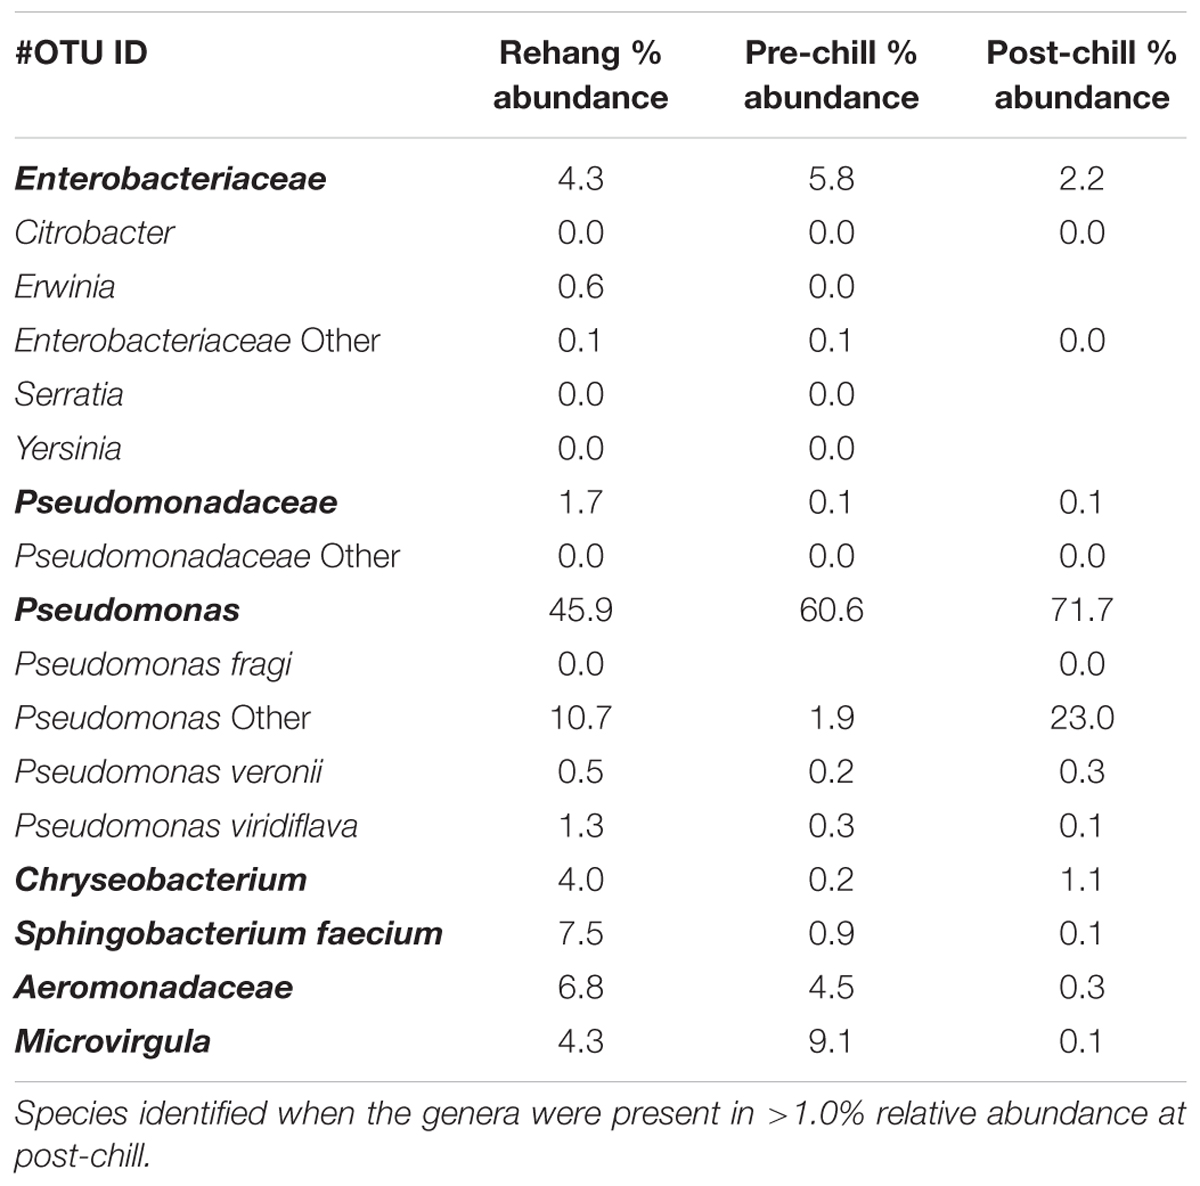
Since one objective was to investigate non-pathogenic indicator candidate organisms, the ideal organism would be present at rehang, pre-chill, and post-chill. Therefore, the genera were first filtered by those observed in the post-chill samples only. Therefore, Table 3 contains a list of all genera recovered at all three post-chill abattoirs. The list of organisms was further filtered by requiring all organisms to be present in rehang, pre-chill, and post-chill samples. Therefore, Figure 4 indicates genera identified during all sampling stages and abattoirs for a total of 7 OTU’s at the taxonomic level Family or Genus. The two taxonomic groups with the highest relative abundance were Pseudomonas and Enterobacteriaceae. The post-chill relative abundance of Pseudomonas and Enterobacteriaceae was 83.5 and 2.2%, respectively. Identified genera with a relative abundance >1.0% were analyzed at the species level (Table 4). Few species at post-chill were identified (Table 4) and those identified were <1.0%. The OTU’s most abundant were closely related to Pseudomonas, Enterobacteriaceae, and Chryseobacterium with a relative abundance of 94.8, 2.2, and 1.13%.
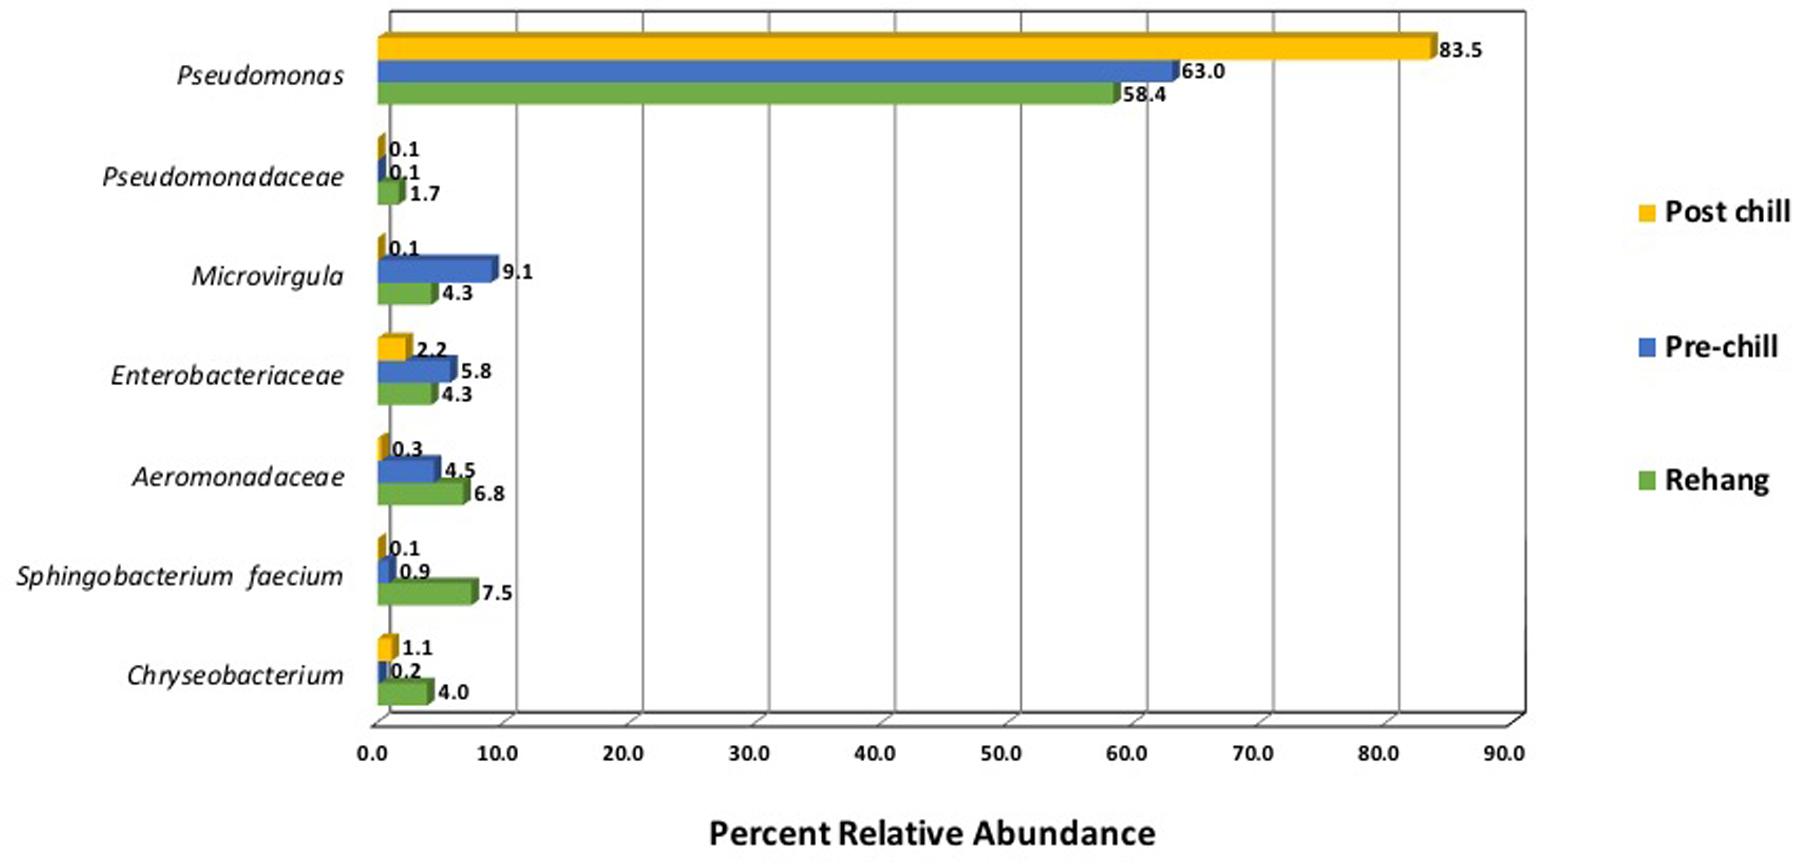
FIGURE 4. Bio-map of microorganisms through evisceration when the genera were identified at all sampling locations and abattoirs.
QIIME Sequencing Metrics
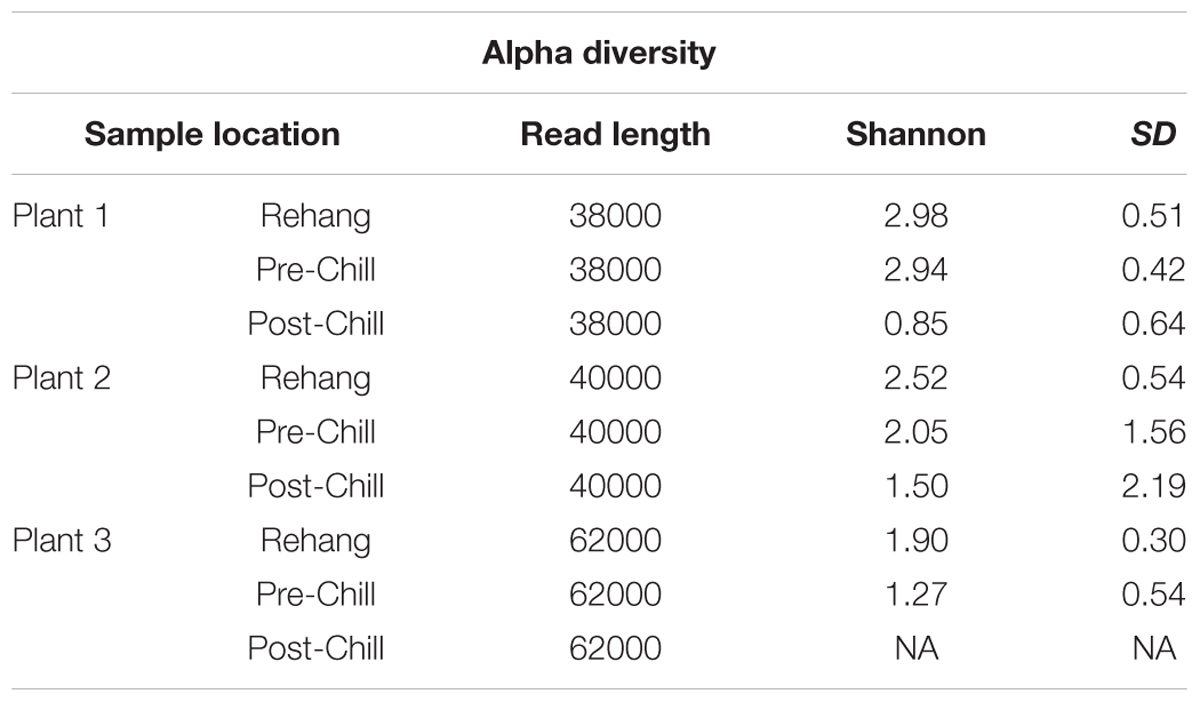
During sequencing, 18,879,978 reads were generated and 17,730,162 of those reads passed filtering. Therefore, 93.93 ± 0.53% of the sequence clusters passed filtration with an error rate of 1.75 percent. Additionally, BaseSpace reported 82.1% of base calls having a Q30 score or better; a quality metric indicating that 1 in 1000 base calls have a possible error. The summarized Illumina Mi-Seq read lengths and Shannon Diversity values obtained from QIIME are identified in Table 5. The standard deviations associated with Shannon diversity scores were obtained using JMP. As expected, the samples exhibited a more diverse population in the less processed rehang rinsates and as the carcasses were further processed they become less diverse. Additional alpha diversity results are from Chao1 and OTU’s rarefaction curves presented in Figures 5, 6. Both Figures 5, 6 indicate the read lengths and the number of organisms’ present for the associated sample location. These curves indicate that the diversity within the sample were higher during rehang and became less diverse by the end of post-chill. The loss in community richness should be expected as the carcasses are undergoing cleaning steps and does resemble the finding obtained in the bio-map.
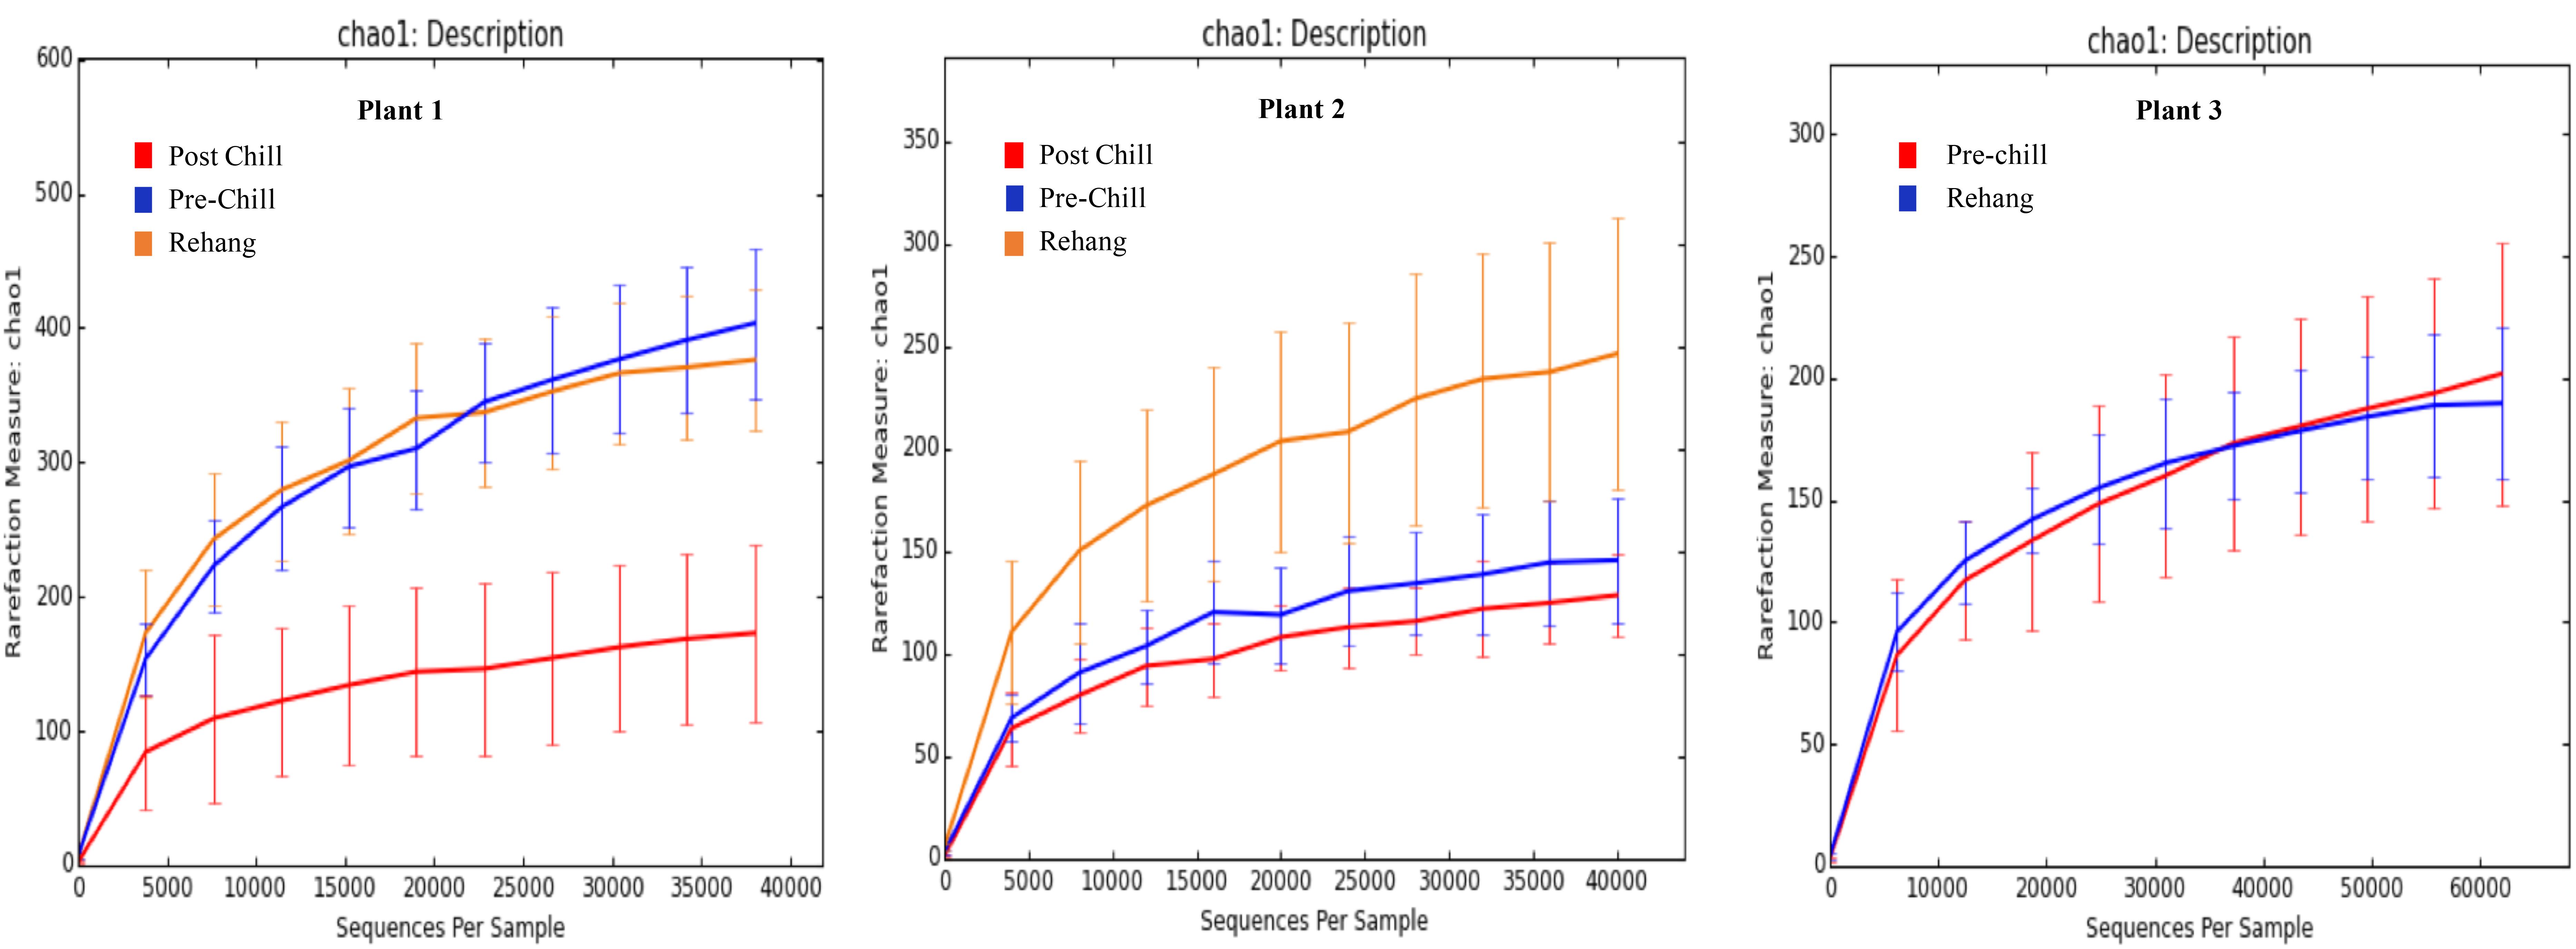
FIGURE 5. Chao 1 rarefaction curve. The measure of richness within a community at each processing abattoir and testing location within the plant.

FIGURE 6. Operational Taxonomic Unit (OTU) rarefaction curves. The number of observed OTU’s versus the length of sequence read at each processing plant and testing location within the plant.
Beta diversity principle coordinate analyses, Figure 7, depicted the relatedness of identified OTU’s between samples. Both weighted and unweighted UniFrac plots (Figure 7) were generated for plants 1, 2, and 3. The weighted PCoA UniFrac plot quantitatively measured the relative abundance of OTU’s among a group. The unweighted PCoA UniFrac plot was a qualitative representation of phylogenetic distance based on the presence/absence of OTU’s among samples in a group. Initial analysis of the PCoA plots for all organisms present indicated less genetic diversity among the total population of young broilers (Figure 7E). As the birds increased in age the population grew in genetic diversity (Figure 7A). However, the inverse was true for the PCoA plots generated for Pseudomonas (Figure 8). Rather, the PCoA plots in Figure 8 indicate that broilers with an older slaughter age had greater similarity in genetic diversity for the population of Pseudomonas spp. Since Pseudomonas spp. had the highest relative abundance in all samples and locations collected, Figure 8 depicts weighted and unweighted PCoA plots generated for Pseudomonas spp. only. Figures 8A,C,E are the weighted PCoA plots for Plants 1, 2, and 3. These figures depict shifts in the relative abundance in Pseudomonas spp. as the birds increase in slaughter age, where Plant 1 (Figure 8A) is the oldest and Plant 3 (Figure 8E) is the youngest. As for the unweighted PCoA plots, Figures 8B,D,F, indicate a greater phylogenetic difference for Pseudomonas spp. in Figure 8F and an increase in similarity in Figure 8B.
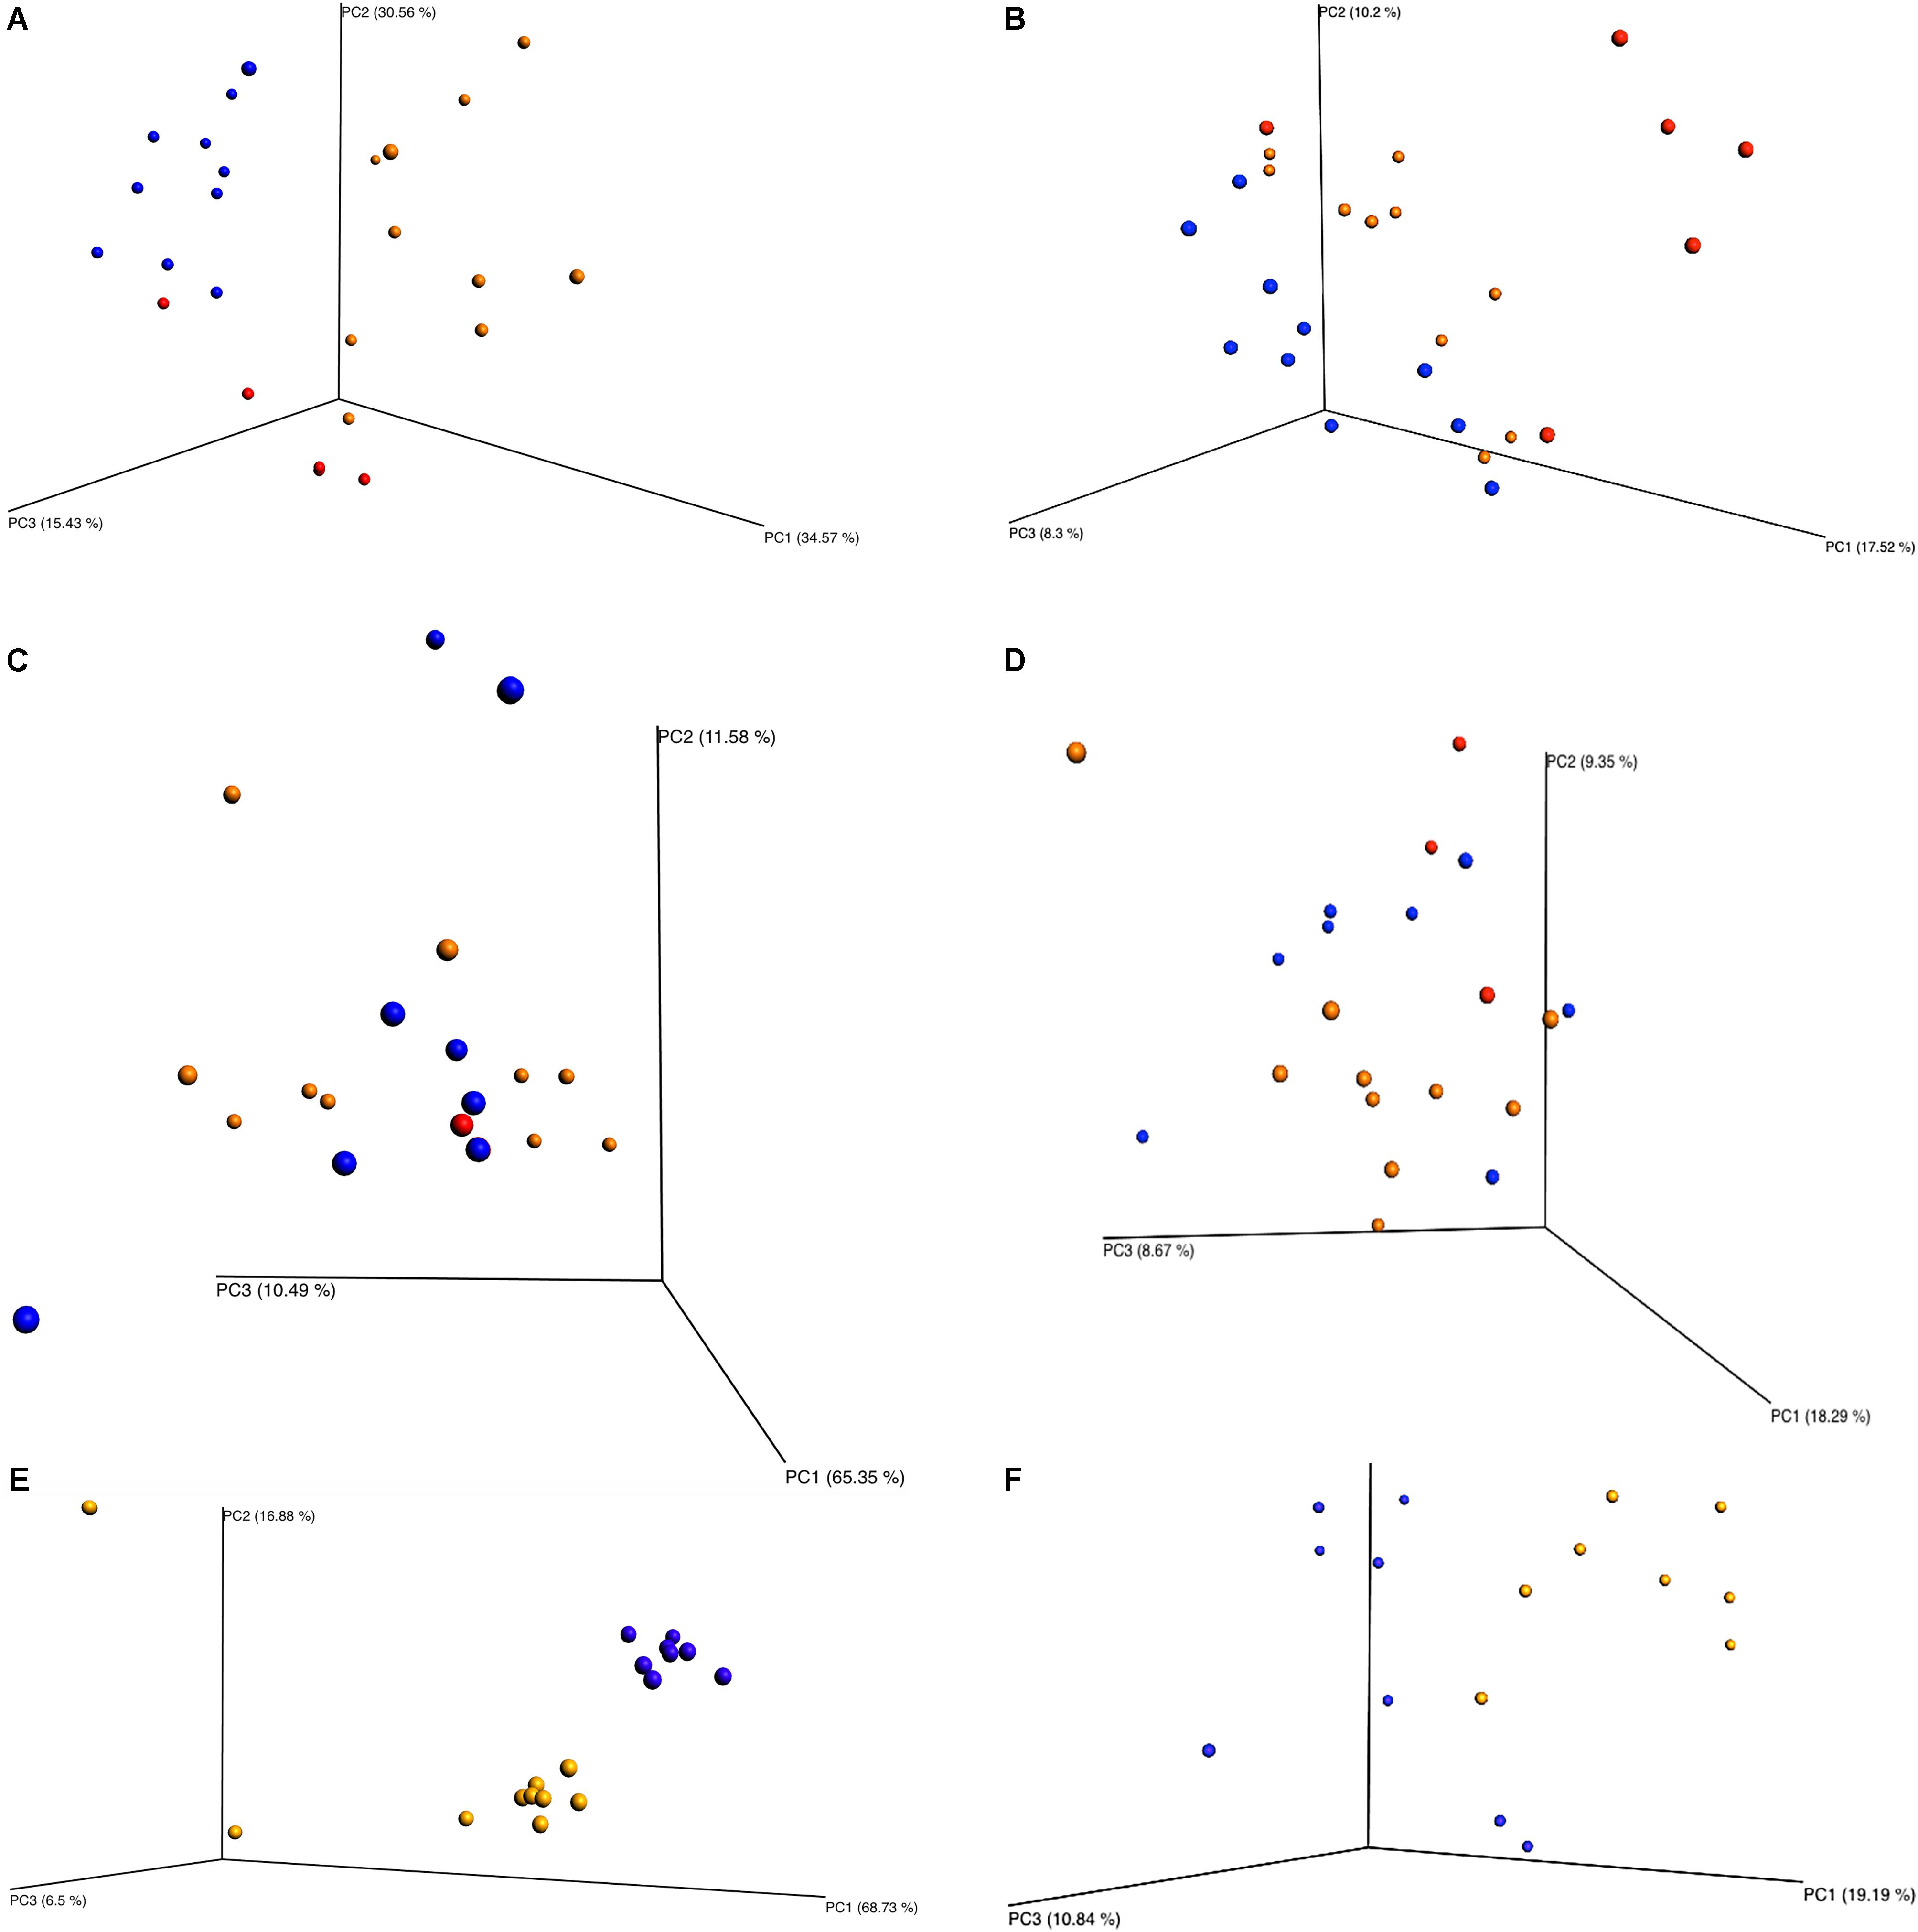
FIGURE 7. Beta diversity between sampling locations and individual processing abattoir. Weighted and unweighted UniFrac PCoA plots (A) Plant 1 weighted. (B) Plant 1 unweighted. (C) Plant 2 weighted. (D) Plant 2 unweighted. (E) Plant 3 weighted. (F) Plant 3 unweighted. Orange is for rehang, blue is for pre-chill, and red is for post-chill.
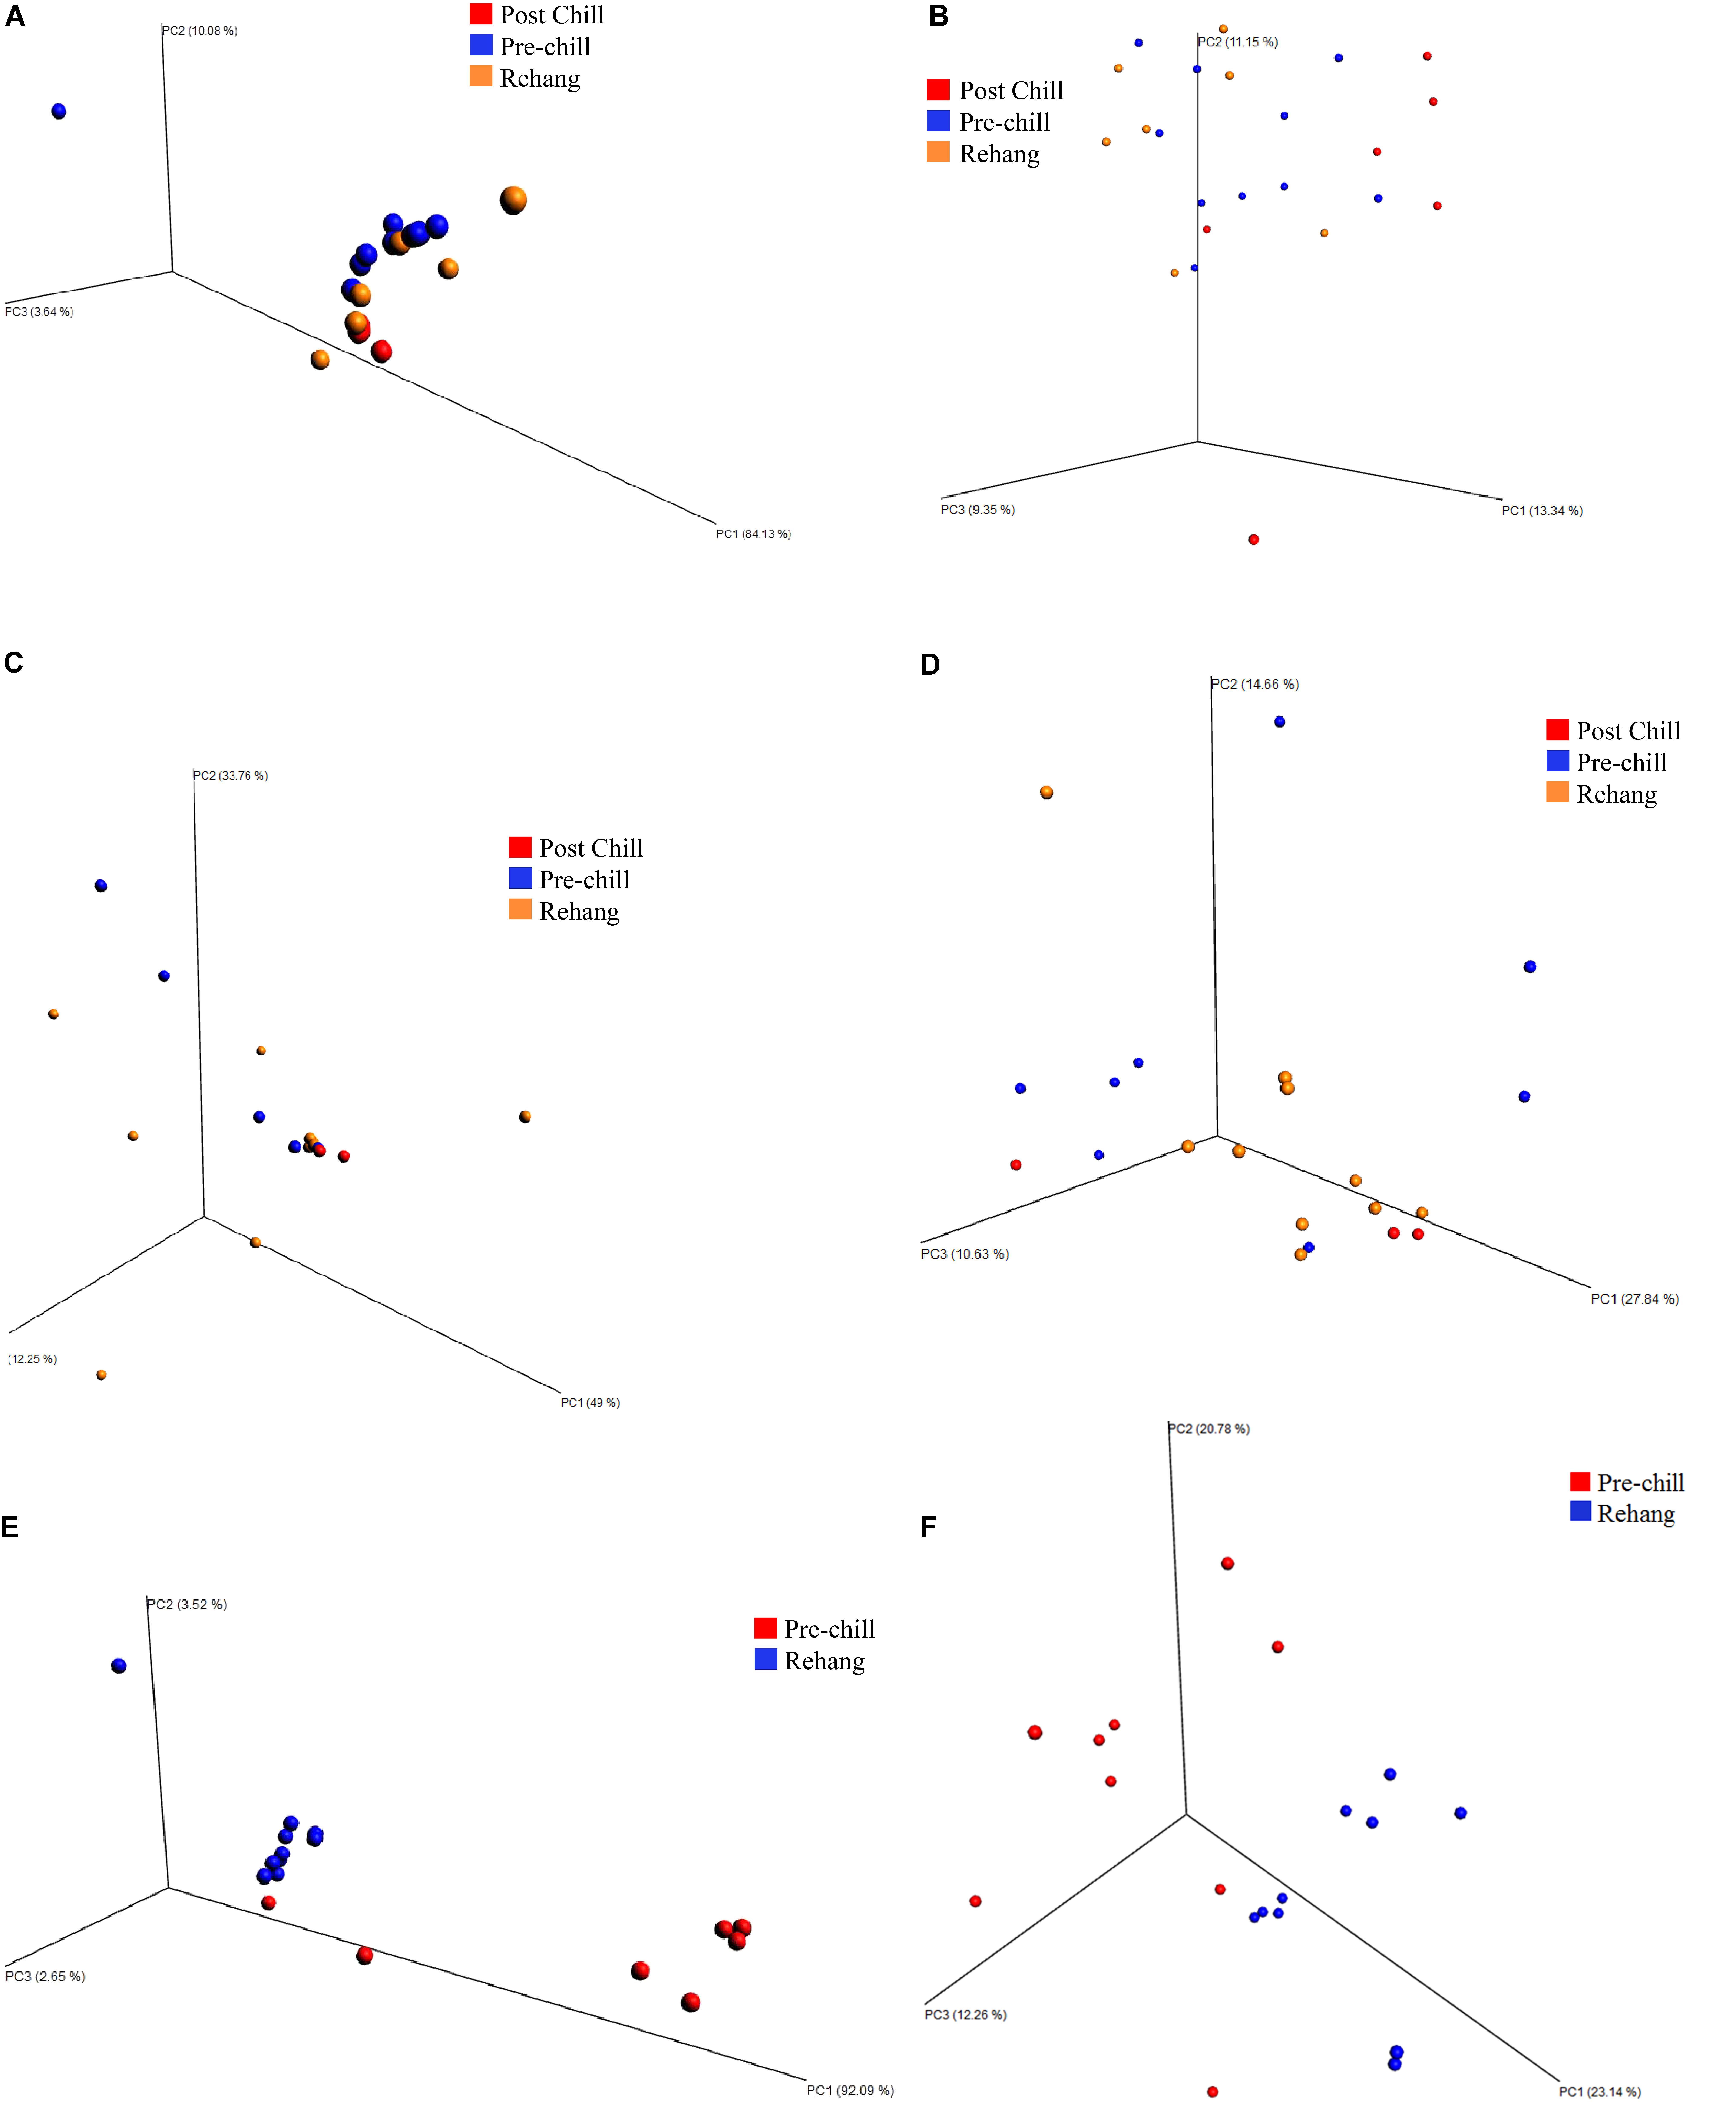
FIGURE 8. Beta diversity among Pseudomonas spp. between sampling locations and individual processing abattoir. Weighted and unweighted UniFrac PCoA plots (A) Plant 1 weighted. (B) Plant 1 unweighted. (C) Plant 2 weighted. (D) Plant 2 unweighted. (E) Plant 3 weighted. (F) Plant 3 unweighted. Orange is for rehang, blue is for pre-chill, and red is for post-chill.
Discussion
The quantitative data obtained in this investigation demonstrate the successful reduction of the bacterial load during the stages of evisceration. The data was utilized to build a biological map of the process and the additional microbiome profiles provided further insight into the organisms that were most prevalent through the evisceration process. In previous research, Zhang et al. (2011) reported post-chill results with an APC mean log 1.79 CFU/mL. Additionally, APC and Enterobacteriaceae exhibited post-chill results of mean log 2.86 and 0.66 CFU/mL, respectively (Handley et al., 2010). An investigation on the effectiveness of chlorinated chill water, James et al. (1992) reported post-chill carcasses yielding mean log 2.51 CFU/mL for APC and mean log 1.75 CFU/mL for Enterobacteriaceae. Similarly, Berrang and Dickens (2000) noted APC pre-chill and post-chill carcass counts of mean log 3.6 CFU/mL and 2.9 CFU/mL. As for pre-chill, Bauermeister et al. (2008) recovered APC mean log CFU/mL 4.24 from commercially processed carcasses.
Interestingly, the microbial counts obtained over these last 20 years have decreased as expected per changes in processing intervention strategies. Alternative antimicrobial strategies have been extensively investigated and are currently approved for the USDA Safe and Suitable List, such as formic acid, citric acid, lactic acid, propionic acid, peroxyacetic acid, tri-sodium phosphate, chlorine dioxide, acidified sodium chlorite, and cetylpyridinium chloride (Mulder et al., 1987; Izat et al., 1990; Dickens et al., 1994; Lillard, 1994; Doyle and Waldroup, 1996; Yang et al., 1998; Ricke, 2003; Ricke et al., 2005; Bauermeister et al., 2008; Sofos et al., 2013; Kim et al., 2017). These research studies and reviews have provided evidence that each antimicrobial has an optimal mode of application, such as dips, rinses, sprays, or chill tank use. Additionally, each intervention can be more effective on certain bacterial groups than others. For instance, it has been noted previously that citric acid was more effective against Gram positive bacteria than Gram negative bacteria (del Rio et al., 2007a,b; Alonso-Hernando et al., 2009). Hunter et al. (2009) reported a reduction in the Campylobacter subspecies diversity from rehang to post-chill using NGS.
More recently, microbiome analyses have been performed on the following poultry matrices, fecal, litter, carcasses, carcass weeps, and chlorinated chill tank water (Oakley et al., 2013; Rothrock et al., 2016; Kim et al., 2017). These studies noted shifts in the microbiota through the production process and noted within this study. The multiple interventions in the slaughter and evisceration process reduced both the microbial load and the diversity of the microbiome. Kim et al. (2017) observed a similar sample profile as this study, where 98.7% of the phyla present were identified as Firmicutes, Proteobacteria, Bacteroidetes, Actinobacteria, and Cyanobacteria. The organisms present in this study have also been previously reported by other researchers analyzing meat sample microbiomes or from meat spoilage investigations (Borch et al., 1996; Patsias et al., 2006; Nychas et al., 2008; Handley et al., 2010; Rothrock et al., 2016; Kim et al., 2017). The presence of Pseudomonas in fresh carcasses is consistent with observations made by Hanning et al. (2009) when they used PCR to detect and differentiate Pseudomonas spp. from retail poultry carcasses. Additionally, Pseudomonas spp. have been found to differ between fresh versus refrigerated poultry meat (Arnaut-Rollier et al., 1999; Morales et al., 2016). In characterizing Pseudomonas recovered from spoiled poultry fillets, Morales et al. (2016) observed considerable genotypic and phenotypic variability between and within species. Given the predominance of Pseudomonas observed in the current study and the genetic variability reported by Morales et al. (2016), whole genome sequencing of Pseudomonas spp. throughout processing and cold storage may reveal a pattern of particular strain succession during processing and cold storage. Likewise, the appearance of a particular strain at certain phases of processing may be indicative of the types of antimicrobials being employed. Finally, particular strains could be predictive indicators for increased likelihood of biofilm formation and/or favoring survival of certain foodborne pathogens such as Campylobacter (Hanning et al., 2009; Hilbert et al., 2010; Morales et al., 2016).
Conclusion
The evisceration process largely impacted the microbial diversity on carcass quality. This study identified the potential use of NGS in association with quantitative microbial data to determine the efficacy of a commercial antimicrobial multi-hurdle system. Additionally, broiler carcasses were characterized to establish a typical commercial microbiome profile. As for the identification of potential indicator organisms, Pseudomonas, Enterobacteriaceae, and Weeksellaceae Chryseobacterium were identified as potential indicator organisms because they were isolated from all processing abattoirs and sampling locations.
Data Availability Statement
Data are available in the following link: https://figshare.com/s/83a369e639f0a54bd77e.
Author Contributions
JH, SP, SK, and SR designed the experiments. JH performed the experiments and JH, SP, and SK analyzed the data. JH, SP, SK, and SR revised the manuscript.
Conflict of Interest Statement
The authors declare that the research was conducted in the absence of any commercial or financial relationships that could be construed as a potential conflict of interest.
Acknowledgments
JH would like to thank all of those individuals that provided support with this research. This includes his family, advisor, and colleagues that assisted with sample collection, reviewing data and providing both knowledge and financial support.
References
Alonso-Hernando, A., Alonso-Calleja, C., and Capita, R. (2009). Comparative analysis of acid resistance in Listeria monocytogenes and Salmonella enterica strains before and after exposure to poultry decontaminants. Role of the glutamate decarboxylase (GAD) system. Food Microbiol. 26, 905–909. doi: 10.1016/j.fm.2009.06.008
Arnaut-Rollier, I., De Zutter, L., and Van Hoof, J. (1999). Identities of the Pseudomonas spp. on flora from chilled chicken. Int. J. Food Microbiol. 48, 87–96. doi: 10.1016/S0168-1605(99)00038-0
Bauermeister, L. J., Bowers, J. W., Townsend, J. C., and McKee, S. R. (2008). The microbial and quality properties of poultry carcasses treated with peracetic acid as an antimicrobial treatment. Poult. Sci. 87, 2390–2398. doi: 10.3382/ps.2008-00087
Berrang, M. E., and Dickens, J. A. (2000). Presence and level of Campylobacter spp. on broiler carcasses throughout the processing plant. J. Appl. Poult. Res. 9, 43–47. doi: 10.1093/japr/9.1.43
Borch, E., KantMuermans, M. L., and Blixt, Y. (1996). Bacterial spoilage of meat and cured meat products. Int. J. Food Microbiol. 33, 103–120. doi: 10.1016/0168-1605(96)01135-X
Caporaso, J. G., Kuczynski, J., Stombaugh, J., Bittinger, K., Bushman, F. D., Costello, E. K., et al. (2010). QIIME allows analysis of high-throughput community sequencing data. Nat. Methods 7, 335–336. doi: 10.1038/nmeth.f.303
del Rio, E., Muriente, R., Prieto, M., Alonso-Calleja, C., and Capita, R. (2007a). Effectiveness of trisodium phosphate, acidified sodium chlorite, citric acid, and peroxyacids against pathogenic bacteria on poultry during refrigerated storage. J. Food Prot. 70, 2063–2071.
del Rio, E., Panizo-Moran, M., Prieto, M., Alonso-Calleja, C., and Capita, R. (2007b). Effect of various chemical decontamination treatments on natural microflora and sensory characteristics of poultry. Int. J. Food Microbiol. 115, 268–280.
Dickens, J. A., Lyon, B. G., Whittemore, A. D., and Lyon, C. E. (1994). The effect of an acetic acid dip on carcass appearance, microbiological quality, and cooked breast meat texture and flavor. Poult. Sci. 73, 576–581. doi: 10.3382/ps.0730576
Doyle, M., and Waldroup, A. (1996). “Microbiological evaluations of chlorine dioxide in a commercial poultry plant,” in Proceedings of the 88th Annual Meeting of the Poultry Science Association, Louisville, KY, (Savoy, IL: Poultry Science Association).
Food Safety and Inspection Service USDA (1996a). Part 417.2 (b)(1) Hazard Analysis and Critical Control Point (HACCP) Systems. Title 9 Code of Federal Regulations. Ithaca, NY: Legal Information Institute.
Food Safety and Inspection Service USDA (1996b). Poultry Product Inspection Regulation. Title 9 Code of Federal Regulation, 381.94. Washington, DC: U.S. Government Publishing Office.
Food Safety and Inspection Service USDA (1996c). Meat and poultry inspection: pathogen reduction; hazard analysis and critical control point (HAACP) systems, Final Rule. Fed. Reg. 61, 38806–38989.
Food Safety and Inspection Service USDA (2010). New performance standards for Salmonella and Campylobacter in young chicken and turkey slaughter establishments. Fed. Reg. 75, 27288–27294.
Food Safety and Inspection Service USDA (2017). Microbiological Laboratory Guidebook, eds B. P. Dey and C. P. Lattuada (Athens: Office of Public Health Science).
Handley, J. A., Hanning, I., Ricke, S. C., Johnson, M. G., Jones, F. T., and Apple, R. O. (2010). Temperature and bacterial profile of post chill poultry carcasses stored in processing combo held at room temperature. J. Food Sci. 75, M515–M520. doi: 10.1111/j.1750-3841.2010.01790.x
Handley, J. A., Zhaohao, S., Park, S. H., Dawoud, T. M., Kwon, Y. M., and Ricke, S. C. (2015). “Salmonella and the potential role for methods to develop microbial process indicators on chicken carcasses,” in Food Safety Emerging Issues, Technologies, and Systems, eds S. C. Ricke, J. R. Donaldson, and C. A. Phillips (Amsterdam: Academic Press), 81–104.
Hanning, I., Jarquin, R., O’Leary, A., and Slavik, M. (2009). Polymerase chain reaction-based assays for the detection and differentiation of poultry significant Pseudomonads. J. Rapid Methods Automat. Microbiol. 17, 490–502. doi: 10.1111/j.1745-4581.2009.00185.x
Hilbert, F., Scherwitzel, M., Paulsen, P., and Szostak, M. P. (2010). Survival of Campylobacter jejuni under conditions of atmospheric oxygen tension with the support of Pseudomonas spp. Appl. Environ. Microbiol. 76, 5911–5917. doi: 10.1128/AEM.01532-10
Hunter, S. M., Berrang, M. E., Meinersmann, R. J., and Harrison, M. A. (2009). Genetic diversity of Campylobacter on broiler carcasses collected pre-evisceration and post chill in 17 U.S. poultry processing plants. J. Food Prot. 72, 49–54. doi: 10.4315/0362-028X-72.1.49
Izat, A. L., Colberg, M., Thomas, R. A., Adams, M. H., and Driggers, C. D. (1990). Effects of lactic acid in processing waters on the incidence of Salmonellae on broilers. J. Food Qual. 13, 295–306. doi: 10.1111/j.1745-4557.1990.tb00025.x
James, C., Vincent, C., de Andrade Lima, T. I., and James, S. J. (2006). The primary chilling of poultry carcasses – a review. Int. J. Refrig. 29, 847–862. doi: 10.1016/j.ijrefrig.2005.08.003
James, W. O., Williams, W. O., Prucha, J. C., Johnston, R., and Christensen, W. (1992). Profile of selected bacterial counts and Salmonella prevalence on raw poultry in a poultry slaughter establishment. J. Am. Vet. Med. Assoc. 200, 57–59.
Kim, S. A., Park, S. H., Lee, S. I., Owens, C. M., and Ricke, S. C. (2017). Assessment of chicken carcass microbiome responses during processing in the presence of commercial antimicrobials using a next generation sequencing approach. Sci. Rep. 7:43354. doi: 10.1038/srep43354
Kotula, K. L., and Pandya, Y. (1995). Bacterial contamination of broiler chickens before scalding. J. Food Prot. 58, 1326–1329. doi: 10.4315/0362-028X-58.12.1326
Kozich, J. J., Westcott, S. L., Baxter, N. T., Highlander, S. K., and Schloss, P. D. (2013). Development of a dual-index sequencing strategy and curation pipeline for analyzing amplicon sequence data on the MiSeq Illumina sequencing platform. Appl. Environ. Microbiol. 79, 5112–5120. doi: 10.1128/AEM.01043-13
Lillard, H. S. (1989). Factors affecting the persistence of Salmonella during the processing of poultry. J. Food Prot. 52, 829–832. doi: 10.4315/0362-028X-52.11.829
Lillard, H. S. (1990). Effect on broiler carcasses and water of treating chiller water with chlorine or chlorine dioxide. Poult. Sci. 59, 1761–1766. doi: 10.3382/ps.0591761
Lillard, H. S. (1994). Effect of trisodium phosphate on Salmonellae attached to chicken skin. J. Food Prot. 57, 465–469. doi: 10.4315/0362-028X-57.6.465
Millilo, S. R., Martin, E., Muthaiyan, A., and Ricke, S. C. (2011). Immediate reduction of Salmonella enterica serotype Typhimurium viability via membrane destabilization following exposure to multiple-hurdle treatments with heated, acidified organic acid salt solution. Appl. Environ. Microbiol. 77, 3765–3772. doi: 10.1128/AEM.02839-10
Morales, P. A., Aguirre, J. S., Troncoso, M. R., and Figueroa, G. O. (2016). Phenotypic and genotypic characterization of Pseudomonas spp. present in spoiled poultry fillets sold in retail settings. LWT Food Sci. Technol. 73, 609–614. doi: 10.1016/j.lwt.2016.06.064
Mulder, R. W., van der Hulst, M. C., and Bolder, N. M. (1987). Salmonella decontamination of broiler carcasses with lactic acid, L-cysteine, and hydrogen peroxide. Poult. Sci. 66, 1555–1557. doi: 10.3382/ps.0661555
Northcutt, J. K., Smith, D., Huezo, R. I., and Ingram, K. D. (2008). Microbiology of broiler carcasses and chemistry of chiller water as affected by water reuse. Poult. Sci. 87, 1458–1463. doi: 10.3382/ps.2007-00480
Nychas, G. E., Skandamis, P. N., Tassou, C. C., and Koutsoumanis, K. P. (2008). Meat spoilage during distribution. Meat Sci. 78, 77–89. doi: 10.1016/j.meatsci.2007.06.020
Oakley, B. B., Morales, C. A., Line, J., Berrang, M. E., Meinersmann, R. J., Tillman, G. E., et al. (2013). The poultry-associated microbiome: network analysis and farm-to-fork characterizations. PLoS One 8:e57190. doi: 10.1371/journal.pone.0057190
Park, S. H., Gibson, K. E., Almeida, G., and Ricke, S. C. (2014). Assessment of gastrointestinal microflora in pasture raised chickens fed two commercial prebiotics. J. Prob. Health 2:122. doi: 10.4172/2329-8901.1000122
Park, S. H., Lee, S. I., and Ricke, S. C. (2016). Microbial Populations in naked neck chicken ceca raised on pasture flock fed with commercial yeast cell wall prebiotics via an Illumina MiSeq Platform. PLoS One 11:e0151944. doi: 10.1371/journal.pone.0151944
Patsias, A., Chouliara, I., Badeka, A., Savvaidis, I. N., and Kontominas, M. G. (2006). Shelf-life of a chilled precooked chicken product stored in air and under modified atmospheres: microbiological, chemical, sensory attributes. Food Microbiol. 23, 423–429. doi: 10.1016/j.fm.2005.08.004
Purnell, G., James, C., James, S. J., Howell, M., and Corry, J. E. L. (2014). Comparison of acidified sodium chlorite, chlorine dioxide, peroxyacetic acid and tri-sodium phosphate spray washes for decontamination of chicken carcasses. Food Bioprocess Technol. 7, 2093–2101. doi: 10.1007/s11947-013-1211-8
Ricke, S. C. (2003). Perspectives on the use of organic acids and short chain fatty acids as antimicrobials. Poult. Sci. 82, 632–639. doi: 10.1093/ps/82.4.632
Ricke, S. C., Kundinger, M. M., Miller, D. R., and Keeton, J. T. (2005). Alternatives to antibiotics: chemical and physical antimicrobial interventions and foodborne pathogen response. Poult. Sci. 84, 667–675. doi: 10.1093/ps/84.4.667
Rothrock, M. J., Locatelli, A., Glenn, T. C., Thomas, J. C., Caudill, A. C., Kiepper, B. H., et al. (2016). Assessing the microbiomes of scalder and chiller tank waters throughout a typical commercial poultry processing day. Poult. Sci. 95, 2372–2382. doi: 10.3382/ps/pew234
Scallan, E., Hoekstra, R. M., Widdowson, M., Hall, A. J., and Griffin, P. M. (2011). Foodborne illness acquired in the United States response. Emerg. Infect. Dis. 17, 1339–1340. doi: 10.3201/eid1707.110572
Sofos, J. N., Flick, G., Nychas, G. J., O’Bryan, C. A., Ricke, S. C., and Crandall, P. G. (2013). “Meat, poultry, and seafood,” in Food Microbiology: Fundamentals and Frontiers, 4th Edn, eds M. P. Doyle and R. L. Buchanan (Washington, DC: ASM Press), 111–167.
Solow, A. R. (1993). A simple test for change in community structure. J. Anim. Ecol. 62, 191–193. doi: 10.2307/5493
Stern, N. J., Fedorka-Cray, P., Bailey, J. S., Cox, N. A., Craven, S. E., Hiett, K. L., et al. (2001). Distribution of Campylobacter spp. in selected U.S. poultry production and processing operations. J. Food Prot. 64, 1705–1710. doi: 10.4315/0362-028X-64.11.1705
Stopforth, J. D., O’Connor, R., Lopes, M., Kottapalli, B., Hill, W. E., and Samadpour, M. (2007). Validation of individual and multiple-sequential interventions for reduction of microbial populations during processing of poultry carcasses and parts. J. Food Prot. 70, 1393–1401. doi: 10.4315/0362-028X-70.6.1393
Whyte, P., McGill, K., Monahan, C., and Collins, J. D. (2004). The effect of sampling time on the levels of micro-organisms recovered from broiler carcasses in a commercial slaughter plant. Food Microbiol. 21, 59–65. doi: 10.1016/S0740-0020(03)00040-6
Yang, Z., Li, Y., and Slavik, M. (1998). Use of antimicrobial spray applied with an inside-outside bird washer to reduce bacterial contamination on pre-chilled chicken carcasses. J. Food Prot. 61, 829–832. doi: 10.4315/0362-028X-61.7.829
Keywords: poultry, Salmonella, Pseudomonas, microbiome, next generation sequencing, slaughter
Citation: Handley JA, Park SH, Kim SA and Ricke SC (2018) Microbiome Profiles of Commercial Broilers Through Evisceration and Immersion Chilling During Poultry Slaughter and the Identification of Potential Indicator Microorganisms. Front. Microbiol. 9:345. doi: 10.3389/fmicb.2018.00345
Received: 01 November 2017; Accepted: 12 February 2018;
Published: 02 March 2018.
Edited by:
Rosalba Lanciotti, Università di Bologna, ItalyReviewed by:
Sunil D. Saroj, Symbiosis International University, IndiaMaria Schirone, Università di Teramo, Italy
Copyright © 2018 Handley, Park, Kim and Ricke. This is an open-access article distributed under the terms of the Creative Commons Attribution License (CC BY). The use, distribution or reproduction in other forums is permitted, provided the original author(s) and the copyright owner are credited and that the original publication in this journal is cited, in accordance with accepted academic practice. No use, distribution or reproduction is permitted which does not comply with these terms.
*Correspondence: Steven C. Ricke, c3JpY2tlQHVhcmsuZWR1
†Present address: Si Hong Park, Department of Food Science and Technology, Oregon State University, Corvallis, OR, United States; Sun Ae Kim, Department of Food Science and Engineering, Ewha Womans University, Seoul, South Korea
 John A. Handley
 Si Hong Park
 Sun Ae Kim
 Steven C. Ricke