- 1Microsensor Group, Max-Planck-Insititute for Marine Microbiology, Bremen, Germany
- 2Department of Geoscience, University of Calgary, Calgary, AB, Canada
Alkaline Soda Lakes are extremely productive ecosystems, due to their high dissolved inorganic carbon (DIC) concentrations. Here, we studied the dynamics of the carbonate system, in particular, the role of extracellular carbonic anhydrase (eCA) of an alkaliphilic phototrophic biofilm composed of bacteria enriched from soda lake benthic mats. By using measurements with microsensors and membrane inlet mass spectrometry, combined with mathematical modeling, we show how eCA controls DIC uptake. In our experiments, the activity of eCA varied four-fold, and was controlled by the bicarbonate concentration during growth: a higher bicarbonate concentration led to lower eCA activity. Inhibition of eCA decreased both the net and the gross photosynthetic productivities of the investigated biofilms. After eCA inhibition, the efflux of carbon dioxide (CO2) from the biofilms increased two- to four-fold. This could be explained by the conversion of CO2, leaking from cyanobacterial cells, by eCA, to bicarbonate. Bicarbonate is then taken up again by the cyanobacteria. In suspensions, eCA reduced the CO2 leakage to the bulk medium from 90 to 50%. In biofilms cultivated at low bicarbonate concentration (~0.13 mM), the oxygen production was reduced by a similar ratio upon eCA inhibition. The role of eCA in intact biofilms was much less significant compared to biomass suspensions, as CO2 loss to the medium is reduced due to mass transfer resistance.
Introduction
Alkaline Soda lakes are extremely productive due to the high DIC availability, and can be found in various geographical locations around the globe (Melack, 1981; Priscu et al., 1982; Kompantseva et al., 2009). Soda lakes are believed to have existed throughout the geological record of Earth, and are abundant in dry terrestrial biomes. These lakes support the growth of an large array of microorganisms that are of ecological and economic importance (Antony et al., 2013). Microalgae that thrive in the high pH and salinity can highly efficiently photosynthesize due to the elevated dissolved organic carbon (DIC) levels. This makes biofilms from alkaline environments potentially useful for carbon capture. The high medium pH can scrub effectively CO2 from the exhaust gasses from large CO2 producing industrial units, elevating the DIC in the medium to very high levels, while phototrophs can maintain the high pH in the scrubber liquid. Initial studies on the phototrophic microorganisms of natural alkaline and saline lakes, especially the biofilm forming cyanobacteria, demonstrated their very high phototrophic activity (Sharp et al., 2017). A mechanistic understanding of the DIC uptake in the biomass is desired and the aim of this study.
DIC exists in aqueous solution in 4 forms: as carbon dioxide (CO2), carbonic acid (H2CO3), bicarbonate ions (), and carbonate ions ().
The interconversion between CO2 and H2CO3 is relatively slow, with an 90% equilibration in 20 s under typical conditions, while the rest of the carbonate system equilibrates instantly. The highly effective enzyme carbonic anhydrase (CA) accelerates the reversible hydration of CO2. For convenience, the species CO2 and H2CO3 are often taken together and the hydration of CO2 is then noted to produce bicarbonate () (Giordano et al., 2005).
Phototrophic organisms are able to take up both CO2 and as the carbon source for photosynthesis, whereby an essential difference is that CO2 can passively pass membranes and is actively taken up by transporters, driven by membrane potentials or ATP. Thus, uptake of can be controlled by the cell through adjusting the amount and affinity of the transporters. In photosynthesis, during carbon fixation, Ribulose-1,5-bisphosphate carboxylase/oxygenase (RuBisCo) only accepts CO2 as the substrate, and is first converted to CO2 (Giordano et al., 2005).
CA is crucial in CO2 exchanging transport tissue, e.g., in lungs, and also is essential in DIC uptake by phototrophic microorganisms. It plays an important but not yet entirely understood role in the carbon concentration mechanism (CCM). Intracellular carbonic anhydrase (iCA) facilitates rapid to CO2 conversion in the direct vicinity of RuBisCo, thus increasing the CO2 concentration around RuBisCo. The ensuing elevation of the CO2/O2 ratio increases its efficiency as carboxylase (Giordano et al., 2005). Extracellular carbonic anhydrase (eCA) has been detected in several phototrophic microorganisms, both in cyanobacteria and in eukaryotes, and is thought to have a role in DIC uptake into the cell (Katsunori and Shigetoh, 1986; Nimer et al., 1999; Kupriyanova et al., 2003, 2007, 2011; Karim et al., 2011; Hopkinson et al., 2013; Hamizah et al., 2017). This may be increasingly important at higher pH and/or lower dissolved free CO2 concentrations (i.e., hyperalkaline environments). So far, studies on the role of iCA and eCA in photosynthesis focused on phytoplankton rather than biofilms/mats (Katsunori and Shigetoh, 1986; Nimer et al., 1999; Kupriyanova et al., 2003, 2007, 2011; Karim et al., 2011; Hopkinson et al., 2013; Hamizah et al., 2017). Due to mass transfer resistances, the pH value in mats can be very high during photosynthesis, likely enhancing the role of eCA for DIC uptake and photosynthesis (Revsbech et al., 1981; Revsbech and Jørgensen, 1983; Revsbech, 1989; Jensen et al., 1993; Epping et al., 1999; Ionescu et al., 2014; Nielsen et al., 2015). Indeed, the mat-forming alkaliphilic cyanobacterium Microcoleus chthonoplastes possesses eCA, whose activity increases with pH values (Kupriyanova et al., 2003, 2007, 2011).
We aimed to investigate how eCA activity impacts DIC uptake and productivity. With organisms enriched from soda-lake benthic mats, an alkaliphilic phototrophic biofilm was created as a model system. The DIC uptake and the role of eCA in the DIC dynamics of this model system were investigated with a combination of methods, including microsensors, membrane inlet mass spectrometer, and mathematically modeling. We tested the hypothesis that the eCA is important for DIC uptake, especially at low bicarbonate concentrations. We expected that the cells will increase eCA activity when the DIC is limiting photosynthesis.
Methods and Materials
Sample Preparation
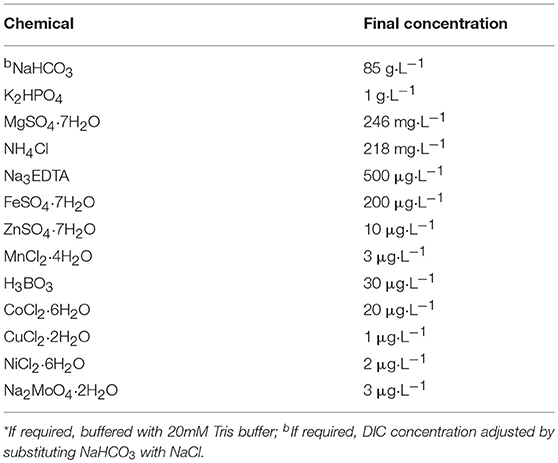
The biomass used for inoculating the investigated biofilm was prepared as described previously (Sharp et al., 2017). In short, phototrophic benthic mat samples were collected from four soda-lakes on the Cariboo Plateau, British Columbia in May 2015. Mat samples were homogenized and mixed in equal wet weight proportions. Phototrophs were enriched in flat panel photobioreactors (PBRs) with high pH and high alkalinity medium (“3e medium,” Table 1). The PBRs were exposed to 80 μmol photon m−2 s−1 red light (fluorescent lamp equipped with a red-pass filter, Congo Red) under a 16:8 light/dark cycle at 25 ± 2°C. During cultivation, the medium was exchanged regularly and the biomass in the PBR was harvested once every week. The enriched biomass was dominated by the cyanobacterium Phormidium kuetzingianum (>50% relative abundance) (Sharp et al., 2017).
Biomass was harvested from the photobioreactors, resuspended in medium, allowed to settle for 1 h, after which the supernatant was replaced with DIC free medium and resuspended. After 5 min, the biomass was concentrated by centrifugation (500 × G, 1 min), and the pellet resuspended in DIC free medium. This process was repeated twice. Agar plates (4% and amended with corresponding media) were submerged in “3e medium” modified to have 0, 0.01, 01, 0.5, or 1 M DIC. Then the concentrated biomass was inoculated onto agar plates. Biofilm formation on the agar plate occurred within 12 h. The DIC concentration was adjusted by decreasing the NaHCO3 concentration of the “3e medium,” compensated by NaCl to keep Na+ constant. Due to equilibration with air, 0 M DIC actually contained about 0.13 mM DIC. Solidified agar plates each with a surface area of 23 cm2 were used as substrate for biofilm support. For every DIC concentration, 2 such agar plates were inoculated, and cultivated in their respective media using halogen lamps (General Electric, USA) with continuous illumination and a light intensity of 100 μmole·m−2·s−1 at 23°C, submerged in a flow cell (2 cm under surface). Each flow cell system had a total volume of 1.5 L, including the recirculation reservoir. The agar plates were cultivated for 5–7 days without changing the medium before measurement, the medium was circulated using a peristatic pump with a flow rate of 0.65 mL·min−1.
Microsensor Measurements
Profiles of oxygen (O2) concentration (Revsbech, 1989) and pH (Jensen et al., 1993) were measured using microsensors with tip diameter of maximally 15 μm. The LIX pH sensors were prepared with protective protein coating (De Beer et al., 1997). Gross photosynthetic productivity was measured by the light/dark shift method using an oxygen microsensor with <0.2 s response time (Revsbech et al., 1981; Revsbech and Jørgensen, 1983). The microsensors were prepared, calibrated and used as described previously (Revsbech et al., 1981; Revsbech and Jørgensen, 1983; Revsbech, 1989; Jensen et al., 1993; Epping et al., 1999). The agar plate with the biofilm was place in 300 mL of freshly prepared medium (with identical composition as during cultivation). The water column above the biofilm surface was 2 cm. The sensors were positioned perpendicularly to the biofilm surface. The sample was equilibrated for 10 min before the first microsensor measurement. The medium was mixed by an airstream across the medium surface. The measurements were first performed on biofilms without inhibitor. Then, an eCA inhibitor, acetazolamide (AZ) (Mercado et al., 2009; Hopkinson et al., 2013) was injected 3–4 min before the measurement into the measurement chamber (final concentration of 150 μM). During microsensor measurements, the illumination was identical to that applied during biofilm cultivation. Calibration of the oxygen sensors was performed using N2 and air bubbled “3e medium,” the O2 concentration of air saturated medium was calculated using the ambient temperature and salinity of the respective media (Sherwood et al., 1991). Calibration of the pH sensors was performed using commercial buffer solutions (pH 7 and 9, Fluka, Germany).
Membrane Inlet Mass Spectrometry (MIMS)
MIMS measurements were carried out using an Agilent 5977A MSD (Agilent, USA) mass spectrometer connected to a custom-made membrane inlet cuvette, the construction of the cuvette has been described previously (Rost et al., 2007; Beckmann et al., 2009). A PTFE membrane (10 μm thick, 0.33 cm2 surface area; Reichelt Chemical Technique, Germany) was selected as the inlet. The 6 mL cuvette had an injection port at the top of the cuvette. A suspended magnetic stirrer was positioned directly above the membrane, and the temperature of the cuvette was kept constant with a build-in water jacket at 20°C. Biomass was harvested from the agar plates, washed twice in DIC free medium, and consequently concentrated by centrifugation (1,000 × G, 30 s), then homogenized by forcing the biomass through a 0.2 mm inner diameter syringe needle several times. This procedure broke the biofilm into small and relatively uniformly sized pieces (ca. 0.1 mm in diameter). Microscopic inspection of the concentrated biomass and the absence of pigments in the supernatant showed that the procedure does not disrupt cells. To determine the ash free dry weight (AFDW) of the biomass, the biomass was first washed twice with DIC free medium, then dried at 70°C overnight. The AFDW was calculated as the weight loss after combustion at 550°C for 3 h.
The eCA activity was measured with a method as described previously (Palmqvist et al., 1994). The MIMS cuvette was covered to exclude all light. DIC solution, prepared using NaH13C18O3, was injected into the MIMS cuvette containing DIC free medium buffered to pH 8.7 (Tris buffer) to achieve a final DIC concentration of 1 mM. The log enrichment of 13C18O2 was then monitored for at least 10 min. The log-enrichment of 13C18O2 was calculated as:
IC with the different subscripts are the mass spectrometer counts of the different 13CO2 species.
Subsequently, 0.6 mL of the processed biomass was injected into the cuvette suspension (corresponding to a final biomass AFDW concentration between 0.18 and 0.26 mg·mL−1 in the cuvette), and the change of the log-enrichment of 13C18O2 was monitored for a further 10 min. Due to its catalytic activity, eCA will increase the 18O lost rate of 13C18O2, thus accelerate the decrease of the log enrichment of 13C18O2. Consequently, eCA activity can be quantified as the change in the decay rate of the log-enrichment of 13C18O2 per g AFDW (Palmqvist et al., 1994). An example of the acquired time vs. log enrichment chart is given in Figure 1, and the eCA activity was quantified as:
in Equation (3), S1 and S2 are the slope of the log-enrichment of 13C18O2 change before and after injection of biomass, respectively, as shown in Figure 1, and AFDW is the ash-free dry weight of the biomass injected in this particular measurement.
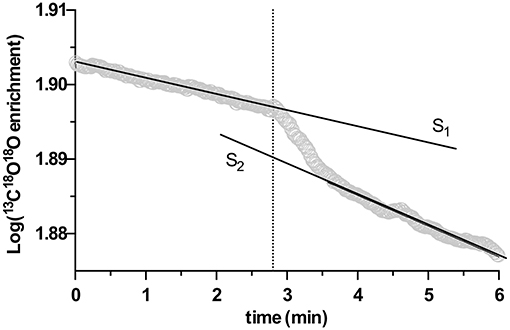
Figure 1. An example of extracellular carbonic anhydrase (eCA) activity measurement with membrane inlet mass spectrometry (MIMS), performed in the dark. X-axis is time, Y-axis represents the log enrichment of 13C18O18O, calculated with Equation (1). At the time point indicated by the dotted line, biomass was injected. S1 and S2 depict the slopes of linear regressions performed on the rate of decay of log enrichment of 13C18O18O before and after biomass injection.
The MIMS setup was also applied to investigate DIC uptake of the biomass harvested from the agar plates: The MIMS cuvette was filled with “3e medium” modified with 0.1 M DI13C prepared using NaH13CO3 and buffered to pH 8.7 using Tris buffer. To initiate the measurement, DIC free medium washed and homogenized biomass was injected in the dark into the cuvette (final AFDW concentration between 0.18 and 0.26 mg·mL−1). After 3 min, 100 μmole·m−2·s−1 light was supplied by turning on a halogen lamp. The signals of O2, 12CO2, and 13CO2 (m/z value 32, 44, 45, respectively) were monitored. After the steady state was reached (indicated by linear behavior of the signals, achieved within 5 min), the signals were monitored for at least 5 more minutes to acquire steady state rates (linear phase slope). Then, an eCA inhibitor, dextran-bound-acetazolamide (DBAZ) was added into the cuvette to a final concentration of 150 μM (Hopkinson et al., 2013). As DBAZ cannot enter the cell, it inhibits only eCA. The aforementioned signals were monitored further for at least 10 min, and the linear slopes were calculated. Finally, to acquire dark respiration rates, the light was turned off for the last 10 min of the measurement. To calculate the absolute rate, the MIMS signals were calibrated using linear calibration curves (for O2, N2 and air bubbled “e3 medium”; for 13CO2, N2 bubbled DIC free “3e medium,” 0.001 M and 0.1 M DI13C “e3 medium,” buffered to pH 8.7). Also, the consumption of O2 by the MIMS, and the effect of temperature and salinity on O2 concertation were corrected (Sherwood et al., 1991). The equilibrium constants, K1 and K2, of the carbonate system for calculating various DIC concentrations was given in Table 3 (Davies, 1962; Eigen, 1964; Steiner et al., 1975; Johnson, 1982; DOE, 1994; Millero et al., 2002; Schulz et al., 2006; Wolf et al., 2007; Lee and Rasaiah, 2013). If not otherwise specified, all curves in the figures were created using one phase log-association provided by the software Prism (Graphpad, USA).
Mathematical Model
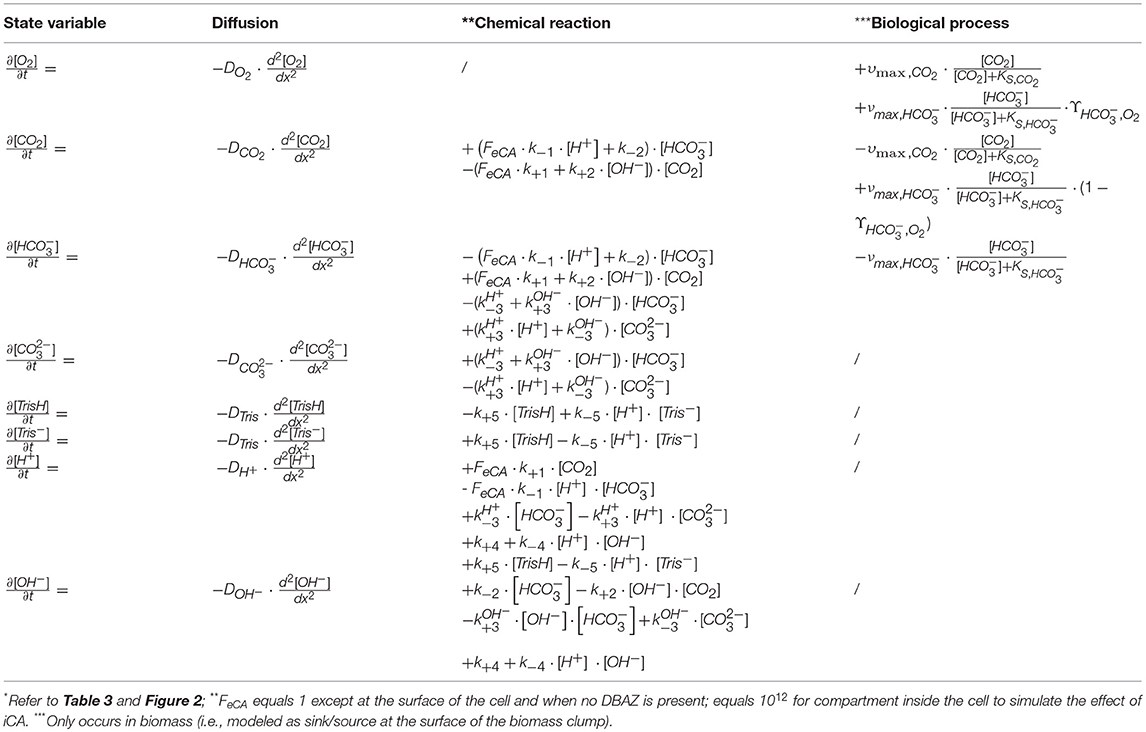
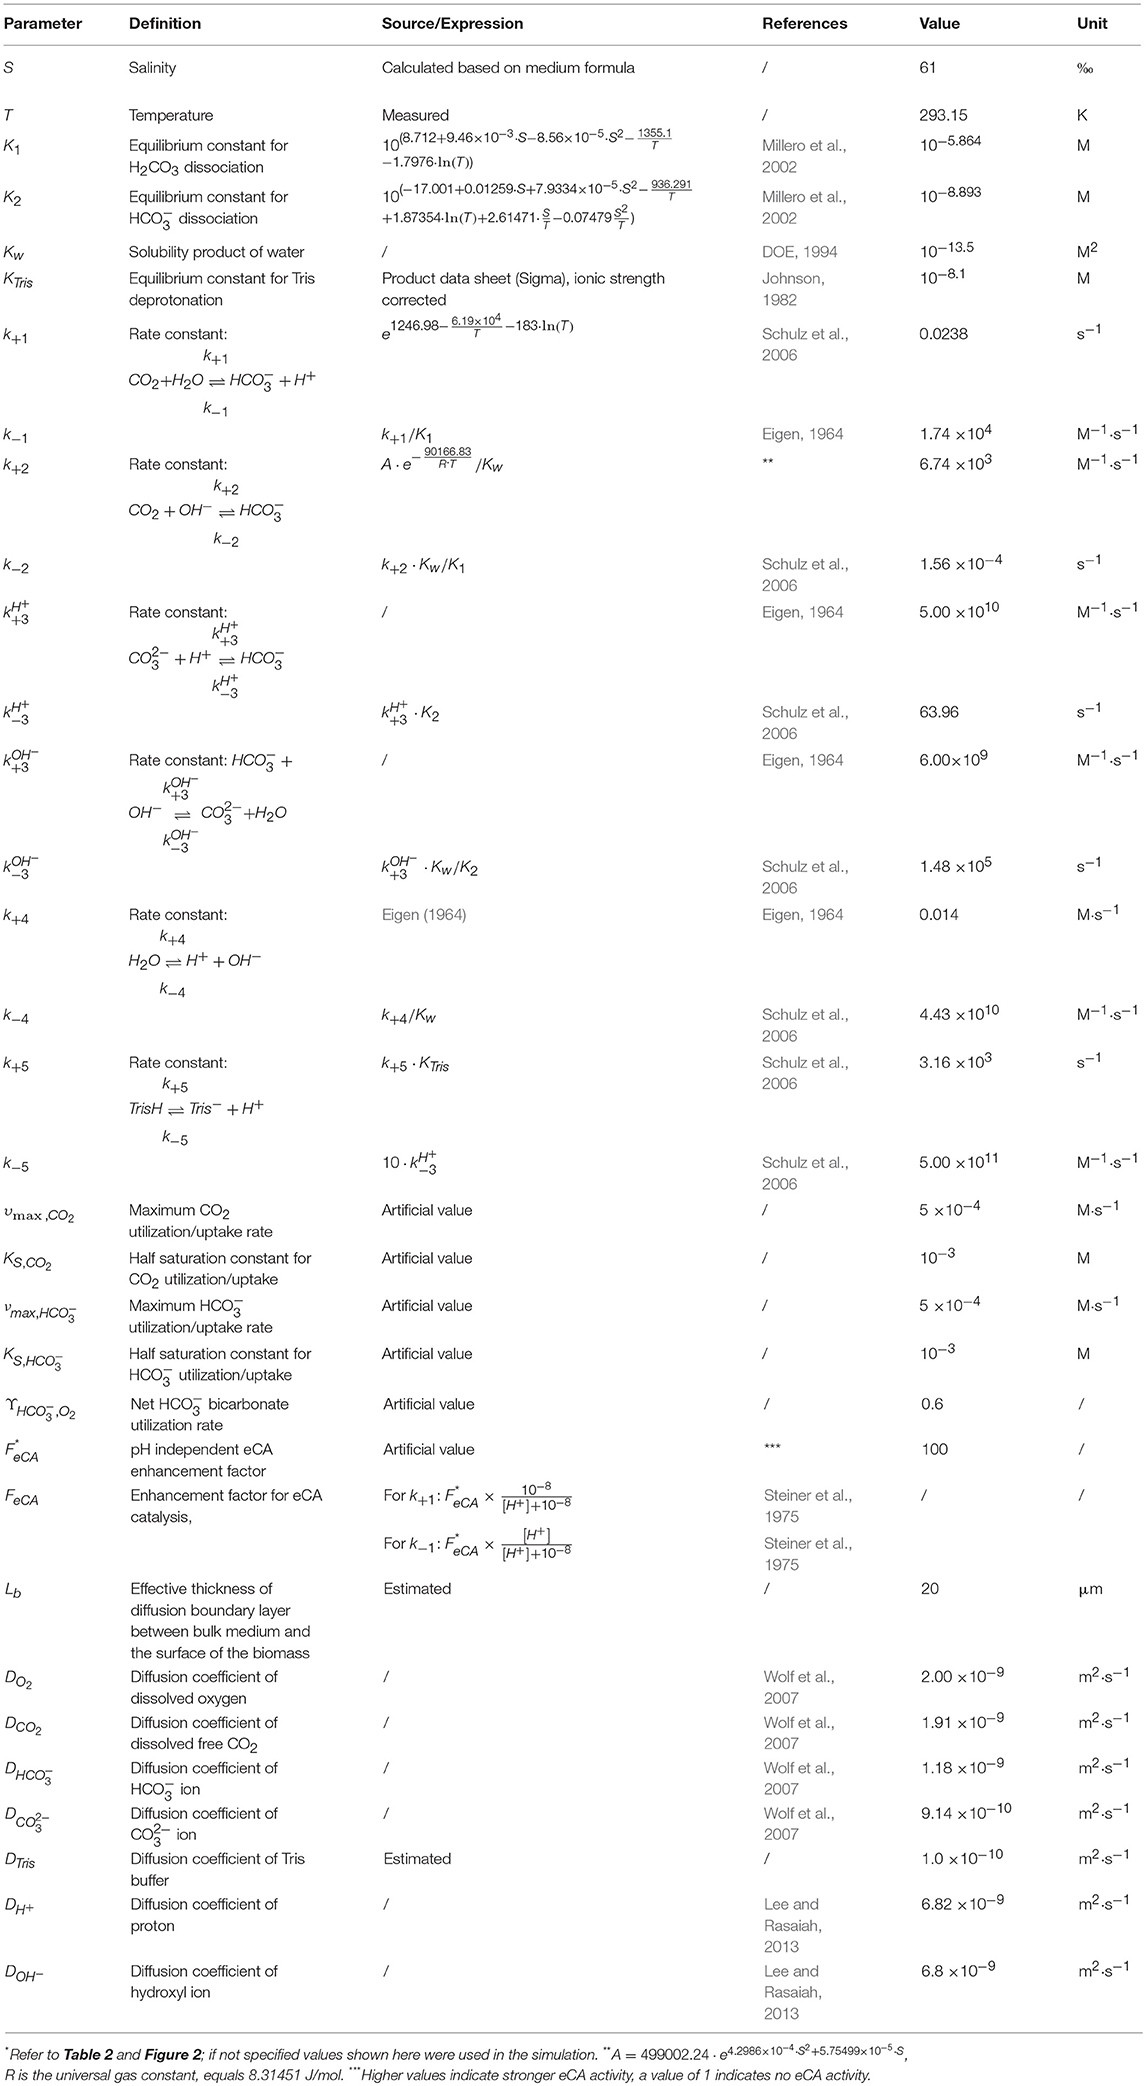
A mathematical model was constructed to analyze the observed trends in the MIMS measurements. The model was based on the concept of Schulz et al. (2006), modified to incorporate biological processes (Figure 2). In short, the dynamic model calculates fluxes in and out of cells, based on mass balance equations, taking into account diffusion, chemical processes (e.g., acid-base reaction), biological processes (e.g., CO2 fixation). As we considered only the fate of added 13CO2 label, dark respiration was not included. The equations describing the considered processes are given in Table 2. The values of the used parameters are given in Table 3. The biological processes were considered to occur only in the cells, and eCA was considered to be cell-bound only. The DIC dynamics are calculated in the bulk liquid, i.e., the free-flowing medium in the MIMS measurement chamber, using the biomass conversion rates and fluxes between biomass and medium. The boundaries were set to be the cell surface and the interface between the flow boundary layer and the bulk liquid, respectively. Initial concentrations of the dissolved species were set to the same values as in air saturated, freshly prepared “3e medium” with 0.1 M DI13C, buffered to pH 8.7 with 20 mM Tris. The effect of eCA was modeled as pH dependent enhancement factors, FeCA, for reaction rates of CO2 hydration and dehydration (i.e., multiplied to the reaction rate constant) (Coleman, 2000; Supuran, 2016). This pH dependent enhancement factor is controlled by an imposed pH independent factor, FeCA. Higher FeCA values represent stronger eCA activity, FeCA = 1 indicates no eCA activity. eCA inhibition was simulated as reducing the reaction rate of to un-catalyzed values (i.e., set FeCA to 1, refer to Tables 2, 3 and Figure 2). The model, which was a dynamic model represented by a combination of partial differential equations (Table 3), was solved by first converting the partial differential equations to a system of ordinary differential equations (ODEs), using the method of lines (Wouwer et al., 2014). The ODEs were then solved with the ode15s solver provided in the MATLAB software (version 2015b, MathWorks, USA). A parameter analysis of the model was performed by varying the values of model different parameters (refer to Table 3 and Figure 2).
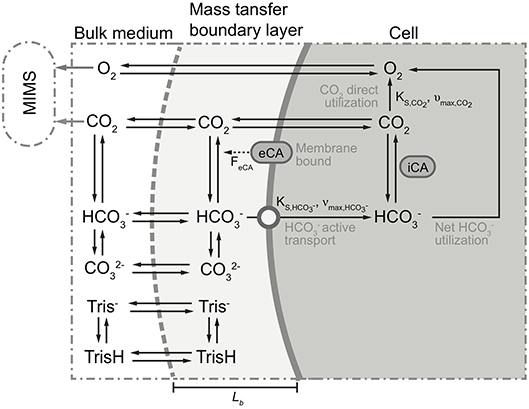
Figure 2. Schematic of the proposed model. Black solid arrows indicate possible directions of transfer and/or conversion. For some processes, parameters controlling these processes are given parallel to (i.e., next to) the arrows. Dotted arrow indicates participation of eCA as catalyst in the conversion process. Gray solid arrows show the concentrations measured by the membrane inlet mass spectrometry (MIMS). Top/bottom boundaries of the proposed model are marked with gray dashed line and thick solid gray line, respectively. The modeled compartments are marked at the top of the figure. For clarity, 13C was simplified as C, and H+ and OH− ions are omitted. For more detailed description of the processes and parameters illustrated here, refer to Tables 2, 3.
Results
Profiles of Dissolved Oxygen, pH, and Gross Photosynthetic Productivity
O2 production was observed in all samples under illumination (Figure 3). The thickness of the biofilm increased with higher DIC concentrations in the culture medium (visual observation) and also the O2 production increased with increasing DIC concentrations. A maximum O2 concentration of 2.3 mM was measured in biofilms cultivated with 1 M DIC. The pH increased from 8.7 at the surface to 10 in biofilms cultivated with low DIC (~13 mM) when eCA inhibitor was not present. In biofilms cultivated in media with high DIC (>0.5 M DIC), the pH increased less or not at all due to increased buffering of the carbonate system. After eCA inhibition, oxygen production decreased, especially at low DIC (oxygen flux was reduced from 1.7 to 1.3 ·μmole·m−2·s−1). The pH decreased only at low DIC, due to the low buffering strength of the medium. Biofilms cultivated at higher DIC concentrations suffered less productivity loss after eCA inhibition.
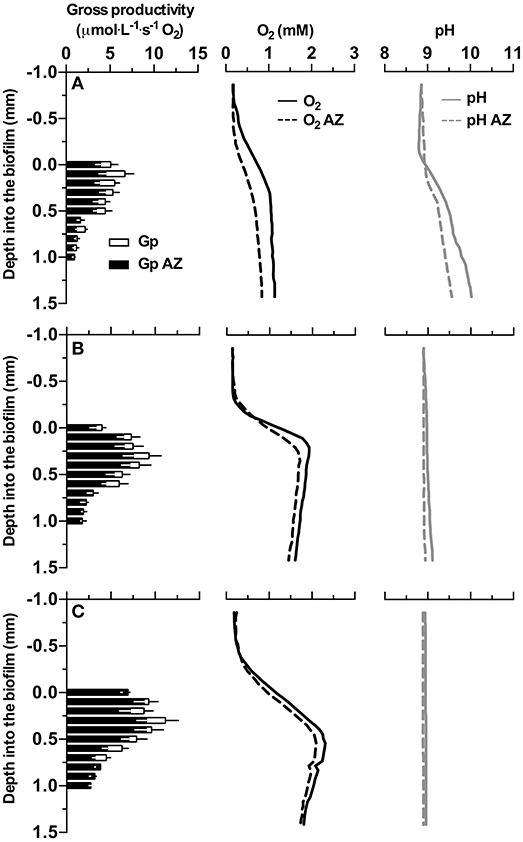
Figure 3. Profiles of gross photosynthetic activity (Gp), oxygen concentration, and pH measured with microsensors in the investigated biofilm. Row (A–C) give the profiles acquired from biofilms cultivated with medium supplemented with 0, 0.5, and 1 M dissolved inorganic carbon (DIC), respectively. Y-axes give the depth relative to the surface of the measured biofilm, 0 indicates the approximated position of the surface of the biofilm. Black bars represent Gp after AZ addition, empty bars show the difference of Gp before and after AZ addition. Solid lines represent profiles (i.e., O2, pH) before AZ addition, dashed lines represent profiles (i.e., O2, pH) after AZ addition. The data shown here are the mean values of 3 replicate measurements, for gross productivity, black and white error bars present the standard deviation for triplicates before and after AZ addition, respectively. Error bars for oxygen and pH measurements are omitted for clarity.
Extracellular Carbonic Anhydrase and Dissolved Inorganic Carbon Uptake of Resuspended Biofilms
All samples exhibited eCA activity, which decreased with increasing DIC concentration during cultivation. Above a DIC addition of 0.5 M no further decrease was observed. The effect of DIC addition on eCA activity could be four-fold (Figure 4). The dynamics of O2, 13CO2, and 12CO2 in response to illumination and eCA inhibition were similar for biomass grown at different DIC concentrations (Figure 5). Upon illumination, O2 started to increase, and, remarkably, 13CO2 also increased, indicating CO2 was released from the cells. Addition of DBAZ (an eCA inhibitor) induced a sudden release of 13CO2, after ~2.5 min, 13CO2 increased steadily again. The sudden release of 13CO2 is likely the combined result of unbinding of eCA bound 13CO2 due to addition of DBAZ, and the shift in equilibrium of the carbonate system caused by eCA inhibition (Palmqvist et al., 1994). Whereas, the steady increase is the leakage of 13CO2 into the bulk medium. DBAZ addition caused a decrease of O2 release for high DIC adapted biofilms (0.1, 0.5, and 1 M DIC) but, remarkably, accelerated O2 production in low DIC adapted biofilms. The increase in 13CO2 was steeper than when eCA was not inhibited, indicating an enhanced 13CO2 release and/or a slower 13CO2 depletion rate, e.g., conversion to bicarbonate, after eCA inhibition. After the light was turned off, O2 decreased immediately. 13CO2 continued to increase for a short period of time, after which the release of 13CO2 stopped. From data in Figure 5, oxygen production rates, 13CO2 release rates, and apparent gross DIC uptake rates (calculated as the sum of net oxygen production and 13CO2 release but does not account for the conversion of released 13CO2 into bicarbonate) were calculated (Figure 6). Without eCA inhibitor, net O2 production and 13CO2 release rates increased with supplemented DIC concentration during cultivation and leveled off at about 0.1 M DIC. The apparent gross DI13C uptake rates increased after eCA inhibition. Before inhibition of eCA, around 50% of the apparent gross DI13C uptake was released as 13CO2, whereas when eCA was inhibited, up to 87% of the apparent gross DI13C uptake was released as 13CO2.
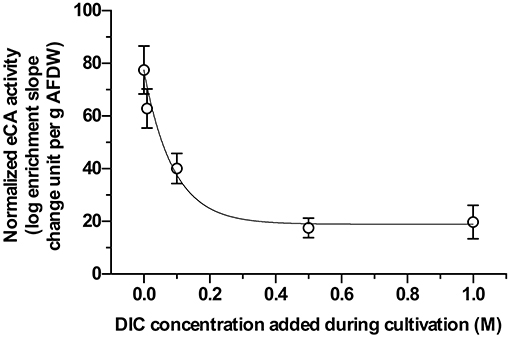
Figure 4. Extracellular carbonic anhydrase (eCA) activities of biomass cultivated with different dissolved inorganic carbon (DIC) concentrations, measured with membrane inlet mass spectrometry (MIMS). X-axis gives the supplemented DIC concentrations applied during cultivation. Y-axis shows the normalized eCA activity, calculated with Equation (2), normalized to per gram ash-free dry weight (AFDW). The data shown here are the mean values of 3 replicate measurements, error bars represent the standard deviations of the triplicates.
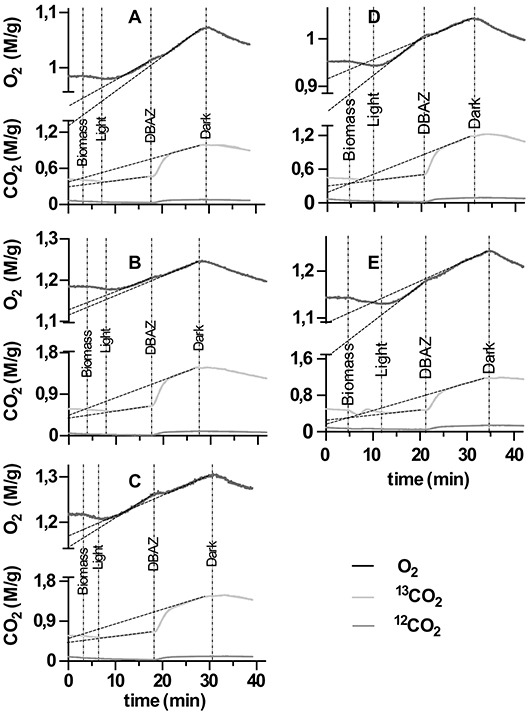
Figure 5. Time vs. concentration chart of membrane inlet mass spectrometry (MIMS) dissolved inorganic carbon (DIC) uptake experiments. Different panels show data acquired from biomass cultivated with different supplemented DIC concentrations: (A–E) represent biomass grown in 0, 0.01, 0.1, 0.5, and 1 M additional DIC, respectively. X-axis represent time. Y-axes are concentrations of O2 (top half-axis, black line) and 13CO2/12CO2 (bottom half-axis, lighter/darker gray lines) normalize through ash free dry weight of the biomass added during the measurement, respectively. The time point of events (injection of biomass, turn on light, injection of DBAZ, turn off light) are marked with thin vertical dotted-dashed lines and corresponding texts. The dashed lines present the regression lines of the relevant slopes in Figure 6.
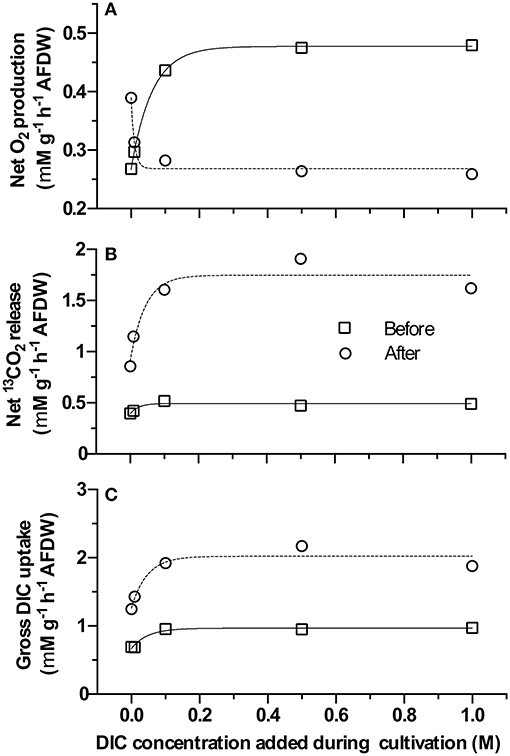
Figure 6. Net O2 production rate, 13CO2 release rate, and apparent gross dissolved inorganic carbon (DIC) uptake rate (calculated as the sum of Net O2 production rate and 13CO2 release rate) before/after DBAZ injection of the membrane inlet mass spectrometry (MIMS) DIC uptake experiments. X-axis gives the supplemented DIC concentrations applied during cultivation. Y-axes in (A–C) give the calculated absolute rates of net O2 production, 13CO2 release, and apparent gross DIC uptake rate, respectively (square and circle indicate rates before and after DBAZ injection).
Modeling of DIC Dynamics
Similar to observed experimentally, the model suggested that, under certain conditions, net O2 production rate can be increased by inhibiting eCA (Figure 7). At lower values (<1 × 10⁻² M·s−1, thus a high affinity to ) net oxygen production rate increased after the simulated eCA inhibition (Figure 7A). When other parameters were kept constant, and was low, the magnitude of this increase increased with higher FeCA value (Figure 7B). Since the inhibition of eCA lead to higher 13CO2 release rates, and results in the accumulation of 13CO2 in the boundary layer, and lead to increased DIC availability. At higher values, after the simulated eCA inhibition, net oxygen production rate was decreased. For all tested values, net 13CO2 release rate increased after the simulated eCA inhibition, and the magnitude of this increase was stronger with higher values.
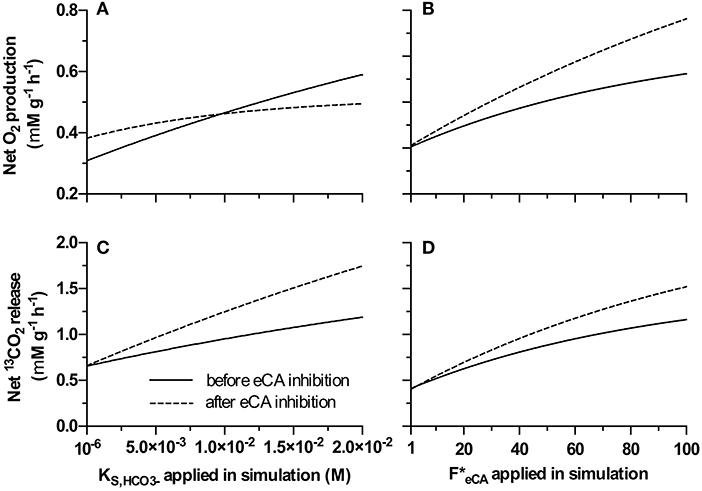
Figure 7. Net O2 production and net 13CO2 release before and after eCA inhibition (i.e. DBAZ injection), simulated using the proposed model. (A,C): Analysis based on varying only value, (A) gives the net O2 production rate, (C) shows 13CO2 release rate; (B,D): analysis based on varying only value, (B) gives the net O2 production rate, (D) shows 13CO2 release rate. In all panels, the solid lines give the rates before eCA inhibition; the dashed lines give the rates after eCA inhibition.
Discussion
Previously, eCA has been shown to participate in DIC uptake during microalgal photosynthesis, and eCA has been detected in the mat forming cyanobacterium M. chthonoplastes (Kupriyanova et al., 2003, 2007, 2011). In the present study, an inhibitor of eCA, acetazolamide (AZ) was applied to the biofilm during the microsensor measurement. Inhibition of eCA led to decreases in both O2 concentrations in the biofilm and gross photosynthetic productivities, especially for low DIC (~13 mM) cultivated biofilms. This shows directly the presence of eCA and its positive effect on photosynthetic oxygen production. The activity of eCA was further verified by the MIMS measurements (Figure 4). Previous studies investigating the role of eCA in DIC uptake mainly focused on planktonic microalgae, exposed to much lower DIC concentrations and lower pH values than in the present study (Palmqvist et al., 1994; Nimer et al., 1999; Rost et al., 2007; Beckmann et al., 2009; Kupriyanova et al., 2011; Hamizah et al., 2017). Our results confirmed the activity of eCA and showed its participation in bicarbonate uptake by biofilm-inhabiting cyanobacteria.
The fact that the activity of eCA is downregulated at increasing DIC levels, further demonstrates its role in DIC uptake. The function of eCA is to accelerate the extracellular interconversion from CO2 to bicarbonate, i.e., to a DIC species that can be actively taken up by the cells. As a result, DIC uptake is enhanced and subjected to regulation by the cells (Giordano et al., 2005). Most importantly, eCA prevents leaked out CO2 from escaping from periplasmic space into the bulk liquid. Most of the CO2 reaching the periplasm originates from inside the cells, where it is produced from . The microsensor measurements showed that, in biofilm cultivated with no additional DIC, the pH decreased after eCA inhibition (Figure 3), indicating a lower rate of CO2 fixation.
Both CO2 and can serve as extracellular carbon sources, whereby CO2 is taken up passively by diffusion and bicarbonate by active transport. CO2 uptake does not cost energy (i.e., passive diffusion), but cannot drive accumulation of DIC in the cell (Giordano et al., 2005). Active uptake requires energy supplied by photosynthesis (Giordano et al., 2005). Cyanobacteria have 3 known active uptake pathways for accumulation of DIC inside their cells (Omata et al., 1999; Shibata et al., 2002; Price et al., 2004, 2008; Raven et al., 2008). Under the experimental conditions in this study (i.e., pH buffered to 8.7) the intracellular DIC level will be higher than that in the medium, as cyanobacteria cells can concentrate DIC intracellularly up to 1,000-fold the extracellular level. If in the cytoplasm the pH is 7.3, the CO2 concentration in the cytoplasm is likely higher than that in the bulk medium as a result of a much higher total DIC concentration and a lower pH, even if the carbonate system is not in equilibrium. In the cyanobacterial cells, is transported to the carboxysomes, and converted to CO2 for RuBisCo consumption, thus the CO2 concentration inside the carboxysomes can be further elevated (Price et al., 2008; Raven et al., 2008; Kerfeld and Melnicki, 2016). These CO2 concentration gradients lead to the observed 13CO2 release under illumination during the MIMS measurement.
In suspension (i.e., during MIMS measurement) inhibition of eCA leads initially to a steep increase in 13CO2 release. After this initial increase, increases in the steady state 13CO2 release rates was also observed (Figure 6). This shows that eCA reduces the CO2 leakage into the bulk medium. Interestingly, the apparent gross DIC uptake rates were increased markedly after eCA inhibition in the experimental MIMS measurement (Figure 6C). A similar trend was also predicted by the proposed model (Figure 7). This suggests that the enhanced CO2 leakage could be compensated by a higher uptake, either by promoting active uptake or by increasing availability. Figure 6 shows, when eCA was active, 50% of the DIC uptake was assimilated or converted to bicarbonate for reuptake, the remainder escaped by CO2 leakage into the bulk medium. When eCA was inhibited, for higher DIC cultivated biomass, only <13% of the DIC uptake could be assimilated or converted to bicarbonate, while the rest escapes into the bulk medium.
The positive effect of eCA on DIC uptake could also be observed in the biofilm, especially for the biofilm cultivated at low DIC. For high DIC biofilms, the effect was much less pronounced. Mass transfer in biofilms is limited by diffusion, leading to significant mass transfer resistance. Such a resistance does not exist in suspensions (Dibdin, 1997). Consequently, CO2 that has leaked out of cells, is largely retained in the biofilms and not lost into the medium. It thus remains available for re-uptake. In this scenario, where generated intermediates constantly leak out of cells, mass transfer resistance can enhance the uptake of substrate. At low DIC concentration (~0.13 mM DIC), DIC can be limiting inside the biofilm, making the eCA more important. At higher DIC concentrations, DIC becomes more readily available inside the biofilm, thus the eCA activity was less important (Figure 4).
Thus, the function of eCA is probably the promotion of DIC assimilation (i.e., photosynthetic carbon fixation efficiency). Remarkably, in low DIC cultivated biomass, inhibition of eCA induced a stimulation of the photosynthesis rate in suspensions (Figure 6A). To better understand this observation, an analysis of the system was performed using the dynamic model. Microalgae adapt to low bicarbonate concentrations by increasing their affinity for bicarbonate (i.e., decrease the half saturation concentrations for bicarbonate uptake), that also reduces the maximum uptake- and assimilation rate of bicarbonate (Aizawa and Miyachi, 1986; Raven et al., 2008). A biofilm that is adapted to low bicarbonate concentrations might exhibit only a slight increase in photosynthetic rate at high bicarbonate concentrations, as it is limited by lower maximum rates. Conversely, a biofilm adapted to high bicarbonate concentrations will become bicarbonate limited at low bicarbonate concentration.
With this concept in mind, the remarkable increase in O2 production after eCA inhibition for low DIC cultivated biomass (Figure 6A) can be explained. After transferring the biomass to a higher DIC concentration, the bicarbonate uptake is limited by the maximum uptake rate (e.g., limited by the number of bicarbonate transporters). As eCA converts CO2 to bicarbonate, its inhibition increased the concentration of dissolved free 13CO2 in the cell boundary (e.g., the periplasm) that always can pass the membranes. Since this biomass has low maximum uptake rate for , the uptake is over-saturated when the biomass was transferred to higher DIC medium (13 mM during cultivation and 0.1 M DIC during the MIMS measurement). In this special case eCA inhibition increased the CO2 concentration in the biomass without affecting uptake, leading to higher O2 production rate. Too further clarify, the MIMS measurements were performed in comparatively much higher DIC concentration for biomass cultivated at low DICs. Our hypothesis is that this biomass has adapted to the low DIC environment, i.e., the transport of these biomass have high affinity to but low maximum uptake rate. This means during the MIMS measurement, a decrease in periplasmic concentration can still support the same uptake rate as before eCA inhibition, as the concentration is still high enough for low DIC adapted biomass to maintain close to maximum uptake rate (as before eCA inhibition). However, a higher CO2 concentration due to a slower conversion rate to in the periplasmic space increased CO2 concentration in the periplasmic space, and thus slowed the leakage of CO2, making CO2 more available inside the cells for assimilation. For high DIC adapted biomass, at 0.1 M DIC, the DIC uptake is limited by the lower concentration rather than the maximum uptake rate, i.e., under-saturated. Inhibition of eCA decrease the availability of bicarbonate, thus causing the net productivity to decrease. The observed increase of photosynthesis upon inhibiting eCA, in this special case, was indeed an outcome of the model (Figure 7).
Conclusion
To summarize, eCA converts CO2 escaping from the cytoplasm into the periplasmic space into bicarbonate, which can be taken up again by the cell. In suspensions, eCA reduced the CO2 leakage to the bulk medium from 90 to 50%. In biofilms cultivated with low DIC, the oxygen production was reduced by more than 25% upon eCA inhibition. The role of eCA in biofilms was much less significant at high DIC (0.5–1 M). Despite a stronger eCA activity, lower DIC adapted biomass exhibited lower net productivity and lower apparent gross DIC uptake rate. Both eCA production and bicarbonate uptake consumes energy, with the former dependent on the amount of eCA produced/maintained, and the latter dependent on the amount of uptake and the concentration of bicarbonate. Consequently, it can be suspected: the biofilm adapts to high DIC concentrations by decreasing the activity of eCA and increasing the DIC uptake rate.
To further verify this hypothesis, future studies on the DIC uptake kinetic (e.g., MIMS DIC uptake measurement with a range of DIC concentrations) should be performed. In the present study, all MIMS measurements were performed using biomass homogenized across the depth of the entire biofilm. It is possible, due to gradients (e.g., pH, light) in the investigated biofilms, biomass at different depths of the biofilm have different eCA activities and/or DIC uptake related parameters. Thus, similar measurements on biomass acquired from different depths of the biofilm (e.g., by sectioning the biofilm) should also be carried out in future studies.
Author Contributions
TL performed most of the experimental, theoretical work, and the writing. CS and MA performed part of the experiment. All authors took part in the discussion of the data and participated in the writing of the manuscript.
Conflict of Interest Statement
The authors declare that the research was conducted in the absence of any commercial or financial relationships that could be construed as a potential conflict of interest.
Acknowledgments
The authors thank the TAs of the microsensor group at the Max-Planck-Institute for Marine Microbiology for preparing the oxygen microsensors. We acknowledge the funding provided by the Campus Alberta Innovation Chair Program, a NSERC Discovery grant to MS, and the Canada First Research Excellence Fund.
References
Aizawa, K., and Miyachi, S. (1986). Carbonic anhydrase and CO2 concentrating mechanisms in microalgae and cyanobacteria. FEMS Microbiol. Lett. 39, 215–233. doi: 10.1016/0378-1097(86)90447-7
Antony, C. P., Kumaresan, D., Hunger, S., Drake, H. L., Murrell, J. C., and Shouche, Y. S. (2013). Microbiology of Lonar Lake and other soda lakes. ISME J. 7, 468–476. doi: 10.1038/ismej.2012.137
Beckmann, K., Messinger, J., Badger, M. R., Wydrzynski, T., and Hillier, W. (2009). On-line mass spectrometry: membrane inlet sampling. Photosynth. Res. 102, 511–522. doi: 10.1007/s11120-009-9474-7
Coleman, J. R. (2000). “Carbonic anhydrase and its role in photosynthesis,” in Photosynthesis: Physiology and Metabolism, eds R. C. Leegood, T. D. Sharkey, and S. von Caemmerer (Dordrecht: Springer Netherlands), 353–367.
De Beer, D., Schramm, A., Santegoeds, C. M., and Kuhl, M. (1997). A nitrite microsensor for profiling environmental biofilms. Appl. Environ. Microbiol. 63, 973–977.
Dibdin, G. H. (1997). Mathematical modeling of biofilms. Adv. Dent. Res. 11, 127–132. doi: 10.1177/08959374970110010301
DOE (1994). “Solution chemistry of carbon dioxide in sea water,” in Handbook of Methods for the Analysis of the Various Parameters of the Carbon Dioxide system in Sea Water, Version 2, eds A. G. Dickson and C. Goyet (Washington, DC), 3–17. Available online at: http://cdiac.ess-dive.lbl.gov/ftp/cdiac74/0content.pdf
Eigen, M. (1964). Proton Transfer, acid-base catalysis, and enzymatic hydrolysis. part I: elementary processes. Angew. Chem Int. Ed. English 3, 1–19. doi: 10.1002/anie.196400011
Epping, E. H. G., Khalili, A., and Thar, R. (1999). Photosynthesis and the dynamics of oxygen consumption in a microbial mat as calculated from transient oxygen microprofiles. Limnol. Oceanogr. 44, 1936–1948. doi: 10.4319/lo.1999.44.8.1936
Giordano, M., Beardall, J., and Raven, J. A. (2005). CO2 concentrating mechanisms in algae: mechanisms, environmental modulation, and evolution. Annu. Rev. Plant Biol. 56, 99–131. doi: 10.1146/annurev.arplant.56.032604.144052
Hamizah, M. N. I., Maren, S., and Oliver, W. (2017). Extracellular carbonic anhydrase: method development and its application to natural seawater. Limnol. Oceanogr. Methods 15, 503–517. doi: 10.1002/lom3.10182
Hopkinson, B. M., Meile, C., and Shen, C. (2013). Quantification of extracellular carbonic anhydrase activity in two marine diatoms and investigation of its role. Plant Physiol. 162, 1142–1152. doi: 10.1104/pp.113.217737
Ionescu, D., Buchmann, B., Heim, C., Häusler, S., de Beer, D., and Polerecky, L. (2014). Oxygenic photosynthesis as a protection mechanism for cyanobacteria against iron-encrustation in environments with high Fe2+ concentrations. Front. Microbiol. 5:459. doi: 10.3389/fmicb.2014.00459
Jensen, K., Revsbech, N. P., and Nielsen, L. P. (1993). Microscale distribution of nitrification activity in sediment determined with a shielded microsensor for nitrate. Appl. Environ. Microbiol. 59, 3287–3296.
Johnson, K. S. (1982). Carbon dioxide hydration and dehydration kinetics in seawater. Limnol. Oceanogr. 27, 849–855. doi: 10.4319/lo.1982.27.5.0849
Karim, W., Kaswadji, R., Prartono, T. R. I., and Gorettipanggabean, L. M. (2011). Growth and extracellular carbonic anhydrase activity of zooxanthellae Symbiodinium sp. in response of zinc enrichment. HAYATI J. Biosci. 18, 157–163. doi: 10.4308/hjb.18.4.157
Katsunori, A., and Shigetoh, M. (1986). Carbonic anhydrase and CO2 concentrating mechanisms in microalgae and cyanobacteria. FEMS Microbiol. Lett. 39, 215–233. doi: 10.1111/j.1574-6968.1986.tb01860.x
Kerfeld, C. A., and Melnicki, M. R. (2016). Assembly, function and evolution of cyanobacterial carboxysomes. Curr. Opin. Plant Biol. 31, 66–75. doi: 10.1016/j.pbi.2016.03.009
Kompantseva, E. I., Komova, A. V., Rusanov, I. I., Pimenov, N. V., and Sorokin, D. (2009). Primary production of organic matter and phototrophic communities in the soda lakes of the Kulunda steppe (Altai krai). Microbiology 78, 643–649. doi: 10.1134/S002626170905018X
Kupriyanova, E. V., Lebedeva, N. V., Dudoladova, M. V., Gerasimenko, L. M., Alekseeva, S. G., Pronina, N. A., et al. (2003). Carbonic anhydrase activity of alkalophilic cyanobacteria from soda lakes. Russ. J. Plant Physiol. 50, 532–539. doi: 10.1023/A:1024733109767
Kupriyanova, E. V., Sinetova, M. A., Markelova, A. G., Allakhverdiev, S. I., Los, D. A., and Pronina, N. A. (2011). Extracellular β-class carbonic anhydrase of the alkaliphilic cyanobacterium Microcoleus chthonoplastes. J. Photochem. Photobiol. B Biol. 103, 78–86. doi: 10.1016/j.jphotobiol.2011.01.021
Kupriyanova, E. V., Villarejo, A., Markelova, A., Gerasimenko, L., Zavarzin, G., Samuelsson, G., et al. (2007). Extracellular carbonic anhydrases of the stromatolite-forming cyanobacterium Microcoleus chthonoplastes. Microbiology 153, 1149–1156. doi: 10.1099/mic.0.2006/003905-0
Lee, S. H., and Rasaiah, J. C. (2013). Proton transfer and the diffusion of H+ and OH– ions along water wires. J. Chem. Phys. 139:124507. doi: 10.1063/1.4821764
Melack, J. M. (1981). Photosynthetic activity of phytoplankton in African soda lakes. Hydrobiologia 81–82, 71–85.
Mercado, J. M., Ramírez, T., Cortés, D., and Liger, E. (2009). Effect of carbonic anhydrase inhibitors on the inorganic carbon uptake by phytoplankton natural assemblages. J. Phycol. 45, 8–15. doi: 10.1111/j.1529-8817.2008.00617.x
Millero, F. J., Pierrot, D., Lee, K., Wanninkhof, R., Feely, R., Sabine, C. L., et al. (2002). Dissociation constants for carbonic acid determined from field measurements. Deep Sea Res. Part I Oceanogr. Res. Pap. 49, 1705–1723. doi: 10.1016/S0967-0637(02)00093-6
Nielsen, M., Revsbech, N. P., and Kühl, M. (2015). Microsensor measurements of hydrogen gas dynamics in cyanobacterial microbial mats. Front. Microbiol. 6:726. doi: 10.3389/fmicb.2015.00726
Nimer, N. A., Brownlee, C., and Merrett, M. J. (1999). Extracellular carbonic anhydrase facilitates carbon dioxide availability for photosynthesis in the marine dinoflagellate prorocentrum micans. Plant. Physiol. 120, 105–112.
Omata, T., Price, G. D., Badger, M. R., Okamura, M., Gohta, S., and Ogawa, T. (1999). Identification of an ATP-binding cassette transporter involved in bicarbonate uptake in the cyanobacterium Synechococcus sp. strain PCC 7942. Proc. Natl. Acad. Sci. U.S.A. 96, 13571–13576.
Palmqvist, K., Yu, J.-W., and Badger, R. M. (1994). Carbonic anhydrase activity and inorganic carbon fluxes in low- and high-C1 cells of Chlamydomonas reinhardtü and Scenedesmus obliquus. Physiol. Plant. 90, 537–547. doi: 10.1111/j.1399-3054.1994.tb08812.x
Price, G. D., Badger, M. R., Woodger, F. J., and Long, B. M. (2008). Advances in understanding the cyanobacterial CO2-concentrating-mechanism (CCM): functional components, Ci transporters, diversity, genetic regulation and prospects for engineering into plants. J. Exp. Bot. 59, 1441–1461. doi: 10.1093/jxb/erm112
Price, G. D., Woodger, F. J., Badger, M. R., Howitt, S. M., and Tucker, L. (2004). Identification of a SulP-type bicarbonate transporter in marine cyanobacteria. Proc. Natl. Acad. Sci. U.S.A. 101, 18228 LP−18233. doi: 10.1073/pnas.0405211101
Priscu, J. C., Axler, R. P., Carlton, R. G., Reuter, J. E., Arneson, P. A., and Goldman, C. R. (1982). Vertical profiles of primary productivity, biomass and physico-chemical properties in meromictic Big Soda Lake, Nevada, U.S.A. Hydrobiologia 96, 113–120. doi: 10.1007/BF02185426
Raven, J. A., Cockell, C. S., and De La Rocha, C. L. (2008). The evolution of inorganic carbon concentrating mechanisms in photosynthesis. Philos. Trans. R. Soc. B Biol. Sci. 363, 2641 LP−2650. doi: 10.1098/rstb.2008.0020
Revsbech, P. N. (1989). An oxygen microsensor with a guard cathode. Limnol. Oceanogr. 34, 474–478. doi: 10.4319/lo.1989.34.2.0474
Revsbech, P. N., and Jørgensen, B. B. (1983). Photosynthesis of benthic microflora measured with high spatial resolution bythe oxygen microprofile method: capabilities and limitations of the method1. Limnol. Oceanogr. 28, 749–756. doi: 10.4319/lo.1983.28.4.0749
Revsbech, P. N., Jørgensen, B. B., and Brix, O. (1981). Primary production of microalgae in sediments measured by oxygen microprofile, H14CO3 - fixation, and oxygen exchange methods. Limnol. Oceanogr. 26, 717–730. doi: 10.4319/lo.1981.26.4.0717
Rost, B., Sven, A. K., Richter, K.-U., and Philippe, D. T. (2007). Isotope disequilibrium and mass spectrometric studies of inorganic carbon acquisition by phytoplankton. Limnol. Oceanogr. Methods 5, 328–337. doi: 10.4319/lom.2007.5.328
Schulz, K. G., Riebesell, U., Rost, B., Thoms, S., and Zeebe, R. E. (2006). Determination of the rate constants for the carbon dioxide to bicarbonate inter-conversion in pH-buffered seawater systems. Mar. Chem. 100, 53–65. doi: 10.1016/j.marchem.2005.11.001
Sharp, C. E., Urschel, S., Dong, X., Brady, A. L., Slater, G. F., and Strous, M. (2017). Robust, high-productivity phototrophic carbon capture at high pH and alkalinity using natural microbial communities. Biotechnol. Biofuels 10:84. doi: 10.1186/s13068-017-0769-1
Sherwood, J. E., Stagnitti, F., Kokkinn, M. J., and Williams, W. D. (1991). Dissolved oxygen concentrations in hypersaline waters. Limnol. Oceanogr. 36, 235–250. doi: 10.4319/lo.1991.36.2.0235
Shibata, M., Katoh, H., Sonoda, M., Ohkawa, H., Shimoyama, M., Fukuzawa, H., et al. (2002). Genes essential to sodium-dependent bicarbonate transport in cyanobacteria: function and phylogenetic analysis. J. Biol. Chem. 277, 18658–18664. doi: 10.1074/jbc.M112468200
Steiner, H., Jonsson, B.-H., and Lindskog, S. (1975). The catalytic mechanism of carbonic anhydrase. Eur. J. Biochem. 59, 253–259. doi: 10.1111/j.1432-1033.1975.tb02449.x
Supuran, C. T. (2016). Structure and function of carbonic anhydrases. Biochem. J. 473, 2023 LP−2032. doi: 10.1042/BCJ20160115
Wolf, G., Picioreanu, C., and van Loosdrecht, M. C. M. (2007). Kinetic modeling of phototrophic biofilms: the PHOBIA model. J. Anat. 189 (Pt 3), 503–505. doi: 10.1002/bit
Keywords: dissolved inorganic carbon, phototrophic biofilm, cyanobacteria, alkaliphilic biofilm, extracellular carbonic anhydrase, photosynthetic productivity
Citation: Li T, Sharp CE, Ataeian M, Strous M and de Beer D (2018) Role of Extracellular Carbonic Anhydrase in Dissolved Inorganic Carbon Uptake in Alkaliphilic Phototrophic Biofilm. Front. Microbiol. 9:2490. doi: 10.3389/fmicb.2018.02490
Received: 05 July 2018; Accepted: 28 September 2018;
Published: 22 October 2018.
Edited by:
Ivan A. Berg, Universität Münster, GermanyReviewed by:
Brian Hopkinson, University of Georgia, United StatesJan Zarzycki, Max-Planck-Institut für Terrestrische Mikrobiologie, Germany
Copyright © 2018 Li, Sharp, Ataeian, Strous and de Beer. This is an open-access article distributed under the terms of the Creative Commons Attribution License (CC BY). The use, distribution or reproduction in other forums is permitted, provided the original author(s) and the copyright owner(s) are credited and that the original publication in this journal is cited, in accordance with accepted academic practice. No use, distribution or reproduction is permitted which does not comply with these terms.
*Correspondence: Tong Li, dG9uZy5saUBhbGdhbm92YXRpb24uY29t
Dirk de Beer, ZGJlZXJAbXBpLWJyZW1lbi5kZQ==
†Present Address: Tong Li, Alganovation Co., Ltd., Suzhou, China
‡These authors have contributed equally to this work
 Tong Li
 Christine E. Sharp
 Maryam Ataeian
 Marc Strous
 Dirk de Beer