 Keita Ozaki1,2
 Yuki Matsushima3Koo Nagasawa4
 Takumi Motoya5
 Akihide Ryo6
 Makoto Kuroda7
 Kazuhiko Katayama8*
 Hirokazu Kimura1,6*
- 1Graduate School of Health Sciences, Gunma Paz University, Takasaki, Japan
- 2Niitaka Co., Ltd., Osaka, Japan
- 3Division of Virology, Kawasaki City Institute for Public Health, Kawasaki, Japan
- 4Department of Pediatrics, Graduate School of Medicine, Chiba University, Chiba, Japan
- 5Ibaraki Prefectural Institute of Public Health, Mito, Japan
- 6Department of Microbiology, Yokohama City University School of Medicine, Yokohama, Japan
- 7Pathogen Genomics Center, National Institute of Infectious Diseases, Tokyo, Japan
- 8Laboratory of Viral Infection I, Kitasato Institute for Life Sciences Graduate School of Infection Control Sciences, Kitasato University, Tokyo, Japan
Noroviruses are the leading cause of viral gastroenteritis in humans across the world. RNA-dependent RNA polymerase (RdRp) plays a critical role in the replication of the viral genome. Although there have been some reports on a limited number of genotypes with respect to the norovirus evolution of the RdRp region, no comprehensive molecular evolution examination of the norovirus GII genotype has yet been undertaken. Therefore, we conducted an evolutionary analysis of the 25 genotypes of the norovirus GII RdRp region (full-length), collected globally using different bioinformatics technologies. The time-scaled phylogenetic tree, generated using the Bayesian Markov Chain Monte Carlo (MCMC) method, indicated that the common ancestor of GII diverged from GIV around 1443 CE [95% highest posterior density (HPD), 1336–1542]. The GII RdRp region emerged around 1731 CE (95% HPD, 1703–1757), forming three lineages. The evolutionary rate of the RdRp region of the norovirus GII strains was estimated at over 10−3 substitutions/site/year. The evolutionary rates were significantly distinct in each genotype. The composition of the phylogenetic distances differed among the strains for each genotype. Furthermore, we mapped the negative selection sites on the RdRp protein and many of these were predicted in the GII.P4 RdRp proteins. The phylodynamics of GII.P4, GII.P12, GII.P16, and GII.Pe showed that their effective population sizes increased during the period from 2003 to 2014. Our results cumulatively suggest that the RdRp region of the norovirus GII rapidly and uniquely evolved with a high divergence similar to that of the norovirus VP1 gene.
Introduction
Noroviruses belonging to the family Caliciviridae, genus Norovirus, are a major causative agent of gastroenteritis (Green, 2013; Robilotti et al., 2015). Accumulating epidemiological evidence suggests that norovirus infections affect both children and adults and that, globally, this agent causes approximately 60% of all viral gastroenteritis cases and 200,000 deaths in children under 5 years old (Robilotti et al., 2015). Moreover, noroviruses cause large-scale food poisoning outbreaks throughout the world (Le Guyader et al., 2008; Räsänen et al., 2010; Hardstaff et al., 2018).
Noroviruses are classified into seven genogroups (GI–GVII) according to the norovirus VP1 gene sequences (Vinjé, 2015). Among them, GI, GII and GIV viruses are known to infect humans. Furthermore, GI and GII viruses are classified into 9 and 22 genotypes, respectively, by their VP1 gene sequences (Vinjé, 2015). The norovirus genome encodes three open reading frames (ORF). Of these, ORF1 encodes seven genes, including that of the RNA-dependent RNA polymerase (RdRp) region. The RdRp region plays a critical role in the norovirus genome replication.
Previous reports have suggested that the GII.P2 and GII.P16 RdRp regions exhibit a large genetic divergence as does the VP1 gene encoded in ORF2 (Nagasawa et al., 2018a). The RdRp genotypes of GII viruses are currently classified into nearly 30 genotypes on the basis of their RdRp region sequences (Vinjé, 2015; Chhabra et al., 2018). Furthermore, recombination of the norovirus genome frequently occurs at ORF1 and at two junctions, resulting in the formation of new chimeric viruses (Bull et al., 2005; Bull et al., 2007). For example, the ORF1 of the GII.2 virus primarily encodes two distinct types of RdRp proteins, which are produced by GII.P2 and GII.P16 (GII.P2–GII.2 and GII.P16–GII.2, a chimeric virus; Bidalot et al., 2017; Lu et al., 2017; Mizukoshi et al., 2017; Niendorf et al., 2017). Notably, a previous report revealed the VP1 gene of the GII.2 virus encoding two distinct RdRp genotypes reside in different clusters (Mizukoshi et al., 2017). Furthermore, the evolutionary rate of the VP1 gene in these viruses differs significantly (Mizukoshi et al., 2017). Thus, it is possible that the RdRp region modulates the evolution of the VP1 gene (Mizukoshi et al., 2017). These observations imply that it is important to study the evolution of the RdRp region of GII viruses because little information is presently available. Moreover, GII viruses representing multiple genotypes may represent the major causative agents of gastroenteritis.
Recently developed bioinformatics methods have enabled the analysis of the evolution of various viral genes, including those of the norovirus (Kimura et al., 2015; Kobayashi et al., 2015; Takahashi et al., 2018). Here, we conducted a detailed molecular evolutionary analysis of the RdRp region in the norovirus GII viruses on the basis of the globally collected strain sequences.
Materials and Methods
Strain Selection
Full-length nucleotide sequences of the norovirus GII RdRp region were collected from the GenBank1 (accessed on May 10, 2018). The classification of the strains was conducted using a norovirus genotyping tool (Kroneman et al., 2011) and all the sequences of the GII genogroup were selected. Strains with an unknown collection year and ambiguous sequences with undetermined base sequences (e.g., N, Y, and V) were omitted from the dataset. At this point, the dataset was comprised of approximately 1,500 strains of the RdRp region sequences. However, a selective pressure analysis could not be performed owing to software capacity limitations. The nucleotide identity among the 1,500 RdRp region sequences was calculated using Clustal Omega (Sievers et al., 2011). One sequence was randomly selected from a group of homologous sequences with ≥99.4% identities while the others were excluded from the dataset. In addition, the dataset was subjected to a protocol for the detection of recombination within the RdRp region using RDP4.95 software with seven primary exploratory recombination signal detection methods (RDP, GENECONV, BOOTSCAN/RESCAN, MAXCHI, CHIMAERA, SISCAN, and 3SEQ; Martin et al., 2015). The threshold of the p-value for significance was set to 0.001. The recombinant regions were defined as those that were detected by more than four of these methods, which were then removed from the dataset. Upon completing this refinement, 484 strains were finally used in this study (Supplementary Table S1). The sequences in the dataset were aligned with the MAFFT software (Katoh and Standley, 2013).
Construction of a Time-Scaled Phylogenetic Tree Using the Bayesian Markov Chain Monte Carlo (MCMC) Method
Time-scaled phylogenies were constructed by the Bayesian MCMC method in the BEAST software package v2.4.8 (Drummond and Rambaut, 2007; Bouckaert et al., 2014). In order to estimate the phylogenetic relationships in the RdRp region between distinct norovirus genogroups, we added the nucleotide sequences of the human norovirus GI, porcine GII (GII.P11 and GII.P18), bovine GIII and human GIV strains to the dataset (yielding a total of 489 strains). First, we determined the best substitution model (GTR+I+Γ) using the jModelTest2 software (Guindon and Gascuel, 2003; Darriba et al., 2012). Next, the best of four clock models (i.e., strict clock, relaxed clock exponential, relaxed clock log normal and random local clock) and two tree prior models (i.e., coalescent constant population and coalescent exponential population) was selected by path sampling/stepping stone-sampling marginal-likelihood estimation (Baele et al., 2012). As a result, the dataset was analyzed using a strict clock and tree prior of coalescent constant population. The MCMC was run on chain lengths of 100,000,000 steps with sampling at every 2,000 steps. The analyzed data were then evaluated by the effective sample size using Tracer2 software and values larger than 200 were accepted. The maximum clade credibility trees were created by discarding the first 10% of the trees (burn-in) using the TreeAnnotator v2.4.8 in the BEAST2 package. The time-scaled phylogenetic trees were visualized using the FigTree3 v1.4.0 software. The reliability of branches was supported by the 95% HPD interval. Moreover, the evolutionary rates for the RdRp genotypes of the norovirus GII, including more than 10 strains (GII.P4, P7, P12, P16, P21, and Pe), were also estimated using the appropriate models determined from the datasets described above.
Calculation of Phylogenetic Distance
Phylogenetic trees were created from the datasets of the norovirus GII genotypes and each RdRp genotype, including more than 10 strains, based on the maximum likelihood (ML) method in the MEGA7 software package (Kumar et al., 2016). The best substitution models were determined using the jModelTest2. The phylogenetic distances between the norovirus GII strains were calculated from the pairwise ML distance of the ML tree using Patristic software (Fourment and Gibbs, 2006).
Construction of Three-Dimensional Structures and Selective Pressure Analyses
The structural models of the RdRp proteins (GII.P1:U07611, GII.P2:DQ456824, GII.P3:KJ194500, GII.P4:AB541272, GII.P5:KJ196288, GII.P6:AB039778, GII.P7:AB039777, GII.P12:AB220922, GII.P15:KU954108, GII.P16:KJ196286, GII.P17:LC037415, GII.P20:EU424333, GII.P21:AY919139, GII.P22:KJ196277, GII.P23:MG495080, GII.P24:KY225989, GII.Pc:AY134748, GII.Pe:JX459907, GII.Pf:MF405169, GII.Pg:GQ845370, GII.Pj:KC576911, and GII.Pm:KJ194507) were constructed using the homology modeling MODELLER v9.20 (Webb and Sali, 2014, 2016). The crystal structures of the GII.P4 strain RdRp protein (PDB ID: 1SH0) were used as the template for homology modeling. The amino acid sequences of the template and target strains were aligned using the MAFFTash software (Standley et al., 2007; Katoh et al., 2009). The constructed structures were minimized using GROMOS96 (van Gunsteren et al., 1996) implemented in the Swiss PDB Viewer v4.1 (Guex and Peitsch, 1997) and structural reliability was evaluated using Ramachandran plots through the RAMPAGE server (Lovell et al., 2003), resulting in favored regions of 97.7 ± 0.44%, allowed regions of 1.9 ± 0.43% and outlier regions of 0.4 ± 0.09% [mean ± standard deviation (SD)] for all residues in each structure. Non-synonymous (dN) and synonymous (dS) substitution rates at each codon were calculated using the Datamonkey server to estimate the positive and negative selection sites in the norovirus GII RdRp regions and in each genotype containing more than three strains (Pond and Frost, 2005; Delport et al., 2010). Sites under positive and negative selection were assigned by three methods [single-likelihood ancestor counting (SLAC), fixed effects likelihood (FEL), and internal fixed effects likelihood (IFEL)], using a significance level of p < 0.05. A two-tailed extended binomial distribution was used to calculate the p-value for SLAC. The FEL and IFEL were based on a single-degree-of-freedom likelihood ratio test (using an asymptotic chi-squared distribution) for classifying a site as positively or negatively selected. The final structural models were modified and colored using the Chimera v1.13 software (Pettersen et al., 2004). The substitution sites of the other RdRp proteins, compared to a prototype GII.P8 strain (accession no. AB039780) and the negative selection at these sites were mapped onto the structure.
Bayesian Skyline Plot Analysis
The genealogical population size of the norovirus strains was estimated using the Bayesian skyline plot algorithm with BEAST v2.4.8. Appropriate substitution and clock models were selected as described above. The analyzed plots were visualized with 95% HPD using Tracer2.
Statistical Analyses
Statistical analyses were conducted using EZR statistical software on the Kruskal–Wallis test with multiple comparisons and the Holm test for evolutionary rates and phylogenetic distances (Kanda, 2013). Detailed statistical data are presented in Supplementary Tables S2, S3.
Results
Time-Scaled Phylogenetic Tree Constructed Using the Bayesian MCMC Method
A time-scaled phylogenetic tree of the RdRp region for the norovirus GII virus was constructed using the Bayesian MCMC method (BEAST v2.4.8). The tree clearly classified the 23 genotypes of the human norovirus GII strains into three lineages by setting the cut-off value of phylogenetic distances for lineages as 1.0 (Figures 1, 3A): lineage 1 (GII.P6-P8, P15 and P20), lineage 2 (GII.P1-P5, P12, P16, P17, P21, Pc, Pe, Pf, Pg, Pj, and Pm) and lineage 3 (GII.P22, P23, and P24) (Figure 1). Notably, the P4 genotype strains formed several clusters.
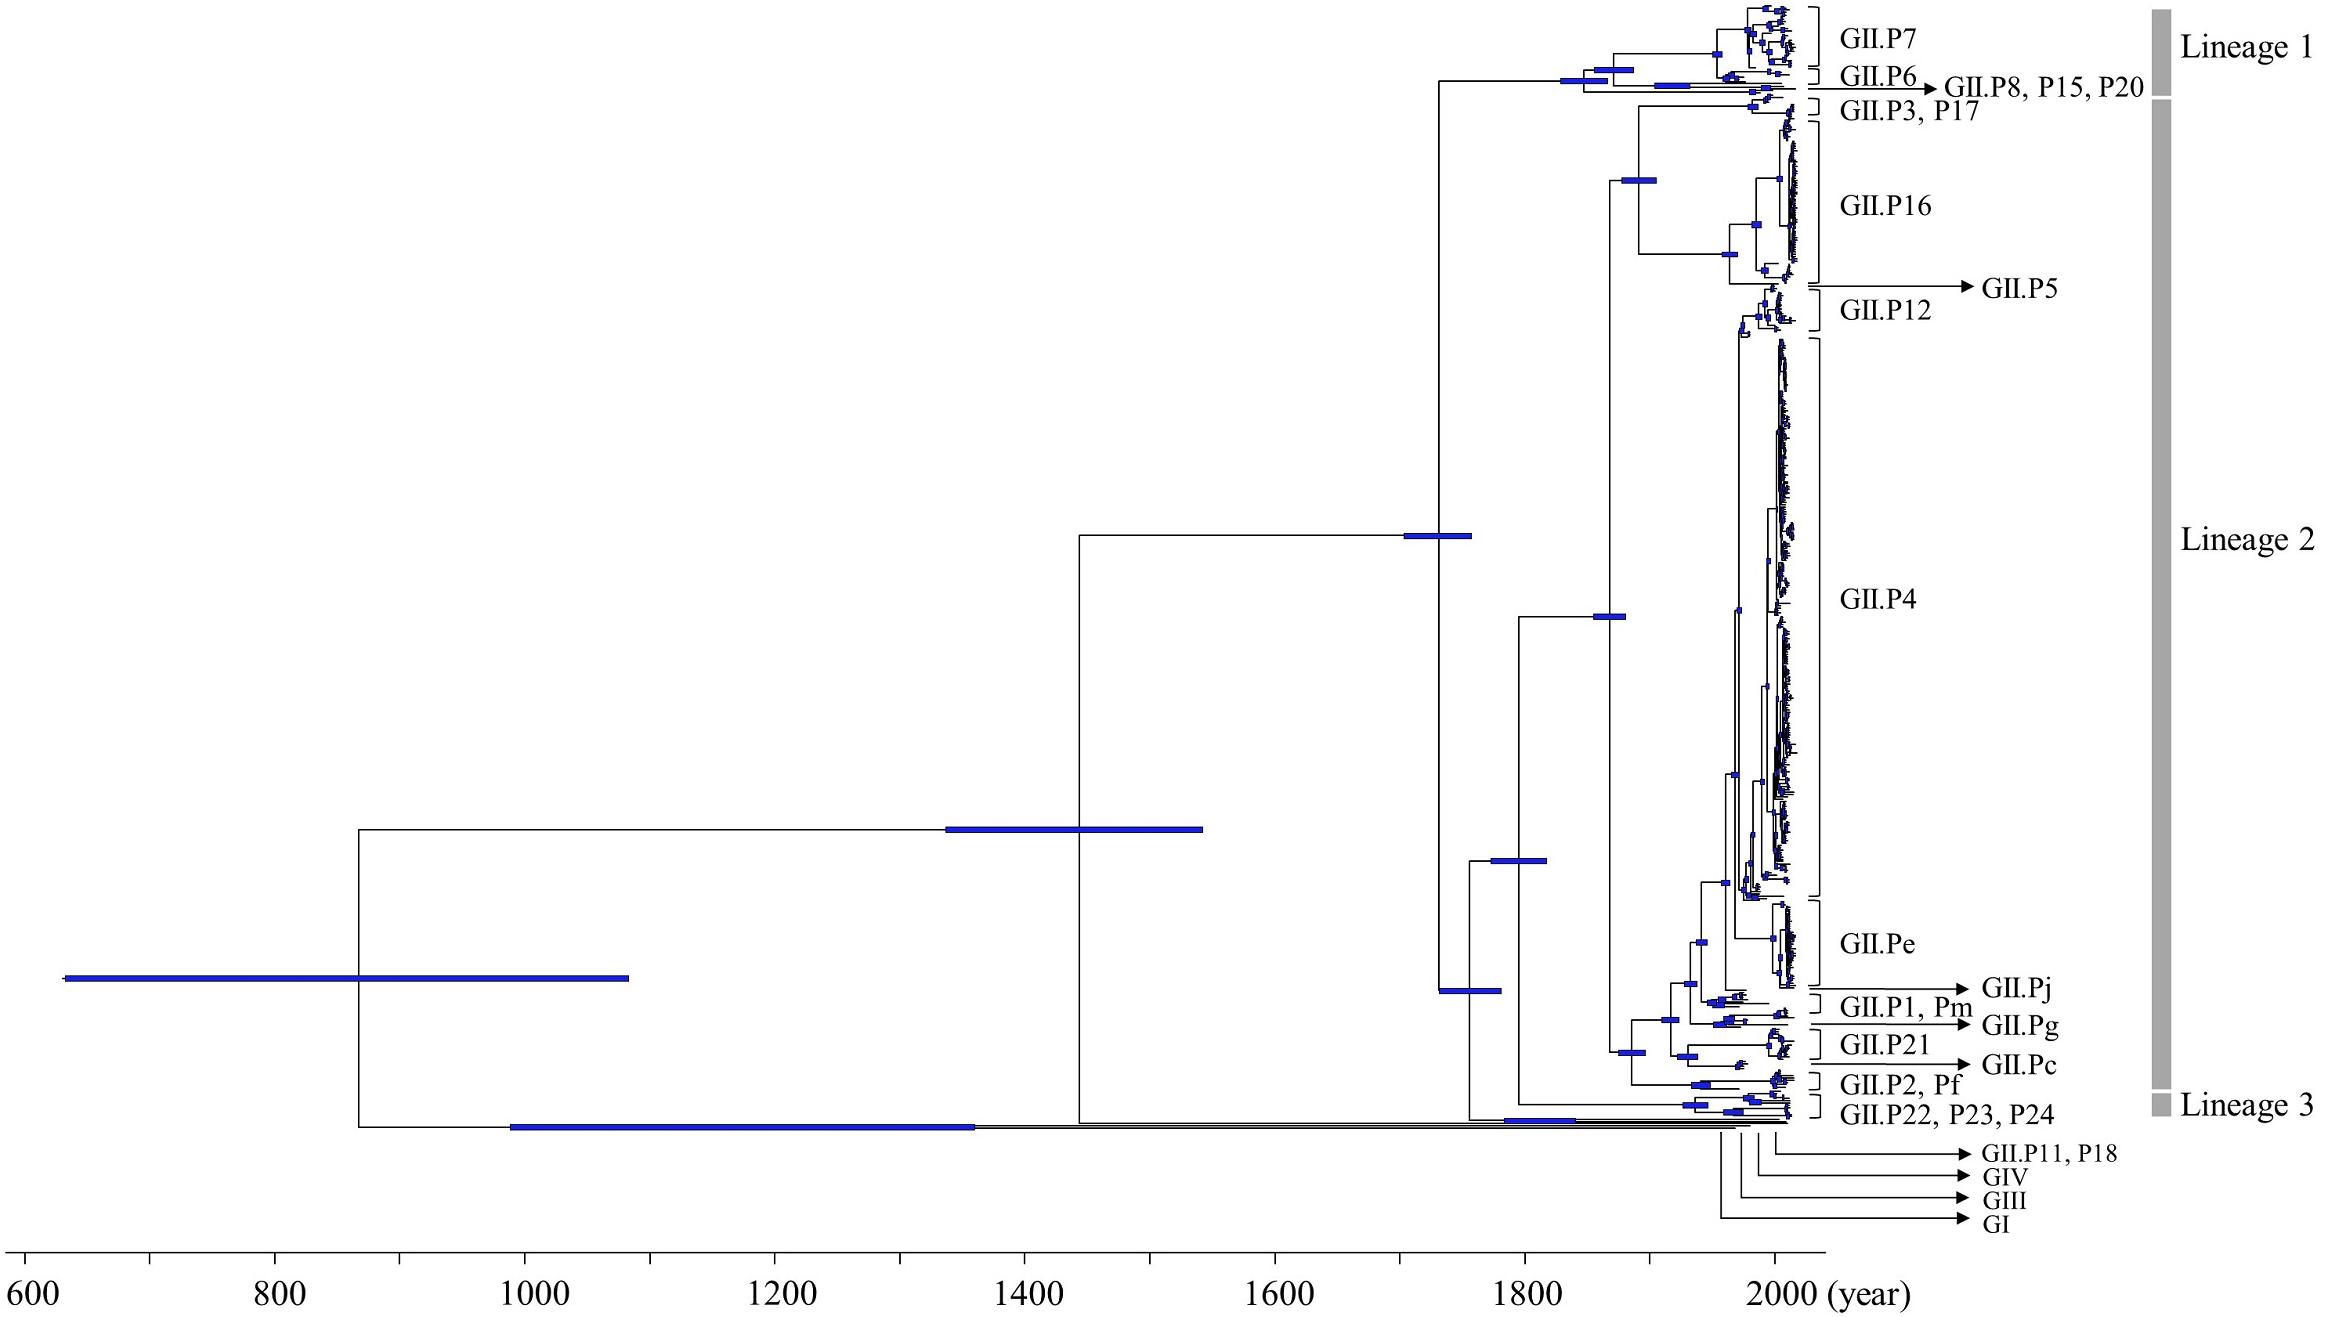
Figure 1. Time-scaled phylogenetic tree of the full-length norovirus RdRp regions constructed by the Bayesian MCMC method. The maximum clade credibility tree with a dataset including norovirus GI.P1, GII, GIII, and GIV is shown. The blue bars indicate the 95% HPD for the estimated years of common ancestors.
The tree showed that an ancient common ancestor of GI, GII, GIII and GIV diverged in 867 CE (95% HPD, 632–1082) and that the common ancestor of GII diverged from GIV in 1443 CE (95% HPD, 1336–1542). The common ancestor of the norovirus GII viruses evolved three lineages after 1731 CE (95% HPD, 1703–1757). Lineage 1 diverged in 1847 CE (95% HPD, 1828–1866), lineage 2 diverged in 1868 CE (95% HPD, 1855–1880) and lineage 3 diverged in 1936 CE (95% HPD, 1926–1946). GII.P8 diverged from a common ancestor with the other norovirus GII virus in 1847 CE (95% HPD, 1828–1866; Supplementary Figure S1). We have shown the detailed estimated years of common ancestors, which are defined as year of divergence, for the three lineages and the genotypes including two or more strains, in Table 1.
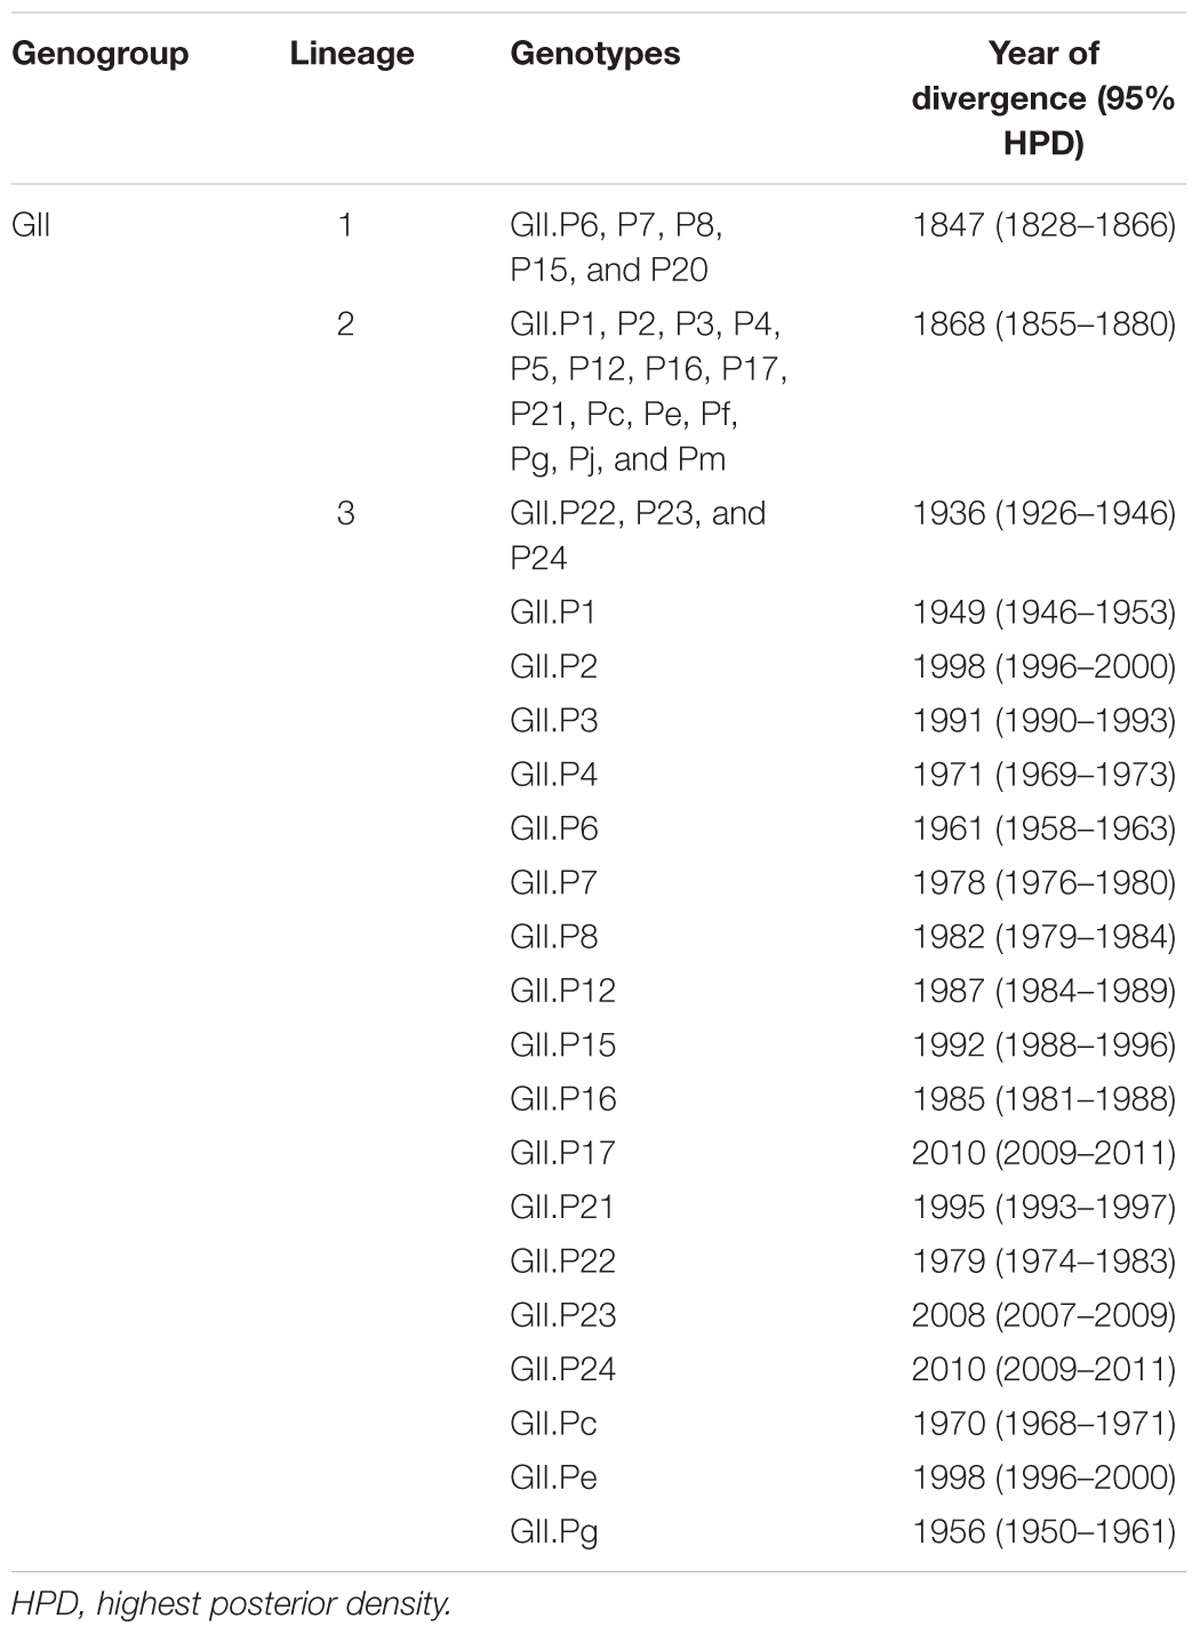
Table 1. The year of divergence in each genotype of norovirus GII strains.
Furthermore, we also analyzed the evolutionary rates of the norovirus GII strains and each polymerase genotype. The evolutionary rate of the RdRp region in the norovirus GII strains was estimated at 2.82 × 10⁻³ substitutions/site/year (95% HPD, 2.52–3.12 × 10⁻³ substitutions/site/year; Figure 2). Moreover, the nucleotide substitution rates were significantly different between the GII strains (p < 0.001; Figure 2 and Supplementary Table S2). Interestingly, the evolutionary rates of the GII.P12 and GII.P16 strains were higher than those of other genotypes at 4.65 × 10⁻³ substitutions/site/year (95% HPD, 2.77–6.58 × 10⁻³ substitutions/site/year) and 4.83 × 10⁻³ substitutions/site/year (95% HPD, 3.42–6.19 × 10⁻³ substitutions/site/year), respectively.
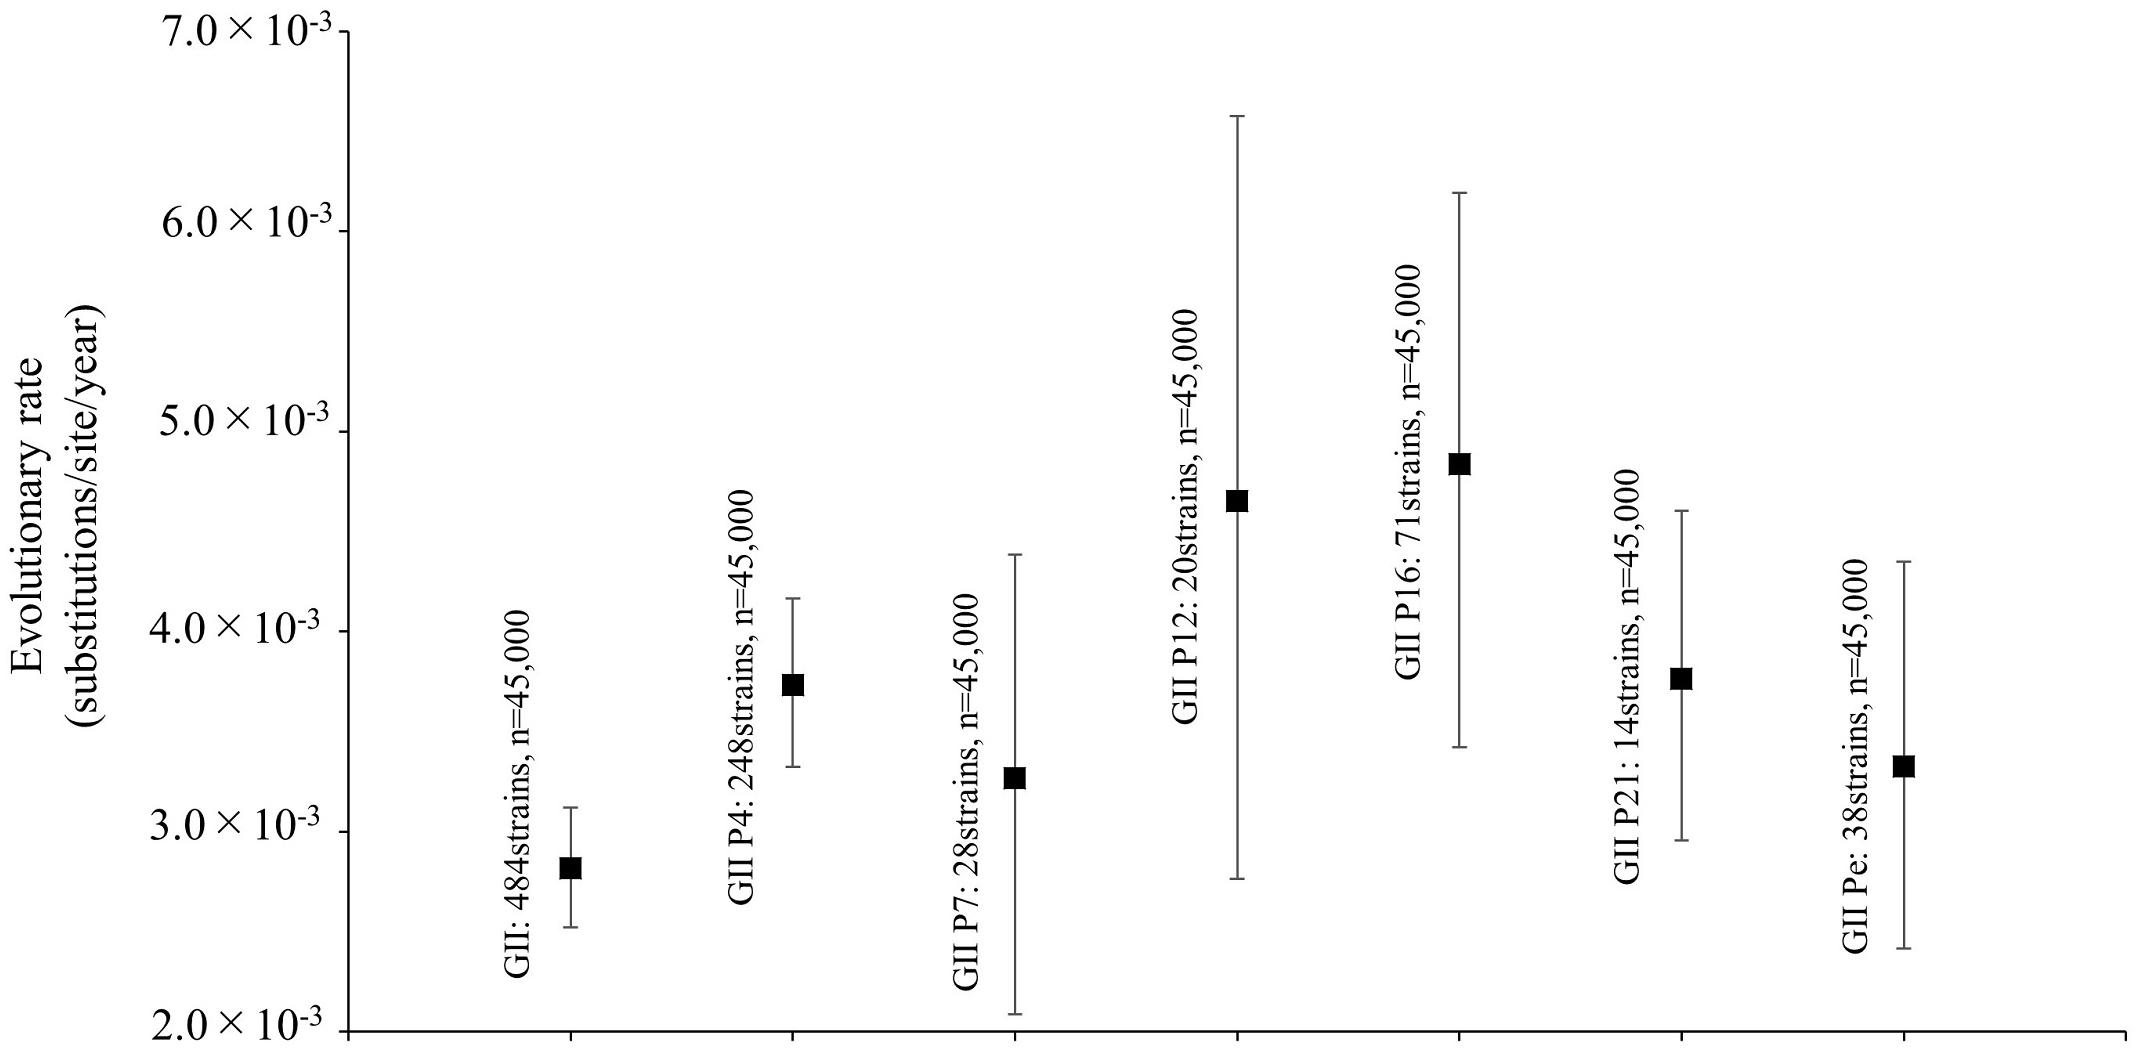
Figure 2. Evolutionary rates of the full-length nucleotide sequences of the norovirus RdRp regions. The y-axis represents the evolutionary rate (substitutions/site/year) and the x-axis represents each genotype. The black squares indicate the mean and the bars indicate the interval of 95% HPD. The statistical results for multiple comparisons between the RdRp genotypes are shown in Supplementary Table S2.
Phylogenetic Distances of the RdRp Region in the Norovirus GII Strains
We also analyzed the phylogenetic distances of the RdRp region in the norovirus GII strains, which averaged 0.549 ± 0.486 (mean ± SD, Figure 3A). The phylogenetic distances of GII.P4 and GII.P7 were 0.084 ± 0.044 and 0.124 ± 0.056, respectively. These histograms were distributions with a broad range of the distances (Figures 3B,C). Furthermore, the phylogenetic distance of GII.P12 was 0.058 ± 0.036 (Figure 3D). The phylogenetic distance of GII.P16 was 0.064 ± 0.063, and the histogram was bimodal (Figure 3E). Moreover, the phylogenetic distance of GII.P21 was 0.053 ± 0.025 (Figure 3F). The phylogenetic distance of GII.Pe was 0.032 ± 0.023, and the histogram was bimodal (Figure 3G). The phylogenetic distances of each genotype differed significantly between the norovirus GII strains (p < 0.05 or p < 0.001), excluding those between GII.P12 and GII.P21. Detailed data are presented in Supplementary Table S3.
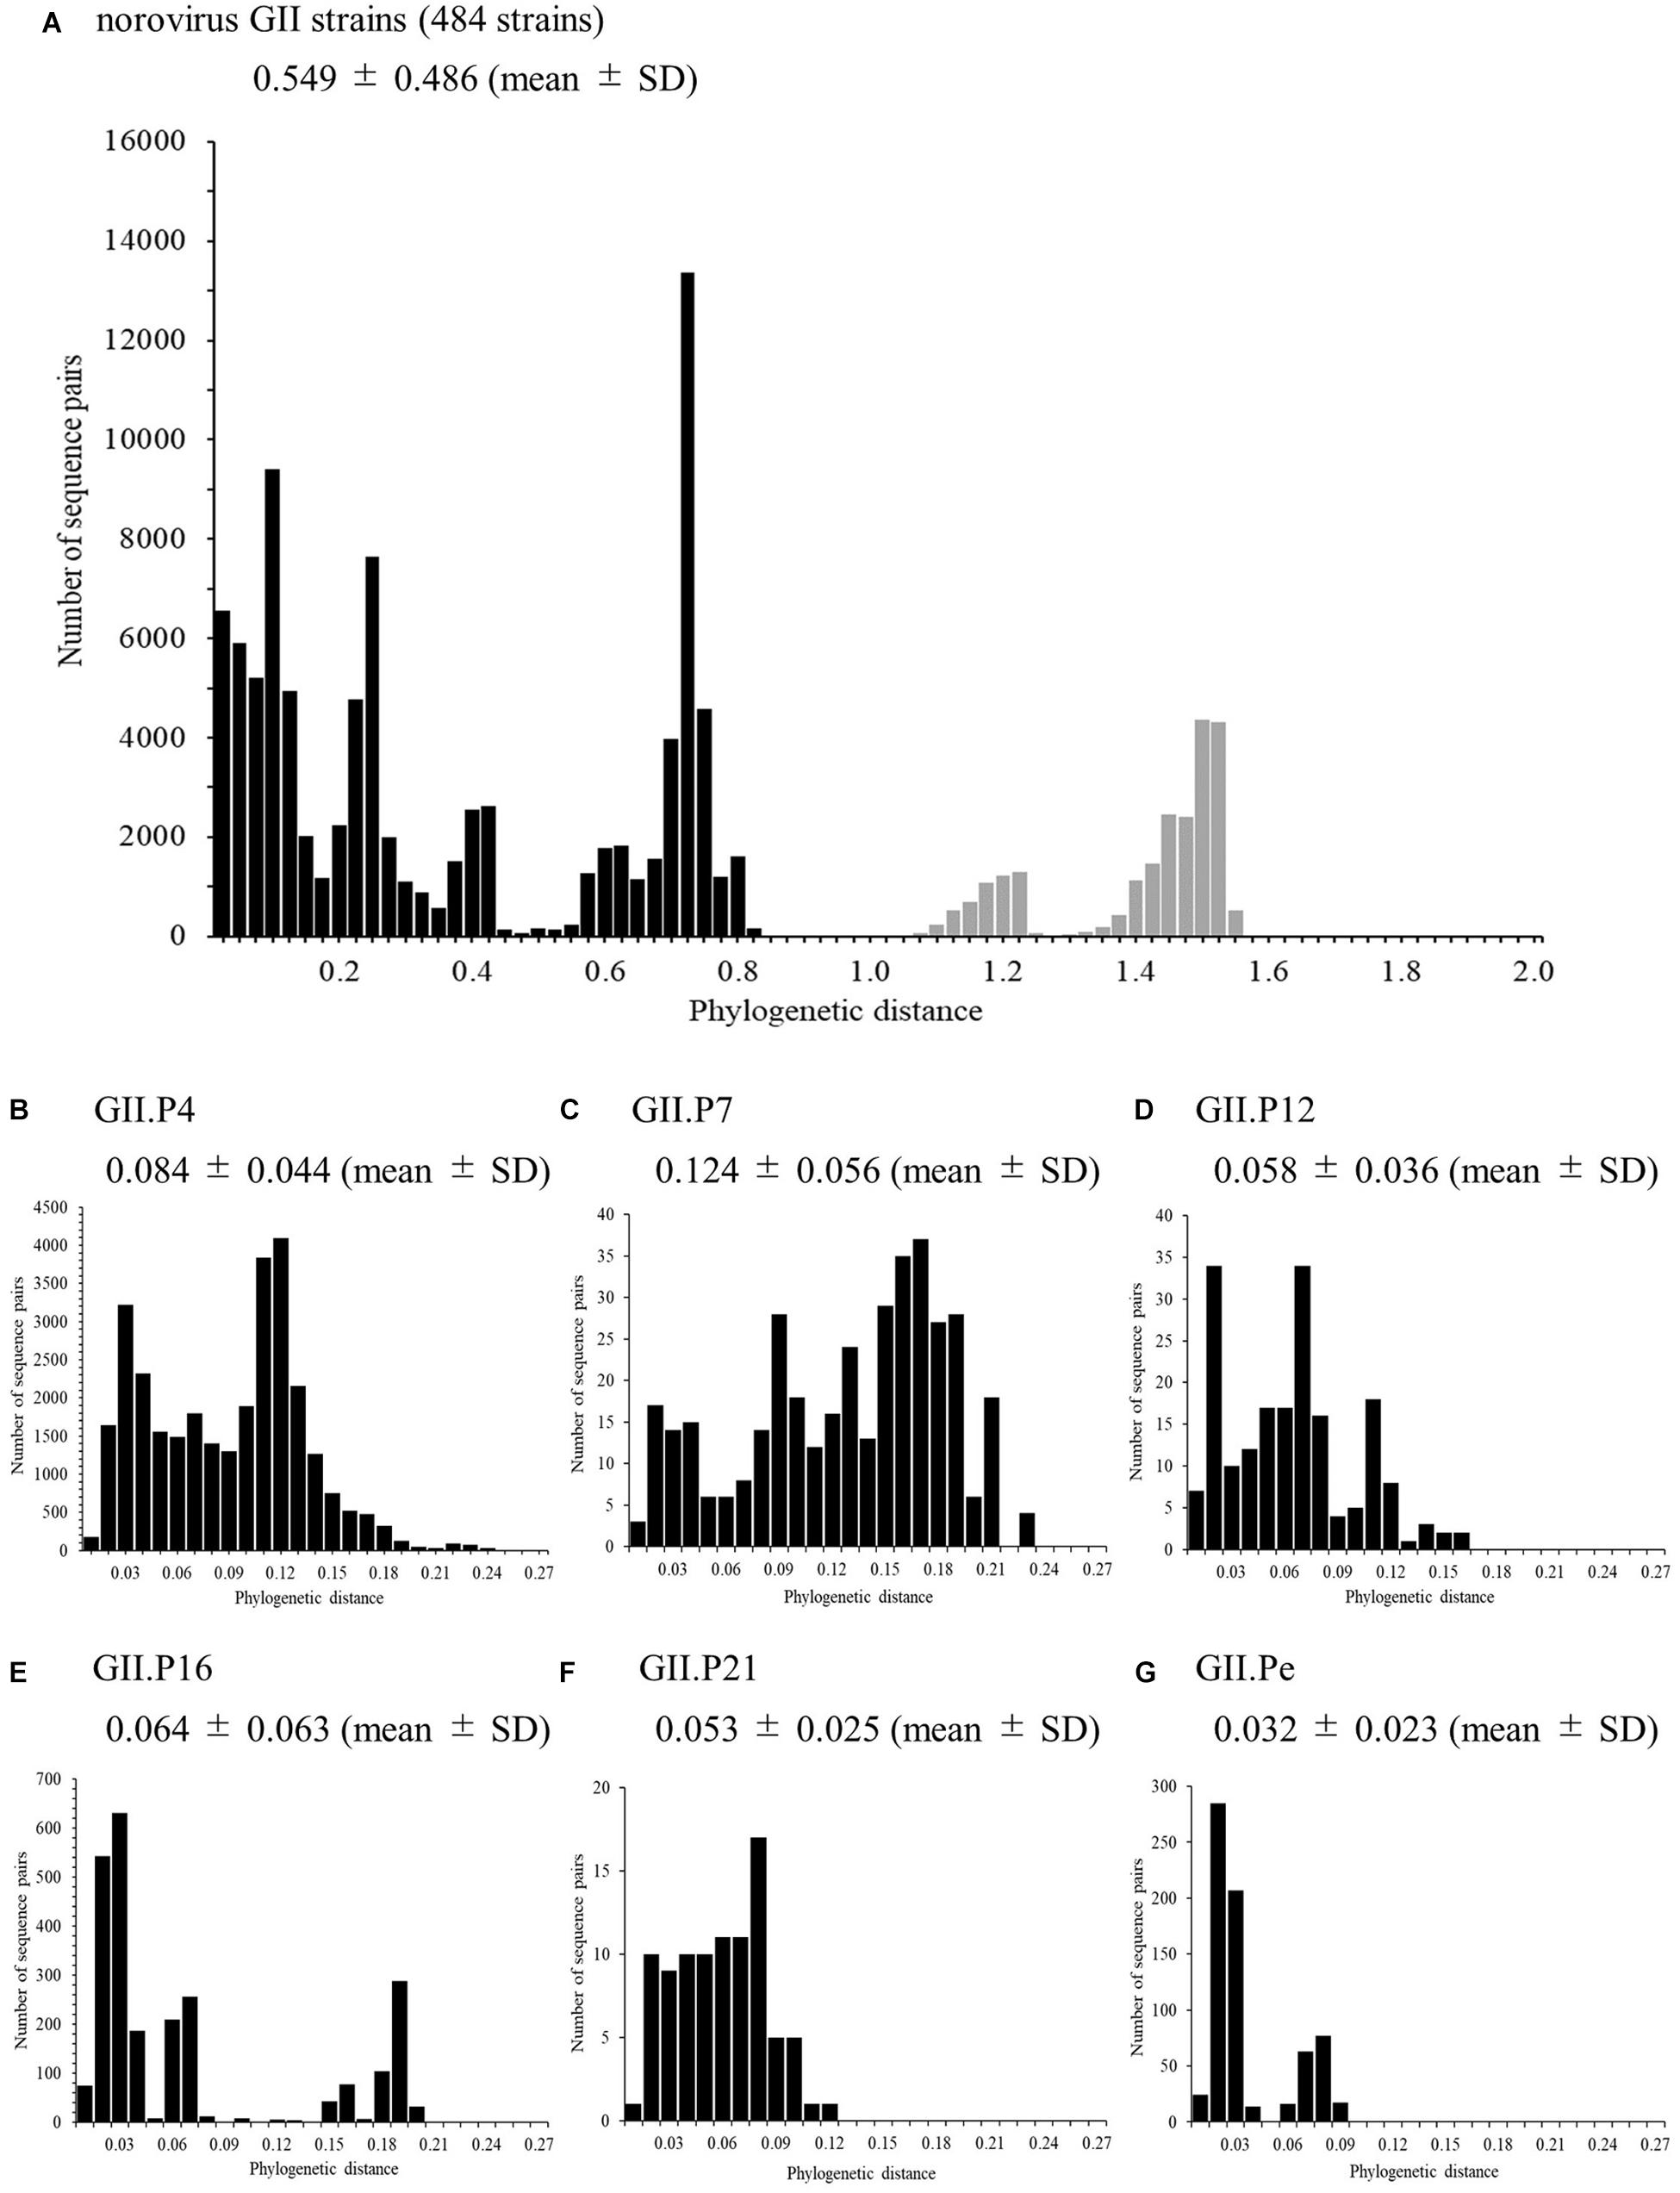
Figure 3. Phylogenetic distances between sequences of the full-length norovirus RdRp region. The distributions of phylogenetic distances of the norovirus GII strains (A), GII.P4 (B), GII.P7 (C), GII.P12 (D), GII.P16 (E), GII.P21 (F), and GII.Pe (G) are shown. The y-axis represents the number of sequence pairs corresponding to each distance, and the x-axis shows the phylogenetic distance. The distribution of phylogenetic distance for ≥1.0 is shown in gray in (A). The numbers on the histograms indicate the mean ± SD of all phylogenetic distances for GII strains (A) and each genotype (B–G). The statistical results for multiple comparisons are shown in Supplementary Table S3.
Mapping and Structure of Amino Acid Substitutions and Negative Selection Sites on the Norovirus GII RdRp Protein
We mapped the substitution sites of the other RdRp proteins using GII.P8 (a prototype, accession no. AB039780) as a reference strain, because GII.P8 was the first to diverge from the common ancestor of the norovirus GII polymerase region (Supplementary Figure S1). Several amino acid substitutions were predicted on the exterior structures of RdRp proteins, but no substitution was found adjacent to the active site of the enzyme (Figure 4 and Supplementary Figure S2). Five common amino acid substitutions (Met160Val, Ile221Met, Leu227Ile, Gln383Glu, and Arg408Gln) were detected in all genotypes of the RdRp protein. We first mapped the negative selection sites and amino acid substitution sites on the RdRp protein structure of the norovirus GII viruses. Of the 171 substitution sites per monomer, 158 were estimated to be negative selection sites between the prototype GII.P8 strain and other strains, according to the amino acid residues in the dataset of the norovirus GII strains (Table 2). Furthermore, of the negative selection sites in each genotype, the GII.P4, GII.P7, and GII.P16 strains contained 49, 7 and 12 sites per monomer, respectively (Table 2 and Supplementary Table S4). There were five or fewer negative selection sites per monomer in other genotypes (GII.P1, P12, P21, P22, and Pe), while no negative selection sites were found in the GII.P2, P3, P6, P17, P23, Pc, and Pg strains (Table 2 and Supplementary Table S4). No positive selection sites were predicted in all the norovirus GII strains and each genotype strain (data not shown).
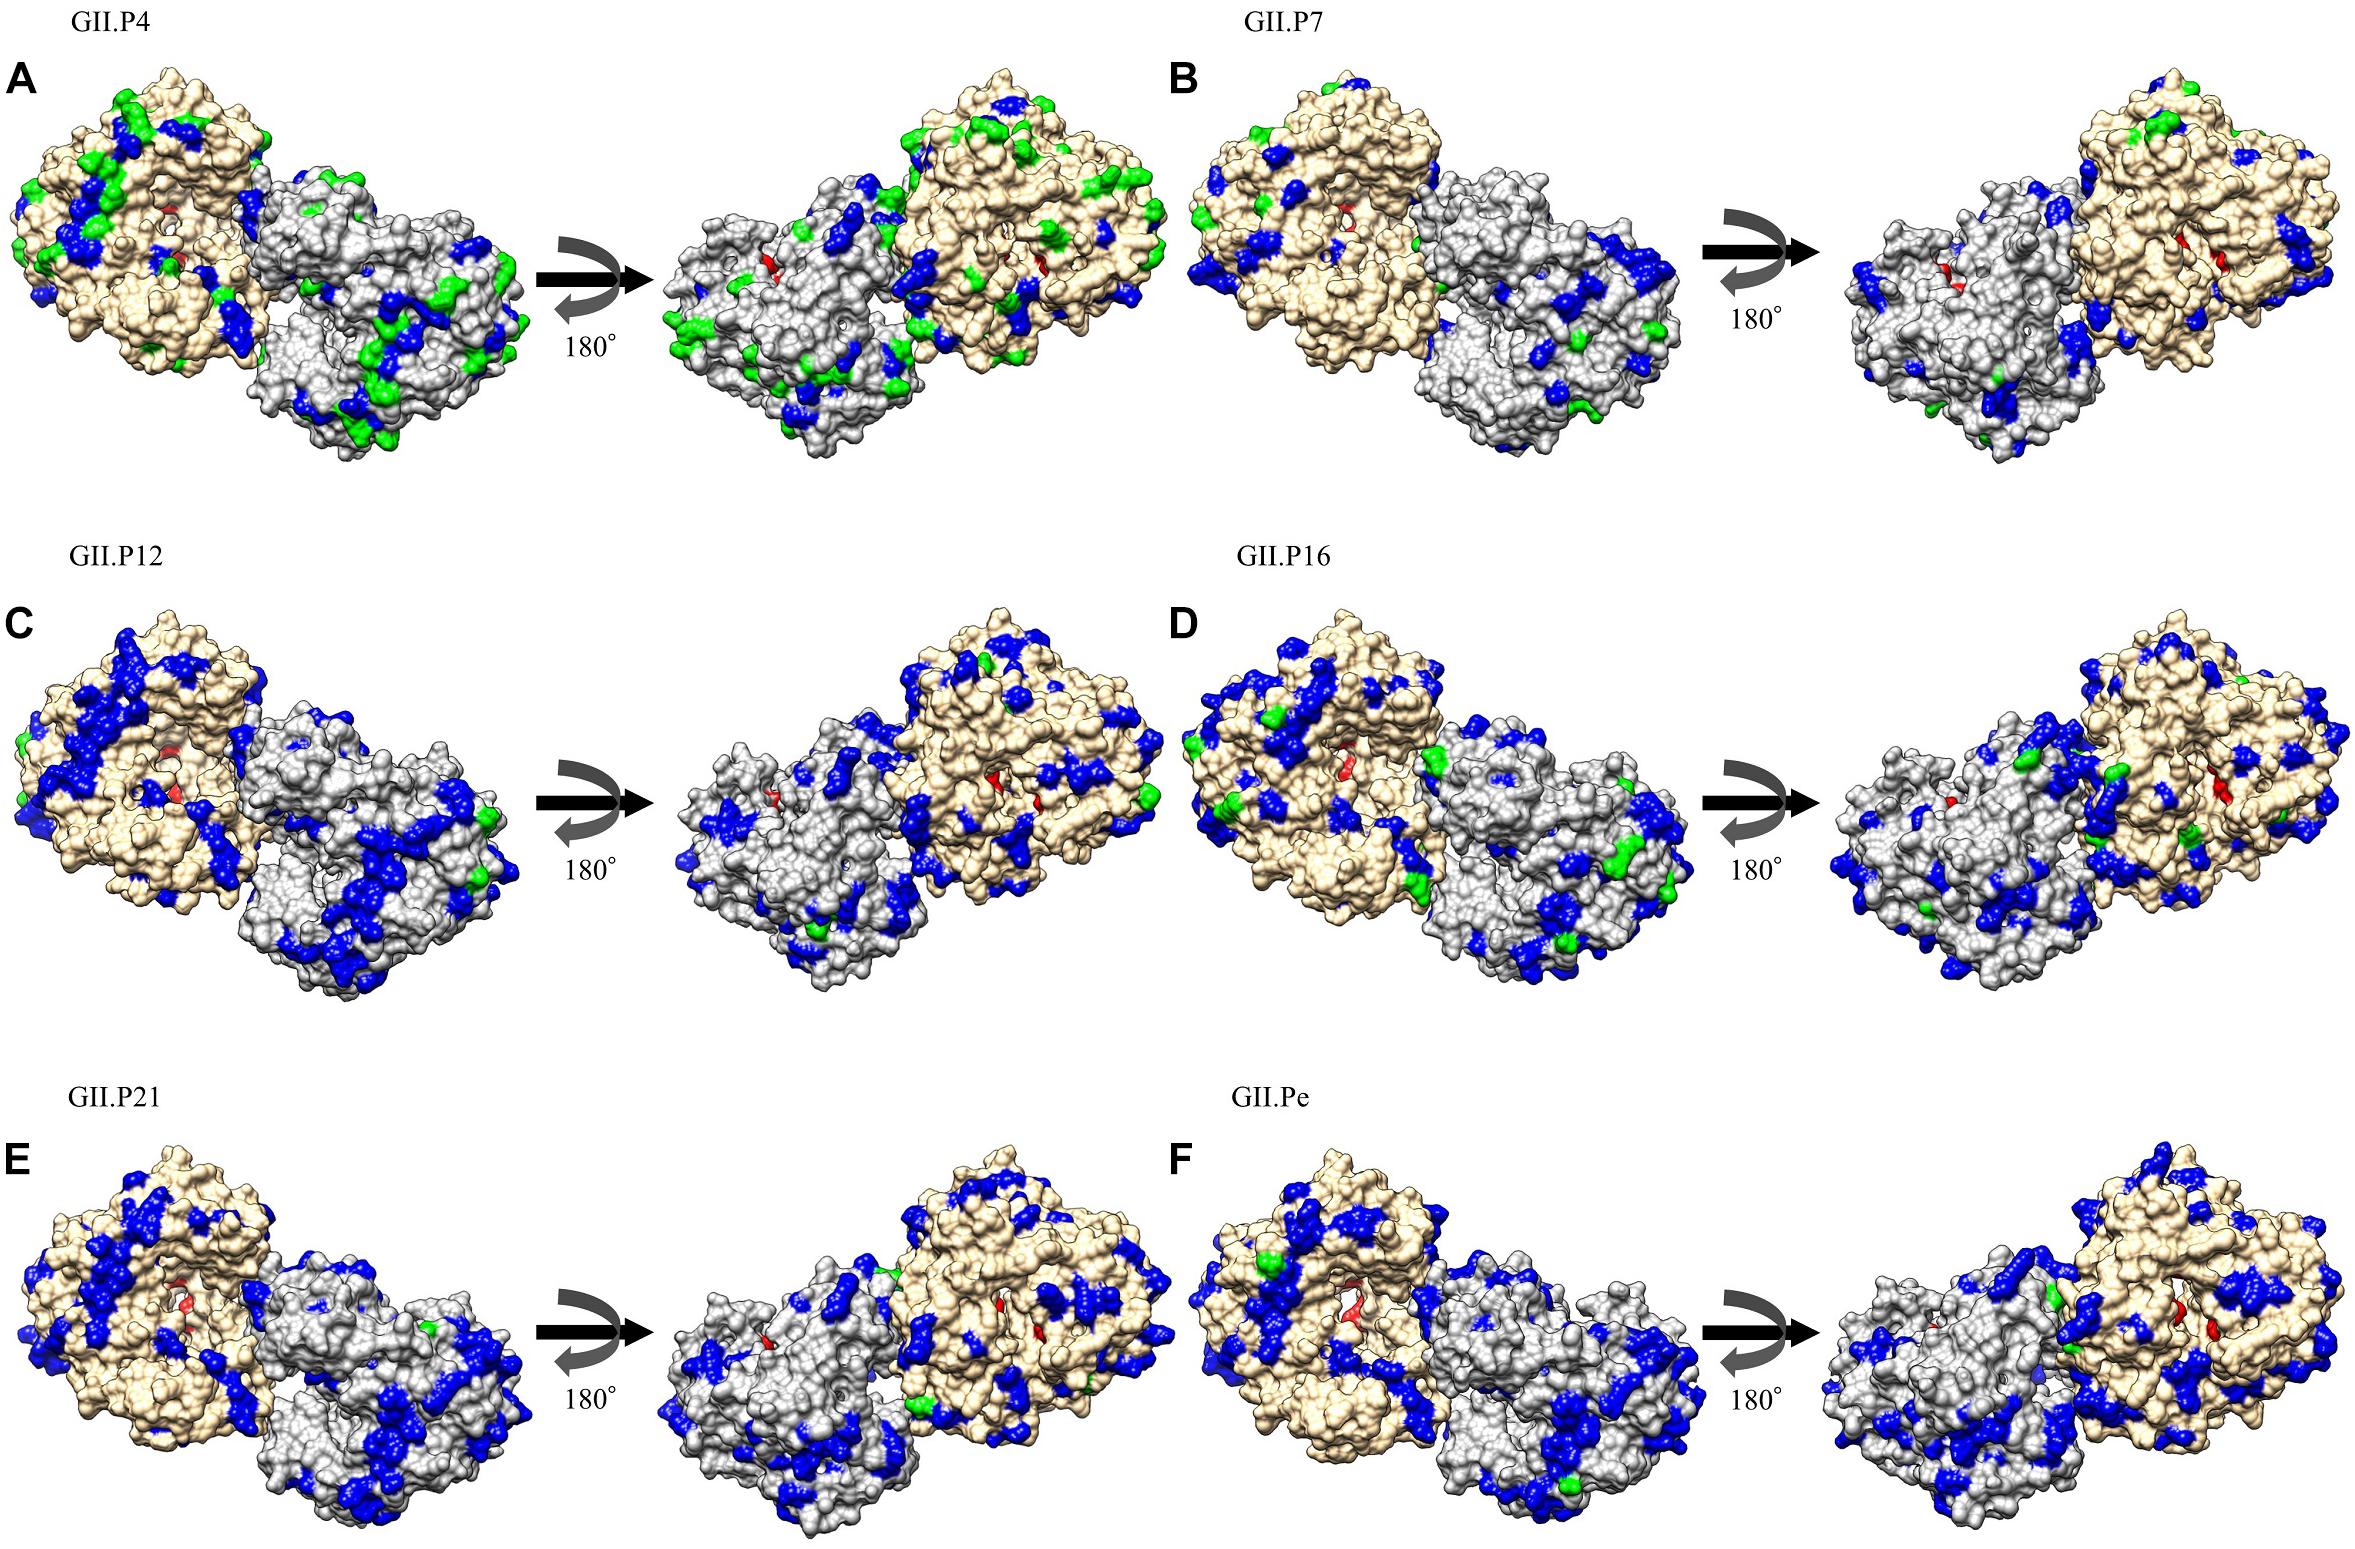
Figure 4. Structural models for the RdRp protein of each genotype. Three-dimensional RdRp dimer structures for GII.P4 (A), GII.P7 (B), GII.P12 (C), GII.P16 (D), GII.P21 (E), and GII.Pe (F) are shown. The chains to composing the dimer structures are colored gray (chain A) and Navajo white (chain B). Negative selection sites are colored green. Amino acid substitutions of the other genotypes compared to the GII.P8 strain are colored blue. Active site residues are colored red.
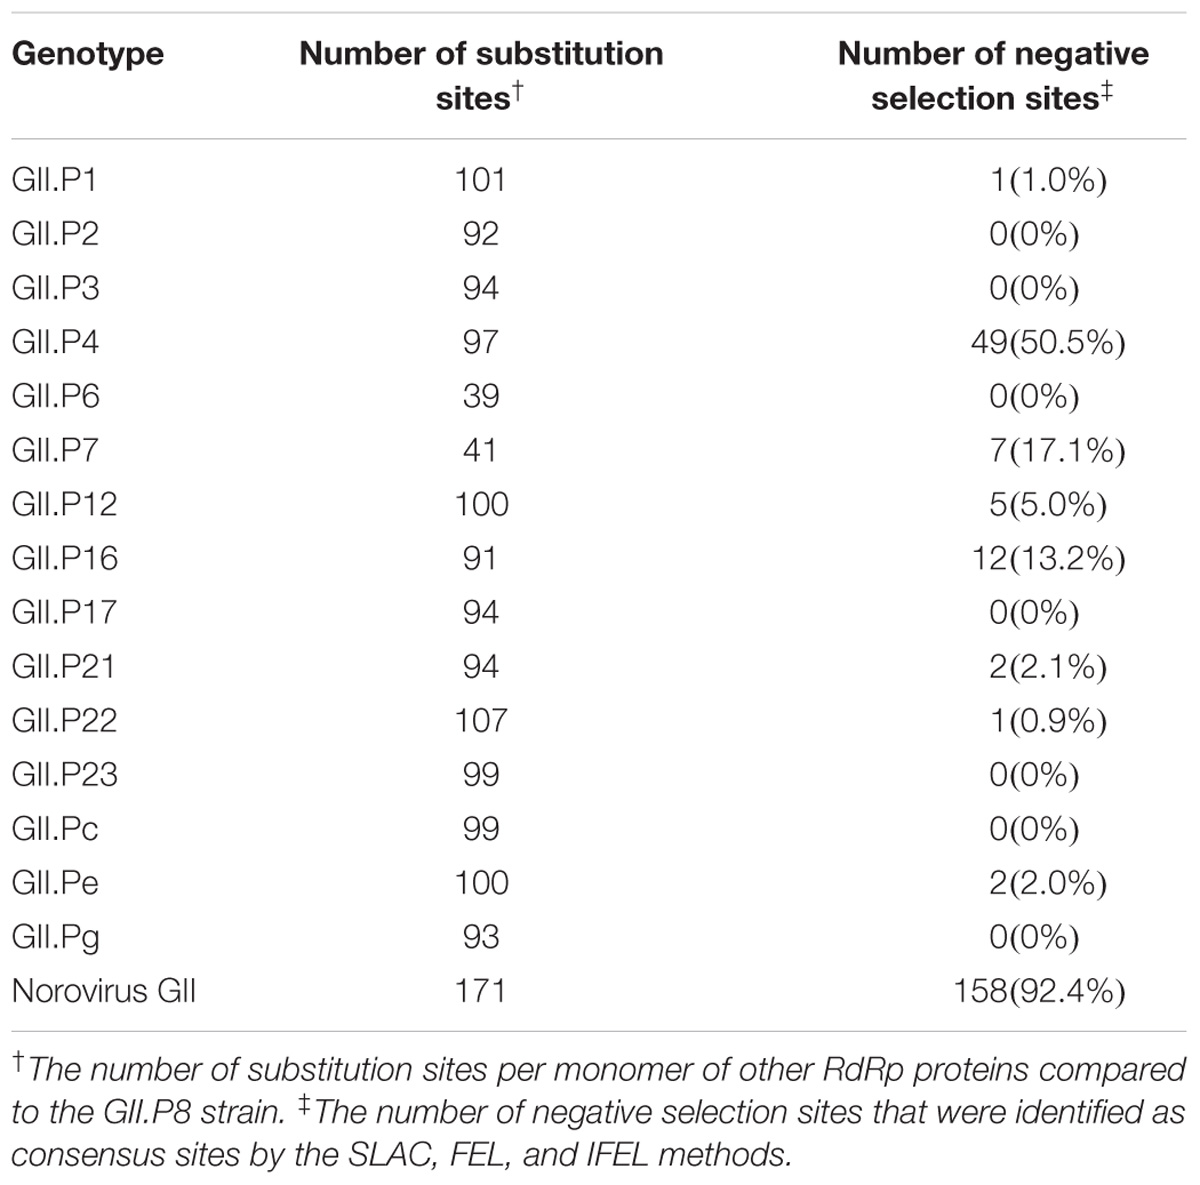
Table 2. The number of amino acid substitutions and negative selection in the norovirus GII strains.
Phylodynamics of the RdRp Region in the Norovirus GII Strains Using the BSP Method
We analyzed the phylodynamics of the norovirus GII RdRp region using the BSP method; the detailed parameters are shown in Supplementary Table S5. The mean effective population size remained constant until approximately 1990 in the present norovirus GII strains, after which the values fluctuated (Figure 5A). The mean effective population size of GII.P4 increased in 2004–2008 and decreased around 2011 in each genotype (Figure 5B). The mean effective population sizes of GII.P12, GII.P16, and GII.Pe increased approximately between 2003 and 2004, 2014 and 2015, and 2009 and 2011, respectively, while no size changes were observed in the other polymerase genotypes (Figures 5C–G). In addition, the effective population sizes of the norovirus GII strains were estimated to have been maintained at over 102 for approximately 250 years (Figure 5A).
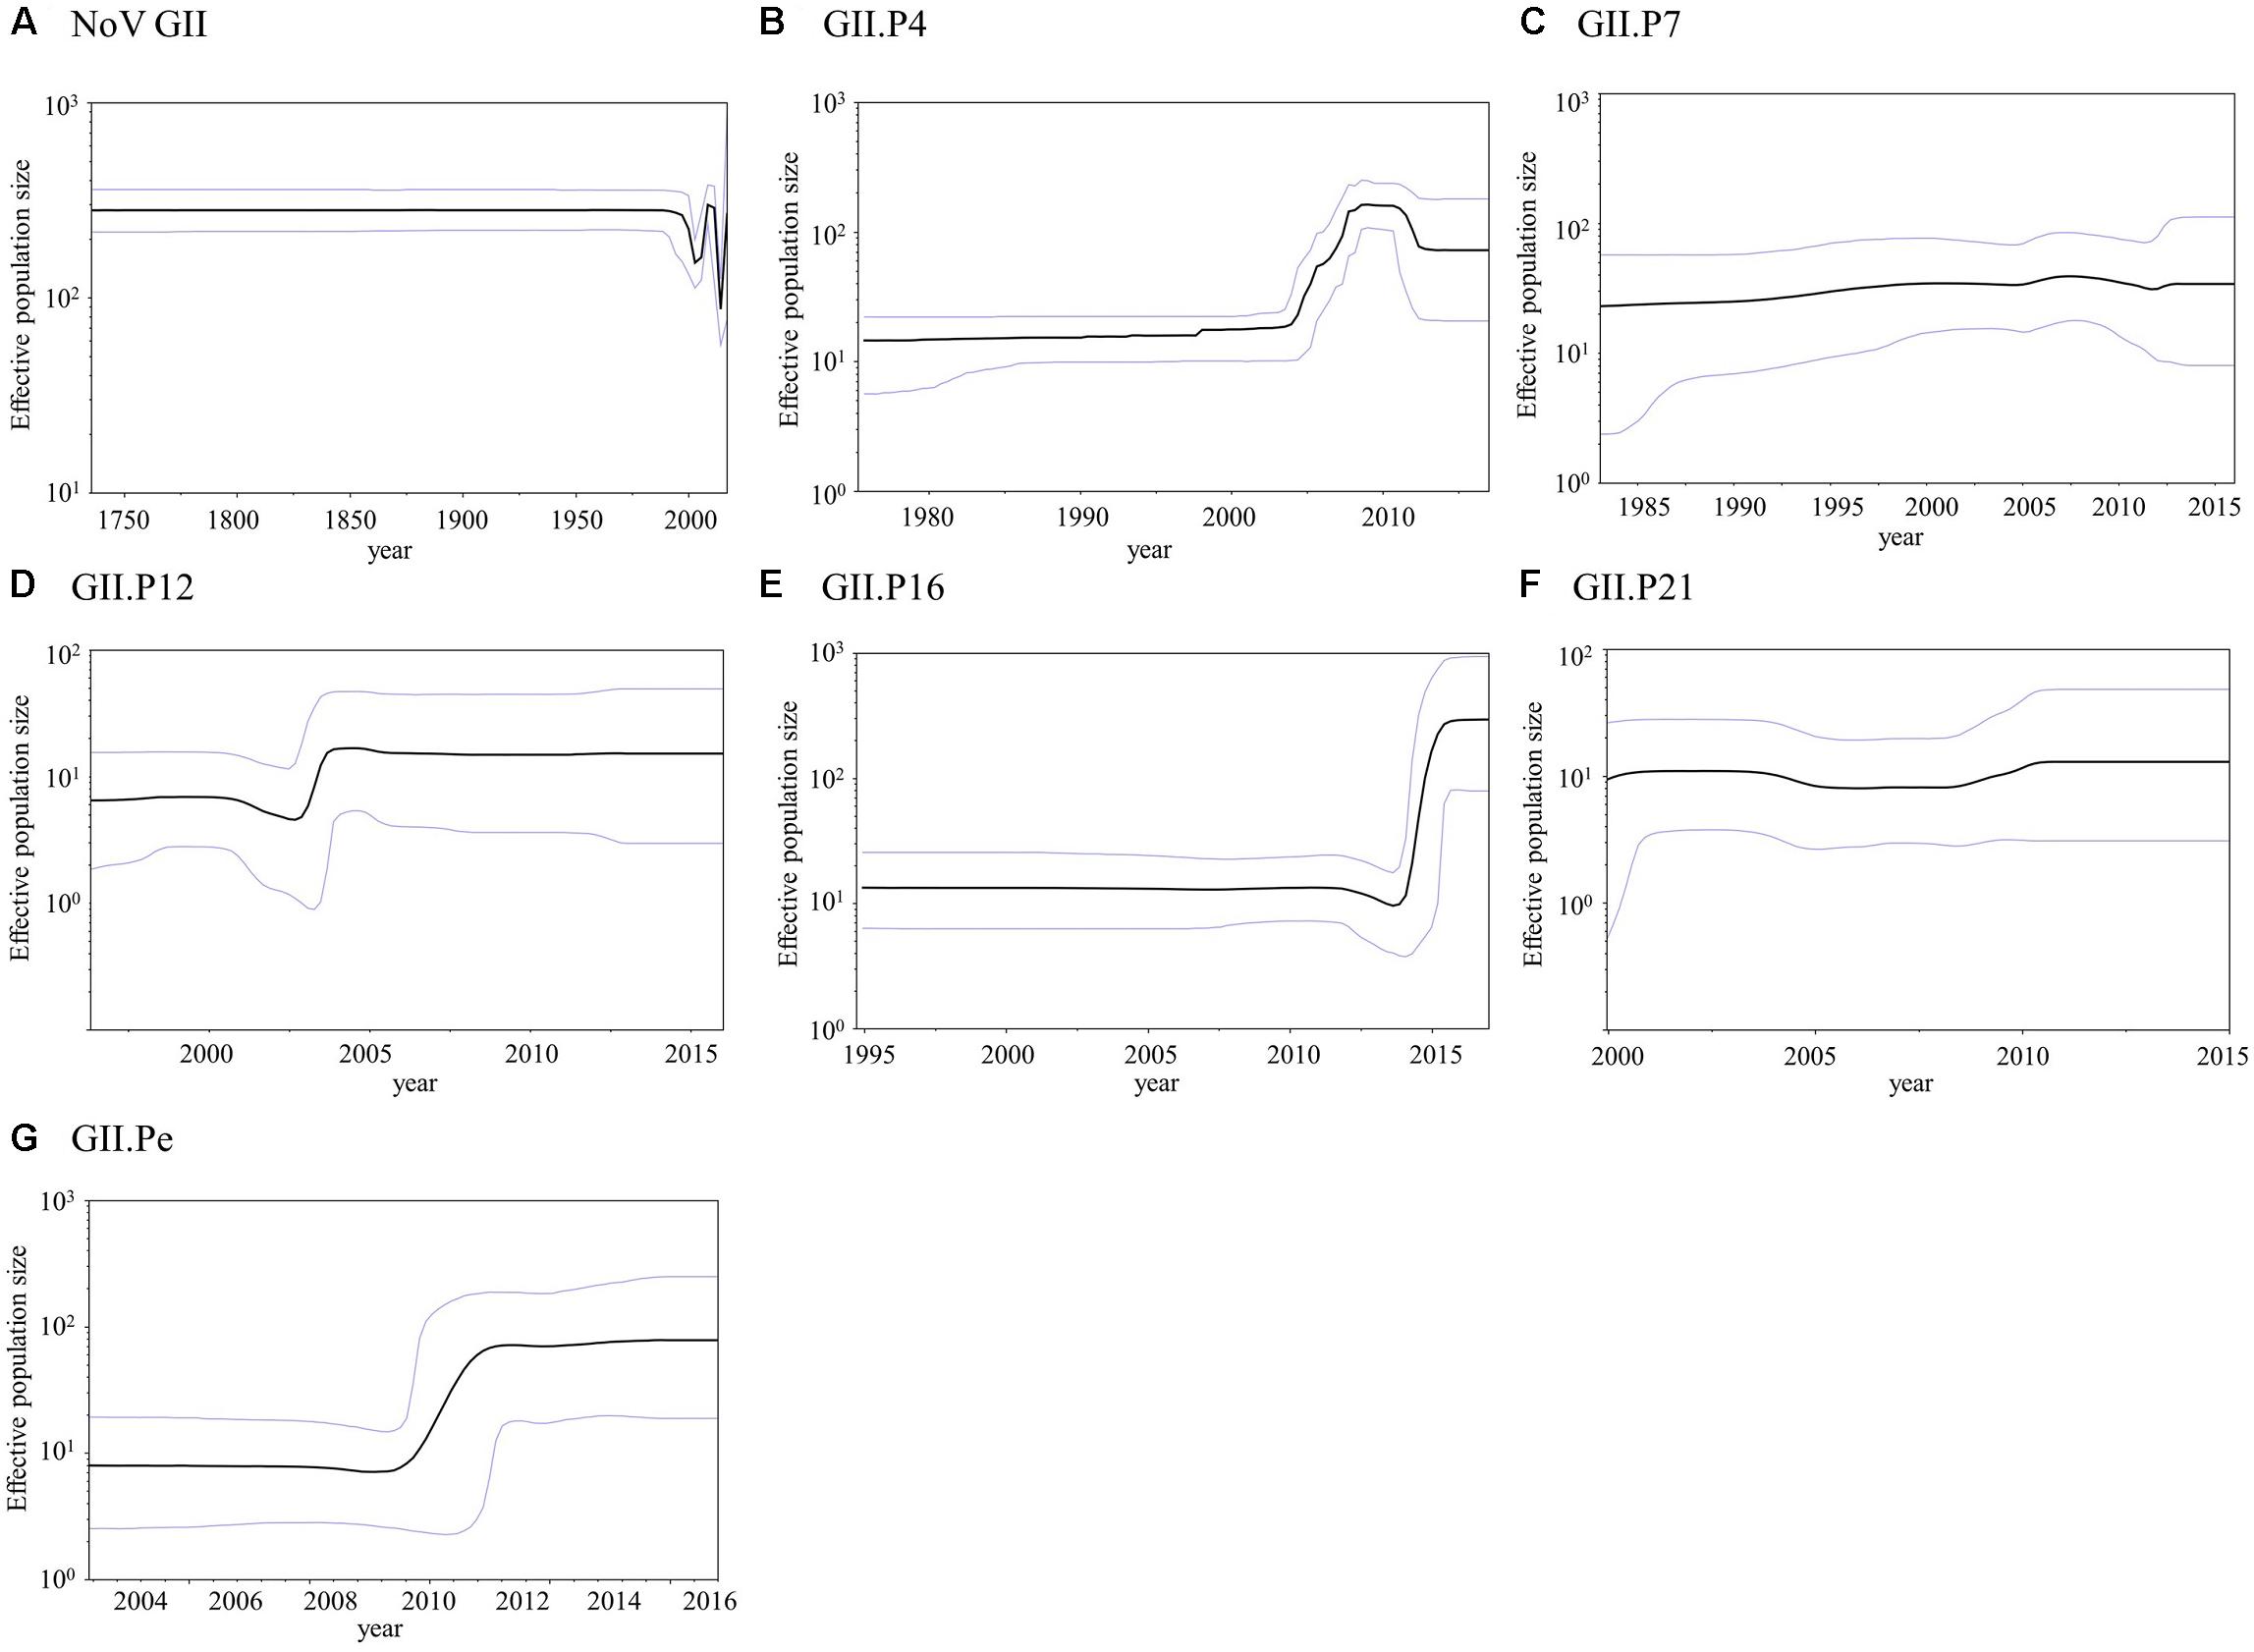
Figure 5. Bayesian skyline plot for the norovirus GII strains. Plots for norovirus GII (A), GII.P4 (B), GII.P7 (C), GII.P12 (D), GII.P16 (E), GII.P21 (F), and GII.Pe (G) are shown. The y-axis represents the effective population size on a logarithmic scale, and the x-axis denotes the time in years. The solid black line indicates the mean posterior value, and the blue lines indicate intervals with 95% HPD.
Discussion
Molecular evolutionary analyses of the norovirus RdRp region have been reported in some previous studies (Siebenga et al., 2010; Matsushima et al., 2015; Nagasawa et al., 2018a). For example, Siebenga et al. (2010) mainly studied the GII.P4 RdRp region, while Matsushima et al. (2015) studied the RdRp region and the VP1 gene of GII.P17-GII.17. Furthermore, Nagasawa et al. (2018a) analyzed the RdRp region and the VP1 gene of GII.P2-GII.2 and GII.P16-GII.2. To the best of our knowledge, this is the first comprehensive molecular evolutionary study of a large number of polymerase genotypes (25) from globally collected strains. Our cumulative findings suggest that (i) the common ancestor of the RdRp region of the analyzed strains, including GI, GII, GIII, and GIV, diverged around 1150 years ago (867 CE) and that the GII RdRp region diverged from GIV around 570 years ago (1443 CE) to form three major lineages of the norovirus GII strains (Figure 1); (ii) the RdRp region evolved rapidly (>10−3 substitutions/site/year) and the evolutionary rates of the different genotypes were significantly different (Figure 2); (iii) several amino acid substitutions of the RdRp protein (39–107 sites) were detected in various genotypes, while negative selection sites were distinct in each genotype (Figure 4 and Table 2); (iv) the phylodynamics of the GII RdRp region differed between the genotypes. These results suggest that the norovirus GII RdRp region evolved rapidly with several amino acid substitutions. Furthermore, the evolutionary mechanism of each genotype may be different.
The time-scaled evolutionary tree of the GII RdRp region using the Bayesian MCMC method showed similar evolutionary trends to the one produced using the GII VP1 gene (Kobayashi et al., 2016). Specifically, Kobayashi et al. (2016) reported that the common ancestor of the GI, GII, GIII, and GIV VP1 gene diverged around 1160 years ago (854 CE), while the common ancestor of the GII and GIV diverged around 570 years ago (1445 CE) and formed three major lineages of the norovirus GII. However, the divergence years of the norovirus GII RdRp region and the VP1 gene were different (290 vs. 380 years ago). Although the datasets differed between the previous and present studies, time-scaled evolution of the region and the gene might fall into step.
Several evolutionary studies of the norovirus genes have been reported, although these mainly focused on the VP1 (capsid) gene (Bok et al., 2009; Boon et al., 2011; Qiao et al., 2016; Motoya et al., 2017; Hernandez et al., 2018; Sang and Yang, 2018). However, some studies focused on the evolution of the norovirus RdRp region (Siebenga et al., 2010; Mahar et al., 2013; Nagasawa et al., 2018a). For example, Siebenga et al. (2010) estimated that, based on partial sequences (247 nt), the evolutionary rate of the GII.4 RdRp region was 8.98 × 10⁻³ substitutions/site/year. Another report showed that the rate for the GII.3 RdRp region (274 nt) was 2.79 × 10⁻³ substitutions/site/year (Mahar et al., 2013). Furthermore, Nagasawa et al. (2018a) estimated that the rate for the full-length GII.P16 was 2.03 × 10⁻³ substitutions/site/year. However, there have been no evolutionary studies on the various norovirus genotypes in the RdRp region; therefore, it was important to comprehensively study the evolution of the norovirus GII RdRp region from globally collected strains. In this study, we showed that the GII RdRp region evolved rapidly (>10−3 substitutions/site/year) and that distinct evolutionary rates occurred in each genotype (Figure 2). These new findings may contribute to a more complete understanding of the genetic properties of the norovirus GII RdRp region.
We also analyzed the phylogenetic distances in the present strains (Figure 3) and found that the composition of the distances differed among the strains for each genotype (Figures 3B–G). The histograms of the distances of the GII.P4 and GII.P7 genotypes showed broad range distributions, suggesting a larger genetic divergence than that in other genotypes. The histograms of the distances of the other genotypes showed narrow-range distributions and suggested that they were a small genetic divergence. Thus, the GII RdRp region exhibits a varied genetic divergence, as does the GII VP1 gene (Kobayashi et al., 2016; Motoya et al., 2017).
We then estimated the negative selection sites in the RdRp protein in silico and mapped these sites. Several possible negative selection sites were identified in the RdRp protein of each genotype (Figure 4 and Supplementary Figure S2). Of these, many of the negative selection sites (49 sites per monomer) at the amino acid substitution sites, compared to the reference strain (GII.P8), were found in the GII.P4 RdRp protein. In general, negative selection sites may play a role in preventing the loss of viral protein function, because most mutations are deleterious (Domingo, 2006). In addition, other data suggest that amino acid substitutions (291Thr or 291Val) enhance the GII RdRp activity (Bull et al., 2010). The present data suggest that such substitutions occurred in the GII.P4 protein (291Thr) and that the GII.P4 may, therefore, be more efficient at replicating the viral genome, although we did not examine its activity in vitro in this study. Epidemiological data suggest that the GII.P4-GII.4 was responsible for the pandemics of the gastroenteritis between 2006 and 2014 (Kumazaki and Usuku, 2015). A high replication efficacy of the GII.P4 RdRp protein may have been associated with these pandemics, although further studies are required to test this hypothesis.
Finally, we also assessed the phylodynamics of various genotypes of the GII RdRp region (Figure 5). The phylodynamics of GII.P4, GII.P12, GII.P16, and GII.Pe fluctuated at certain times. For example, GII.P4 increased at around 2004–2008, while GII.P12, GII.P16 and GII.Pe increased at around 2003–2004, 2014–2015, and 2009–2011, respectively. We determined the year when the population size of the polymerase type increased to the year in which the VP1 genotypes of the strains were obtained. In the genotypes of GII.P4, GII.P12, and GII.Pe, the collection year of GII.4 was almost consistent with the year when the population size increased. However, in the GII.P16, the collection years of GII.2 and GII.4 agreed with the year of increase of the population size. The collection year of these detected genotypes was consistent with those of previous epidemiological reports on the GII.2 and GII.4 (Okada et al., 2006; Motomura et al., 2008; Chen et al., 2015; Nagasawa et al., 2018b). A similar phenomenon was previously reported in the phylodynamics of the GII VP1 gene (Kobayashi et al., 2016; Sang and Yang, 2018). Therefore, information about the phylodynamics of norovirus genes may contribute to understanding the past prevalence of each norovirus genotype.
In this study, a limited number of GII RdRp sequences from the GenBank1 were used, which may have led to some selection bias. In addition, sequences with ≥99.4% identity were omitted. These biases may have affected the results of the bioinformatics analyses. In particular, the result of the phylogenetic distance may have been biased by analyzing the dataset of all sequences and each genotype excluding ≥99.4% identity sequences.
Conclusion
In conclusion, the common ancestor of the GII RdRp region diverged around 290 years ago (1731 CE) with a high evolutionary rate (over 10−3 substitutions/site/year). As a result, the GII RdRp region and proteins exhibit high diversity. Moreover, the phylodynamics of some RdRp genotypes have changed drastically over the past 10 years. These results should contribute to a better understanding of the norovirus virology.
Author Contributions
KO, KK, and HK designed the study. KO, YM, KN, TM, MK, and HK analyzed the data. KO, YM, AR, KK, and HK wrote and supervised the study. All authors read and approved the manuscript.
Funding
This work was partly supported by a commissioned project for Research on Emerging and Re-emerging Infectious Diseases from the Japan Agency for Medical Research and Development, AMED (Grant No. 18fk0108033h0002).
Conflict of Interest Statement
KO was employed by company Niitaka Co., Ltd.
The remaining authors declare that the research was conducted in the absence of any commercial or financial relationships that could be construed as a potential conflict of interest.
Acknowledgments
We thank Dr. Kiyotaka Fujita for suggestions and discussions. We also thank to Yusuke Ida and Yurina Toda for their skillful support.
Supplementary Material
The Supplementary Material for this article can be found online at: https://www.frontiersin.org/articles/10.3389/fmicb.2018.03070/full#supplementary-material
Footnotes
- ^ http://www.ncbi.nlm.nih.gov/genbank
- ^ http://tree.bio.ed.ac.uk/software/tracer/
- ^ http://tree.bio.ed.ac.uk/software/figtree/
References
Baele, G., Lemey, P., Bedford, T., Rambaut, A., Suchard, M. A., and Alekseyenko, A. V. (2012). Improving the accuracy of demographic and molecular clock model comparison while accommodating phylogenetic uncertainty. Mol. Biol. Evol. 29, 2157–2167. doi: 10.1093/molbev/mss084
Bidalot, M., Théry, L., Kaplon, J., De Rougemont, A., and Ambert-Balay, K. (2017). Emergence of new recombinant noroviruses GII.p16-GII.4 and GII.p16-GII.2 France, winter 2016 to 2017. Euro Surveill. 22:30508. doi: 10.2807/1560-7917.ES.2017.22.15.30508
Bok, K., Abente, E. J., Realpe-Quintero, M., Mitra, T., Sosnovtsev, S. V., Kapikian, A. Z., et al. (2009). Evolutionary dynamics of GII.4 noroviruses over a 34-year period. J. Virol. 83, 11890–11901. doi: 10.1128/JVI.00864-09
Boon, D., Mahar, J. E., Abente, E. J., Kirkwood, C. D., Purcell, R. H., Kapikian, A. Z., et al. (2011). Comparative evolution of GII.3 and GII.4 norovirus over a 31-year period. J. Virol. 85, 8656–8666. doi: 10.1128/JVI.00472-11
Bouckaert, R., Heled, J., Kühnert, D., Vaughan, T., Wu, C. H., Xie, D., et al. (2014). BEAST 2: a software platform for Bayesian evolutionary analysis. PLoS Comput. Biol. 10:e1003537. doi: 10.1371/journal.pcbi.1003537
Bull, R. A., Eden, J. S., Rawlinson, W. D., and White, P. A. (2010). Rapid evolution of pandemic noroviruses of the GII.4 lineage. PLoS Pathog. 6:e1000831. doi: 10.1371/journal.ppat.1000831
Bull, R. A., Hansman, G. S., Clancy, L. E., Tanaka, M. M., Rawlinson, W. D., and White, P. A. (2005). Norovirus recombination in ORF1/ORF2 overlap. Emerg. Infect. Dis. 11, 1079–1085. doi: 10.3201/eid1107.041273
Bull, R. A., Tanaka, M. M., and White, P. A. (2007). Norovirus recombination. J. Gen. Virol. 88, 3347–3359. doi: 10.1099/vir.0.83321-0
Chen, S. Y., Feng, Y., Chao, H. C., Lai, M. W., Huang, W. L., Lin, C. Y., et al. (2015). Emergence in Taiwan of novel norovirus GII.4 variants causing acute gastroenteritis and intestinal haemorrhage in children. J. Med. Microbiol. 64, 544–550. doi: 10.1099/jmm.0.000046
Chhabra, P., Aswath, K., Collins, N., Ahmed, T., Olórtequi, M. P., Kosek, M., et al. (2018). Near-complete genome sequences of several new norovirus genogroup II genotypes. Genome Announc. 6:e00007-18. doi: 10.1128/genomeA.00007-18
Darriba, D., Taboada, G. L., Doallo, R., and Posada, D. (2012). jModelTest 2: more models, new heuristics and parallel computing. Nat. Methods 9:772. doi: 10.1038/nmeth.2109
Delport, W., Poon, A. F., Frost, S. D., and Kosakovsky Pond, S. L. (2010). Datamonkey 2010: a suite of phylogenetic analysis tools for evolutionary biology. Bioinformatics 26, 2455–2457. doi: 10.1093/bioinformatics/btq429
Domingo, E. (2006). “Virus evolution,” in Fields Virology, 5th Edn, eds D. M. Knipe, P. M. Howley, and P. A. Philadelphia (New York, NY: Lippincott Williams & Wilkins), 389–421.
Drummond, A. J., and Rambaut, A. (2007). BEAST: bayesian evolutionary analysis by sampling trees. BMC Evol. Biol. 7:214. doi: 10.1186/1471-2148-7-214
Fourment, M., and Gibbs, M. J. (2006). PATRISTIC: a program for calculating patristic distances and graphically comparing the components of genetic change. BMC Evol. Biol. 6:1. doi: 10.1186/1471-2148-6-1
Green, K. Y. (2013). “Caliciviridae: the noroviruses,” in Fields Virology, 6th Edn, eds D. M. Knipe and P. M. Howley (Philadelphia, PA: Wolters Kluwer Health/Lippincott Williams & Silkins), 582–608.
Guex, N., and Peitsch, M. C. (1997). SWISS-MODEL and the Swiss-PdbViewer: an environment for comparative protein modeling. Electrophoresis 18, 2714–2723. doi: 10.1002/elps.1150181505
Guindon, S., and Gascuel, O. (2003). A simple, fast and accurate method to estimate large phylogenies by maximum likelihood. Syst. Biol. 52, 696–704. doi: 10.1080/10635150390235520
Hardstaff, J. L., Clough, H. E., Lutje, V., McIntyre, K. M., Harris, J. P., Garner, P., et al. (2018). Foodborne and food-handler norovirus outbreaks: a systematic review. Foodborne Pathog. Dis. doi: 10.1089/fpd.2018.2452 [Epub ahead of print].
Hernandez, J. M., Silva, L. D., Junior, E. C. S., Bandeira, R. S., Rodrigues, E. A. M., Lucena, M. S. S., et al. (2018). Molecular epidemiology and temporal evolution of norovirus associated with acute gastroenteritis in Amazonas state, Brazil. BMC Infect. Dis. 18:147. doi: 10.1186/s12879-018-3068-y
Kanda, Y. (2013). Investigation of the freely available easy-to-use software ‘EZR’ for medical statistics. Bone Marrow Transplant. 48, 452–458. doi: 10.1038/bmt.2012.244
Katoh, K., Asimenos, G., and Toh, H. (2009). Multiple alignment of DNA sequences with MAFFT. Methods Mol. Biol. 537, 39–64. doi: 10.1007/978-1-59745-251-9-3
Katoh, K., and Standley, D. M. (2013). MAFFT multiple sequence alignment software version 7: improvements in performance and usability. Mol. Biol. Evol. 30, 772–780. doi: 10.1093/molbev/mst010
Kimura, H., Saitoh, M., Kobayashi, M., Ishii, H., Saraya, T., Kurai, D., et al. (2015). Molecular evolution of haemagglutinin (H) gene in measles virus. Sci. Rep. 5:11648. doi: 10.1038/srep11648
Kobayashi, M., Matsushima, Y., Motoya, T., Sakon, N., Shigemoto, N., Okamoto-Nakagawa, R., et al. (2016). Molecular ecolution of the capsid gene in human norovirus genogroupII. Sci. Rep. 6:29400. doi: 10.1038/srep29400
Kobayashi, M., Yoshizumi, S., Kogawa, S., Takahashi, T., Ueki, Y., Shinohara, M., et al. (2015). Molecular evolution of the capsid gene in norovirus genogroup I. Sci. Rep. 5:13806. doi: 10.1038/srep13806
Kroneman, A., Vennema, H., Deforche, K., van der Avoort, H., Peñaranda, S., Oberste, M. S., et al. (2011). An automated genotyping tool for enteroviruses and noroviruses. J. Clin. Virol. 51, 121–125. doi: 10.1016/j.jcv.2011.03.006
Kumar, S., Stecher, G., and Tamura, K. (2016). MEGA7: molecular evolutionary genetics analysis version 7.0 for bigger datasets. Mol. Biol. Evol. 33, 1870–1874. doi: 10.1093/molbev/msw054
Kumazaki, M., and Usuku, S. (2015). Genetic analysis of norovirus GII.4 variant strains detected in outbreaks of gastroenteritis in Yokohama, Japan, from the 2006-2007 to the 2013-2014 Seasons. PLoS One 10:e0142568. doi: 10.1371/journal.pone.0142568
Le Guyader, F. S., Le Saux, J. C., Ambert-Balay, K., Krol, J., Serais, O., Parnaudeau, S., et al. (2008). Aichi virus, norovirus, astrovirus, enterovirus, and rotavirus involved in clinical cases from a French oyster-related gastroenteritis outbreak. J. Clin. Microbiol. 46, 4011–4017. doi: 10.1128/JCM.01044-08
Lovell, S. C., Davis, I. W., Arendall, W. B. III, de Bakker, P. I., Word, J. M., Prisant, M. G., et al. (2003). Structure validation by Calpha geometry: phi,psi and Cbeta deviation. Proteins 50, 437–450. doi: 10.1002/prot.10286
Lu, J., Fang, L., Sun, L., Zeng, H., Li, Y., Zheng, H., et al. (2017). Association of GII.P16-GII.2 recombinant norovirus strain with increased norovirus outbreaks, Guangdong, China, 2016. Emerg. Infect. Dis. 23, 1188–1190. doi: 10.3201/eid2307.170333
Mahar, J. E., Bok, K., Green, K. Y., and Kirkwood, C. D. (2013). The importance of intergenic recombination in norovirus GII.3 evolution. J. Virol. 87, 3687–3698. doi: 10.1128/JVI.03056-12
Martin, D. P., Murrell, B., Golden, M., Khoosal, A., and Muhire, B. (2015). RDP4: detection and analysis of recombination patterns in virus genomes. Virus Evol. 1:vev003. doi: 10.1093/ve/vev003
Matsushima, Y., Ishikawa, M., Shimizu, T., Komane, A., Kasuo, S., Shinohara, M., et al. (2015). Genetic analyses of GII.17 norovirus strains in diarrheal disease outbreaks from December 2014 to March 2015 in Japan reveal a novel polymerase sequence and amino acid substitutions in the capsid region. Euro Surveill. 20:21173. doi: 10.2807/1560-7917.ES2015.20.26.21173
Mizukoshi, F., Nagasawa, K., Doan, Y. H., Haga, K., Yoshizumi, S., Ueki, Y., et al. (2017). Molecular evolution of the RNA-dependent RNA polymerase and capsid genes of human norovirus genotype GII.2 in Japan during 2004-2015. Front. Microbiol. 8:705. doi: 10.3389/fmicb.2017.00705
Motomura, K., Oka, T., Yokoyama, M., Nakamura, H., Mori, H., Ode, H., et al. (2008). Identification of monomorphic and divergent haplotypes in the 2006-2007 norovirus GII/4 epidemic population by genome wide tracing of evolutionary history. J. Virol. 82, 11247–11262. doi: 10.1128/JVI.00897-08
Motoya, T., Nagasawa, K., Matsushima, Y., Nagata, N., Ryo, A., Sekizuka, T., et al. (2017). Molecular evolution of the VP1 gene in human norovirus GII.4 variants in 1974-2015. Front. Microbiol. 8:2399. doi: 10.3389/fmicb.2017.02399
Nagasawa, K., Matsushima, Y., Motoya, T., Mizukoshi, F., Ueki, Y., Sakon, N., et al. (2018a). Genetic analysis of human norovirus strains in Japan in 2016-2017. Front. Microbiol. 9:1. doi: 10.3389/fmicb.2018.00001
Nagasawa, K., Matsushima, Y., Motoya, T., Mizukoshi, F., Ueki, Y., Sakon, N., et al. (2018b). Phylogeny and immunoreactivity of norovirus GII.P16-GII.2, Japan, Winter 2016-17. Emerg. Infect. Dis. 24, 144–148. doi: 10.3201/eid2401.170284
Niendorf, S., Jacobsen, S., Faber, M., Eis-Hübinger, A. M., Hofmann, J., Zimmermann, O., et al. (2017). Steep rise in norovirus cases and emergence of a new recombinant strain GII.P16-GII.2 Germany, winter 2016. Euro Surveill. 22:30447. doi: 10.2807/1560-7917.ES.2017.22.4.30447
Okada, M., Tanaka, T., Oseto, M., Takeda, N., and Shinozaki, K. (2006). Genetic analysis of noroviruses associated with fatalities in healthcare facilities. Arch. Virol. 15, 1635–1641. doi: 10.1007/s00705-006-0739-6
Pettersen, E. F., Goddard, T. D., Huang, C. C., Couch, G. S., Greenblatt, D. M., Meng, E. C., et al. (2004). UCSF Chimera–a visualization system for exploratory research and analysis. J. Comput. Chem. 25, 1605–1612. doi: 10.1002/jcc.20084
Pond, S. L., and Frost, S. D. (2005). Datamonkey: rapid detection of selective pressure on individual sites of codon alignments. Bioinformatics 21, 2531–2533. doi: 10.1093/bioinformatics/bti320
Qiao, N., Wang, X. Y., and Liu, L. (2016). Temporal evolutionary dynamics of norovirus GII.4 variants in China between 2004 and 2015. PLoS One 11:e0163166. doi: 10.1371/journal.pone.0163166
Räsänen, S., Lappalainen, S., Kaikkonen, S., Hämäläinen, M., Salminen, M., and Vesikari, T. (2010). Mixed viral infections causing acute gastroenteritis in children in a waterborne outbreak. Epidemiol. Infect. 138, 1227–1234. doi: 10.1017/S0950268809991671
Robilotti, E., Deresinski, S., and Pinsky, B. A. (2015). Norovirus. Clin. Microbiol. Rev. 28, 134–164. doi: 10.1128/CMR.00075-14
Sang, S., and Yang, X. (2018). Evolutionary dynamics of GII.17 norovirus. PeerJ 6:e4333. doi: 10.7717/peerj.4333
Siebenga, J. J., Lemey, P., Kosakovsky Pond, S. L., Rambaut, A., Vennema, H., and Koopmans, M. (2010). Phylodynamic reconstruction reveals norovirus GII.4 epidemic expansions and their molecular determinants. PLoS Pathog. 6:e1000884. doi: 10.1371/journal.ppat.1000884
Sievers, F., Wilm, A., Dineen, D., Gibson, T. J., Karplus, K., Li, W., et al. (2011). Fast, scalable generation of high-quality protein multiple sequence alignments using Clustal Omega. Mol. Syst. Biol. 7:539. doi: 10.1038/msb.2011.75
Standley, D. M., Toh, H., and Nakamura, H. (2007). ASH structure alignment package: sensitivity and selectivity in domain classification. BMC Bioinformatics 8:116. doi: 10.1186/1471-2105-8-116
Takahashi, M., Nagasawa, K., Saito, K., Maisawa, S. I., Fujita, K., Murakami, K., et al. (2018). Detailed genetic analyses of the HN gene in human respirovirus 3 detected in children with acute respiratory illness in the Iwate Prefecture, Japan. Infect. Genet. Evol. 59, 155–162. doi: 10.1016/j.meegid.2018.01.021
van Gunsteren, W. F., Billeter, S. R., Eising, A. A., Hünenberger, P. H., Krüger, P., Mark, A. E., et al. (1996). Biomolecular Simulation: The GROMOS96 Manual and User Guide. Zürich: Biomos.
Vinjé, J. (2015). Advances in laboratory methods for detection and typing of norovirus. J. Clin. Microbiol. 53, 373–381. doi: 10.1128/JCM.01535-14
Webb, B., and Sali, A. (2014). Protein structure modeling with MODELLER. Methods Mol. Biol. 1137, 1–15. doi: 10.1007/978-1-4939-0366-5_1
Keywords: molecular evolution, norovirus, GII, bioinformatics, RNA-dependent RNA polymerase, negative selection
Citation: Ozaki K, Matsushima Y, Nagasawa K, Motoya T, Ryo A, Kuroda M, Katayama K and Kimura H (2018) Molecular Evolutionary Analyses of the RNA-Dependent RNA Polymerase Region in Norovirus Genogroup II. Front. Microbiol. 9:3070. doi: 10.3389/fmicb.2018.03070
Received: 19 September 2018; Accepted: 28 November 2018;
Published: 18 December 2018.
Edited by:
Stefan Taube, Universität zu Lübeck, GermanyReviewed by:
Matthew D. Moore, University of Massachusetts Amherst, United StatesAnnelies Kroneman, National Institute for Public Health and the Environment, Netherlands
Copyright © 2018 Ozaki, Matsushima, Nagasawa, Motoya, Ryo, Kuroda, Katayama and Kimura. This is an open-access article distributed under the terms of the Creative Commons Attribution License (CC BY). The use, distribution or reproduction in other forums is permitted, provided the original author(s) and the copyright owner(s) are credited and that the original publication in this journal is cited, in accordance with accepted academic practice. No use, distribution or reproduction is permitted which does not comply with these terms.
*Correspondence: Kazuhiko Katayama, a2F0YXlhbWFAbGlzY2kua2l0YXNhdG8tdS5hYy5qcA== Hirokazu Kimura, aC1raW11cmFAcGF6LmFjLmpw