 Sergio A. Mojica1†
 Mikael Elofsson
 Åsa Gylfe
- 1Department of Clinical Microbiology, Umeå University, Umeå, Sweden
- 2Chemical Biology Consortium Sweden, Laboratories of Chemical Biology, Umeå University, Umeå, Sweden
- 3Griffith Institute for Drug Discovery, Griffith University, Brisbane, QLD, Australia
- 4Department of Molecular Biology, Umeå University, Umeå, Sweden
- 5Department of Chemistry, Umeå University, Umeå, Sweden
- 6Molecular Infection Medicine Sweden, Umeå University, Umeå, Sweden
- 7Umeå Centre for Microbial Research, Umeå University, Umeå, Sweden
In this study, we describe the application of a transformed Chlamydia trachomatis strain constitutively expressing the red fluorescent protein mCherry, to allow real-time monitoring of the infection cycle and screening for agents that block replication of C. trachomatis. The red fluorescent C. trachomatis strain was detected autonomously without antibody staining and was equally susceptible to doxycycline as the wild type strain. A high-throughput screening assay was developed using the transformed strain and automated fluorescence microscopy. The assay was used in a pilot screen of a 349 compound library containing natural products from Australian flora and fauna. Compounds with anti-chlamydial activity were tested for dose response and toxicity to host cells and two non-toxic compounds had 50% effective concentration (EC50) values in the low micromolar range. Natural products are valuable sources for drug discovery and the identified Chlamydia growth inhibition may be starting points for future drug development. Live cell imaging was used to visualize growth of the red fluorescent C. trachomatis strain over time. The screening assay reduced workload and reagents compared to an assay requiring immunostaining and could further be used to monitor the development of Chlamydia inclusions and anti-chlamydial effect in real time.
Introduction
Chlamydia trachomatis is a major human pathogen causing sexually transmitted infections, infertility, trachoma, and blindness globally (Batteiger, 2012). According to the World Health Organization (WHO), 85 million people received antibiotics for trachoma, a blinding eye infection occurring in 42 countries (WHO, 2018), and there are more than 100 million annual cases of sexually transmitted C. trachomatis worldwide (Newman et al., 2015). Treatment options for infections with these obligate intracellular bacteria are limited and a single dose of azithromycin is the most common treatment worldwide. This regimen has selected for macrolide resistance in other human pathogenic bacteria (Ison, 2012; Bojang et al., 2017) and a more selective treatment would therefore be preferable. C. trachomatis readily develop resistance to antibiotics in vitro (Hammerschlag and Kohlhoff, 2012) and novel anti-chlamydial agents may become necessary for treatment of these infections in the future.
Chlamydia spp. replicate inside a specialized membrane-bound vacuole, the Chlamydia inclusion, and undergo a unique developmental cycle transitioning between two distinct bacterial forms; the elementary body (EB) is spore-like, infectious but metabolically limited, whereas the reticulate body (RB) is non-infectious but metabolically active. Chlamydia are protected by multiple lipid membrane barriers that reduce access for small molecules. Therefore, a whole cell screening assay for identification of novel anti-chlamydial agents is key to assure that active compounds reach the intracellular target and act in an intracellular infection. Several classes of antibacterial compounds that inhibit Chlamydia have been identified by screening using cell-based infection assays (Muschiol et al., 2006; Bailey et al., 2007; Dahlgren et al., 2010; Enquist et al., 2012; Hanski et al., 2014; Marwaha et al., 2014; Hakala et al., 2015; Sunduru et al., 2015; Good et al., 2016, 2017). The strict intracellular lifestyle of Chlamydia makes genetic manipulations challenging and genetically modified strains have, to the best of our knowledge not been used for small molecule screening in Chlamydia. Recent advances in genomics and Chlamydia genetics via novel transformation and genetic manipulation methods make this bacterium primed for further investigation (Wang et al., 2011; Bauler and Hackstadt, 2014). Screening for new anti-chlamydial drugs or tool compounds to study the infection is a tedious work involving multiple steps using toxic fixatives and multistep immunostaining. Since, the first fluorescent protein, green fluorescent protein (GFP) was cloned, numerous cells expressing fluorophore-coupled proteins have been described (Rodriguez et al., 2017). This has revolutionized live cell and animal imaging and simplified the study of intracellular processes. The development of truncated versions of GFP emitting at longer wavelengths, as well as the discovery of additional non-toxic fluorescent-proteins like the red fluorescent mCherry further improved the possibilities to study live cells (Shu et al., 2006).
Natural products have been used in both traditional medicine and modern drug discovery and have resulted in the development of numerous important clinical drugs (Li and Vederas, 2009). Due to the high levels of biodiversity found in both the terrestrial and marine ecosystems of Australia the use of this country's flora and fauna for both drug discovery and chemical biology has a strategic advantage, since this unique and chemically diverse resource has only been superficially explored for new pharmaceutical agents and chemical probes.
In this study, we describe the application of a transformed C. trachomatis strain constitutively expressing mCherry to an anti-chlamydial screen and demonstrate proof of concept with a 349 Australian natural compound library.
Materials and Methods
Organisms and Cell Lines
HeLa 229 cells (CCL-2.1; ATCC, Manassas, VA, USA) and Vero cells (CCL-81; ATCC, Manassas, VA, USA) were propagated in T75 flasks at 37°C with 5% CO2 in Roswell Park Memorial Institute 1640 (RPMI 640) medium or Dulbecco's Modified Eagle's medium (DMEM), respectively, supplemented with 10% Fetal Bovine Serum (FBS), 2 mM L-glutamine and 5 μg/ml gentamicin. C. trachomatis serovar L2 454/Bu (ATCC, Manassas, VA, USA) was propagated in HeLa cells and elementary bodies were purified as previously described (Caldwell et al., 1981) and stored in SPG buffer (0.25 M sucrose, 10 mM sodium phosphate, 5 mM L-glutamic acid) at −80°C.
Chlamydia Transformation
The plasmid pBOMB4R-MCI designed for expression of the red fluorescent protein mCherry in Chlamydia was a generous gift from Ted Hackstadt (Laboratory of Intracellular Parasites, Hamilton, MT, USA) (Bauler and Hackstadt, 2014). C. trachomatis L2 454/Bu was transformed as previously described by Ian Clarke with modifications (Wang et al., 2011; Bauler and Hackstadt, 2014). 8 × 10⁶ inclusion forming units (IFUs) of C. trachomatis EBs were incubated with 5 μg of plasmid DNA in 200 μL of CaCl2 buffer (10 mM Tris pH 7.4, 50 mM CaCl2) at room temperature for 30 min. 1.5 × 10⁶ of trypsonized Vero cells were subsequently added to the same tube in 200 μL of CaCl buffer and incubated for 20 additional min with occasional mixing. The entire mixture was added to one well of a 6-well plate along with 2 ml of DMEM. The cells were allowed to settle for 1 h, and then the plate was spun at 750 g for 30 min to help initiate infection. Penicillin G (1 unit/ml) was added directly to the culture medium 18 h post infection (hpi). After 48 h, the cells were harvested by the removal of culture medium followed by the addition of 500 ml of dH2O for 10–15 min to lyse the cells. The lysate was carefully collected and spun at 1,000 rpm for 5 min, then 500 μL of the supernatant was added to a fresh layer of Vero cells and spun at 750 g for 30 min to help initiate a new round of infection. The media was then replaced with fresh DMEM containing 1 unit/ml penicillin G. Inclusions expressing mCherry appeared in passages 2–5 with 1 unit/ml penicillin G and were plaque purified into clones. Briefly, harvested bacteria were diluted in Hank's balanced salt solution (HBSS) and used to infect Vero cells in 6-well plates. After the infection, the inoculum was removed and the cells were overlaid with 0.54% agarose in DMEM supplemented with 10% FBS, 1 X non-essential amino acids, 10 μg/ml gentamicin, and 0.2 μg/ml cyclohexamide and incubated at 37°C with 5% CO2 for 10–14 days until plaques had formed. Plaques were harvested using a sterile 1 ml pipet tip, transferred to HBSS and used to infect fresh monolayers of HeLa cells in 24-well plates. One of the mCherry clones with good growth was amplified in HeLa cells, purified and stored as described above.
Detection of mCherry Expressing Chlamydia
HeLa 299 cells, cultured to 70% confluence were harvested and seeded into 96-well plates (clear, flat, Nunclon Delta coated, Nunc, Thermo Fischer Scientific, Waltham, MA, USA) at a density of 10,000 per well in culture media (DMEM or RPMI 1640 supplemented with 10% FBS, 2 mM L-glutamine and 50 μg/ml gentamicin). After overnight incubation in 37°C with 5% CO2, adherent cells were infected with 30 μl mCherry expressing Chlamydia per well in HBSS with a multiplicity of infection (MOI) of 0.6. Chlamydia were incubated with the cells for 1 h at 37°C with 5% CO2 after which HBSS was removed and replaced with 100 μl culture media. DNA of host cell nuclei and Chlamydia inclusions were visualized by addition of 10 μl 10 μg/ml Hoechst 20 min prior to imaging. Live images were acquired 48 hpi in an automated HCS microscope (ArrayScan VTI, Thermo Fischer Scientific) using the 10x objective, excitation 549/15 nm for mCherry and excitation 386/23 nm for Hoechst. The number of large Chlamydia inclusions was enumerated using the built in software. An inclusion size cutoff was determined based on the 48 hpi Chlamydia inclusions to include normally developed Chlamydia inclusions and exclude fluorescent artifacts from the analyses. The cutoff also excluded small underdeveloped inclusions. To determine if detection of mCherry correlated with detection of immunostaining, cells were fixed and immunostained (Marwaha et al., 2014) after live cell acquisition. In brief, cells were fixed in 150 μl methanol per well for 10 min, blocked in phosphate buffered saline (PBS) supplemented with 1% bovine serum albumin (BSA) and 0.25% Tween-20, and stained with an in-house generated polyclonal rabbit anti-chlamydial serum (Marwaha et al., 2014) diluted 1:1,000 in blocking buffer. Finally, inclusions were visualized with a secondary donkey anti-rabbit fluorescein isothiocyanate (FITC) labeled antibody (Jackson ImmunoResearch, West Grove, PA, USA) and cell nuclei were visualized by 1 μg/ml Hoechst staining. Images were obtained using ArrayScan with the 10x objective, excitation 485/20 nm and excitation 386/23 nm for Hoechst. Large Chlamydia inclusions were enumerated as described for mCherry. To evaluate whether the mCherry expressing strain was as susceptible to doxycycline as the wild type strain (wt), we determined 50% effective concentrations (EC50) values for doxycycline in both strains. Serial 1:2 dilutions of doxycycline in 100 μl culture medium (400 nM to 6 nM doxycycline) were added to HeLa cells infected with either Chlamydia strain 1 hpi. After 48 h, live images were acquired from the mCherry while the wild type (wt) strain was immunostained as described above. Large inclusions were counted by Arrayscan and EC50 values determined using GraphPad Prism v.5 (GraphPad software, La Jolla, CA, USA) with non-linear regression.
The timepoint when mCherry expressing Chlamydia inclusions were detectable by Arrayscan was monitored using live infection time-lapse microscopy with micrographs every hour from 10 to 24 hpi using bright-field for autofocusing with the 10x objective. Chlamydia infection was cultured in phenol red free DMEM in live cell chamber at 37°C with 5% CO2, but otherwise performed as described above.
Compound Library
The Davis open access natural product-based library (Zulfiqar et al., 2017) was used for the screening. Most of the 349 compounds have been isolated from Australian natural sources, and this library also contain semi-synthetic natural product analogs, as well as known commercial drugs or synthetic compounds inspired by natural products. The natural product isolation or semi-synthetic procedures for the majority of compounds in this unique library have been previously published (Davis, 2005; Barnes et al., 2010; Choomuenwai et al., 2012; Levrier et al., 2013). All compounds were >95% pure when submitted for storage. The 349 distinct compounds used in this study were dispensed as 5 mM and 2 mM dimethylsulfoxide (DMSO) solutions into 384-well polypropylene (PP) microtiter plates (Costar, New York, USA). Plates were heat sealed after dispensing and stored at −20°C.
Screen
A general and more detailed protocol for the screening assay is provided in (Supplementary Data Sheet 1) and an overview of the screening method is given in Figure 3. Since inhalation of C. trachomatis aerosols can cause laboratory acquired infections (Sewell, 1995), all procedures involving handling of live infection in open plates were performed manually inside a class II safety cabinet using 8-channel electronic pipets (Rainin E4 XLS, Mettler Toledo, Barcelona, Spain) and an enclosed aspiration system (Intergra VacuSafe, Zizers, Switzerland). The supplementary protocol includes suggestions for optimization of the assay for automation and screening of larger compound libraries.
Prior to screen, the MOI was optimized by infecting HeLa cells with serial dilutions of the mCherry strain from MOI 7.5 to 0.056 in triplicate wells in 96-well plates as described in section Detection of mCherry Expressing Chlamydia. DMSO tolerance of the HeLa cells was determined by incubating 10,000 HeLa cells per well with 5, 4, 3, 2, 1, 0.5, and 0% DMSO in triplicate wells for 48 h in 37°C with 5% CO2. HeLa cell viability was measured by resazurin reduction using Presto-Blue (Thermofisher Scientific) according to the manufacturer's description. Fluorescence was measured in Synergy H1 plate reader (Biotek Instruments, Winooski, VT, USA) using 535/590 nm.
The primary screen of the 349 open access compound library was performed using the mCherry expressing C. trachomatis serovar L2 454/Bu in clear, flat 96-well plates (Nunc, Delta surface, Thermo Fischer Scientific). The primary screen was done in duplicates in separated plates; one plate was used for mCherry imaging and the other for FITC immunostaining. Cells were seeded at a density of 10,000 cells per well in 100 μl DMEM media 1 day prior to infection in culture media. Chlamydia infection was performed in 30 μl HBSS as described above with a MOI of 0.6 during 1 h at 37°C, 5% CO2. Compounds were diluted to 10 μM in DMEM with a final DMSO concentration of 0.5% and 100 μl per well was added after aspiration of HBSS. The plates were incubated for an additional 47 h at 37°C, 5% CO2 prior to imaging. One of the duplicate plates was used for mCherry imaging and one for FITC immunostaining. For mCherry imaging, HeLa cell nuclei were first stained by addition of 10 μl 10 μg/μl Hoechst per well and incubated at 37°C with 5% CO2 for 20 min. The infected cells were fixed in 4% paraformaldehyde (PFA) for 15 min and washed in PBS before image acquisition. Although fixation was not necessary for the analysis, it inactivated the infectious Chlamydia and enabled later analysis after storage at 4°C. For FITC immunostaining, cells were fixed in 150 μl methanol per well for 10 min, blocked in 1% BSA, 0.25% Tween-20 in PBS and incubated with 1:1,000 polyclonal rabbit anti-chlamydial serum in blocking buffer (Marwaha et al., 2014). A FITC-conjugated donkey anti-rabbit antibody (Jackson ImmunoResearch) and 1 μg/ml Hoechst staining was used for staining followed by washing with blocking buffer. Images of nuclei (Hoechst-ex386/23 nm) and Chlamydia inclusions (FITC: ex485/20 nm; mCherry: ex549/15 nm) were acquired in the ArrayScan with the 10x objective and counted with the built in software. Chlamydia inclusions in DMSO control wells were used to determine an inclusion size cutoff to exclude small underdeveloped inclusions as well as fluorescent artifacts from the analyses. Compounds with >95% inhibition of number of inclusion compared to the DMSO control and a cell nuclei count exceeding 3,000 were selected for further evaluation.
XTT Reduction Assay
HeLa299 cells were inoculated into clear, flat 96-well plates (Nunc, Delta surface, Thermo Fischer Scientific) with a density of 7,000 cells per well and cultured overnight at 37°C with 5% CO2 in RPMI 640 supplemented with 10% FBS and 2 mM L-glutamine. The following day, the RPMI was replaced with DMEM without phenol red (Life Technologies, Carlsbad, CA, USA) containing 0.5% DMSO with or without test compounds at 25 and 50 μM concentrations incubated at 37°C with 5% CO2 for 48 h. At least three replicate wells for each compound concentration were tested. Wells without cells were used as blank controls. Following this incubation with compounds, cells were washed with DMEM to remove remaining colored compounds and fresh DMEM without phenol red was added before the XTT Cell Proliferation Assay kit was used according to the manufacturer's instructions (ATCC, Manassas, VA, USA). Briefly, activation reagent and XTT reagent were thawed at 37°C, then mixed in a 1:50 ratio with enough volume to add 50 μL to each well. The plates were placed in the 37°C incubator for 2.5 h. The absorbance of each well was then read at 475 nm and 660 nm with a Tecan Infinite m200 plate reader (Tecan, Männedorf, Switzerland). To analyze the data, the 660 nm reading was subtracted from the 475 nm reading to help eliminate non-specific readings from the assay results. Average blank control-well readings were subtracted from those containing cells. Final readings from wells containing compound were compared to DMSO control wells and expressed as percent of control.
EC50 Determination
HeLa cells were inoculated into 96-well plates (Nunc, Corning, New York, USA) with a density of 15,000 cells per well and cultured overnight at 37°C with 5% CO2 in RPMI 1640, supplemented with 10% FBS and 2 mM L-glutamine, and infected the following day with wt or mCherry C. trachomatis in HBSS. At 1 hpi, the inoculum was replaced with RPMI media containing 0.5% DMSO and serial 1:2 dilutions of the tested compounds. The infection was allowed to proceed for 44–48 h before fixation by aspiration of the media and adding methanol for 5 min. Chlamydia inclusions were immunostained as described above. The numbers of large inclusions were counted by the ArrayScan VTI HCS automated scanner. Inhibition of Chlamydia growth was evaluated as the number of inclusions in compound treated infections (evaluated in 12 fields per well, 20x objective) compared to the numbers of inclusions in DMSO treated control infections (% of control). EC50 values are representative of at least three independent experiments. The data analysis was performed using non-linear regression (curve fit) in GraphPad Prism v.5.
Live Real Time Imaging of C. trachomatis Infection With Compound 6
The anti-chlamydial effect over time of compound 6 (identified in the above screen) was visualized by a time-lapse experiment. HeLa cells were seeded at a concentration of 10,000 cells per well 1 day prior to infection. Chlamydia infection was performed as described above at MOI 0.6 with mCherry transformed C. trachomatis. Phenol red free DMEM culture media containing 6 or 3 μM 6 or 0.5% DMSO was added at 100 μl per well 1 hpi. Images were acquired with 1 h intervals with the 10x objective acquiring 4 fields per well during 48 h. The red channel was used for autofocusing and therefore imaging was initialized 24 hpi when the mCherry expressing inclusions were detectable, continuing to 72 hpi.
Results
The Red Fluorescent C. trachomatis Strain Can be Detected Autonomously Without Antibody Staining
To ensure automated detection of C. trachomatis inclusions by mCherry fluorescence alone is a feasible strategy, live images were acquired 48 hpi of HeLa cells infected with C. trachomatis transformed with pBOMB4R-MCI. After acquisition, the cells were fixed and immunostained with FITC-conjugated antibody and images of the same fields were acquired using the green channel. The mCherry and FITC signals overlapped exactly with negligible background (Figure 1A) when imaged using ArrayScan VTI HCS automated scanner. The automated scanner was also able to detect nearly exactly the same number of inclusions in the same wells from both mCherry and antibody staining (Figure 1B). The data from these quality control experiments demonstrate that mCherry signal alone adequately substitutes antibody staining for detection of Chlamydia inclusions. A time-lapse during the early development of Chlamydia showed that inclusions were detectable by mCherry after around 20 hpi (Supplementary Video 1). To verify that C. trachomatis transformed with pBOMB4-MCI is equally susceptible as the untransformed wt strain to benchmark antibiotics, we determined the EC50 of doxycycline against both the transformed and wt strain with similar results (Figure 1C). EC50 values with 95% confidence interval of wt and mCherry strains were 54.4 (18.7–158.0) and 32.8 (14.0–77.1), respectively, and thus, transformation with pBOMB4-MCI and expression of mCherry did not alter the susceptibility of Chlamydia to this antibiotic.
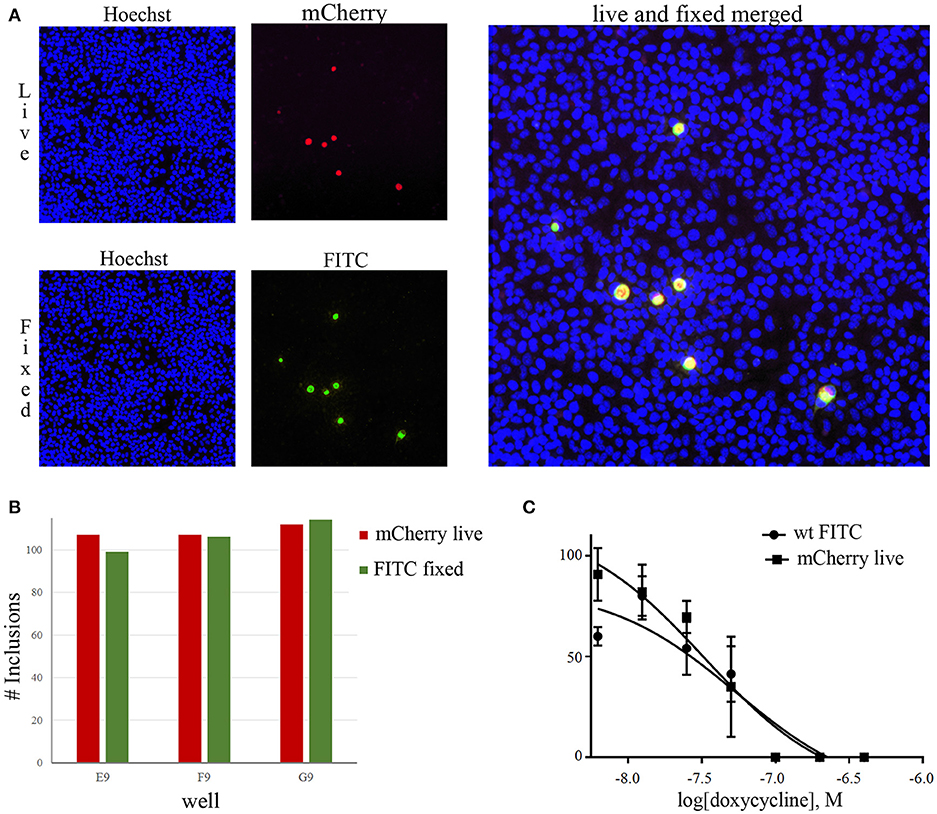
Figure 1. C. trachomatis expressing the red fluorescent protein mCherry can be detected without immunostaining. Images in (A) represents live infection imaging (upper) of Hoechst (blue) and mCherry (red). Lower panel images are acquired in the same field after immunostaining with FITC-labeled antibody. A merge of live and stained images is shown. Bars in (B) show the inclusion count obtained in in three individual wells from mCherry live imaging and FITC immunostained inclusions, respectively. (C) wt and mCherry expressing C. trachomatis are equally sensitive to doxycycline. Live imaging was used for mCherry expressing C. trachomatis inclusions while wt inclusions were visualized by FITC immunostaining.
Proof of Concept Screen of an Australian Natural Compound Library
As a proof of concept study with the transformed mCherry-expressing strain, we performed a screen of 349 compounds from the Davis open access Australian natural compound library (Zulfiqar et al., 2017). Assay optimization showed a linear increase of counted inclusions between MOI 0.1–1.0 with a probable overload at MOI 1 indicated as a loss of counted HeLa cell nuclei (Figure 2A). A MOI of 0.6 was chosen to obtain an adequate window for detecting C. trachomatis inhibitors within the linear increase of IFU with unaffected number of cells. Compounds were screened at a final concentration of 10 μM diluted from a 2 mM stock library with a final concentration of 0.5% DMSO which was well-tolerated by HeLa cells with no influence on their viability (Figure 2B). An incubation time of 48 h was chosen as the Chlamydia inclusions were large at the time point and easy to distinguish from possible artifacts (Figure 2C) by an inclusion size cut off.
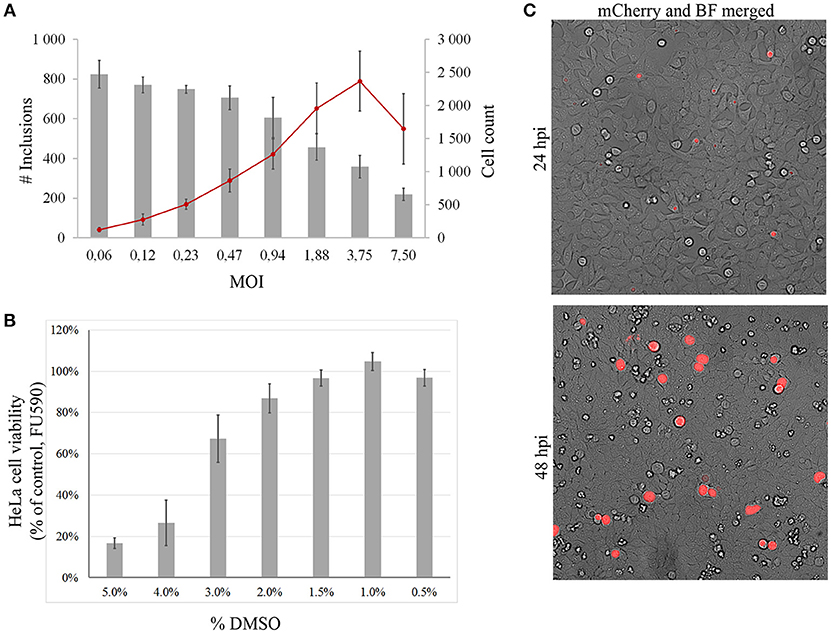
Figure 2. Assay optimization. (A) shows MOI titration with counted mCherry Chlamydia inclusions (red line, left y-axis) and counted HeLa cell nuclei (gray bars, right y-axis) at indicated MOI (x-axis). (B) DMSO tolerance of HeLa cells determined using a resazurin based cell viability assay quantified in fluorescence units at 590 nm (FU590). Bars represent % of control wells without DMSO. (C) The mCherry Chlamydia inclusions were big and easy to discriminate from artifacts at 48 hpi compared to small 24 hpi inclusions. Merged micrographs bright field (BF) and mCherry fluorescence.
The screening was performed in duplicate plates and Chlamydia inclusions were detected either by mCherry-expression or by FITC-conjugated immunostaining. mCherry as readout significantly reduced the number of steps needed to perform the screen (Figure 3). The number of Chlamydia inclusions in the DMSO control wells correlated well between mCherry and FITC, with mean number of inclusions and standard deviations of 722 ± 61 and 657 ± 72, respectively. Z' was 0.75 for mCherry imaging and 0.62 for FITC imaging. The HeLa cell count as detected by Hoechst nuclear staining also showed a good correlation in the duplicate screens as expected (data not shown) and was used to exclude potentially toxic compounds from further analysis. A cutoff of >95% inhibition compared the infection control with DMSO was the first hit selection. As shown in Figure 4A there was an almost perfect correlation between the different detection methods. However, two compounds, 2 and 3 were only identified as hit compounds using FITC-immunostaining. Among these, 2 had 66% inhibition using mCherry while 3 showed no inhibition of Chlamydia growth using mCherry detection. A visual inspection of the acquired images revealed that the HeLa cells were bright red fluorescent in the well containing compound 3 thus obscuring the reduction in number of Chlamydia inclusions. In the follow-up dose response, these compounds were found to have a deep red color and a bright red auto-fluorescence staining the HeLa cells resulting in miss-identified Chlamydia inclusions in the automatic analysis as shown for 3 in Figure 4. However, two other red colored compounds (1 and 4), were correctly identified as hits using mCherry detection in the screen, but unfortunately the red fluorescence could not be used to enumerate Chlamydia at higher concentrations for any of the four red hit compounds. Finally, eight hit compounds with >95% inhibition of Chlamydia growth and a cell count exceeding 3,000 cells per well were selected for further analyses. Two additional compounds, 5 and 10 were also included in the further tests since the tetrahydroanthraquinone 5 is the parental natural product of the semi-synthetic red hit compounds 2, 3, and 4 (Choomuenwai et al., 2012; Barnes et al., 2016) while 10, thiaplakortone A, is the parental natural product of the synthetic hit compounds 7, 8, and 9 (Schwartz et al., 2015). The selected compounds were evaluated for HeLa cell toxicity using the XTT reduction assay (Table 1). Of the eight hit compounds, only four compounds reduced cell viability < 69% at 25 μM compared to the DMSO control (Table 1). These four compounds were selected for evaluation with full EC50 determination with wt C. trachomatis (Figure 5A and Table 2). EC50 values were very similar when enumerating FITC stained mCherry and wt Chlamydia inclusions after treatment with the two most effective compounds, confirming that expression of mCherry did not alter response to antimicrobial compounds in Chlamydia (Figure 5 and Table 2).
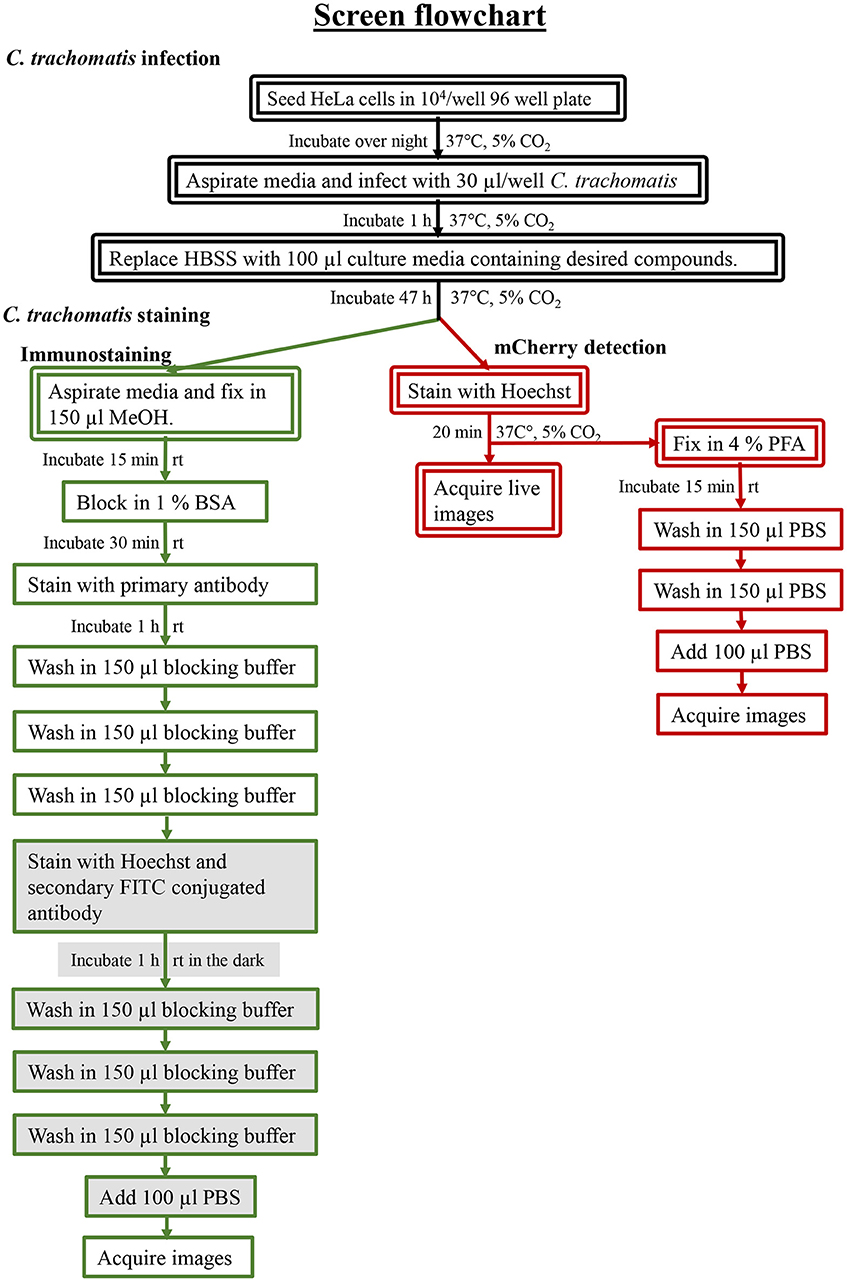
Figure 3. Screening workflow. The procedures are detailed in the Materials and Methods and a protocol is found in the Supplementary Material. Flowchart depict the different steps needed for the screening assay. Steps requiring safety cabinet are indicated with double lines. Steps used for mCherry imaging are highlighted in red and green lines indicate steps required for immunostaining with FITC. Filled textboxes indicate steps that needs to be performed in the dark.
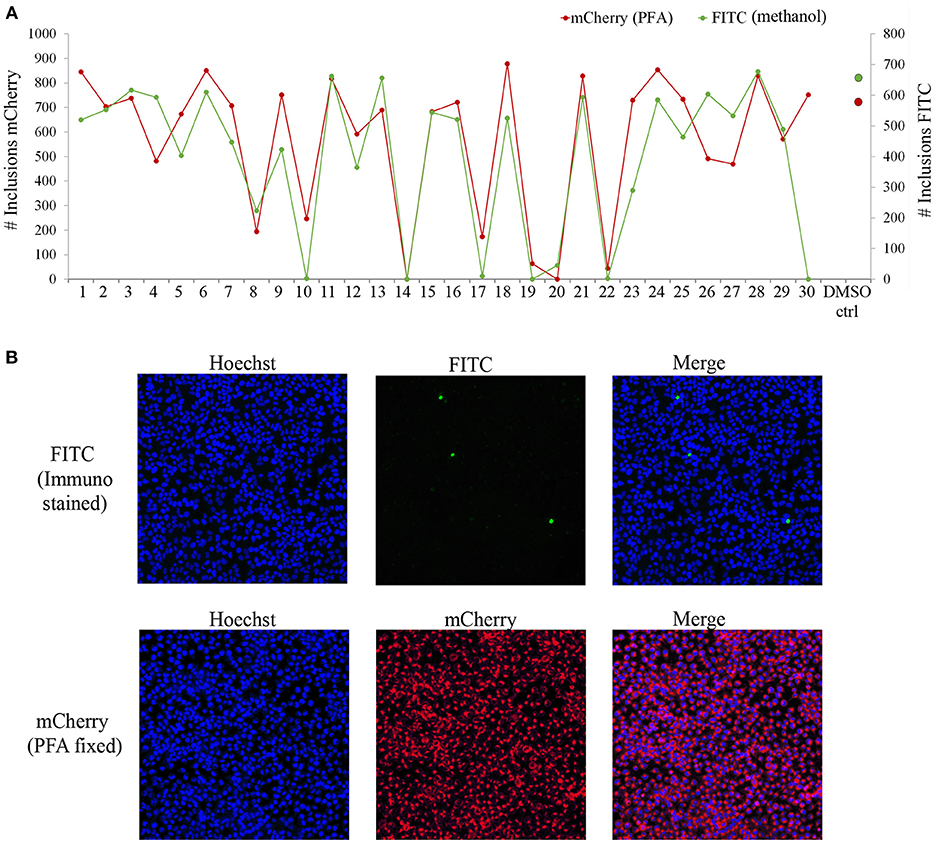
Figure 4. Screen data from 30 compounds. Plots in (A) show number of Chlamydia inclusions detected in the FITC-stained plate (green line) compared to those detected with mCherry (red line) for each compound in duplicate screen plates. Average inclusion counts obtained from DMSO control wells in FITC screen (green dot) and mCherry screen (red dot) are indicated. Images in (B) show one field in well 30 containing compound 3, FITC-labeled (top) and the mCherry (bottom). Note how the compound stains the HeLa cells red obscuring the reduction in number of Chlamydia inclusions by the compound.
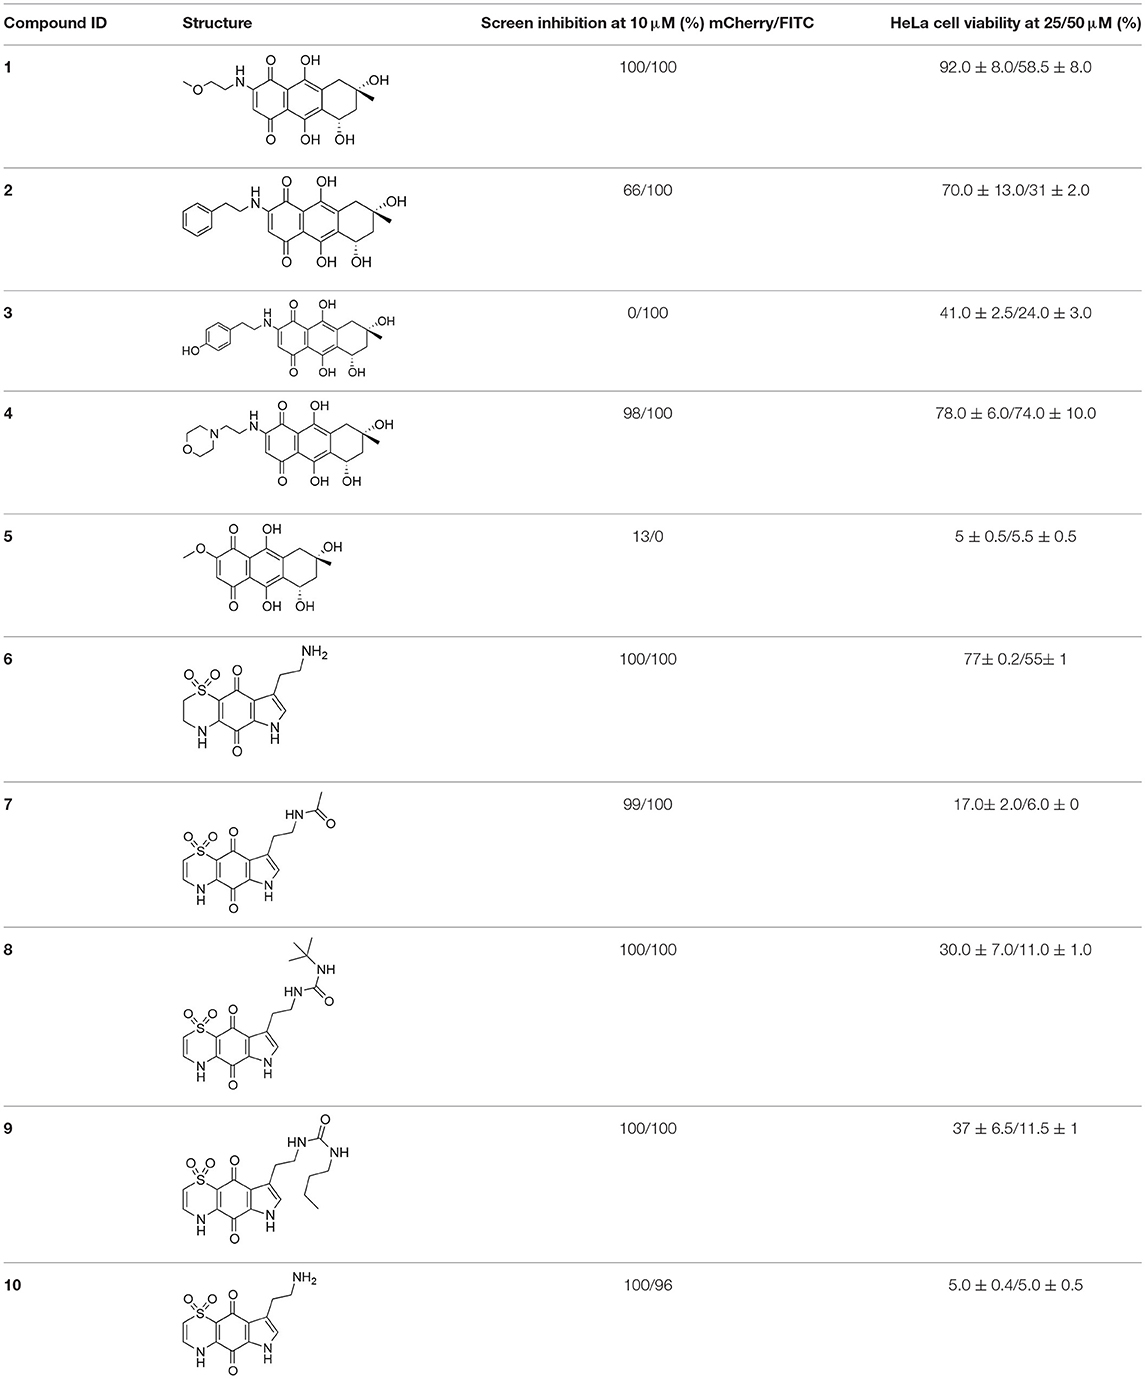
Table 1. Selected compound after screening and HeLa cell viability in the XTT reduction assay.
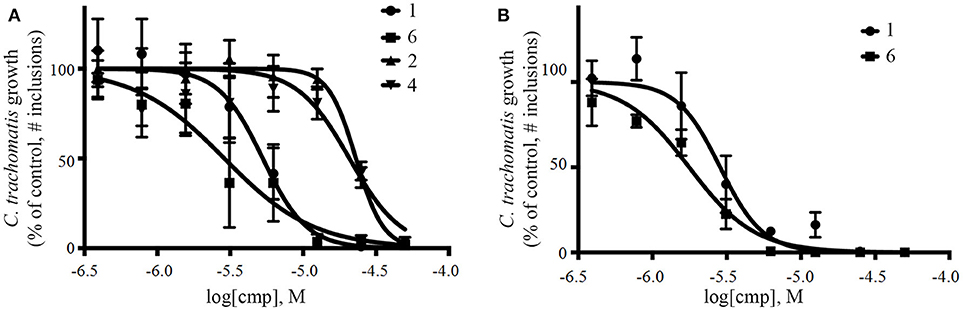
Figure 5. Dose-response curves of selected compounds against wt (A) and mCherry expressing (B) C. trachomatis. Both strains were visualized using FITC immunostaining. cmp, compound.
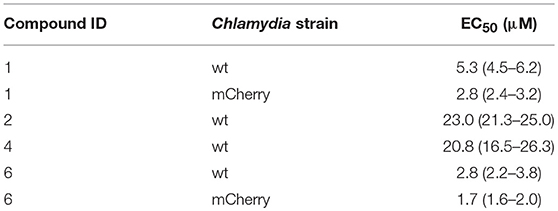
Table 2. EC50 values with 95% confidence values for selected compounds against wt and mCherry expressing C. trachomatis.
Live Cell Imaging of the Chlamydia Developmental Cycle
The red fluorescent strain was used to monitor the effect of the most effective compound 6 in real time over the infectious cycle. Using the live microscopy and incubator functions, images were obtained with the ArrayScan VTI HCS automated scan every hour between 24 and 72 hpi. The red fluorescent Chlamydia inclusions were not detectable at 6 μM 6 (data not shown) and grew at a slower pace with 3 μM 6 (Supplementary Video 2), compared to the DMSO control (Supplementary Video 3). The reduced inclusion size throughout the developmental cycle through to burst of inclusions suggest a continuous growth reduction in presence of 6.
Discussion
The technique to transform C. trachomatis with a modified plasmid has opened opportunities for different applications (Wang et al., 2011). We transformed C. trachomatis with a published plasmid (Bauler and Hackstadt, 2014) enabling expression of the red fluorescent protein mCherry. The transformed strain was applied to an assay detecting compounds that reduced the number of Chlamydia inclusions in cell culture by automated microscopy. This Chlamydia strain was equally susceptible to tested compounds compared to the wt strain demonstrating its usefulness in identifying novel inhibitory compounds. Hands on time was considerably reduced compared to visualization of Chlamydia inclusions by immunostaining that demands multiple steps of fixation, incubation with antibodies and wash steps while the red fluorescent strain could be visualized live without previous preparation. The screening protocol could be further automated given that the biosafety aspects are properly addressed for example by using liquid handling automation placed inside safety cabinets or closed systems. Screening using Chlamydia immunostaining protocols has been validated for different Chlamydia species (Osaka et al., 2012) and has identified different classes of anti-chlamydial compounds such as salicylacylidene acylhydrazides (Muschiol et al., 2006; Wolf et al., 2006; Ur-Rehman et al., 2012; Bao et al., 2014), 8-hydroxyquinoline based inhibitors (Enquist et al., 2012), N-acylated derivatives of sulfamethoxazole and sulfafurazole (Marwaha et al., 2014), salicylacylidene acylhydrazide sulfonamide hybrids (Sunduru et al., 2015), the Chlamydia protease inhibitor-peptide Boc-Val-Pro-ValP(OPh2) (JO146) (Gloeckl et al., 2013; Ong et al., 2015), the isoflavone biochanin A (Hanski et al., 2014), dibenzocyclooctadiene lignans (Hakala et al., 2015), 2-pyridones (Engström et al., 2014; Good et al., 2016, 2017) and 2,3-diarylbenzofuran and 2,3-dihydrobenzofuran based inhibitors (Saleeb et al., 2018). Screening protocols without immunostaining have also been developed previously, for example a protocol using a fluorescent lipid, 6{N-[(7-nitrobenzo-2-oxa-1,3-diazol-4-yl)-amino]caproylsphingosine}(WHO, 2018) (C6-NBD-ceramide) that is converted to fluorescent sphingomyelin and accumulates in Chlamydia inclusions (Sandoz et al., 2012). Another approach utilized resazurine reduction as readout based on that Chlamydia infected cells reduce resazurine less effectively compared to uninfected cells (Osaka and Hefty, 2013). While these assays have similar hands on time as the method we present, their respective read-out depends on host cellular functions while our method detected fluorescence directly produced by Chlamydia.
We screened a library of Australian natural compounds and identified the same hit compounds with mCherry as with immunostaining of Chlamydia, with two exceptions, 2 and 3. These compounds were only selected as hit compounds using the green fluorescent immunostaining of Chlamydia inclusions and not using the red fluorescence. It appeared that these compounds had red color and red auto-fluorescence mimicking the signal from healthy Chlamydia inclusions, thereby obscuring the reduction of Chlamydia inclusions. This was also true for 1 and 4 in concentrations above the screening concentration. Natural compounds may be autofluorescent in the whole fluorophore spectrum (Garcïa-Plazaola et al., 2015) and thus screening of natural compounds with a fluorescent based assay may result in either failure to detect active compounds or false positive hits. A green or yellow fluorophore may be as prone to this error as a red one and screening at lower concentrations and using a lower cutoff could reduce this problem.
Isolation, screening and biological profiling of Australian natural compounds that possess anti-parasitic activity was recently reported (Zulfiqar et al., 2017). Here we identified two classes of Australian natural compounds that inhibited growth of Chlamydia, tetrahydroanthraquinone and thiaplakortone compounds. The tetrahydroanthraquinone (1S,3S)-austrocortirubin (5) is a deep red colored fungal metabolite that has been previously isolated from the taxonomically related Australian mushrooms, Dermocybe splendida (Elsworth et al., 1999) and Cortinarius sp. (Choomuenwai et al., 2012). Compound 5 has antibacterial activity against Staphylococcus aureus with minimum inhibitory concentration (MIC) of 100 μM (Beattie et al., 2016), and antimalarial activity against Plasmodium falciparum parasites (IC50 = 1.9 μM). This compound also has toxic effects on mammalian cells (Choomuenwai et al., 2012) (Wang et al., 2015) and in this study 5 reduced HeLa cell viability by 95% at 25 μM. Despite the apparent cytotoxicity, 5 did not inhibit Chlamydia growth. However, semi-synthetic N-substituted tetrahydroanthraquinone analogs of 5 (Barnes et al., 2016) were hit compounds in our screen. While one compound, 3, was toxic, three analogs 1, 2, and 4 did not reduce cell viability below 70% of vehicle control at 25 μM and were considered non-toxic. Compound 1 had the most potent anti-chlamydial effect with low micromolar EC50.
The remaining hit compounds 7, 6, 8, and 9 were all thiaplakortone compounds and 10 was also investigated due to its similar structure. Thiaplakortone A (10) and B (6) were first isolated from a Great Barrier Reef sponge Plakortis lita. These compounds have in vitro antimalarial effect at low nanomolar concentrations (Davis et al., 2013) and 10 also inhibits Trypanosoma brucei and T. cruzi, at low micromolar concentrations (Zulfiqar et al., 2017). Compound 10 is known to have moderate toxicity in mammalian cells while 6 was non-toxic (Davis et al., 2013). In this screen 6 was the most potent hit compound and was also non-toxic to HeLa cells. 10 and its synthetic analogs 7, 8, and 9 (Schwartz et al., 2015) were all toxic to HeLa cells and as Chlamydia are obligate intracellular pathogens the anti-Chlamydia effect was not possible to distinguish from the cytotoxicity. The molecular target and mode of action of thiaplakortone and analogs in parasites is not known and we can only speculate that the anti-chlamydial effect may be caused by an effect of a common eukaryotic cell target altering the function of the host cell to the disadvantage of Chlamydia. Alternatively, a specific bacterial target may also be possible given the low host cell toxicity of a few compounds.
The use of a natural compound library from relatively unexplored Australian plants and fungi is especially interesting from an antibiotic development perspective since pre-existing resistance mechanisms are less likely. The new Chlamydia inhibitors identified in the present screen have the potential to provide starting points for development of novel antimicrobial drugs. Treatment options for intracellular bacterial infections like Chlamydia are limited partly due to limited access to the restricted intracellular compartment. Resistance to antibiotics readily develops in vitro and clinical isolates with antibiotic resistance as well as cases of treatment failure have been described (Hammerschlag and Kohlhoff, 2012). Although antibiotic resistance is currently not widespread in the clinical setting, antibiotic resistant strains pose a potential threat as effect of treatment is not monitored and antibiotic susceptibility testing is not performed. Our novel image-based screening assay is a useful tool in identification of novel anti-chlamydial agents that could be used to treat and prevent infections that cause infertility and blindness globally.
The red fluorescent strain was also visualized by repeated micrographs throughout the developmental cycle using the live cell imaging function of the automated microscope. The effect of the most potent compound 6 as observed by live microscopy was shown to reduce Chlamydia inclusion size compared to untreated infections suggesting antibacterial growth inhibition properties of the compound. The live microscopy function demonstrated a valuable tool for determining in what part of the infectious cycle the compound has its effect and may replace multiple time course experiments.
Here we present an image-based screening method with red fluorescent Chlamydia that was autonomously detected by automated microscopy without the need for Chlamydia immunostaining. The method was applied in image-based screening to compounds that inhibit Chlamydia growth and identified Australian natural compounds with previously described antimicrobial activity. Further, the method was used for live-cell monitoring of Chlamydia infected cells over time and visualized the growth inhibitory effect of the most potent natural compound in Chlamydia cell culture infection.
Data Availability Statement
The chemical structures of the 339 compounds that were not selected as hit compounds are not publicly available due to other ongoing research collaborations and possible intellectual propriety rights. However, all chemical structures needed to support the conclusions in the manuscript are shown in Table 1.
Author Contributions
ÅG and ME contributed conception and design of the study. RAD provided the compound library. AUE performed the screening and follow up testing. SAM transformed Chlamydia, performed toxicity testing and determined EC50 values and the live microscopy assay. WB purified the transformed Chlamydia and compared the two different fluorescence detection methods. SAM, AUE, and ÅG wrote sections of the manuscript. All authors contributed to manuscript preparation and approved the submitted version.
Funding
This work was supported by Umeå University and by the Swedish Government Fund for Clinical Research (for ÅG) and the Swedish Research Council (for ME).
Conflict of Interest Statement
The authors declare that the research was conducted in the absence of any commercial or financial relationships that could be construed as a potential conflict of interest.
Acknowledgments
We acknowledge Compounds Australia (www.compoundsaustralia.com) that processed the Davis open access natural product library, and the NatureBank biota repository (www.griffith.edu.au/gridd) from which many of the compounds in the Davis open access natural product library were derived. We thank Laboratories for Chemical Biology Sweden and Chemical Biology Consortium Sweden for access to screening instrumentation and expertise.
Supplementary Material
The Supplementary Material for this article can be found online at: https://www.frontiersin.org/articles/10.3389/fmicb.2018.03151/full#supplementary-material
Supplementary Data Sheet 1. Screening protocol.
Supplementary Video 1. Expression of mCherry in transformed C. trachomatis. Time-lapse from 10 to 24 hpi. mCherry becomes visible around 20 hpi.
Supplementary Video 2. Treatment with 3 μM hit compound 6 leads to a continuous growth reduction. mCherry transformed Chlamydia time-lapse from 24 to 72 hpi.
Supplementary Video 3. Treatment with 0.5% DMSO, control for video 2. mCherry transformed Chlamydia time-lapse from 24 to 72 hpi.
Abbreviations
wt, wild type; hpi, hours post infection; EC50, 50% effective concentration.
References
Bailey, L., Gylfe, Å., Sundin, C., Muschiol, S., Elofsson, M., Nordström, P., et al. (2007). Small molecule inhibitors of type III secretion in Yersinia block the Chlamydia pneumoniae infection cycle. FEBS Lett. 581, 587–595. doi: 10.1016/j.febslet.2007.01.013
Bao, X., Gylfe, Å., Sturdevant, G. L., Gong, Z., Xu, S., Caldwell, H. D., et al. (2014). Benzylidene acylhydrazides inhibit chlamydial growth in a type III secretion- and iron chelation-independent manner. J. Bacteriol. 196, 2989–3001. doi: 10.1128/JB.01677-14
Barnes, E. C., Kumar, R., and Davis, R. A. (2016). The use of isolated natural products as scaffolds for the generation of chemically diverse screening libraries for drug discovery. Nat. Prod. Rep. 33, 372–381. doi: 10.1039/c5np00121h
Barnes, E. C., Said, N. A. B., Williams, E. D., Hooper, J. N., and Davis, R. A. (2010). Ecionines A and B, two new cytotoxic pyridoacridine alkaloids from the Australian marine sponge, Ecionemia geodides. Tetrahedron 66, 283–287. doi: 10.1016/j.tet.2009.10.109
Batteiger, B. E. (2012). “Chlamydia infection and epidemiology,” in Intracellular Pathogens I: Chlamydiales, eds M. Tan, and P. Bavoil (Washington, DC: ASM-press), 1–26.
Bauler, L. D., and Hackstadt, T. (2014). Expression and targeting of secreted proteins from Chlamydia trachomatis. J. Bacteriol. 196, 1325–1334. doi: 10.1128/jb.01290-13
Beattie, K. D., Ellwood, N., Kumar, R., Yang, X., Healy, P. C., Choomuenwai, V., et al. (2016). Antibacterial and antifungal screening of natural products sourced from Australian fungi and characterisation of pestalactams D–F. Phytochemistry 124, 79–85. doi: 10.1016/j.phytochem.2015.12.014
Bojang, E., Jafali, J., Perreten, V., Hart, J., Harding-Esch, E. M., Sillah, A., et al. (2017). Short-term increase in prevalence of nasopharyngeal carriage of macrolide-resistant Staphylococcus aureus following mass drug administration with azithromycin for trachoma control. BMC Microbiol. 17:75. doi: 10.1186/s12866-017-0982-x
Caldwell, H. D., Kromhout, J., and Schachter, J. (1981). Purification and partial characterization of the major outer membrane protein of Chlamydia trachomatis. Infect. Immun. 31, 1161–1176.
Choomuenwai, V., Andrews, K. T., and Davis, R. A. (2012). Synthesis and antimalarial evaluation of a screening library based on a tetrahydroanthraquinone natural product scaffold. Bioorg. Med. Chem. 20, 7167–7174. doi: 10.1016/j.bmc.2012.09.052
Dahlgren, M. K., Zetterström, C. E., Gylfe, Å., Linusson, A., and Elofsson, M. (2010). Statistical molecular design of a focused salicylidene acylhydrazide library and multivariate QSAR of inhibition of type III secretion in the Gram-negative bacterium Yersinia. Bioorg. Med. Chem. 18, 2686–2703. doi: 10.1016/j.bmc.2010.02.022
Davis, R. A. (2005). Isolation and structure elucidation of the new fungal metabolite (-)-xylariamide A. J. Nat. Prod. 68, 769–772. doi: 10.1021/np050025h
Davis, R. A., Duffy, S., Fletcher, S., Avery, V. M., and Quinn, R. J. (2013). Thiaplakortones A-D: antimalarial thiazine alkaloids from the Australian marine sponge Plakortis lita. J. Org. Chem. 78, 9608–9613. doi: 10.1021/jo400988y
Elsworth, C., Gill, M., and Ten, A. (1999). Pigments of fungi. LXII. (1S, 3R)-austrocortirubin: isolation from the fungus Dermocybe splendida and synthesis from (S)-citramalic acid. Aust. J. Chem. 52, 1115–1117.
Engström, P., Krishnan, K. S., Ngyuen, B. D., Chorell, E., Normark, J., Silver, J., et al. (2014). A 2-pyridone-amide inhibitor targets the glucose metabolism pathway of Chlamydia trachomatis. mBio 6, e02304–e02314. doi: 10.1128/mBio.02304-14
Enquist, P. A., Gylfe, Å., Hägglund, U., Lindström, P., Norberg-Scherman, H., Sundin, C., et al. (2012). Derivatives of 8-hydroxyquinoline–antibacterial agents that target intra- and extracellular Gram-negative pathogens. Bioorg. Med. Chem. Lett. 22, 3550–3553. doi: 10.1016/j.bmcl.2012.03.096
Garcïa-Plazaola, J. I., Fernández-Marín, B., Duke, S. O., Hernandez, A., Lopez-Arbeloa, F., and Becerril, J. M. (2015). Autofluorescence: biological functions and technical applications. Plant. Sci. 236, 136–145. doi: 10.1016/j.plantsci.2015.03.010
Gloeckl, S., Ong, V. A., Patel, P., Tyndall, J. D., Timms, P., Beagley, K. W., et al. (2013). Identification of a serine protease inhibitor which causes inclusion vacuole reduction and is lethal to Chlamydia trachomatis. Mol. Microbiol. 89, 676–689. doi: 10.1111/mmi.12306
Good, J. A., Silver, J., Núñez-Otero, C., Bahnan, W., Krishnan, K. S., Salin, O., et al. (2016). Thiazolino 2-pyridone amide inhibitors of Chlamydia trachomatis infectivity. J. Med. Chem. 59, 2094–2108. doi: 10.1021/acs.jmedchem.5b01759
Good, J. A. D., Kulén, M., Silver, J., Krishnan, K. S., Bahnan, W., Núñez-Otero, C., et al. (2017). Thiazolino 2-pyridone amide isosteres as inhibitors of Chlamydia trachomatis infectivity. J. Med. Chem. 60, 9393–9399. doi: 10.1021/acs.jmedchem.7b00716
Hakala, E., Hanski, L., Uvell, H., Yrjönen, T., Vuorela, H., Elofsson, M., et al. (2015). Dibenzocyclooctadiene lignans from Schisandra spp. selectively inhibit the growth of the intracellular bacteria Chlamydia pneumoniae and Chlamydia trachomatis. J. Antibiot. 68, 609–614. doi: 10.1038/ja.2015.48
Hammerschlag, M. R., and Kohlhoff, S. A. (2012). Treatment of chlamydial infections. Expert Opin. Pharmacother. 13, 545–552. doi: 10.1517/14656566.2012.658776
Hanski, L., Genina, N., Uvell, H., Malinovskaja, K., Gylfe, Å., Laaksonen, T., et al. (2014). Inhibitory activity of the isoflavone biochanin A on intracellular bacteria of genus Chlamydia and initial development of a buccal formulation. PLoS ONE 9:e115115. doi: 10.1371/journal.pone.0115115
Ison, C. A. (2012). Antimicrobial resistance in sexually transmitted infections in the developed world: implications for rational treatment. Curr. Opin. Infect. Dis. 25, 73–78. doi: 10.1097/QCO.0b013e32834e9a6a
Levrier, C., Balastrier, M., Beattie, K. D., Carroll, A. R., Martin, F., Choomuenwai, V., et al. (2013). Pyridocoumarin, aristolactam and aporphine alkaloids from the Australian rainforest plant Goniothalamus australis. Phytochemistry 86, 121–126. doi: 10.1016/j.phytochem.2012.09.019
Li, J. W., and Vederas, J. C. (2009). Drug discovery and natural products: end of an era or an endless frontier? Science 325, 161–165. doi: 10.1126/science.1168243
Marwaha, S., Uvell, H., Salin, O., Lindgren, A. E., Silver, J., Elofsson, M., et al. (2014). N-acylated derivatives of sulfamethoxazole and sulfafurazole inhibit intracellular growth of Chlamydia trachomatis. Antimicrob. Agents Chemother. 58, 2968–2971. doi: 10.1128/aac.02015-13
Muschiol, S., Bailey, L., Gylfe, Å., Sundin, C., Hultenby, K., Bergström, S., et al. (2006). A small-molecule inhibitor of type III secretion inhibits different stages of the infectious cycle of Chlamydia trachomatis. Proc. Natl. Acad. Sci. U.S.A. 103, 14566–14571. doi: 10.1073/pnas.0606412103
Newman, L., Rowley, J., Vander Hoorn, S., Wijesooriya, N. S., Unemo, M., Low, N., et al. (2015). Global estimates of the prevalence and incidence of four curable sexually transmitted infections in 2012 based on systematic review and global reporting. PLoS ONE 10:e0143304. doi: 10.1371/journal.pone.0143304
Ong, V. A., Lawrence, A., Timms, P., Vodstrcil, L. A., Tabrizi, S. N., Beagley, K. W., et al. (2015). In vitro susceptibility of recent Chlamydia trachomatis clinical isolates to the CtHtrA inhibitor JO146. Microbes Infect. 17, 738–744. doi: 10.1016/j.micinf.2015.09.004
Osaka, I., and Hefty, P. S. (2013). A simple resazurin-based microplate assay for measuring Chlamydia infections. Antimicrob Agents Chemother. 57, 2838–2840. doi: 10.1128/AAC.00056-13
Osaka, I., Hills, J. M., Kieweg, S. L., Shinogle, H. E., Moore, D. S., and Hefty, P. S. (2012). An automated image-based method for rapid analysis of Chlamydia infection as a tool for screening antichlamydial agents. Antimicrob. Agents Chemother. 56, 4184–4188. doi: 10.1128/AAC.00427-12
Rodriguez, E. A., Campbell, R. E., Lin, J. Y., Lin, M. Z., Miyawaki, A., Palmer, A. E., et al. (2017). The growing and glowing toolbox of fluorescent and photoactive proteins. Trends Biochem. Sci. 42, 111–129. doi: 10.1016/j.tibs.2016.09.010
Saleeb, M., Mojica, S., Eriksson, A. U., Andersson, C. D., Gylfe, Å., and Elofsson, M. (2018). Natural product inspired library synthesis—Identification of 2,3-diarylbenzofuran and 2,3-dihydrobenzofuran based inhibitors of Chlamydia trachomatis. Eur. J. Med. Chem. 143, 1077–1089. doi: 10.1016/j.ejmech.2017.11.099
Sandoz, K. M., Eriksen, S. G., Jeffrey, B. M., Suchland, R. J., Putman, T. E., Hruby, D. E., et al. (2012). Resistance to a novel antichlamydial compound is mediated through mutations in Chlamydia trachomatis secY. Antimicrob. Agents Chemother. 56, 4296–4302. doi: 10.1128/AAC.00356-12
Schwartz, B. D., Skinner-Adams, T. S., Andrews, K. T., Coster, M. J., Edstein, M. D., MacKenzie, D., et al. (2015). Synthesis and antimalarial evaluation of amide and urea derivatives based on the thiaplakortone A natural product scaffold. Org. Biomol. Chem. 13, 1558–1570. doi: 10.1039/c4ob01849d
Sewell, D. L. (1995). Laboratory-associated infections and biosafety. Clin. Microbiol. Rev. 8, 389–405.
Shu, X., Shaner, N. C., Yarbrough, C. A., Tsien, R. Y., and Remington, S. J. (2006). Novel chromophores and buried charges control color in mFruits. Biochemistry 45, 9639–9647. doi: 10.1021/bi060773l
Sunduru, N., Salin, O., Gylfe, Å., and Elofsson, M. (2015). Design, synthesis and evaluation of novel polypharmacological antichlamydial agents. Eur. J. Med. Chem. 101, 595–603. doi: 10.1016/j.ejmech.2015.07.019
Ur-Rehman, T., Slepenkin, A., Chu, H., Blomgren, A., Dahlgren, M. K., Zetterström, C. E., et al. (2012). Pre-clinical pharmacokinetics and anti-chlamydial activity of salicylidene acylhydrazide inhibitors of bacterial type III secretion. J. Antibiot. 65, 397–404. doi: 10.1038/ja.2012.43
Wang, Y., Islam, M. A., Davis, R. A., and McAlpine, S. R. (2015). The fungal natural product (1S,3S)-austrocortirubin induces DNA damage in HCT116 cells via a mechanism unique from other DNA damaging agents. Bioorg. Med. Chem. Lett. 25, 249–253. doi: 10.1016/j.bmcl.2014.11.055
Wang, Y., Kahane, S., Cutcliffe, L. T., Skilton, R. J., Lambden, P. R., and Clarke, I. N. (2011). Development of a transformation system for Chlamydia trachomatis: restoration of glycogen biosynthesis by acquisition of a plasmid shuttle vector. PLoS Pathog. 7:e1002258. doi: 10.1371/journal.ppat.1002258
WHO (2018). Trachoma: Fact Sheet. World Health Organization. Available online at: http://www.who.int/news-room/fact-sheets/detail/trachoma (Accessed September 30, 2018).
Wolf, K., Betts, H. J., Chellas-Géry, B., Hower, S., Linton, C. N., and Fields, K. A. (2006). Treatment of Chlamydia trachomatis with a small molecule inhibitor of the Yersinia type III secretion system disrupts progression of the chlamydial developmental cycle. Mol. Microbiol. 61, 1543–1555. doi: 10.1111/j.1365-2958.2006.05347.x
Keywords: Chlamydia trachomatis, high content screening, Australian natural products, antibacterial, anti-chlamydial, mCherry, fluorescence-based screening
Citation: Mojica SA, Eriksson AU, Davis RA, Bahnan W, Elofsson M and Gylfe Å (2018) Red Fluorescent Chlamydia trachomatis Applied to Live Cell Imaging and Screening for Antibacterial Agents. Front. Microbiol. 9:3151. doi: 10.3389/fmicb.2018.03151
Received: 01 October 2018; Accepted: 05 December 2018;
Published: 18 December 2018.
Edited by:
Jan Rupp, Universität zu Lübeck, GermanyReviewed by:
Mirja Puolakkainen, University of Helsinki, FinlandErika Ildiko Lutter, Oklahoma State University, United States
Copyright © 2018 Mojica, Eriksson, Davis, Bahnan, Elofsson and Gylfe. This is an open-access article distributed under the terms of the Creative Commons Attribution License (CC BY). The use, distribution or reproduction in other forums is permitted, provided the original author(s) and the copyright owner(s) are credited and that the original publication in this journal is cited, in accordance with accepted academic practice. No use, distribution or reproduction is permitted which does not comply with these terms.
*Correspondence: Åsa Gylfe, YXNhLmd5bGZlQHVtdS5zZQ==
†These authors have contributed equally to this work