 Jungik Choi
 Maciek R. Antoniewicz*
- Department of Chemical and Biomolecular Engineering, Metabolic Engineering and Systems Biology Laboratory, University of Delaware, Newark, DE, United States
In the past two decades, 13C metabolic flux analysis (13C-MFA) has matured into a powerful and widely used scientific tool in metabolic engineering and systems biology. Traditionally, metabolic fluxes have been determined from measurements of isotopic labeling by means of mass spectrometry (MS) or nuclear magnetic resonance (NMR). In recent years, tandem MS has emerged as a new analytical technique that can provide additional information for high-resolution quantification of metabolic fluxes in complex biological systems. In this paper, we present recent advances in methods and algorithms for incorporating tandem MS measurements into existing 13C-MFA approaches that are based on the elementary metabolite units (EMU) framework. Specifically, efficient EMU-based algorithms are presented for simulating tandem MS data, tracing isotopic labeling in biochemical network models and for correcting tandem MS data for natural isotope abundances.
Introduction
13C-Metabolic flux analysis (13C-MFA) is a widely used technique in metabolic engineering and biomedical sciences for quantifying rates of metabolite interconversions inside living cells (i.e., in vivo metabolic fluxes) (Antoniewicz, 2015a,b; Ahn et al., 2016). In 13C-MFA, labeling experiment are performed by introducing a 13C labeled substrate (the tracer), followed by measurement of 13C labeling incorporation, and calculation of metabolic fluxes using one of several available software packages for 13C-MFA (Yoo et al., 2008; Quek et al., 2009; Weitzel et al., 2013; Young, 2014). Currently, the main techniques used to measure 13C labeling are mass spectrometry (MS) (Antoniewicz et al., 2007a, 2011; McConnell and Antoniewicz, 2016), nuclear magnetic resonance (NMR) spectroscopy (Masakapalli et al., 2014), and tandem MS (Antoniewicz, 2013; Okahashi et al., 2016). Previous studies have demonstrated that tandem MS measurements can provide more labeling information than MS resulting in improved performance of 13C-MFA in complex biological systems (Jeffrey et al., 2002; Choi and Antoniewicz, 2011; Choi et al., 2012).
Various modeling approaches have been applied to simulate tandem MS data for applications in 13C-MFA. These include manually derived algebraic equations for specific network models (Jeffrey et al., 2002), isotopomers (Choi and Antoniewicz, 2011; Chandra and Peng, 2012), and tandemers (Tepper and Shlomi, 2015). Despite the demonstrated advantages of tandem MS, the technique is still not fully embraced by the 13C-MFA community, likely because the modeling approaches have not been based on the elementary metabolite units (EMU) framework (Antoniewicz et al., 2007b; Crown and Antoniewicz, 2012), which is the most widely used approach for modeling isotopic labeling in 13C-MFA (Young et al., 2008). The EMU framework is at the core of all major software packages for 13C-MFA (Yoo et al., 2008; Quek et al., 2009; Weitzel et al., 2013; Young, 2014). In this methods paper, we describe efficient algorithms for modeling tandem MS data that are firmly based on the EMU framework. By building upon the EMU framework, we illustrate that the presented algorithms can be easily incorporated into existing software packages to take full advantage of the additional information provided by tandem MS for high-resolution flux measurements.
Simulation of Tandem MS Data
Compact Tandem MS Matrix
First, we introduce here the new concept of the compact tandem MS matrix that will be used throughout this paper to describe tandem MS data. In later sections, it will be demonstrated that the compact tandem MS matrix is compatible with the EMU framework to allow tandem MS data to be incorporated into existing EMU algorithms for 13C-MFA.
Tandem MS data was previously represented by the so-called tandem MS matrix (Figure 1A; Choi and Antoniewicz, 2011), where the columns correspond to m/z of the parent fragment and rows correspond to m/z of the daughter fragment. As an example, consider a metabolite A that has four carbon atoms, and assume that carbon atoms C1–C4 are present in the parent fragment, and that carbon atoms C3–C4 are present in the daughter fragment. In this case, the tandem MS matrix is a 3 × 5 matrix (rows m0–m2, columns M0–M4; Figure 1A). A disadvantage of this representation is that several matrix fields will have zero values by definition. For example, in the first column of the tandem MS matrix, which corresponds to the unlabeled parent fragment (M0), the only possible daughter fragment is unlabeled (m0). A more convenient way of representing tandem MS data is by defining the compact tandem MS matrix, which is constructed by shifting rows of the tandem MS matrix to eliminate fields that are infeasible (i.e., which are zero by definition). In this example, the compact tandem MS matrix is 3 × 3 matrix (Figure 1B).
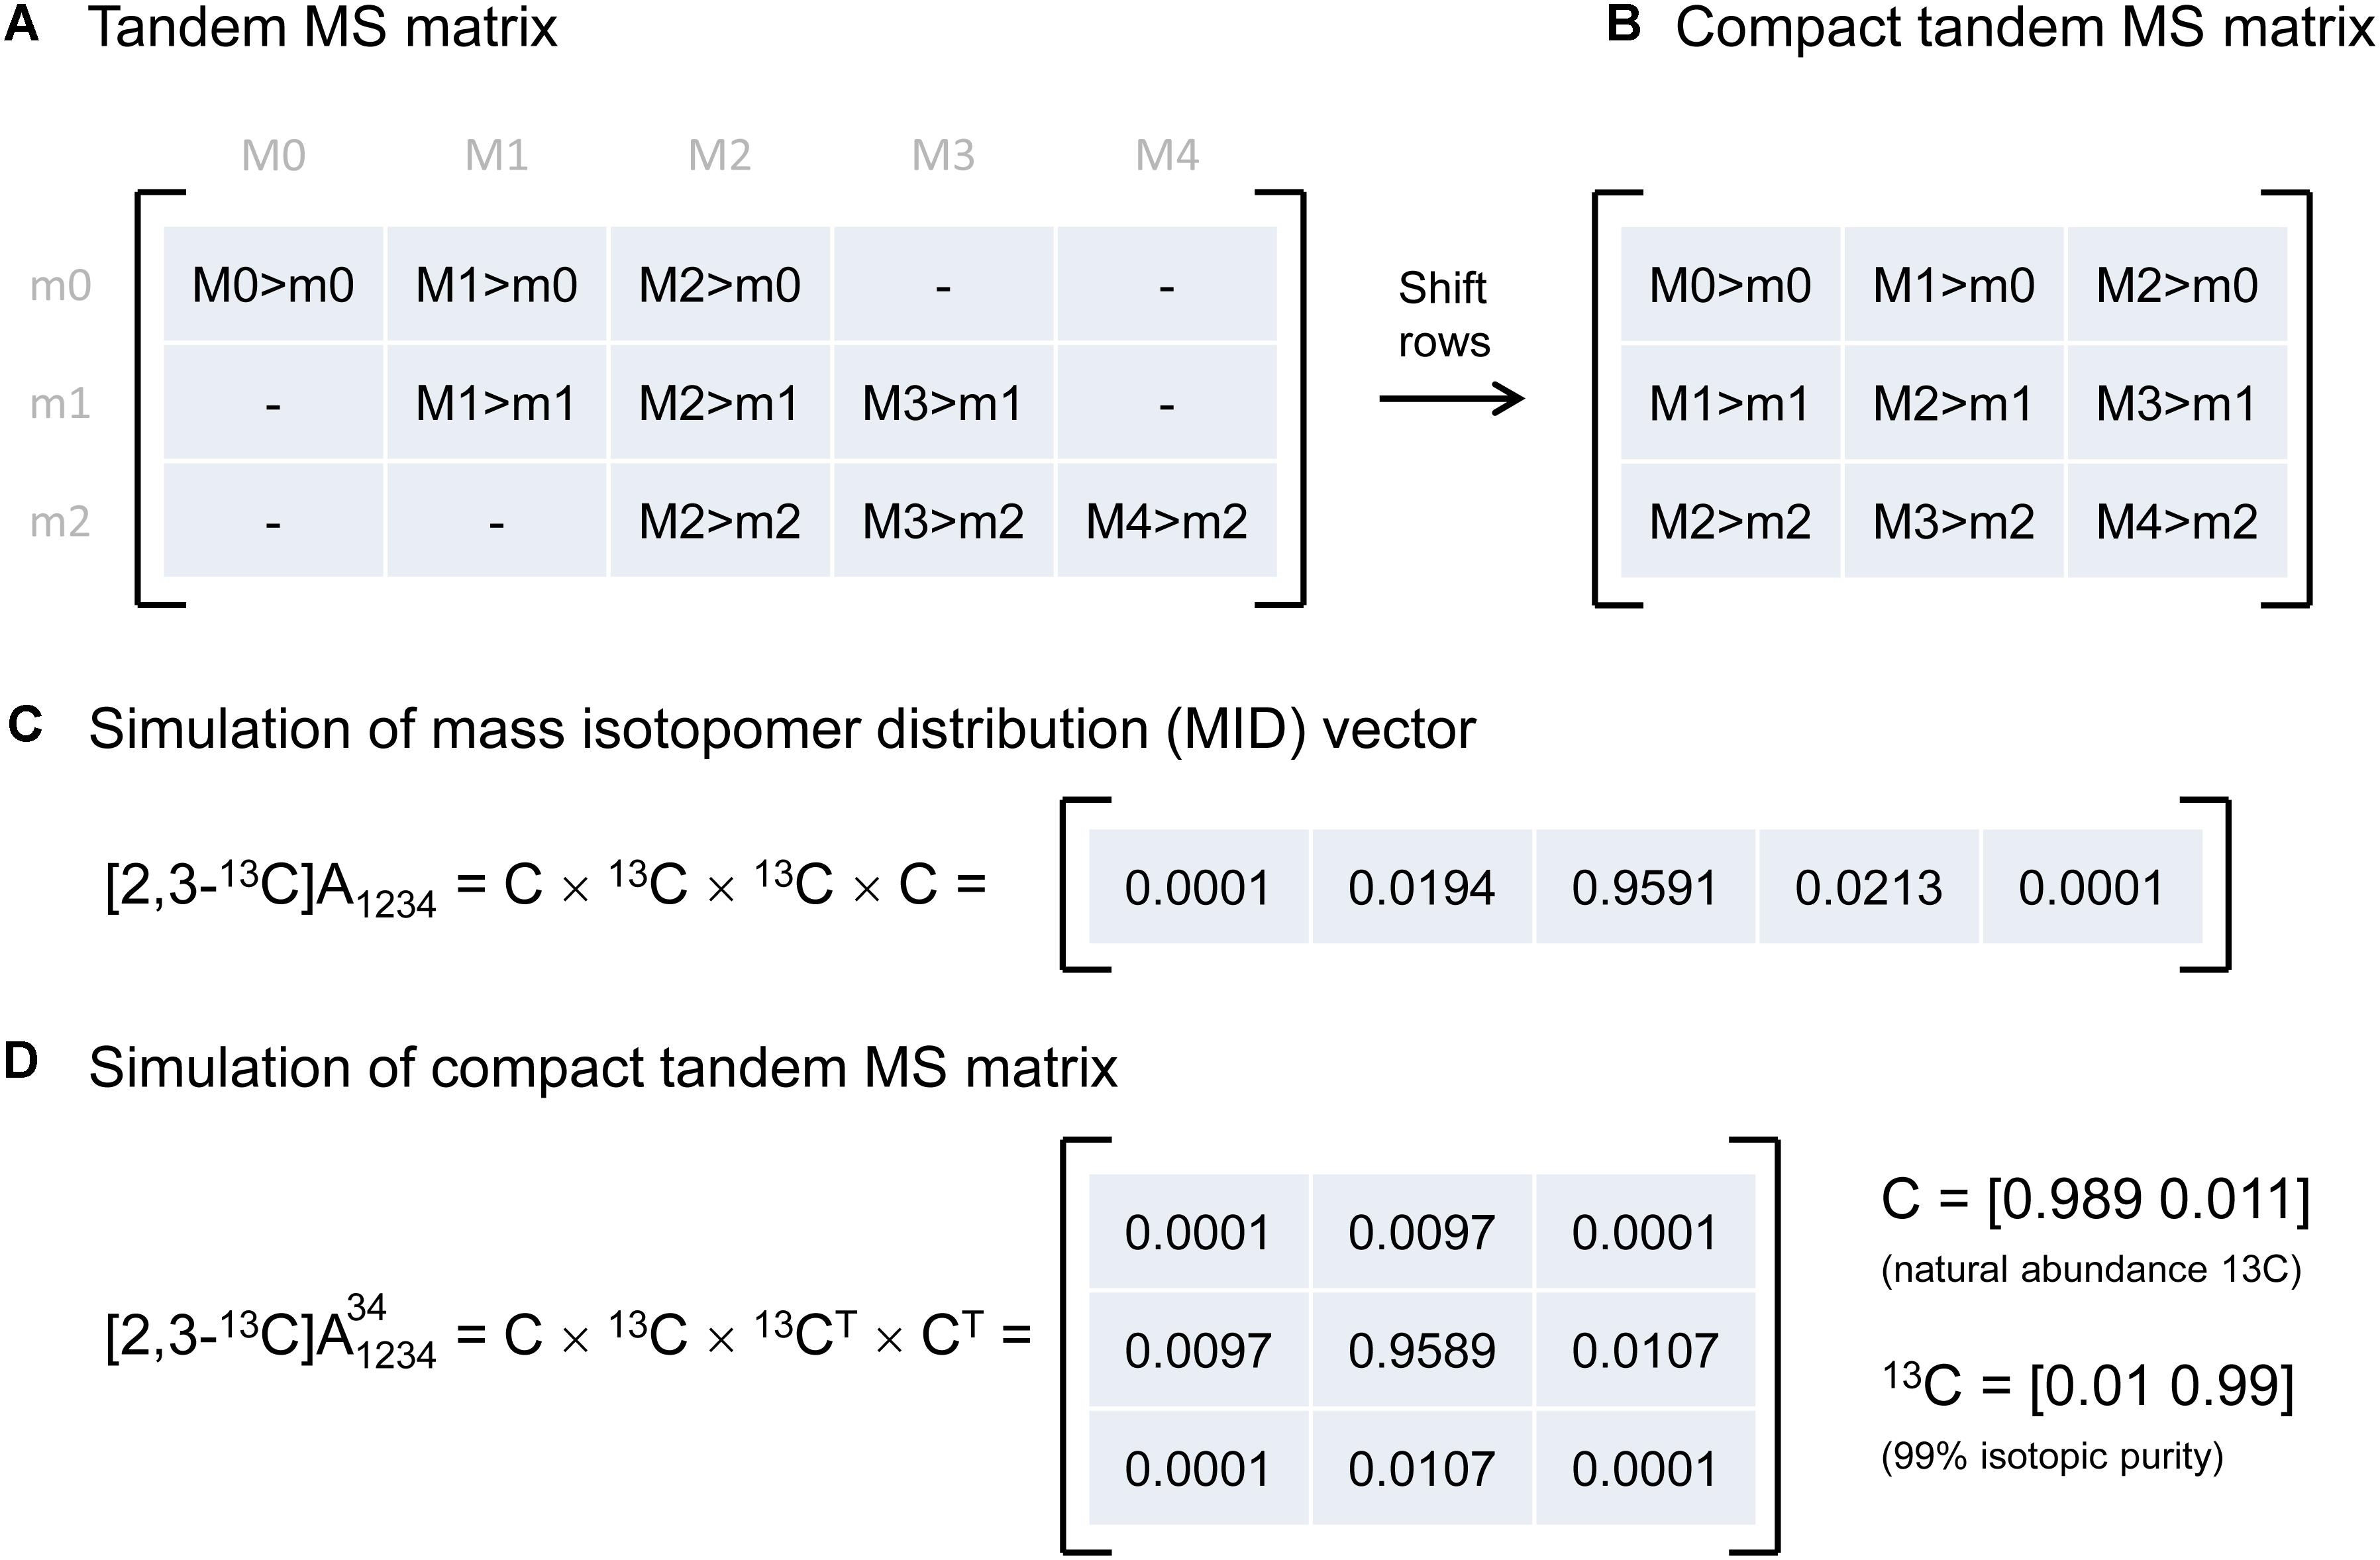
Figure 1. (A) Representation of tandem mass spectrometry data using a tandem MS matrix, and (B) a compact tandem MS matrix. (C) A mass isotopomer distribution vector can be simulated efficiently by a series of convolutions (denoted by “×”). (D) A compact tandem MS matrix can be simulated analogously by a series of 2D-convolutions (denoted by “×”). For illustration purposes, the MID vector and the compact tandem MS matrix were simulated for a four-carbon metabolite A that is 13C-labeled at carbon positions 2 and 3.
Simulating Tandem MS Data Using 2D-Convolutions
Next, we describe an algorithm to simulate the compact tandem MS matrix for metabolites that are naturally labeled and for isotopic tracers that are labeled at specific carbon positions. Previously, we demonstrated that mass isotopomer distributions (MID) can be simulated efficiently using a series of convolutions (function conv in Matlab) (Antoniewicz et al., 2007b), essentially by reconstructing a metabolite atom-by-atom (Figure 1C). Here, we demonstrate that the compact tandem MS matrix can be simulated analogously using a series of 2D-convolutions (function conv2 in Matlab), again by reconstructing a metabolite atom-by-atom. This approach can be used to simulate both naturally labeled compounds and tracers that are labeled at one or more specific carbon positions.
As an example, assume that we want to simulate the compact tandem MS matrix for metabolite A that is labeled at the second and third carbon positions, i.e., [2,3-13C]A, and assume that the parent fragment contains all four carbon atoms, and the daughter fragment contains carbon atoms 3 and 4. Simulation of the compact tandem MS matrix is achieved by a sequence of 2D-convolutions as shown in Figure 1D. The 2D-convolution is performed with the transpose of the atom’s MID vector if the atom is present in the daughter fragment, and using the atom’s MID vector if the atom is not present in the daughter fragment. The simulated compact tandem MS matrix for [2,3-13C]A is shown in Figure 1D. The same approach can be used to simulate compact tandem MS matrices for metabolites of any size. This approach is not limited to simulating only carbon atoms, but can also be used to include any and all atoms. This is important since in LC-MS/MS natural abundances of e.g., sulfur (4.2% M+2) and oxygen (0.2% M+2) contribute to shifts in tandem MS distributions, and even more importantly, in GC-MS/MS analysis compounds are often derivatized (e.g., with TBDMS) which adds other atoms to the fragment that cause even more dramatic shifts in tandem MS distributions (Choi et al., 2012; Okahashi et al., 2016).
Correction of Tandem MS Data
Parent, Daughter, and Complement Fragments
In order to use tandem MS data for 13C-flux calculations, the data must be corrected for natural isotope abundances. Efficient algorithms have been developed for correcting MS data for use in 13C-MFA (Fernandez et al., 1996); however, existing algorithms for correcting tandem MS data tend to be more tedious (Rantanen et al., 2002; Niedenfuhr et al., 2016). Here, we describe a more convenient algorithm based on the compact tandem MS matrix formulation described above. First, we must define a new term, the “complement fragment,” shown in Figure 2A. The complement fragment is defined as the part of the parent fragment that is not present in the daughter fragment. The daughter fragment and the complement fragment can then be further imagined to consist of core carbon atoms that originate from the metabolite that is measured, and other atoms (which may include both carbon and non-carbon atoms) from the derivatizing agent. For 13C-MFA calculations, we are only interested in the labeling of the core C-atoms; thus, tandem MS data must be corrected for the skewing effects resulting from the presence of carbon atoms that are not core C-atoms.
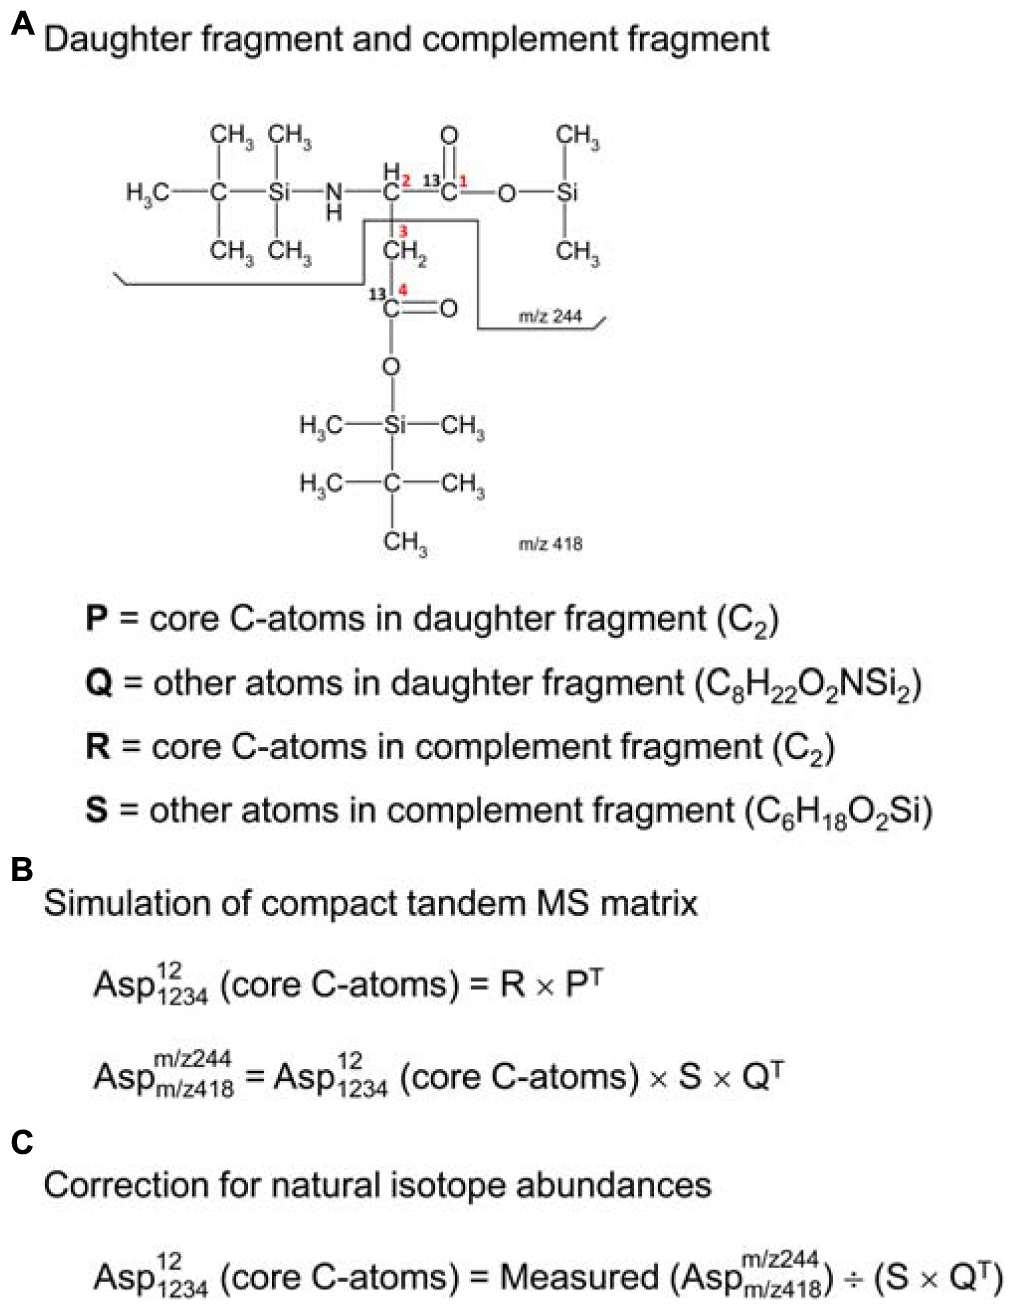
Figure 2. (A) Definitions of daughter fragment and complement fragment; here, illustrated for TBDMS-derivatized aspartate, where the daughter fragment contains carbon atoms C1 and C2 of aspartate, and the complement fragment contains carbon atoms C3 and C4 of aspartate. (B) The compact tandem MS matrix of TBDMS-derivatized aspartate is simulated using 2D-convolutions (denoted by “×”), where Q and S are the natural abundance MID vectors for the other atoms (i.e., non-core C-atoms) of the daughter and complement fragments, respectively. (C) Correction for natural isotope abundances of non-core C-atoms is accomplished by a 2D-deconvolution (denoted here by “÷”).
Correcting Tandem MS Data for Natural Abundances
The correction of tandem MS data for natural isotope abundances is accomplished using 2D-deconvolution. To illustrate this, consider the case of TBDMS-derivatized aspartate. In a previous study, we validated several parent-daughter GC-MS/MS fragments for analysis of aspartate labeling (Choi et al., 2012). One of the validated parent-daughter pairs was m/z 418 > 244 (Figure 2A). In this case, the parent fragment (m/z 418, C18H40O4NSi3) contains all four C-atoms of aspartate and the daughter fragment (m/z 244, C10H22O2NSi2) contains the first two C-atoms of aspartate. Following the definitions in the previous section, the daughter fragment is thus imagined to consist of two core C-atoms of aspartate (i.e., C2, first two carbon atoms), and various other atoms (C8H22O2NSi2); the complement fragment consists of two core C-atoms of aspartate (i.e., C2, last two carbon atoms), and various other atoms (C6H18O2Si). If the labeling of the core C-atoms is known, then we can predict the theoretical measured compact tandem MS matrix by 2D-convolutions shown in Figure 2B, where S is the natural abundance MID vector of C6H18O2Si, and Q is the natural abundance MID vector of C8H22O2NSi2. The inverse operation, or 2D-deconvolution, can therefore be used to correct the measured tandem MS data for natural isotope abundances (Figure 2C). It should be noted that 2D-deconvolutions of this type are widely used in many fields of science such as image processing and filtering (e.g., functions fft2 and ifft2 in Matlab).
To illustrate the application of this correction algorithm, we have applied it to correct the tandem MS data that was previously measured for [1,4-13C]aspartate. Figure 3D shows the measured tandem MS matrix for the parent-daughter fragment pair m/z 418 > 244, as reported by Choi et al. (2012) (Figure 3A). The measured tandem MS matrix was first transformed into the compact tandem MS matrix by row shifting (Figure 3E), and then corrected for natural isotope abundances using 2D-deconvolution, which produced a 3 × 3 matrix that now reflects the labeling of only the core C-atoms of aspartate (Figure 3F). For comparison, we also simulated the theoretical compact tandem MS matrix for [1,4-13C]aspartate, assuming 99% isotopic purity of the tracer (Figure 3B), as well as the corresponding corrected compact tandem MS matrix (Figure 3C). Overall, there was very good agreement between the measured and simulated matrices. This example demonstrates that correction for natural isotope abundances can be accomplished easily in a single step by 2D-deconvolution using the compact tandem MS matrices.
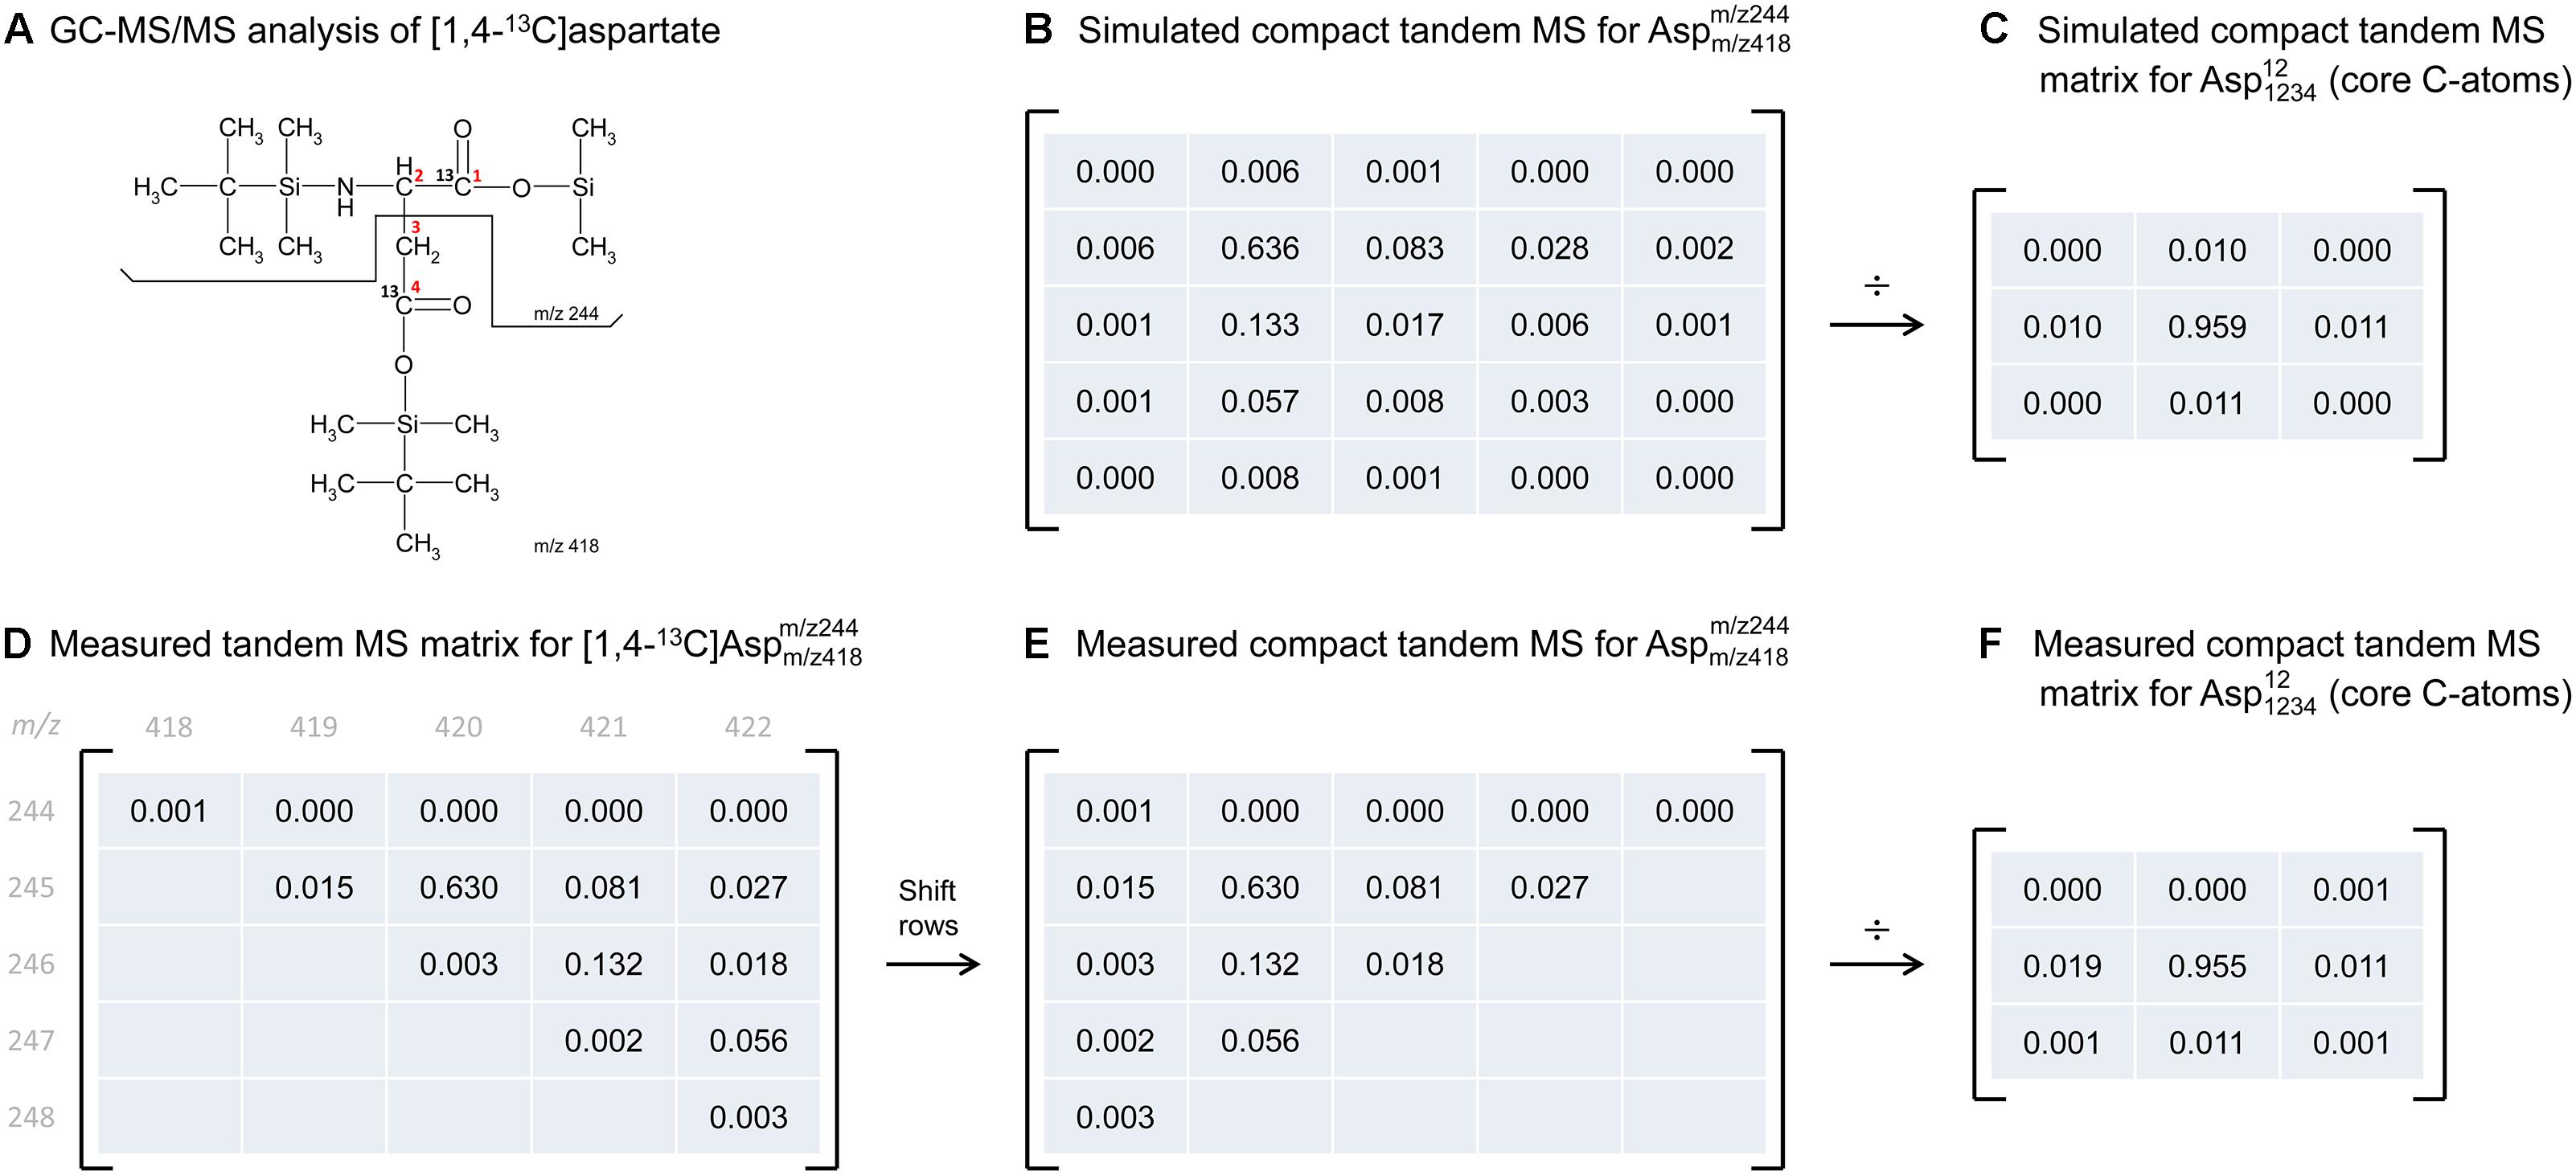
Figure 3. Illustration of natural abundance correction for both simulated and measured tandem MS data. (A) GC-MS/MS analysis was performed on TBDMS-derivatized [1,4-13C]aspartate, where the parent fragment contains all four carbon atoms of aspartate, and the daughter fragment contains carbon atoms C1 and C2 of aspartate. (B) The predicted compact tandem MS matrix for [1,4-13C]aspartate m/z 418 > 244 parent-daughter pair (assuming 99% isotopic purity), and (C) the corresponding corrected compact tandem MS matrix reflecting the labeling of core C-atoms. Correction for natural isotope abundances was performed by 2D-deconvolution (denoted here by “÷”). (D) Measured tandem MS matrix for [1,4-13C]aspartate m/z 418 > 244 parent-daughter pair, as reported by Choi et al. (2012), and (E) the corresponding compact tandem MS matrix. (F) The corrected compact tandem MS matrix, i.e., reflecting the labeling of only the core C-atoms, was obtained after correction for natural isotope abundances using 2D-deconvolution (denoted here by “÷”).
13C-Metabolic Flux Analysis With Tandem MS Data
EMU Framework for Simulating Tandem MS
Lastly, we demonstrate that tandem MS data can be used for 13C-MFA calculations using the widely used EMU framework. As described in the original EMU paper (Antoniewicz et al., 2007b), there are three types of reactions that must be considered when constructing EMU models: a condensation reaction, a cleavage reaction, and a unimolecular reaction. Figure 4 shows that for all three types of reactions the EMU product can be computed from the corresponding EMU educts. To simulate tandem MS data, compact tandem MS matrices can be used as state variables (note that MID vectors were used as state variables for simulating MS data in the original EMU paper). For an EMU condensation reaction, the compact tandem MS matrix of the EMU product is computed by a 2D-convolution as described above (Figure 4A). For the cleavage reaction and the unimolecular reaction, the compact tandem MS matrix of the EMU product is equal to the compact tandem MS matrix of the EMU educt.
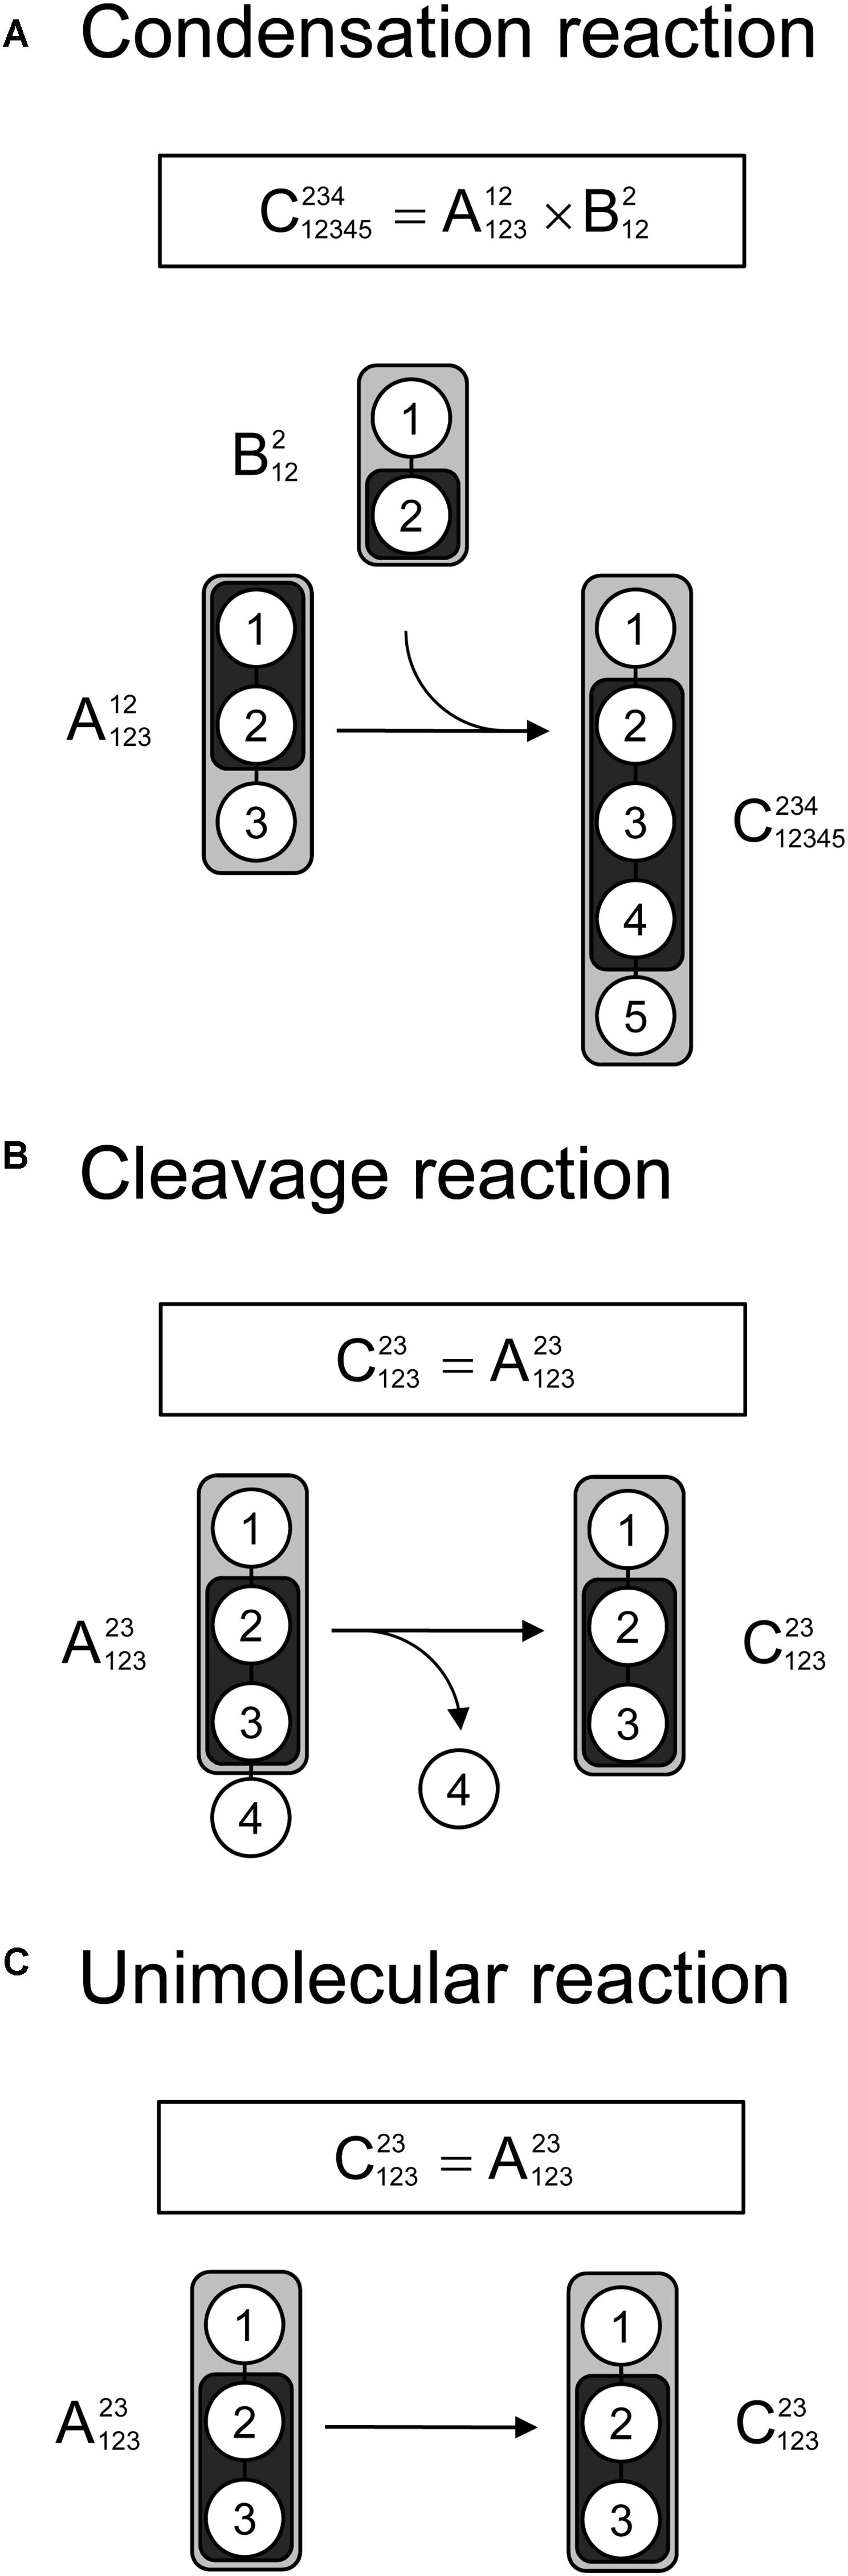
Figure 4. Three types of biochemical reactions (A) condensation reaction, (B) cleavage reactions, and (C) unimolecular reaction, that must be considered for construction of EMU models. The labeling of an EMU product is expressed solely as a function of the labeling of the EMU educts. For the condensation reaction, the compact tandem MS matrix of the EMU product is calculated by 2D-convolution (denoted by “×”) of the compact tandem MS matrices of the EMU educts.
EMU Decomposition of an Example Metabolic Network Model
At the core of the EMU methodology is the decomposition of the biochemical reaction network into EMU networks, which are then solved subsequently. The EMU decomposition is performed by tracing the origin of carbon atoms of a particular metabolite to carbon atoms of substrates. For more details, the reader is referred to the original EMU paper (Antoniewicz et al., 2007b). In the original EMU framework, EMU decomposition was accomplished by keeping track of C-atoms for the parent fragment only. To generate EMU networks for simulation of tandem MS data, we must also keep track of C-atoms of the daughter fragment. To illustrate this, we will use a simple example network model shown in Figure 5 (that was also used in the original EMU paper), with the corresponding atoms transitions shown in Table 1. The network model was decomposed here in order to simulate tandem MS data for the parent-daughter fragment pair F123 > F23. The complete EMU decomposition is shown in Table 2. It is noted that the approach described above is conceptually the same as the tandemers approach described by Tepper and Shlomi (2015).
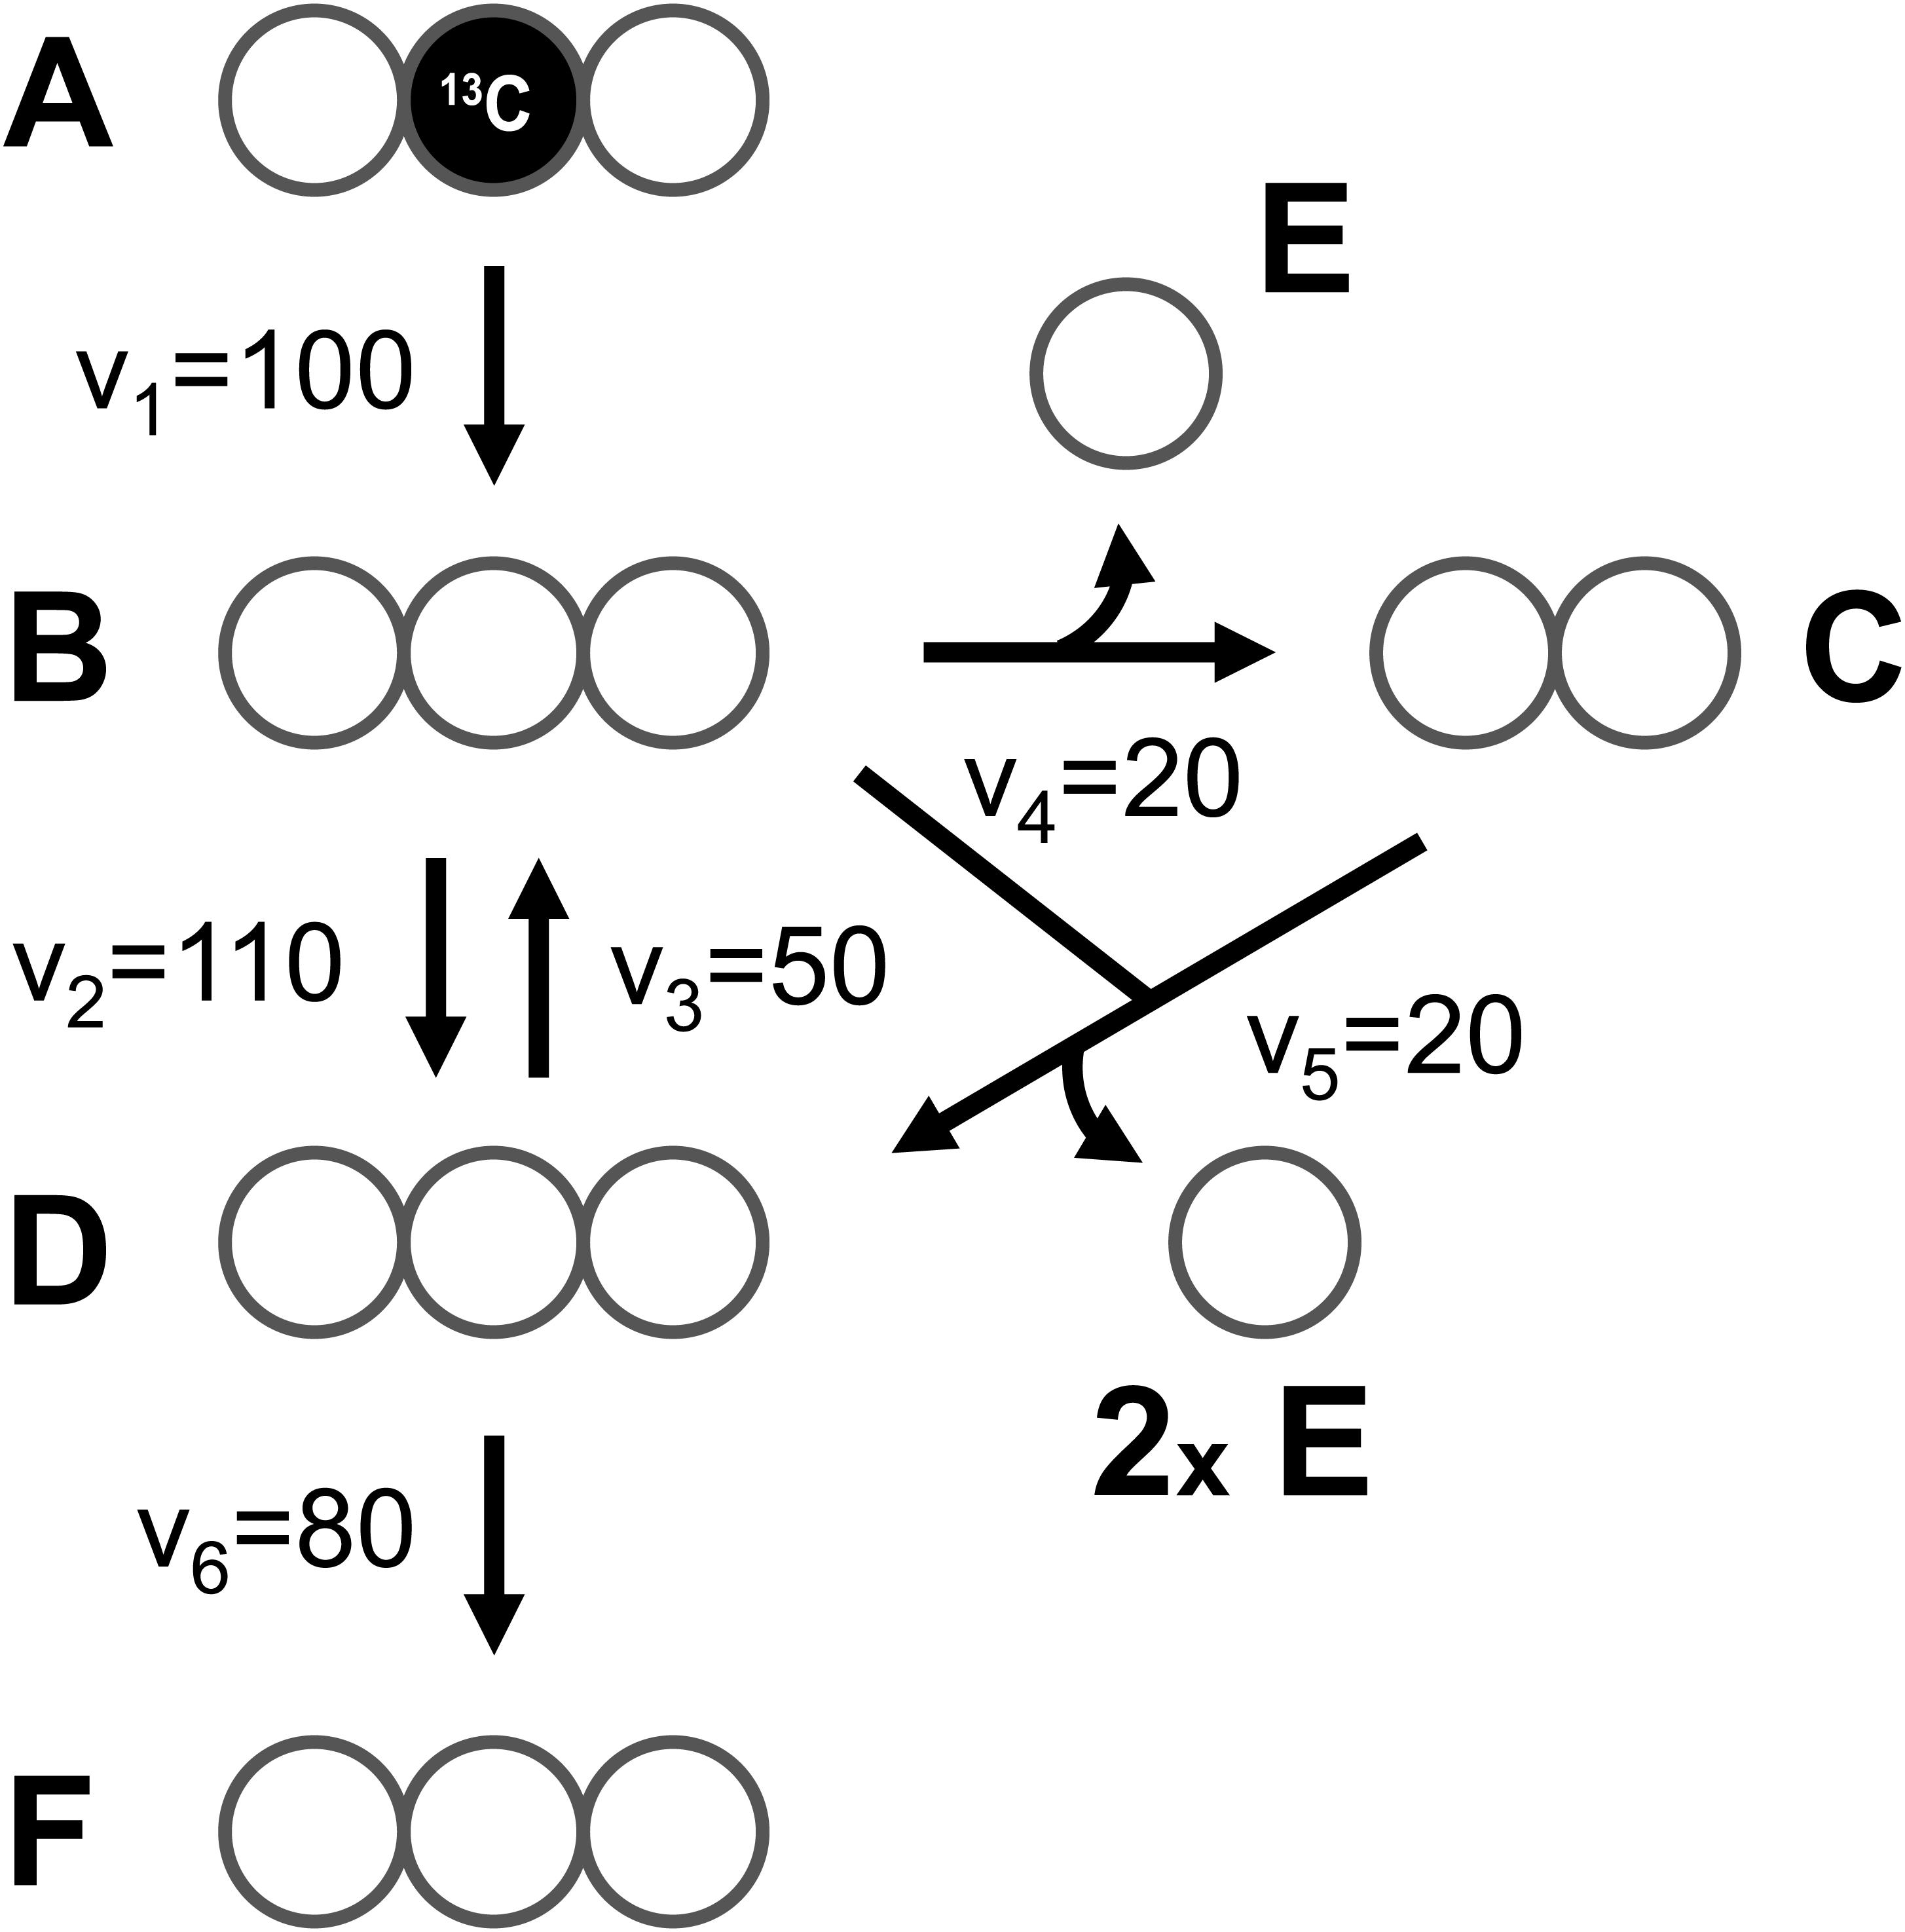
Figure 5. A simple example network model (taken from the original EMU paper), used here to illustrate simulation of tandem MS data using the EMU approach.
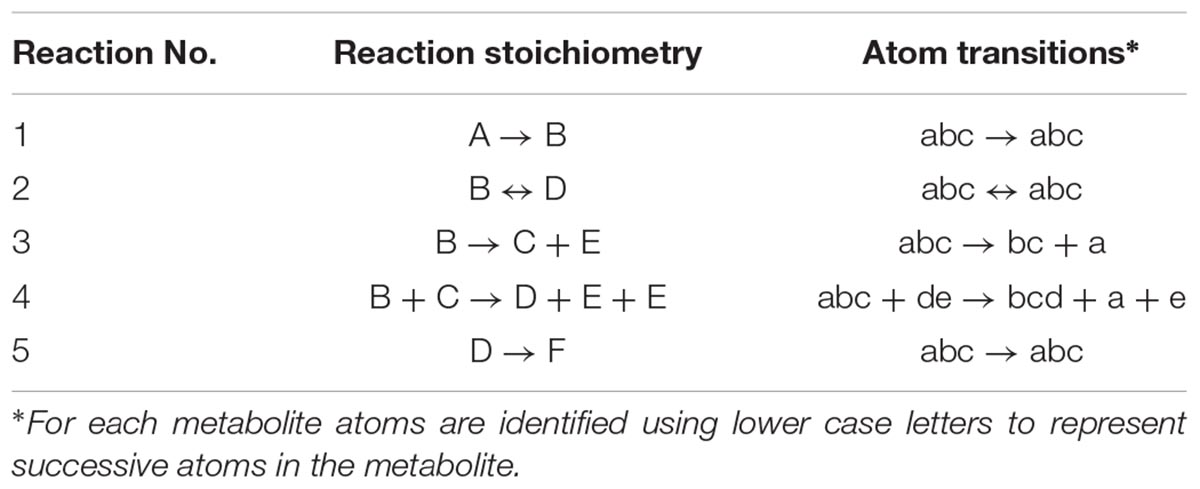
Table 1. Stoichiometry and atom transitions for the reactions in the example metabolic network.
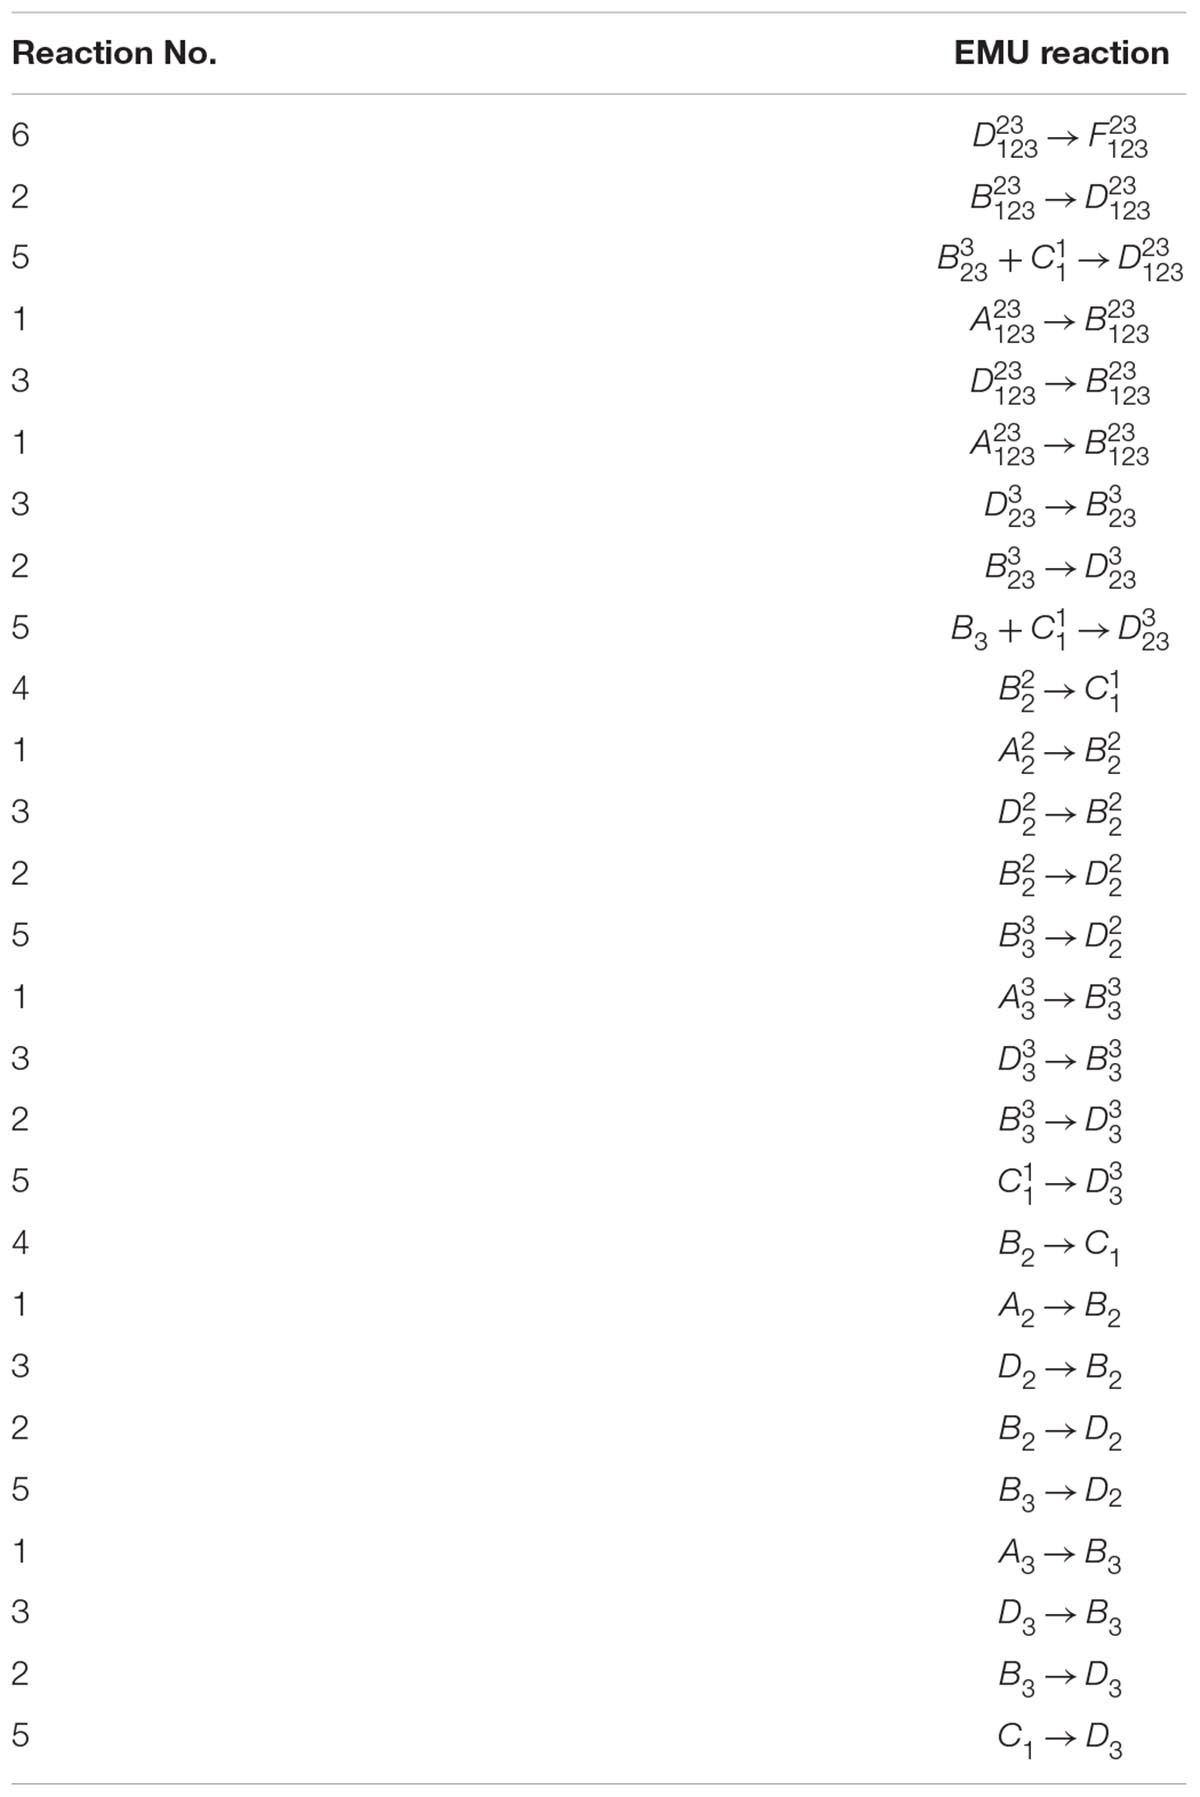
Table 2. EMU decomposition for F12323 in the example metabolic network.
13C-MFA With Tandem MS Data and the EMU Framework
To determine fluxes with 13C-MFA, isotopic labeling must be simulated by solving the EMU network models, which are represented mathematically in the form (see the original EMU paper for more details) (Antoniewicz et al., 2007b):
Here, A and B are matrices that are functions of fluxes, and X and Y are matrices that contain the unknown and known EMU variables, respectively. In the original EMU framework, each row in the X and Y matrices contained MID vectors of the respective EMU variables. For simulations of tandem MS data, X and Y are now 3-dimensional matrices that contain the compact tandem MS matrices of the respective EMU variables (Figure 6A). For convenience, these 3D matrices can be transformed into 2D matrices as shown in Figure 6B. By performing this 3D-to-2D transformation, the same EMU algorithms can be used to simulate tandem MS data that are used currently to simulate MS data. Thus, this allows current software packages to be upgraded easily to accommodate tandem MS measurements for flux calculations.
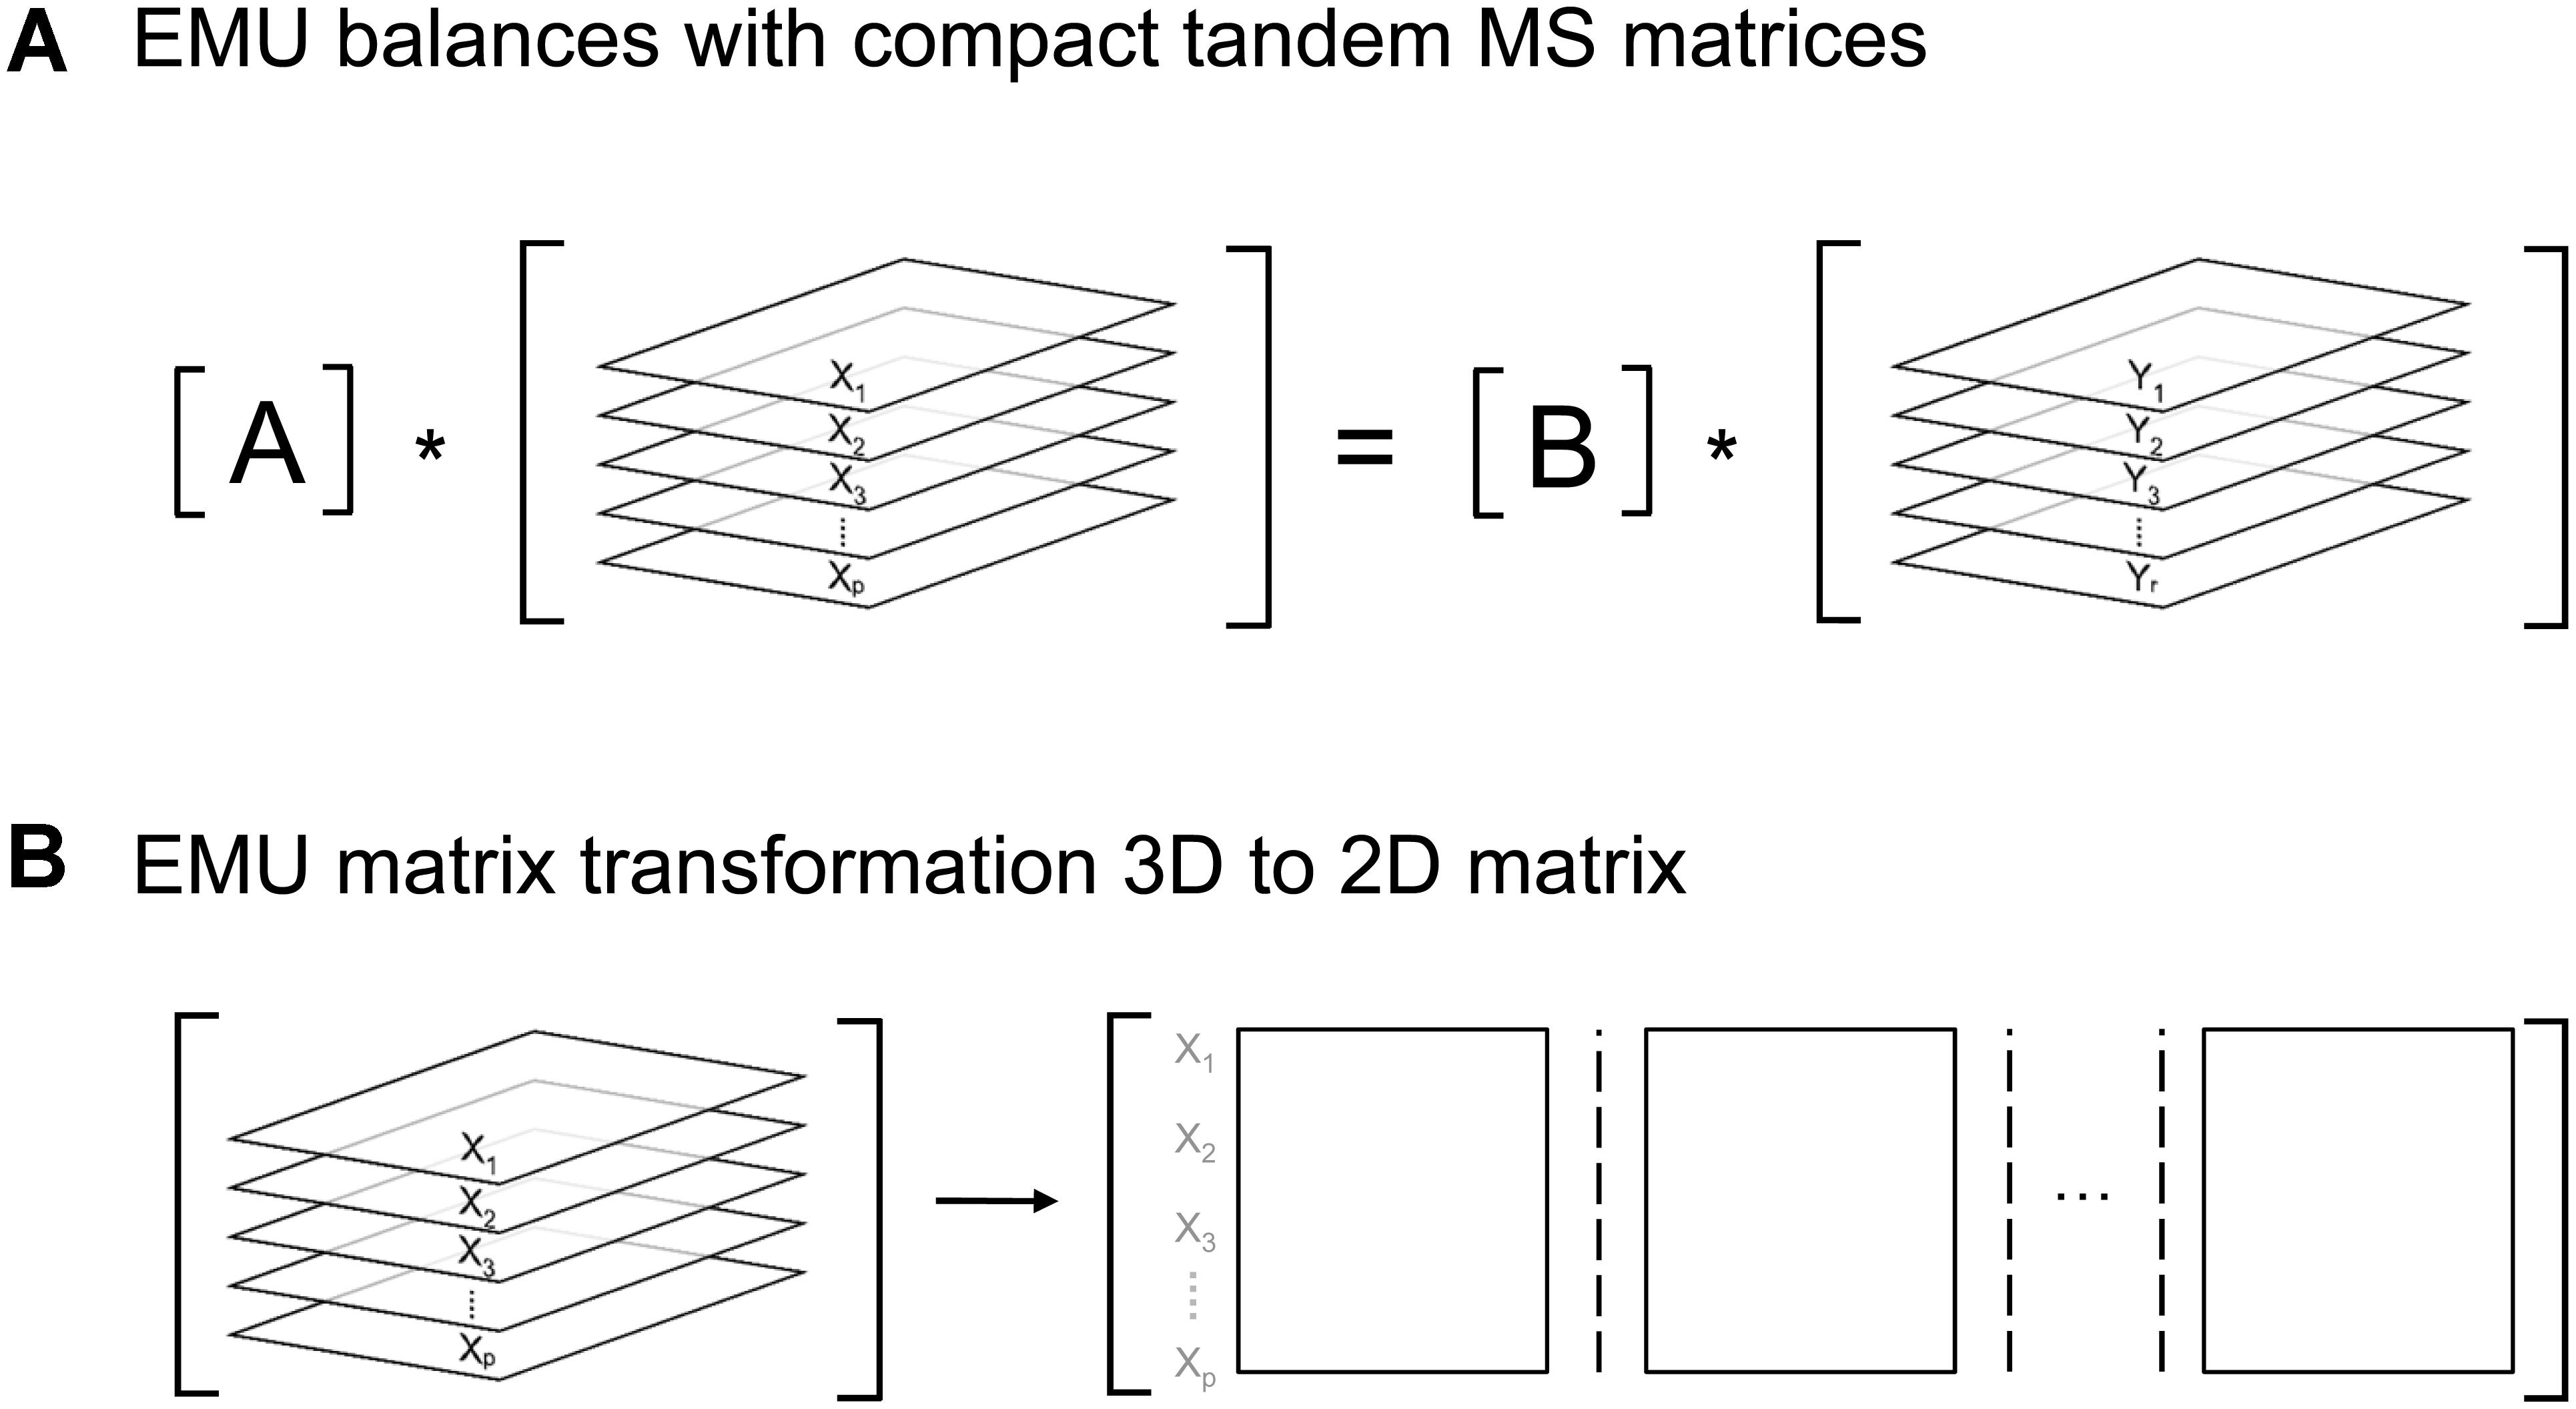
Figure 6. (A) Structure of EMU equations for simulation of tandem MS data. (B) 3D-matrices X and Y can be transformed into corresponding 2D-matrices for convenience.
To illustrate the simulation of tandem MS data using the EMU framework and compact tandem MS matrices, Figure 7 shows the EMU balances for the simple example model, and Figure 8 shows the numerical simulation results. Here, we used the fluxes shown in Figure 5 with metabolite A being 100% 13C-labeled at the second carbon position. This simple example clearly illustrates that tandem MS data can be efficiently simulated using the existing EMU framework without any major modifications. Recent work has demonstrated that EMU decompositions of large-scale models are computationally tractable (Gopalakrishnan and Maranas, 2015). Thus, the methods and algorithms presented in this paper can be applied to realistically sized network models.
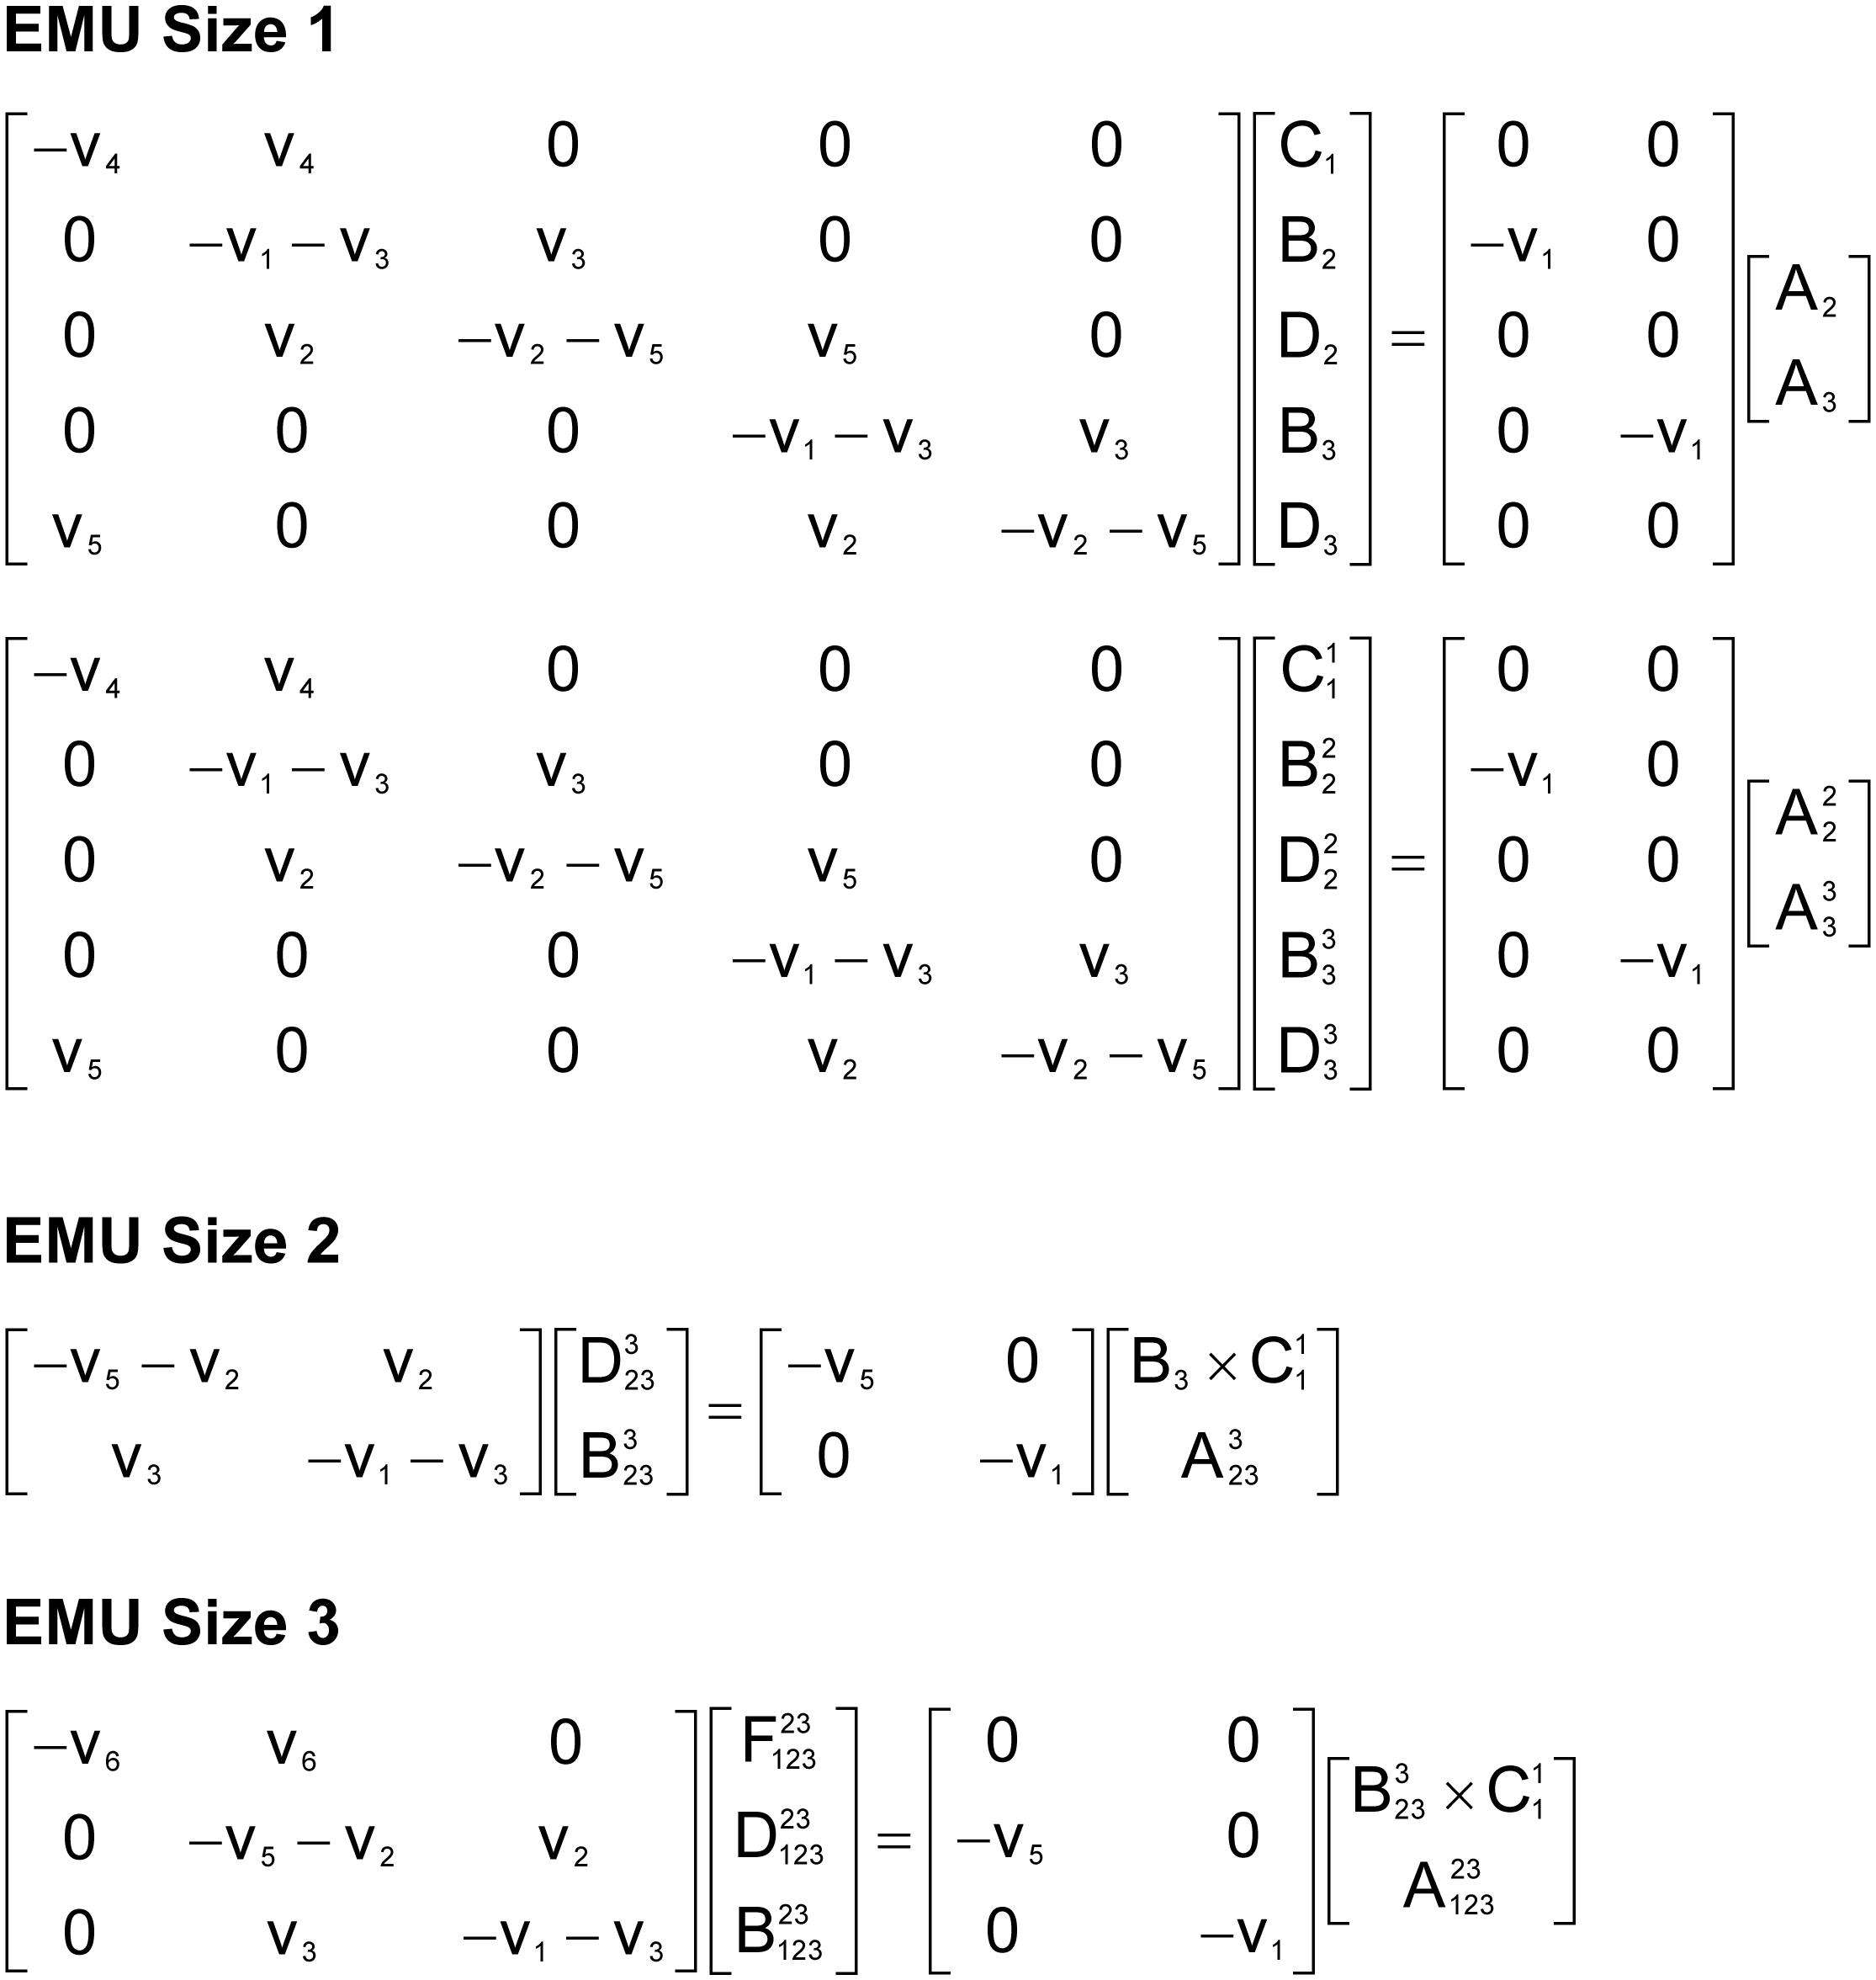
Figure 7. EMU balances for simulation of tandem MS data in the simple example network model (shown in Figure 5). The EMU balances were constructed based on the EMU model decomposition shown in Table 2.
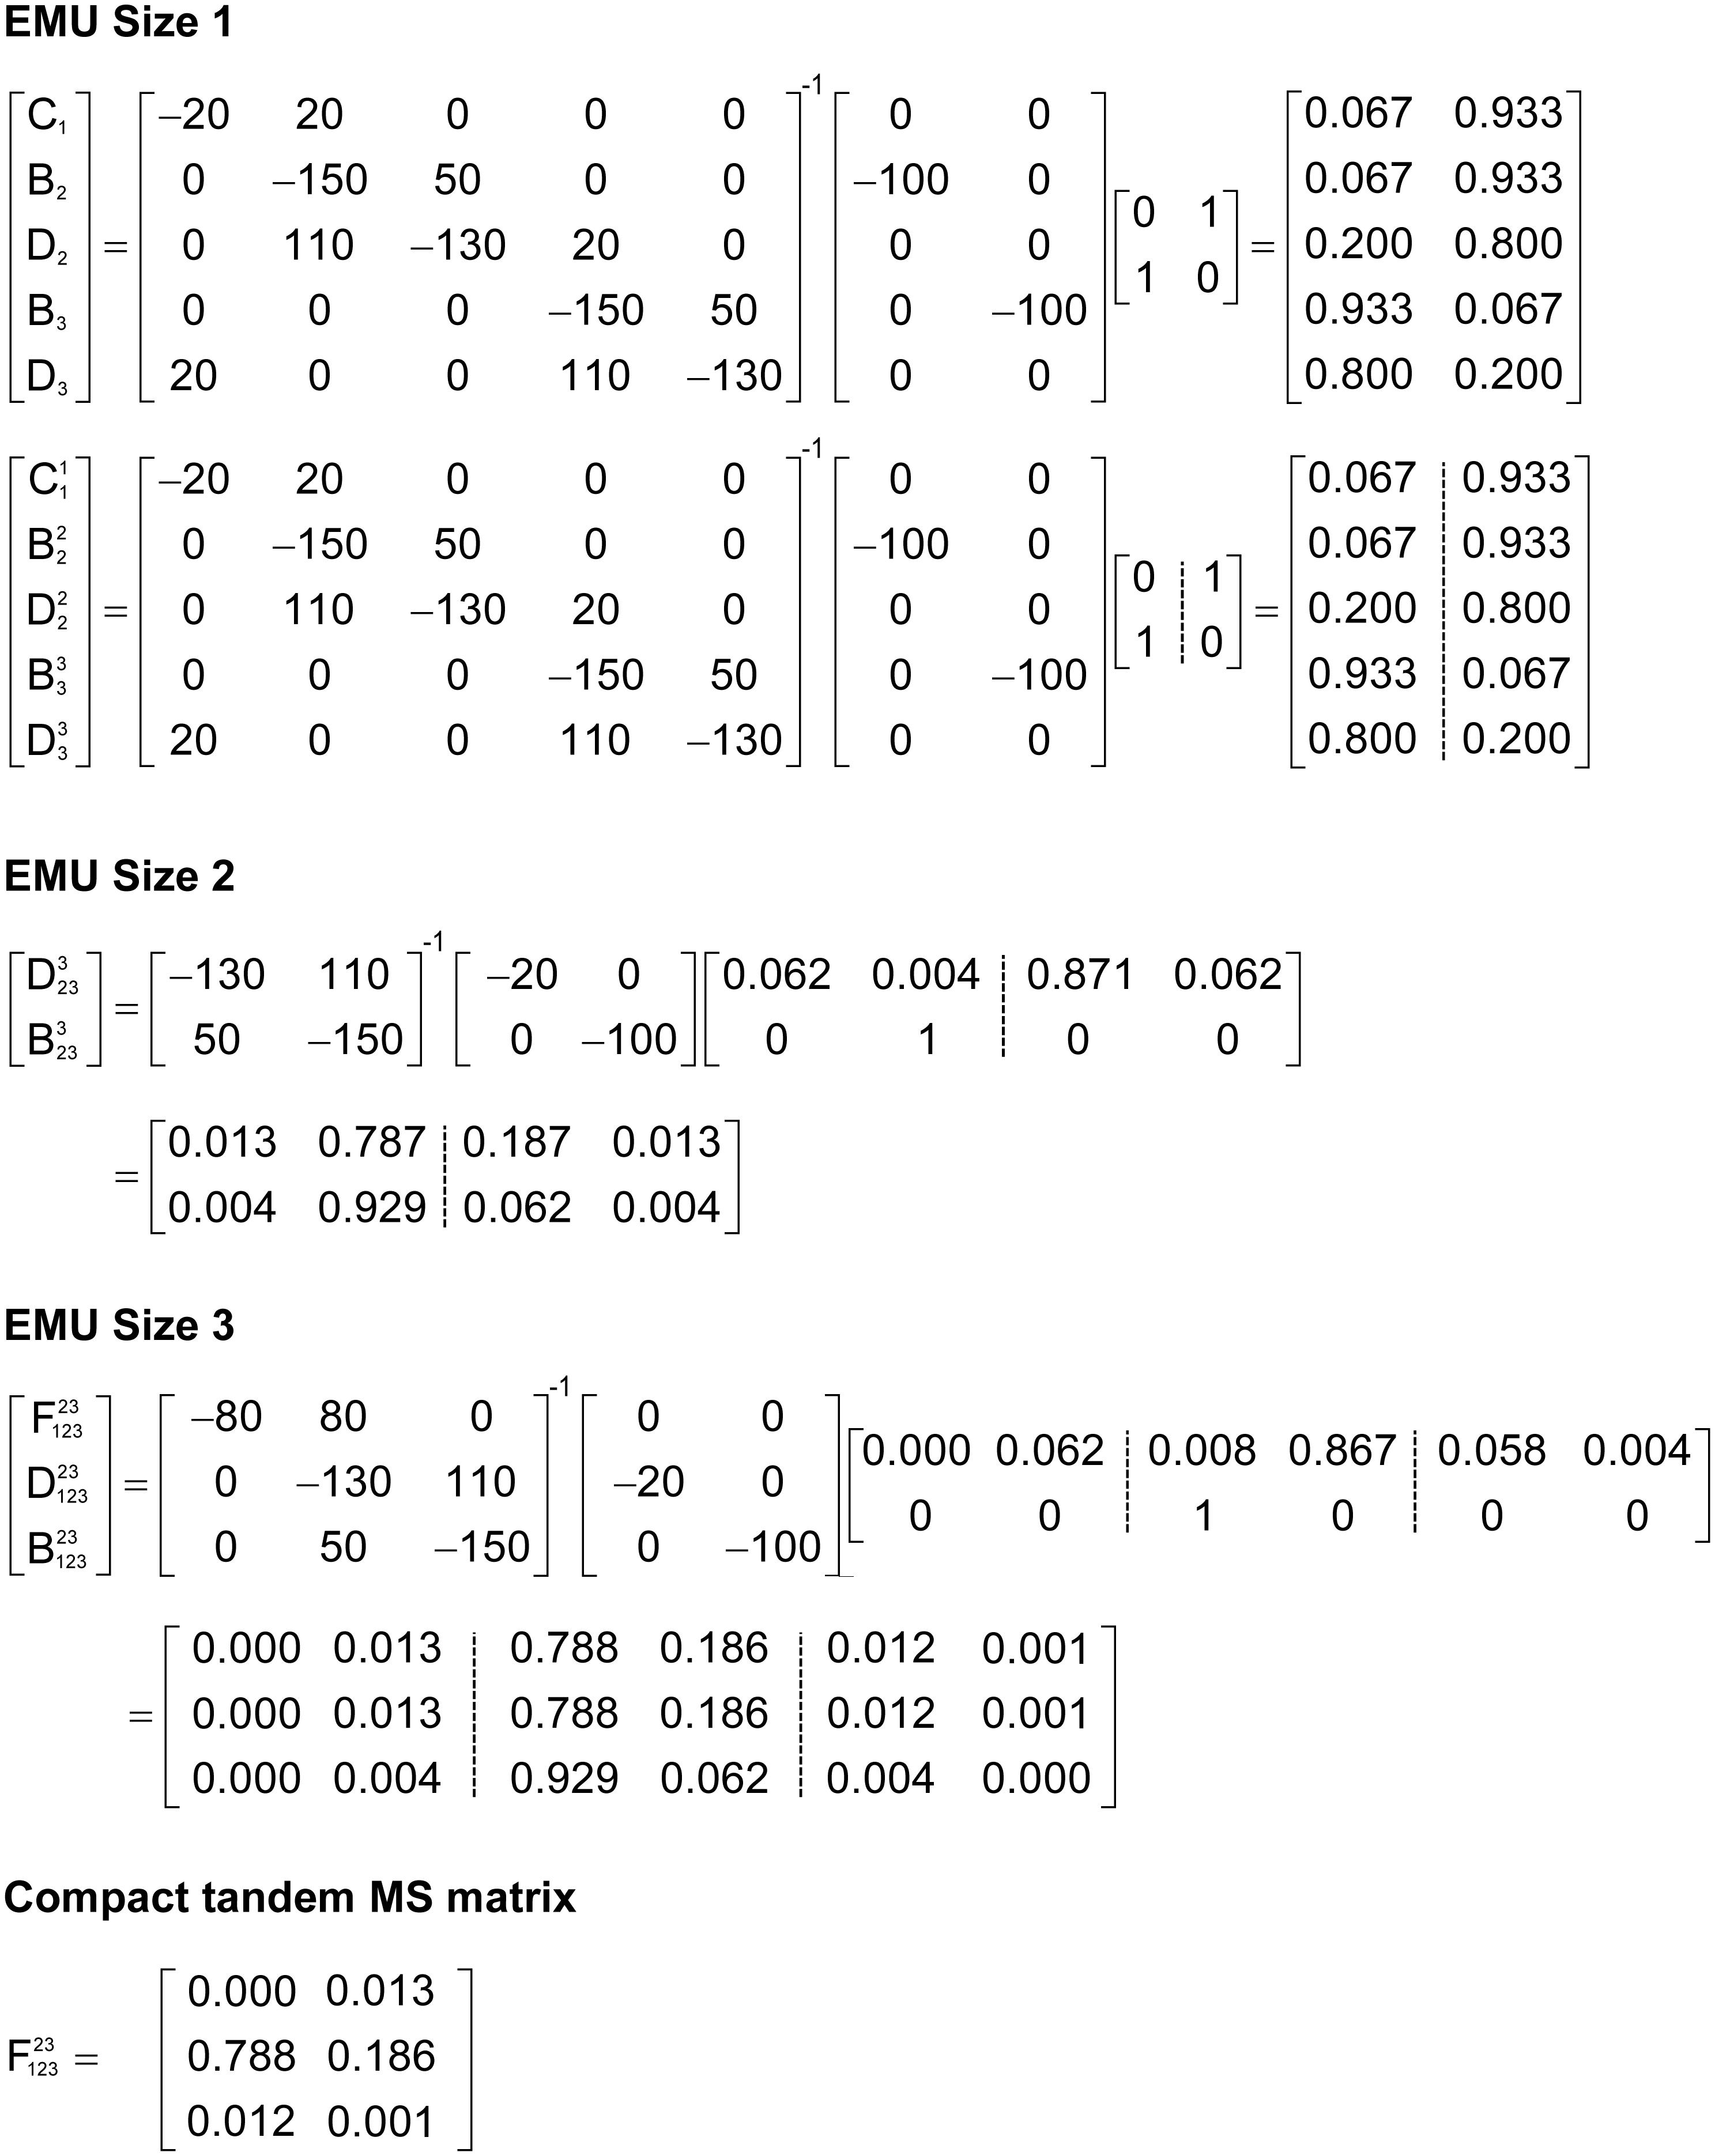
Figure 8. Numerical solution of the EMU balances for the simple example network to simulate tandem MS data for metabolite F (parent fragment C1–C3, daughter fragment C2–C3). For this simulation, the fluxes shown in Figure 5 were used and metabolite A was assumed to be 100% 13C-labeled at the second carbon position.
Concluding Remarks
Tandem mass spectrometry is a promising new analytical approach that provides additional labeling information for 13C-flux studies. Previously, we demonstrated that this additional labeling information can significantly improve flux precision and resolution in complex biological systems (Choi and Antoniewicz, 2011). In this paper, we have presented a set of tools and algorithms for efficient simulation of tandem MS data using the EMU framework and for correction of tandem MS data for natural isotope abundances. By building upon the EMU framework, which is used by all current software packages for 13C-MFA, we hope to accelerate the acceptance of tandem MS technique by 13C-MFA community and encourage software developers to include capabilities for tandem MS 13C-flux analysis in future software updates.
Author Contributions
All authors listed have made a substantial, direct and intellectual contribution to the work, and approved it for publication.
Funding
This work was supported by the NSF CAREER Award (CBET-1054120).
Conflict of Interest Statement
The authors declare that the research was conducted in the absence of any commercial or financial relationships that could be construed as a potential conflict of interest.
References
Ahn, W. S., Crown, S. B., and Antoniewicz, M. R. (2016). Evidence for transketolase-like TKTL1 flux in CHO cells based on parallel labeling experiments and (13)C-metabolic flux analysis. Metab. Eng. 37, 72–78. doi: 10.1016/j.ymben.2016.05.005
Antoniewicz, M. R. (2013). Tandem mass spectrometry for measuring stable-isotope labeling. Curr. Opin. Biotechnol. 24, 48–53. doi: 10.1016/j.copbio.2012.10.011
Antoniewicz, M. R. (2015a). Methods and advances in metabolic flux analysis: a mini-review. J. Ind. Microbiol. Biotechnol. 42, 317–325. doi: 10.1007/s10295-015-1585-x
Antoniewicz, M. R. (2015b). Parallel labeling experiments for pathway elucidation and 13C metabolic flux analysis. Curr. Opin. Biotechnol. 36, 91–97. doi: 10.1016/j.copbio.2015.08.014
Antoniewicz, M. R., Kelleher, J. K., and Stephanopoulos, G. (2007a). Accurate assessment of amino acid mass isotopomer distributions for metabolic flux analysis. Anal. Chem. 79, 7554–7559.
Antoniewicz, M. R., Kelleher, J. K., and Stephanopoulos, G. (2007b). Elementary metabolite units (EMU): a novel framework for modeling isotopic distributions. Metab. Eng. 9, 68–86.
Antoniewicz, M. R., Kelleher, J. K., and Stephanopoulos, G. (2011). Measuring deuterium enrichment of glucose hydrogen atoms by gas chromatography/mass spectrometry. Anal. Chem. 83, 3211–3216. doi: 10.1021/ac200012p
Chandra, R., and Peng, L. (2012). “Application of Cooperative Convolution Optimization for 13C Metabolic Flux Analysis: Simulation of Isotopic Labeling Patterns Based on Tandem Mass Spectrometry Measurements,” in Simulated Evolution and Learning. SEAL 2012. Lecture Notes in Computer Science, Vol. 7673, eds L. T. Bui, Y. S. Ong, N. X. Hoai, H. Ishibuchi, and P. N. Suganthan (Heidelberg:Springer).
Choi, J., and Antoniewicz, M. R. (2011). Tandem mass spectrometry: a novel approach for metabolic flux analysis. Metab. Eng. 13, 225–233. doi: 10.1016/j.ymben.2010.11.006
Choi, J., Grossbach, M. T., and Antoniewicz, M. R. (2012). Measuring complete isotopomer distribution of aspartate using gas chromatography/tandem mass spectrometry. Anal. Chem. 84, 4628–4632. doi: 10.1021/ac300611n
Crown, S. B., and Antoniewicz, M. R. (2012). Selection of tracers for 13C-metabolic flux analysis using elementary metabolite units (EMU) basis vector methodology. Metab. Eng. 14, 150–161. doi: 10.1016/j.ymben.2011.12.005
Fernandez, C. A., Des Rosiers, C., Previs, S. F., David, F., and Brunengraber, H. (1996). Correction of 13C mass isotopomer distributions for natural stable isotope abundance. J. Mass Spectrom. 31, 255–262. doi: 10.1002/(SICI)1096-9888(199603)31:3<255::AID-JMS290>3.0.CO;2-3
Gopalakrishnan, S., and Maranas, C. D. (2015). 13C metabolic flux analysis at a genome-scale. Metab. Eng. 32, 12–22. doi: 10.1016/j.ymben.2015.08.006
Jeffrey, F. M., Roach, J. S., Storey, C. J., Sherry, A. D., and Malloy, C. R. (2002). 13C isotopomer analysis of glutamate by tandem mass spectrometry. Anal. Biochem. 300, 192–205. doi: 10.1006/abio.2001.5457
Masakapalli, S. K., Ratcliffe, R. G., and Williams, T. C. (2014). Quantification of (1)(3)C enrichments and isotopomer abundances for metabolic flux analysis using 1D NMR spectroscopy. Methods Mol. Biol. 1090, 73–86. doi: 10.1007/978-1-62703-688-7_5
McConnell, B. O., and Antoniewicz, M. R. (2016). Measuring the composition and stable-isotope labeling of algal biomass carbohydrates via gas chromatography/mass spectrometry. Anal. Chem. 88, 4624–4628. doi: 10.1021/acs.analchem.6b00779
Niedenfuhr, S., Ten Pierick, A., Van Dam, P. T., Suarez-Mendez, C. A., Noh, K., and Wahl, S. A. (2016). Natural isotope correction of MS/MS measurements for metabolomics and (13)C fluxomics. Biotechnol. Bioeng. 113, 1137–1147. doi: 10.1002/bit.25859
Okahashi, N., Kawana, S., Iida, J., Shimizu, H., and Matsuda, F. (2016). GC-MS/MS survey of collision-induced dissociation of tert-butyldimethylsilyl-derivatized amino acids and its application to (13)C-metabolic flux analysis of Escherichia coli central metabolism. Anal. Bioanal. Chem. 408, 6133–6140. doi: 10.1007/s00216-016-9724-4
Quek, L. E., Wittmann, C., Nielsen, L. K., and Kromer, J. O. (2009). OpenFLUX: efficient modelling software for 13C-based metabolic flux analysis. Microb. Cell Fact. 8:25. doi: 10.1186/1475-2859-8-25
Rantanen, A., Rousu, J., Kokkonen, J. T., Tarkiainen, V., and Ketola, R. A. (2002). Computing positional isotopomer distributions from tandem mass spectrometric data. Metab. Eng. 4, 285–294. doi: 10.1006/mben.2002.0232
Tepper, N., and Shlomi, T. (2015). Efficient modeling of MS/MS data for metabolic flux analysis. PLoS One 10:e0130213. doi: 10.1371/journal.pone.0130213
Weitzel, M., Noh, K., Dalman, T., Niedenfuhr, S., Stute, B., and Wiechert, W. (2013). 13CFLUX2–high-performance software suite for 13C-metabolic flux analysis. Bioinformatics 29, 143–145. doi: 10.1093/bioinformatics/bts646
Yoo, H., Antoniewicz, M. R., Stephanopoulos, G., and Kelleher, J. K. (2008). Quantifying reductive carboxylation flux of glutamine to lipid in a brown adipocyte cell line. J. Biol. Chem. 283, 20621–20627. doi: 10.1074/jbc.M706494200
Young, J. D. (2014). INCA: a computational platform for isotopically non-stationary metabolic flux analysis. Bioinformatics 30, 1333–1335. doi: 10.1093/bioinformatics/btu015
Keywords: elementary metabolite units, metabolic flux analysis, tandem mass spectrometry, stable isotope tracers, metabolism
Citation: Choi J and Antoniewicz MR (2019) Tandem Mass Spectrometry for 13C Metabolic Flux Analysis: Methods and Algorithms Based on EMU Framework. Front. Microbiol. 10:31. doi: 10.3389/fmicb.2019.00031
Received: 30 October 2018; Accepted: 09 January 2019;
Published: 24 January 2019.
Edited by:
Yinjie Tang, Washington University in St. Louis, United StatesReviewed by:
Lifeng Peng, Victoria University of Wellington, New ZealandChao Wu, National Renewable Energy Laboratory (DOE), United States
Copyright © 2019 Choi and Antoniewicz. This is an open-access article distributed under the terms of the Creative Commons Attribution License (CC BY). The use, distribution or reproduction in other forums is permitted, provided the original author(s) and the copyright owner(s) are credited and that the original publication in this journal is cited, in accordance with accepted academic practice. No use, distribution or reproduction is permitted which does not comply with these terms.
*Correspondence: Maciek R. Antoniewicz, bXJhbnRvbkB1ZGVsLmVkdQ==