 Robert J. W. Brewin1,2*
 Xosé Anxelu G. Morán3
 Dionysios E. Raitsos2,4
 John A. Gittings5
 Maria Ll. Calleja3,6
 Miguel Viegas3
 Mohd I. Ansari3
 Najwa Al-Otaibi3
 Tamara M. Huete-Stauffer3
 Ibrahim Hoteit5
- 1College of Life and Environmental Sciences, University of Exeter, Cornwall, United Kingdom
- 2National Centre for Earth Observation, Plymouth Marine Laboratory, Plymouth, United Kingdom
- 3Division of Biological and Environmental Sciences and Engineering, Red Sea Research Center, King Abdullah University for Science and Technology, Thuwal, Saudi Arabia
- 4Department of Biology, National and Kapodistrian University of Athens, Athens, Greece
- 5Department of Earth Science and Engineering, King Abdullah University of Science and Technology, Thuwal, Saudi Arabia
- 6Department of Climate Geochemistry, Max Planck Institute for Chemistry, Mainz, Germany
Phytoplankton biomass and size structure are recognized as key ecological indicators. With the aim to quantify the relationship between these two ecological indicators in tropical waters and understand controlling factors, we analyzed the total chlorophyll-a concentration, a measure of phytoplankton biomass, and its partitioning into three size classes of phytoplankton, using a series of observations collected at coastal sites in the central Red Sea. Over a period of 4 years, measurements of flow cytometry, size-fractionated chlorophyll-a concentration, and physical-chemical variables were collected near Thuwal in Saudi Arabia. We fitted a three-component model to the size-fractionated chlorophyll-a data to quantify the relationship between total chlorophyll and that in three size classes of phytoplankton [pico- (<2 μm), nano- (2–20 μm) and micro-phytoplankton (>20 μm)]. The model has an advantage over other more empirical methods in that its parameters are interpretable, expressed as the maximum chlorophyll-a concentration of small phytoplankton (pico- and combined pico-nanophytoplankton, and , respectively) and the fractional contribution of these two size classes to total chlorophyll-a as it tends to zero (Dp and Dp,n). Residuals between the model and the data (model minus data) were compared with a range of other environmental variables available in the dataset. Residuals in pico- and combined pico-nanophytoplankton fractions of total chlorophyll-a were significantly correlated with water temperature (positively) and picoeukaryote cell number (negatively). We conducted a running fit of the model with increasing temperature and found a negative relationship between temperature and parameters and and a positive relationship between temperature and parameters Dp and Dp,n. By harnessing the relative red fluorescence of the flow cytometric data, we show that picoeukaryotes, which are higher in cell number in winter (cold) than summer (warm), contain higher chlorophyll per cell than other picophytoplankton and are slightly larger in size, possibly explaining the temperature shift in model parameters, though further evidence is needed to substantiate this finding. Our results emphasize the importance of knowing the water temperature and taxonomic composition of phytoplankton within each size class when understanding their relative contribution to total chlorophyll. Furthermore, our results have implications for the development of algorithms for inferring size-fractionated chlorophyll from satellite data, and for how the partitioning of total chlorophyll into the three size classes may change in a future ocean.
1. Introduction
Phytoplankton are a critical component of the Earth's system. Absorbing incoming solar radiation, CO2 and synthesizing organic matter, they are responsible for half of the planetary primary production (Longhurst et al., 1995; Field et al., 1998), modulate oceanic carbon, and provide energy for the majority of marine life. Light absorption by phytoplankton in the ocean is dependent on its biomass. Most of the light absorbed by phytoplankton is lost as heat, thus variations in phytoplankton biomass modulate solar heating in the ocean (Sathyendranath et al., 1991). A small component of absorbed light is used by phytoplankton in photosynthesis, making phytoplankton biomass critical for marine primary production and for energy transfer to higher trophic levels, impacting global fisheries catch (Chassot et al., 2010).
A second important characteristic of phytoplankton is its size structure. A suite of phytoplankton biochemical functions are controlled by size, including: metabolic rate, growth and nutrient uptake (Platt and Jassby, 1976; Platt and Denman, 1977, 1978; Maloney and Field, 1991; Chisholm, 1992; Marañón, 2009, 2015; Finkel et al., 2010). The absorption of light by an assemblage of phytoplankton of known biomass varies with size structure (Morel and Bricaud, 1981; Prieur and Sathyendranath, 1981; Bricaud et al., 2004; Devred et al., 2006; Brewin et al., 2011). Therefore, phytoplankton size also influences photosynthetic rate and ocean heating (Sathyendranath and Platt, 2007; Uitz et al., 2008; Brewin et al., 2017b). The sinking rates of phytoplankton are impacted by size, with large-celled phytoplankton thought to be responsible for a large fraction of export production and small-celled phytoplankton for recycled production (Eppley and Peterson, 1979; Michaels and Silver, 1988; Boyd and Newton, 1999; Laws et al., 2000; Guidi et al., 2009; Briggs et al., 2011; Mouw et al., 2016), at the same time acknowledging small-celled phytoplankton carbon export can also be significant (Mouw et al., 2016; Richardson, 2019). The size of phytoplankton is also thought to influence the structure of the marine food chain (Legendre and Le Fevre, 1991; Maloney and Field, 1991). These are some of the reasons why phytoplankton biomass and size structure are considered as two key ecological indicators in the marine environment (Platt and Sathyendranath, 2008).
A common measure of phytoplankton biomass is the total chlorophyll-a concentration (representing the sum of mono- and divinyl chlorophyll-a, chlorophyllide-a, and the allomeric and epimeric forms of chlorophyll-a, hereafter referred to collectively as total chlorophyll), the major photosynthetic pigment in marine phytoplankton. Unlike phytoplankton carbon, which is more difficult to measure, total chlorophyll can be routinely estimated in situ (e.g., fluorometrically or using High Performance Liquid Chromatography, HPLC) or through satellite remote-sensing of ocean color (O'Reilly et al., 1998). Conventionally, phytoplankton size structure is quantified by partitioning biomass (total chlorophyll) into three size classes [pico- (<2 μm), nano- (2–20 μm) and micro-phytoplankton (>20 μm); Sieburth et al., 1978], with the role of each thought to differ in the cycling of key elements such as carbon, with taxonomic composition, nutrient concentrations and environmental conditions influencing the composition of the three size classes (IOCCG, 2014).
The relationship between total chlorophyll and that contained in each of the three size classes has been studied thoroughly in some regions (Raimbault et al., 1988; Chisholm, 1992; Goericke, 2011; Marañón et al., 2012; López-Urrutia and Morán, 2015), with picophytoplankton known to contribute most to total chlorophyll at low concentrations, nanophytoplankton at intermediate concentrations, and microphytoplankton at high concentrations (IOCCG, 2014). This relationship has been quantified statistically (Uitz et al., 2006), empirically (Hirata et al., 2011) and more mechanistically (Brewin et al., 2010; Devred et al., 2011), at local and global scales (IOCCG, 2014). One approach to modeling this relationship, that has proven to be a popular choice (e.g., Brotas et al., 2013; Lin et al., 2014; Sammartino et al., 2015; Sahay et al., 2017; Hu et al., 2018; Lamont et al., 2018; Liu et al., 2018; Sun et al., 2018), is the three-component model of Brewin et al. (2010). The model is based on two exponential functions (Sathyendranath et al., 2001; Devred et al., 2006) that relate the fraction of total chlorophyll by combined pico- and nanophytoplankton (Fp,n, cells <20 μm) and picophytoplankton (Fp, cells <2 μm) to total chlorophyll concentration (C) according to
and
Model parameters are relatively easy to interpret, with and representing the asymptotic maximum chlorophyll concentrations for the associated size classes (<20 μm and <2 μm, respectively), and Dp,n and Dp representing the fraction of each size-class relative to total chlorophyll as total chlorophyll tends to zero. Once suitable parameters are obtained, and Fp,n and Fp derived, the fractions of nano- (Fn) and micro-phytoplankton (Fm) can be computed as Fn = Fp,n − Fp and Fm = 1 − Fp,n. The chlorophyll concentration in each size class (Cp, Cn, and Cm) can be calculated simply by multiplying the fractions (Fp, Fn, and Fm) by total chlorophyll (C). Table 1 defines variables, parameters and abbreviations used in the manuscript.
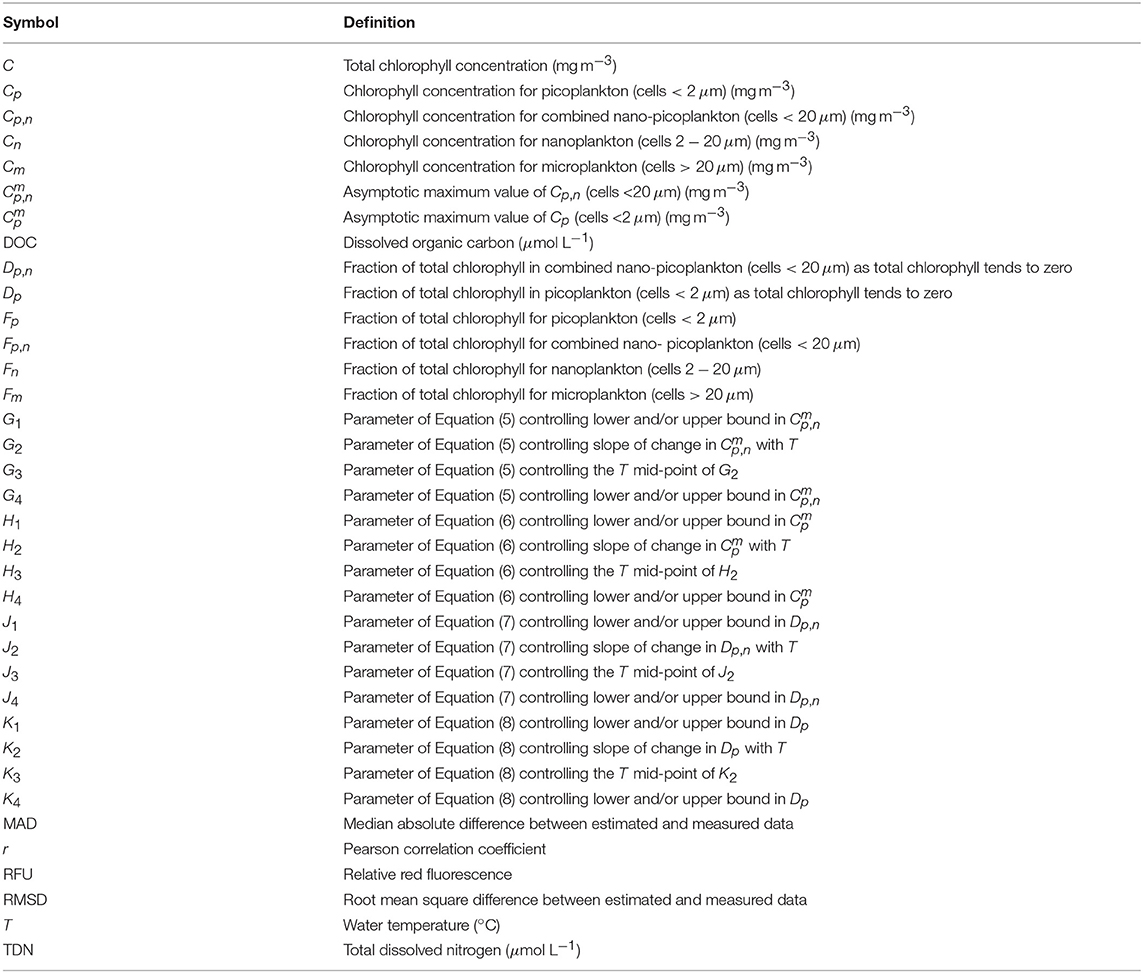
Table 1. Symbols and definitions.
Although such models have proven successful at capturing the relationship between total chlorophyll and chlorophyll contained in each size class, it has been recognized that such relationships may be perturbed by climate variability (Brewin et al., 2012; Racault et al., 2014; Agirbas et al., 2015), potentially impacting how the marine ecosystem functions (Sathyendranath et al., 2017). Furthermore, relationships have been shown to differ with changes in environmental conditions, for example, with changes in water temperature and light availability (Brewin et al., 2015b, 2017a; Ward, 2015). To predict the response of the marine ecosystem to fluctuations in climate, it is critical to improve our understanding of how the relationships between these two key ecological indicators may change with changing environmental conditions. Among the warmest and most saline waters on the planet (Longhurst, 2007; Belkin, 2009; Raitsos et al., 2011; Yao et al., 2014a,b), and believed to reflect environmental conditions predicted in other marine regions decades from now (Christensen et al., 2007), the Red Sea is an interesting location to explore relationships between these indicators and environmental variability.
In this study, we make use of a dataset collected in coastal waters of the central Red Sea over a 4-year period, consisting of measurements of total chlorophyll, size-fractionated chlorophyll, picophytoplankton (abundance and cell properties by flow cytometry) and nutrient concentrations. We use these data, together with the three-component model of Brewin et al. (2010), with the aim to quantify the relationship between total and size-fractionated chlorophyll in tropical waters and improve our understanding on what controls this relationship. Specifically, we aim to address the following two research questions: (1) Is the relationship between total and size-fractionated chlorophyll in coastal waters of the Red Sea consistent with that observed in other ocean basins? (2) What factors influence the relationship between total and size-fractionated chlorophyll?
2. Methods
2.1. Study Area: Coastal Waters of the Red Sea
The chosen study site was located in the central Red Sea (Figure 1A) in the coastal waters near Thuwal in the Kingdom of Saudi Arabia (Figure 1B). We made use of water samples collected by King Abdullah University for Science and Technology (KAUST) at three locations: (1) in KAUST harbor (22.3065°N, 39.1029°E; Silva et al., 2019), where weekly sampling of surface waters was conducted between 2015 and 2017 and monthly sampling of surface waters during 2018; (2) near King Abdullah Economic City (KAEC, 22.4712°N, 39.0345°E, ~700 m depth; Calleja et al., 2018), where surface waters (5 m depth) were sampled around midday covering the seasonal variability between 2015 and 2017, on board of KAUST R.V. Thuwal and KAUST R.V. Explorer; and (3) near Abushusha reef, just offshore from KAUST (22.321°N, 39.027°E; see Figure 1B), at the surface of a ~70 m depth station, sampled on a monthly basis during 2018 on board the KAUST Durrat Al-Bahr Almar 1 and 5 vessels. All water samples were collected during daylight hours (08:30–14:30 local time) using a pre-clean (acid-washed) polycarbonate 9 L carboy (KAUST Harbor and Abushusha reef) or Niskin bottles (the rest of the sampling).
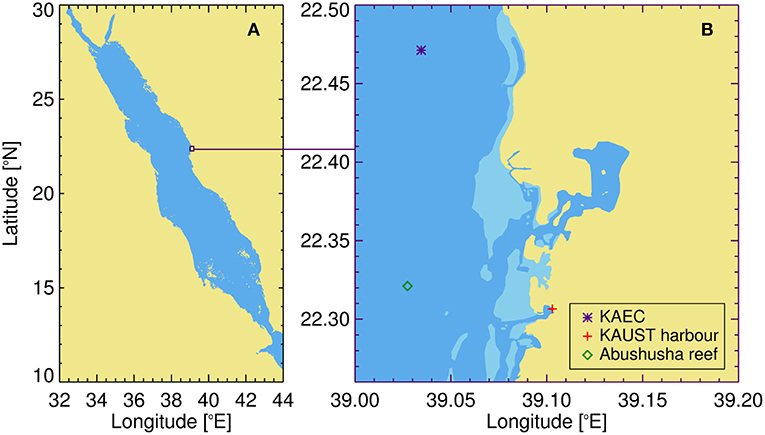
Figure 1. Study site. (A) Location of the study site with respect to the broader Red Sea. (B) Study site near the coastal waters of Thuwal in the Kingdom of Saudi Arabia and the locations of the three datasets used in the study. KAEC refers to the King Abdullah Economic City and KAUST to the King Abdullah University for Science and Technology.
2.2. Size-Fractionated Filtration (SFF) Data
The size-fractionated filtration (SFF) method for determining the chlorophyll concentration in each size class involves filtering water through filters of different pore sizes. For each water sample collected, 200 ml of sea water were filtered sequentially through 20, 2, and 0.2 μm polycarbonate filters. Following filtration, the filters were stored at −80°C for at least 24 h. Pigment extraction was made by submerging the filters in 90 % acetone for 24 h at 4°C. Samples were then analyzed using a Triology Fluorometer (Turner Designs), pre- and post-calibrated using pure chlorophyll-a as a standard (Anacustis nidulans, Sigma Aldrich). The total chlorophyll concentration was taken as the sum of the size fractions for each sample. The concentration of chlorophyll passing through the 2 μm filter and retained on the 0.2 μm filter was designated as picophytoplankton chlorophyll (Cp), that passing through the 20 μm filter was designated as pico- and nano-phytoplankton chlorophyll (Cp,n), the chlorophyll retained on the 20 μm filter was designated as microphytoplankton chlorophyll (Cm), and the concentration of chlorophyll retained on the 2 μm filter, having passed through the 20 μm filter, was designated as nanophytoplankton chlorophyll (Cn). The fractions of each size class relative to total chlorophyll (Fp, Fp,n, Fn, and Fm) were computed by dividing the chlorophyll concentration in each size class (Cp, Cp,n, Cn, and Cm) by total chlorophyll concentration (C). In total, 136 SFF samples were available, 8 from KAEC, 116 from KAUST harbor and 12 from Abushusha reef.
2.3. Model Parameterization
Model parameters (, , Dp,n, and Dp) for the three-component model of Brewin et al. (2010) were derived by fitting Equations (1) and (2) using a standard, nonlinear least-squared fitting procedure (Levenberg-Marquardt, IDL Routine MPFITFUN, Moré, 1978; Markwardt, 2008) using the Fp, Fp,n and C SFF data as input. The parameters Dp,n and Dp were constrained to be less than or equal to one, since size-fractionated chlorophyll cannot exceed total chlorophyll. The method of bootstrapping (Efron, 1979; Brewin et al., 2015b) was used to randomly resample (utilizing IDL Routine RANDOMU) with replacement the dataset and re-fit equations for each iteration (1,000 iterations). Median values and 95% confidence intervals were taken from the resulting parameter distributions (see Table 2). Model parameters are compared with other model fits using SFF data in other ocean basins (Table 2).
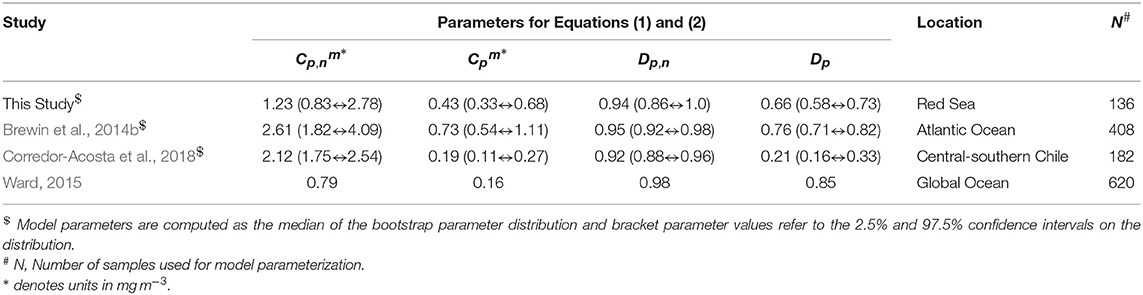
Table 2. Parameter values for Equations (1) and (2) compared with parameters derived using the size-fractionated filtration (SFF) method in other regions.
2.4. Flow Cytometry, Nutrient Sampling and Physical Variables
For the 136 samples with SFF data, measurements of flow cytometry, nutrients, dissolved organic carbon (DOC) and total dissolved nitrogen (TDN) were also collected. The abundances of three picophytoplankton groups, Prochlorococcus, Synechococcus and picoeukaryotes, were obtained from each water sample using BD FACSCanto flow cytometer, applying the methodology as detailed in Gasol and Morán (2015). We measured the red fluorescence as a proxy for the chlorophyll content and the right angle light scatter or side scatter (SSC) as a proxy of cell size, following Calvo-Díaz and Morán (2006). These values were made relative to those of the 1 μm latex fluorescent beads added to each sample as internal standard (Molecular Probes, ref. F-13081). The empirical calibration between relative SSC and cell diameter described in Calvo-Díaz and Morán (2006) was used to estimate the cell size of each of the three picophytoplankton groups.
Nutrients were measured by filtering seawater through pre-combusted (450 °C, 4.5 h) GF/F filters. The samples were subsequently frozen and stored at −20°C until analysis. Nitrate, nitrite, silicate, and phosphate were analyzed using a segmented flow analyzer from Seal Analytical, with standards prepared in acid-washed glassware using a nutrient-free artificial seawater matrix (Silva et al., 2019). Samples for DOC and TDN analysis were passed through an online acid-cleaned polycarbonate filter cartridge, holding a pre-combusted (450 °C, 4.5 h) GF/F filter, attached directly to the Niskin bottle, and collected into acid cleaned and pre-combusted glass vials. Samples were acidified with H3PO4 until a pH of 1-2, and kept in the dark at 4°C until analysis at the laboratory by high temperature catalytic oxidation (HTCO) using a Shimadzu TOC-L (Calleja et al., 2019). The accuracy of the estimates were monitored using reference material of deep-sea carbon water (42–45 μmol C L−1 and 31–33 μmol N L−1) and low carbon water (1–2 μmol C L−1) provided by D. A. Hansell (Univ. of Miami).
Water temperature and salinity measurements were collected for each sample. In KAUST harbor and at Abushusha reef, this was conducted immediately prior to sampling with an environmental probe (YSI probe; Silva et al., 2019). At KAEC, water temperature and salinity measurements were obtained using a SBE 9 (Sea-Bird Electronics) Conductivity-Temperature-Depth (CTD) probe. All data used in this study can be accessed in the Supplementary Material.
2.5. Statistical Tests
To evaluate the model performance, the Pearson linear correlation coefficient (r, IDL Routine CORRELATE) and the median absolute difference (MAD) were used. The significance (p) of the correlation coefficient (r) was computed using the t-statistic and applying a two-sided t-test (utilizing IDL Routine T_PDF). The correlation was deemed significant if p < 0.05 and highly significant if p < 0.001. The MAD was computed as
where X is the variable, subscript i denotes the index in the data series, from 1 to N where N is the length of the series, the subscript M denotes the measured variable and E the estimated variable from the model. Considering that the chlorophyll concentration is approximately log-normally distributed (Campbell, 1995), statistical tests were performed in log10 space when using chlorophyll as the variable (unless explicitly stated), and in linear space when using the fraction of total chlorophyll in each size class as the variable. The MAD was used as it is robust to non-Gaussian distributions and outliers. For comparison with results from other studies, we also computed the root mean square difference (RMSD), according to
3. Results and Discussion
3.1. Fit of Three-Component Model to SFF Data
The three-component model was seen to capture the general changes in size-fractionated chlorophyll (Cp, Cn, Cp,n, and Cm) and fractions of total chlorophyll (Fp, Fn, Fp,n, and Fm) when plotted as a function of total chlorophyll (Figure 2 and Table 3). Statistical performance indicates that the three-component model fits the SFF data well (Table 3), with comparable or lower RMSD values when compared with model fits in other regions using SFF measurements. Model parameters also compare favorably with other model fits using SFF data in other ocean basins (Table 2). The conceptual framework of the three-component model is seen to hold in coastal Red Sea waters, with the abundance of small cells increasing to a given chlorophyll concentration, beyond which chlorophyll increases through the addition of larger size classes of phytoplankton (Raimbault et al., 1988; Chisholm, 1992; Goericke, 2011). This upper bound for small cells increases with increasing size (Brewin et al., 2014b), with assemblages of phytoplankton <20 μm in size having a significantly higher upper bound () than assemblages of phytoplankton <2 μm in size (, see Table 2). In agreement with other studies (IOCCG, 2014), picophytoplankton contribution to total chlorophyll is highest at low total chlorophyll, nanophytoplankton at intermediate total chlorophyll, and microphytoplankton at high total chlorophyll (Figure 2).
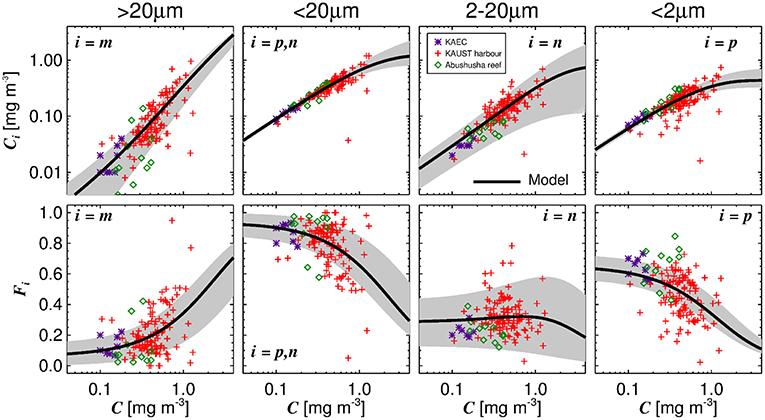
Figure 2. Fits of the three-component model to size-fractionated filtration (SFF) data collected in the study. Top row shows the absolute chlorophyll concentrations (Cm, Cp,n, Cn, and Cp) and bottom row the fractions (Fm, Fp,n, Fn, and Fp) plotted as a function of total chlorophyll (C), with the tuned three-component model (parameters from Table 2) overlain. Gray shading represents a model ensemble varying parameters between their confidence intervals (Table 2).
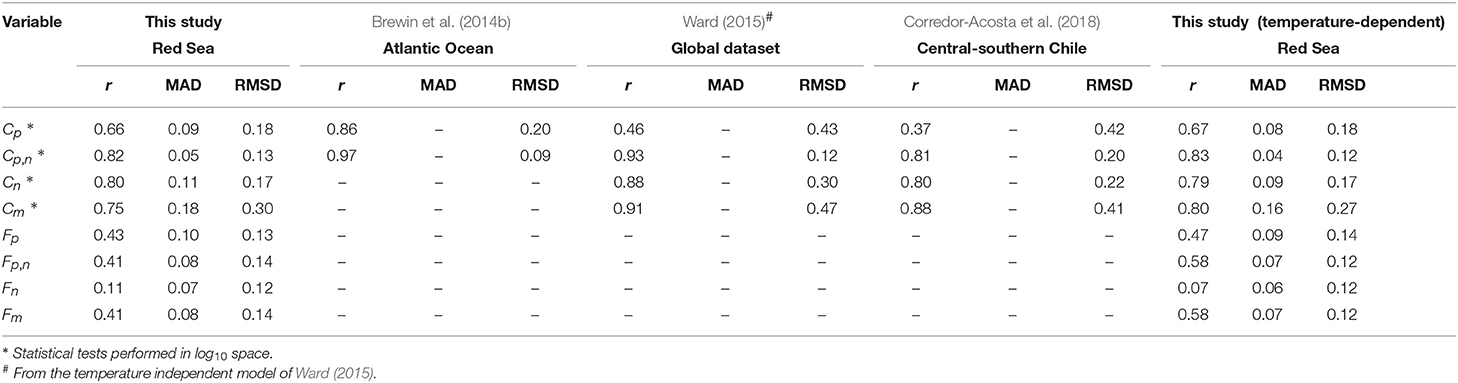
Table 3. Performance of the three-component model fit to the Red Sea data and a comparison with fits of the model in other regions using size-fractionated filtration (SFF) data.
3.2. Relationship Between Model Residuals and Other Variables
Although the model fits the data reasonably well, it is by no means perfect (Table 3, Figure 2). Differences between the model and data can be related either to uncertainties in the measurements (Brewin et al., 2014a), or simply to inability of the model to account for real variability surrounding the general relationship between size-fractionated chlorophyll and total chlorophyll.
Whereas the SFF method has an advantage in that the sizes of phytoplankton are explicitly partitioned, in comparison with other methods of determining size-fractionated chlorophyll (e.g., by High Performance Liquid Chromatography pigment analysis; Vidussi et al., 2001; Uitz et al., 2006; Brewin et al., 2010; Devred et al., 2011; Kheireddine et al., 2017), there are still uncertainties in the measurements. The filters can retain particles smaller than the nominal pore size, which is dependent on the morphology of the particles, cohesiveness of the particles, volume filtered and on the filter types used (Sheldon, 1972; Logan, 1993; Logan et al., 1994; Chavez et al., 1995; Gasol and Morán, 1999; Knefelkamp et al., 2007; Dall'Olmo et al., 2009). On the other hand, a certain portion of particles larger than the nominal pore size can also pass through the filter (e.g., from overlapping holes), and be accounted for in smaller-size fractions. This is dependent on whether the phytoplankton break apart during the filtration process, on the morphology of the particles, and on their orientation as they pass through the filter. The impact of these factors on measurement uncertainties is difficult to quantify, though it has been suggested that the clogging of filters and the inability to define accurately the pore size of filters, are two key issues (Droppo, 2000). Simultaneous measurements made by multiple types of in situ methods are needed to make an accurate diagnosis of uncertainty in the SFF technique (Nair et al., 2008; Brewin et al., 2014a). Though beyond the scope of this study, future efforts are needed in this direction.
While acknowledging that the measurements have uncertainties, to explore how the relationship between total and size-fractionated chlorophyll could be influenced by other ecological factors and consequently how the three-component model could be improved, we investigated whether the residuals (model minus measurement) were correlated with other variables in the dataset. We focused on the differences between model and measurement for Fp,n and Fp, considering that these fractions were used to parametrize the model (Equations 1 and 2).
Table 4 shows correlations between residuals in Fp,n and Fp and other variables in the dataset. As anticipated, there is no correlation between residuals and total chlorophyll, highlighting that the model fit captured the variation in Fp,n and Fp as a function of total chlorophyll. For Fp,n, highly significant (p < 0.001) correlations were observed with temperature (positive), and significant correlations (p < 0.05) with picoeukaryote cell abundance (negative) and salinity (positive). For Fp, significant (p < 0.05) correlations were observed with temperature, TDN, silicate, nitrite (all positive) and picoeukaryote cell abundance (negative). Of all the variables, Fp,n and Fp were both significantly correlated with temperature and picoeukaryote cell number. These two variables were inversely correlated (r = −0.40, p < 0.001) in the dataset, with higher picoeukaryote cell numbers in the winter and lower picoeukaryote cell numbers in summer.
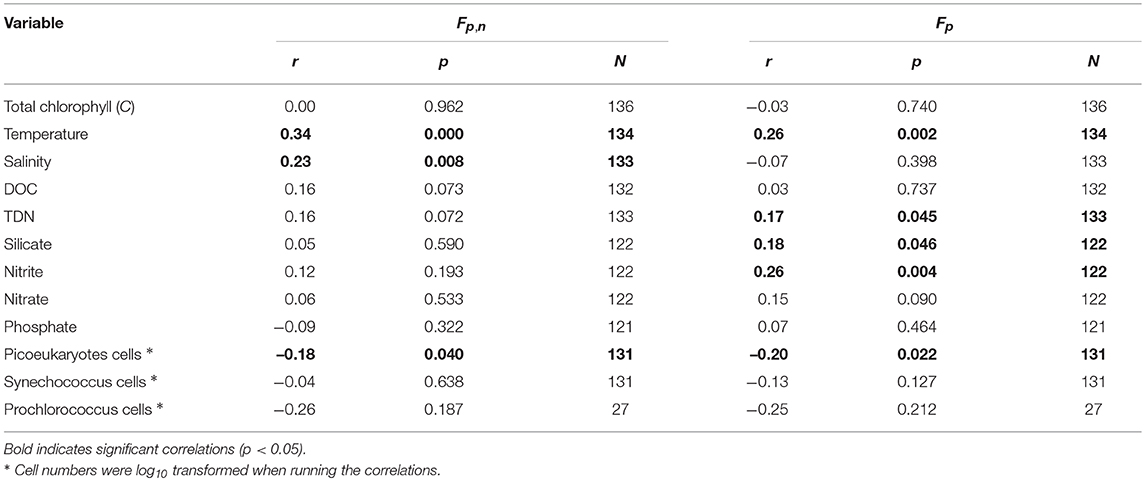
Table 4. Correlations between model residuals (model minus measurements) in the fraction of total chlorophyll by combined pico- and nano-phytoplankton (Fp,n) and picophytoplankton (Fp, cells <2 μm) and other variables collected in the dataset.
Residuals between the three-component model and fitted data have previously been shown to vary with temperature in polar waters and in the North Atlantic (Ward, 2015; Brewin et al., 2017a), but not in tropical seas with temperatures consistently exceeding 22 °C, suggesting seasonality may also play an important role in tropical waters. To investigate the impact of temperature on the parameters of the three-component model we followed a similar approach to Brewin et al. (2017a). This involved sorting the dataset by increasing temperature and conducted a running fit of the model (Equations 1 and 2) as a function of temperature using a bin size of 60 samples. This involved sliding the bin from low to high temperature and fitting Equations (1) and (2) each time the bin slides (increments of 1 sample). For each fit, we used the method of bootstrapping (1,000 iterations), and derived 13.6 and 86.4 % confidence intervals (1 standard deviation), as well as 2.5 and 97.5 % confidence intervals (2 standard deviation), for each parameter distribution in each bin (Figure 3), and assessed the relationship between the median parameters and average temperature of the bins.
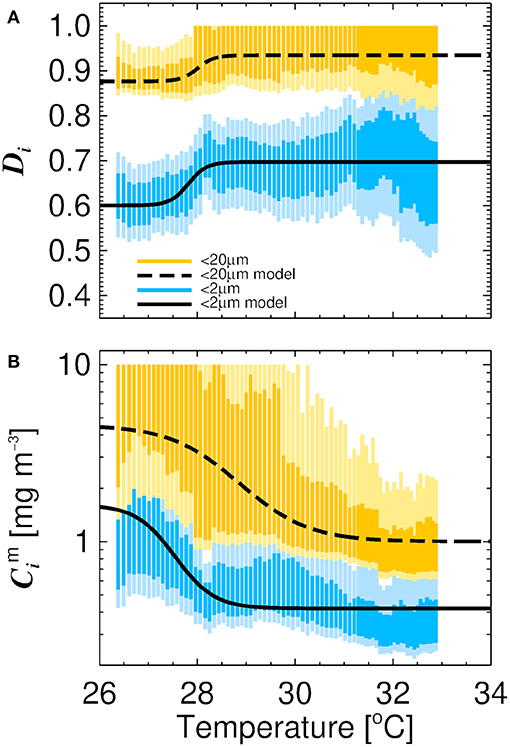
Figure 3. Relationship between the parameters of the three-component model and water temperature derived from sorting the dataset and conducted a running fit of the model (bin size 60 measurements) with increasing temperature. Average water temperature of each bin is on the abscissa and 13.6 and 86.4 % (darker shading) and 2.5 % and 97.5 % (lighter shading) confidence intervals of the parameters from a bootstrap fit (1,000 iterations) on the ordinate (confidence intervals are constrained to realistic values, 0 to 10 for and and <1 for Dp,n and Dp). (A) Shows the relationship between temperature and the parameters Dp,n and Dp. Solid black line is the model of Brewin et al. (2017b) tuned to the data (Equation 8) for cells <2 μm and dashed line for cells <20 μm (Equation 7). (B) Shows the relationship between temperature and the parameters and . Solid black line is the model of Brewin et al. (2017b) tuned to the data (Equation 6) for cells <2 μm and dashed line (Equation 5) for cells <20 μm.
We observed a positive relationship between Dp,n (fraction of cells <20 μm to C as C tends to zero) and temperature (r = 0.80, p < 0.001) and Dp (fraction of cells <2 μm to C as C tends to zero) and temperature (r = 0.63, p < 0.001, Figure 3), and an inverse relationship between and temperature (r = −0.51, p < 0.001) and and temperature (r = −0.89, p < 0.001). To capture these relationships, we fitted logistic functions to the data following the approach of Brewin et al. (2017a). The quantities and were modeled as functions of temperature (T) according to
and
where G1 and G4 represent the upper and lower bounds of , G2 the slope of change in with T, and G3 the T mid-point of the slope between and T. For , Hi, where i = 1 to 4, is analogous to Gi for . Similarly, Dp,n and Dp were modeled as a function of temperature (T) according to
and
where J1 and J4 represent the upper and lower bounds of Dp,n, J2 the slope of change in Dp,n with respect to T, and J3 the T mid-point of the slope between Dp,n and T. For Dp, Ki is analogous to Ji for Dp,n. The parameters for Equations (5)–(8) were derived by fitting the equations to the median parameter values for each bin and average temperature of each bin, using a nonlinear least-squared fitting procedure with bootstrapping (utilizing IDL Routines described in Section 2.3), and by constraining input to plausible values (0 to 10 for and and <1 for Dp,n and Dp). Parameter values for Equations (5)–(8) are provided in Table 5. The functions are seen to capture the general relationships observed in the dataset (Figure 3). Nonetheless, as this analysis is based on a relatively small dataset (136 samples), we recognize additional data is required to substantiate the relationship between model parameters and temperature observed here.
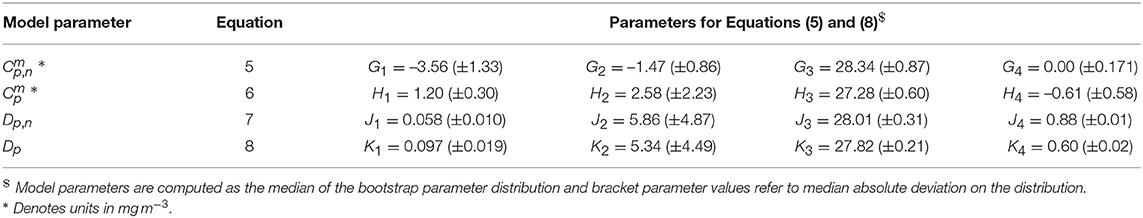
Table 5. Parameter values for Equations (5)–(8).
After Equations (5)–(8) were incorporated into the model, residuals between the temperature-dependent model and data were no longer significantly correlated with water temperature or picoeukaryote cell number (p > 0.05 for both Fp,n and Fp for these correlations), confirming that the new parameterization accounted for the relationships originally observed between the residuals and model output (Table 4). Furthermore, model performance was seen to improve using the temperature-dependent model, with lower MAD values for all size classes and higher correlation coefficients and lower RMSD for most size classes (Table 3). Figure 4 illustrates how the relationship between size-fractionated chlorophyll and total chlorophyll changes with temperature, when incorporating Equations (5)–(8) into the model.
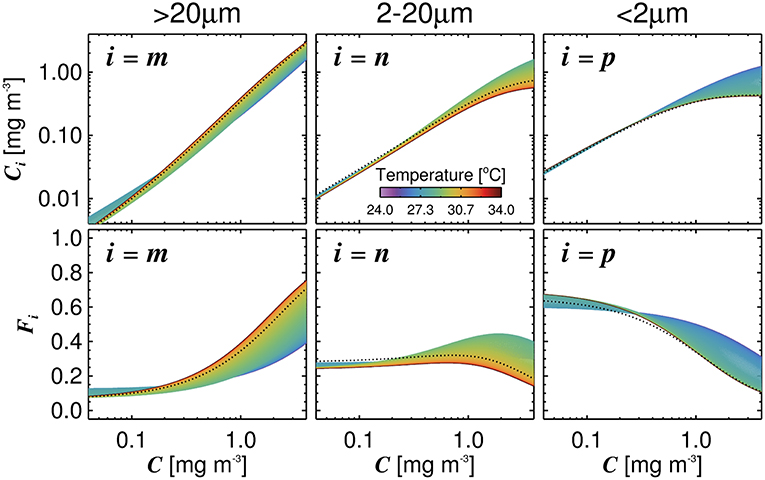
Figure 4. Influence of temperature on the relationship between size-fractionated chlorophyll and total chlorophyll, when incorporating Equations (5)–(8) into the three-component model. Top row shows the size-fractions of chlorophyll and bottom row the fractions of total chlorophyll in each size class, all plotted as a function of total chlorophyll. Dashed black lines refer to the model using a single set of parameters (Table 2).
Figure 5A shows a time-series of water temperature and total chlorophyll at KAUST harbor between 2016 and 2019. Clear seasonal cycles are seen in temperature, but not for total chlorophyll, with sporadic variations occurring at different times. Figures 5B–D show chlorophyll for micro-, nano- and picophytoplankton from in situ data (black) and estimates from the model (red), driven by total chlorophyll and water temperature (Figure 5A, Equations 1, 2, 5, 6, 7, and 8). In a highly-complex coastal environment, the three-component model is seen to explain around 50 % of the variance in size-fractionated chlorophyll (r ≥ 0.7 correlation in linear space, Figure 5). Considering that both water temperature (sea-surface temperature) and chlorophyll are accessible through satellite visible and thermal radiometry, the approach offers the potential for estimating size-fractionated chlorophyll from satellite data in the central Red Sea.
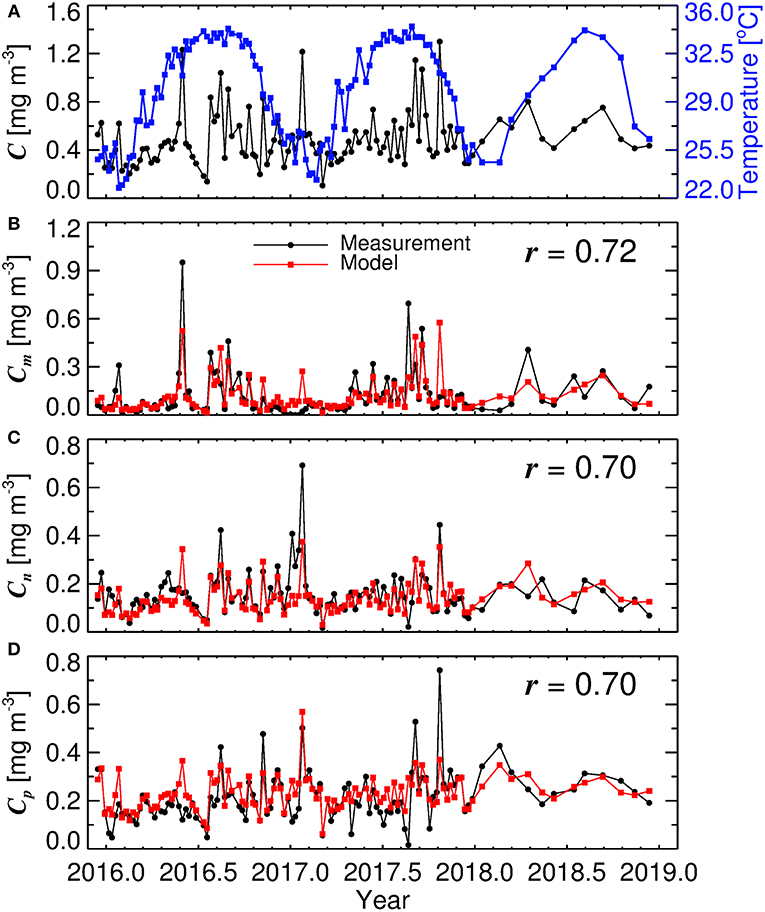
Figure 5. Time-series of data collected at KAUST harbor in Thuwal between 2016 and 2019. (A) time-series of water temperature and total chlorophyll (C), (B) microphytoplankton chlorophyll (Cm), (C) nanophytoplankton chlorophyll (Cn), and (D) picophytoplankton chlorophyll (Cp). r represents the correlation coefficient between measurements and model (conducted in linear space).
3.3. Influence of Changes in Taxonomic Composition of Picophytoplankton on Model Parameters
Our understanding of how model parameters change with temperature can be guided by analysing the flow cytometry data. Figure 6 shows the relationship between temperature and cell abundance for the two dominant picophytoplankton, Synechococcus and picoeukaryotes, as determined by flow cytometry. For the three sites sampled, with differing conditions (depth and picophytoplankton community composition), there is a clear shift in the composition of picophytoplankton with temperature, Synechococcus being positively correlated with temperature and picoeukaryotes inversely correlated (Figure 6).
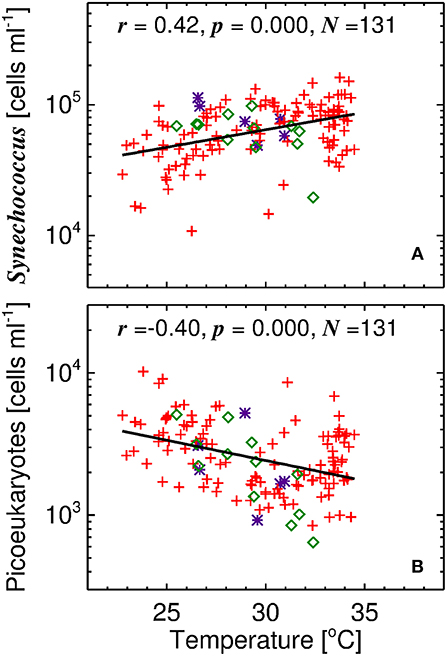
Figure 6. Relationship between temperature and picophytoplankton cell counts. (A) Synechococcus vs. temperature and (B) Picoeukaryotes vs. temperature. Solid line is a linear regression and symbols follow those of Figures 1, 2.
Table 6 lists the average relative red fluorescence and cell size for each community of picophytoplankton derived from the flow cytometry data. Picoeukaryotes, as expected, were found to be larger in size and to have higher relative red fluorescence than the cyanobacteria (Table 6), consistent with studies in other regions (Blanchot et al., 2001; Calvo-Díaz et al., 2008). Relative red fluorescence has been used as a proxy of per cell chlorophyll concentration (Olson et al., 1983; Li et al., 1993; Veldhuis et al., 1997; Veldhuis and Kraay, 2000; Calvo-Díaz and Morán, 2006; Calvo-Díaz et al., 2008; Álvarez et al., 2017), acknowledging that there are natural variations in fluorescence per unit of chlorophyll among species (Sosik et al., 1989), size (Veldhuis et al., 1997), and with changes in phytoplankton physiology (Veldhuis and Kraay, 1993). Other factors can also impact fluorescence measured by a flow cytometer (Neale et al., 1989). If we multiply the relative red fluorescence for all picophytoplankton groups by their respective abundances, sum them up, then compare with Cp derived from SFF measurements, we obtain a reasonable positive correlation (r = 0.38, p < 0.001, N = 131), confirming the use of relative fluorescence as proxy of per cell chlorophyll concentration in our dataset. The increase in with decreasing temperature could therefore be associated with increasing picoeukaryotes numbers at lower temperature. This group of picophytoplankton is larger in size (1.31 μm for picoeukaryotes compared with 0.89 μm for Synechococcus and 0.76 μm for Prochlorococcus, see Table 6) and can store higher concentrations of chlorophyll per cell (Table 6), and may consequently result in higher values. Similarly, considering Cp constitutes the dominant portion of Cp,n in our dataset (Figure 2), that picoeukaryote red fluorescence was found to be correlated with Cn (r = 0.38, p < 0.001, N = 131) and Cp,n (r = 0.33, p < 0.001, N = 131), and that the presense of picoeukaryotes is often associated with the presense of larger nanoeukaryotes (Tarran et al., 2006; Tarran and Bruun, 2015), similarly links could be made with increases in the parameter at low temperature. Nonetheless, additional evidence (e.g., taxonomic composition of the larger size classes) is needed to substantiate these linkages.

Table 6. Average relative red fluorescence and cell size for each community of picophytoplankton derived from the flow cytometry data.
With regards to parameters Dp and Dp,n, it is worth recalling that these parameters reflect the fraction of each size-class relative to total chlorophyll as total chlorophyll tends to zero (i.e., ultra-oligotrophic waters). Picophytoplankton are thought to dominate in oligotrophic conditions, owing to their competitive advantage over larger cells in low nutrient conditions, a result that is consistent with our model parameterization over the entire temperature range (Dp > 0.6, Figure 4). However, we see marginally higher Dp and Dp,n parameters in warmer waters (summer, higher Synechococcus cell numbers) than cooler waters (winter, higher picoeukaryote cell numbers). A decrease in Dp and Dp,n with temperature has also been observed in other regions, over a different temperature range (Brewin et al., 2017a). There may be some direct effect of temperature on growth rates of the different picophytoplankton communities (Eppley, 1972; Chen et al., 2014) and their grazers (Steinberg and Landry, 2017), that cause these differences and allow for an increasing presence of larger cells (nano- and micro) in cooler oligotrophic waters. However, it is worth noting that, as most of the dataset is very coastal, chlorophyll concentrations rarely fall below 0.1 mg m−3 (Figure 2) making it difficult to interpret variations in Dp and Dp,n in this dataset. Future efforts to sample more oligotrophic regions of the Red Sea may shed further light on variations in these two parameters.
3.4. Understanding the Relationship Between Phytoplankton Biomass and Size Structure in a Future Ocean
Two key ecological indicators, phytoplankton biomass and size structure, are seen to covary in a predictable manner in coastal waters of the Red Sea (Figure 2), with small cells dominant at low chlorophyll concentrations and large cells at high concentrations, consistent with studies in other regions (Raimbault et al., 1988; Chisholm, 1992; Uitz et al., 2006; Brewin et al., 2010). These predictable relationships have been exploited for the development of ocean-color algorithms (IOCCG, 2014), and for the validation of, and assimilation of data into, marine ecosystem models (Ward et al., 2012; Hirata et al., 2013; Holt et al., 2014; de Mora et al., 2016; Ciavatta et al., 2018; Skákala et al., 2018). However, it has been recognized that such relationships might be perturbed by changes in climate (Sathyendranath et al., 2017).
The size-structure of the phytoplankton affects export of large aggregates (Boyd and Newton, 1999), with large cells thought to contribute more to the flux of carbon at depth than smaller phytoplankton, at similar levels of total chlorophyll (Guidi et al., 2009), acknowledging small-celled carbon export can be significant (Richardson, 2019). The photosynthetic rate of phytoplankton, for a given concentration of total chlorophyll, has been shown to depend on size-structure (Platt and Jassby, 1976; Fernández et al., 2003; Morán et al., 2004; Uitz et al., 2008; Álvarez et al., 2016; Brewin et al., 2017b; Curran et al., 2018; Robinson et al., 2018a,b). Biological heating by phytoplankton is influenced by the chlorophyll-specific absorption coefficient, which changes with size (Bricaud et al., 2004; Devred et al., 2006; Uitz et al., 2008; Brewin et al., 2011). The structure of the marine food web has also been found to depend on size composition of phytoplankton (Maloney and Field, 1991). Models that tie primary production and total chlorophyll, export production and total chlorophyll, predict energy flow and biological heating using total chlorophyll, are all vulnerable to shifts in the relationship between total and size-fractionated chlorophyll.
Standard, empirical algorithms used by space agencies for estimating total chlorophyll from blue-green reflectance ratios, derived from satellite measurements of ocean color, have been shown to incorporate implicitly a fixed relationship between size-fractionated chlorophyll and total chlorophyll (IOCCG, 2014), with low total chlorophyll concentrations represented by the optical properties of small cells and high concentrations by large cells (Dierssen, 2010; Sathyendranath et al., 2017). These algorithms are also vulnerable to shifts in the relationship between total and size-fractionated chlorophyll, with implications for using ocean-color data to detect climate variability (Sathyendranath et al., 2017). Tying the relationship between total and size-fractionated chlorophyll to other environmental factors (e.g., temperature) could aid in ocean-color algorithm development.
Results from this study indicate that, in the coastal waters of the Red Sea, changes in the taxonomic composition of the phytoplankton within a size class may affect the chlorophyll in that size class. Therefore, to predict future changes in size-fractionated chlorophyll, we need to understand how phytoplankton taxonomic composition is likely to change. In the coastal waters of the Red Sea, we found temperature to correlate with taxonomic composition of picophytoplankton and the partitioning of total chlorophyll into the three size classes. Other studies in the Red Sea, using different methods, have confirmed the influence of temperature on phytoplankton taxonomic composition (Pearman et al., 2017). Temperature has been shown as a key variable for predicting changes in taxonomic composition in tropical oceans (Flombaum et al., 2013; Lange et al., 2018; Agusti et al., 2019), temperate regions (Morán et al., 2010; Flombaum et al., 2013; Brewin et al., 2017a), and in polar waters (Li et al., 2009; Ward, 2015). Furthermore, as temperature is a variable that is routinely measured from space, its integration into models of ocean color could lead to improved estimates of size-fractionated chlorophyll (Raitsos et al., 2008; Ward, 2015; Brewin et al., 2017a), as well as other regional ocean-color products used in ecological studies (Brewin et al., 2013, 2015a; Raitsos et al., 2013, 2015, 2017; Racault et al., 2015; Gittings et al., 2018; Kheireddine et al., 2018), putting us in a better position to harness ocean-color data for detecting shifts in marine ecosystems in the Red Sea.
4. Summary
Using datasets of size-fractionated chlorophyll, flow cytometry, physical variables and nutrient concentrations, collected over a 4-year period in the coastal waters of the central Red Sea, we analyzed the relationship between total chlorophyll and its partitioning into three size classes of phytoplankton (pico-, nano- and micro-phytoplankton) to address two research questions: (1) Is the relationship between total and size-fractionated chlorophyll in coastal waters of the Red Sea consistent with that observed in other ocean basins? and (2) What factors influence the relationship between total and size-fractionated chlorophyll? A conceptual, three-component model was fitted to the data, that describes the relationship between total chlorophyll and those in the three size classes. Model fits and model parameters were comparable to studies fitting the model to datasets in other ocean basins, demonstrating, in answer to research question (1), that the relationship between total and size-fractionated chlorophyll in the coastal waters of the Red Sea is consistent with that observed in other ocean basins. We found the residuals in the fits to be significantly correlated with water temperature (positively) and picoeukaryote cell abundance (negatively), demonstrating, in answer to research question (2), that temperature and taxonomic composition are key factors influencing the relationship between total and size-fractionated chlorophyll in the coastal waters of the Red Sea.
We introduced a temperature-dependency on model parameters that was subsequently found to improve performance. Temperature was inversely related with picoeukaryote cell abundance, with higher picoeukaryote cell abundances in winter (cold) than summer (warm). Picoeukaryotes are known to contain higher chlorophyll per cell than picophytoplanktonic cyanobacteria and be larger in size, possibly explaining a decrease in the maximum chlorophyll concentration of small cells in the model ( and ) with increasing temperature. This was supported by additional analysis using the relative red fluorescence and cell size estimates from flow cytometer data. However, we recognize additional evidence is needed to substantiate the link between the temperature dependence of model parameters and changes in the taxonomic composition of phytoplankton. Our results highlight the importance of temperature and taxonomic composition of phytoplankton within each size class when exploring the relationship between size-fractionated and total chlorophyll. This has implications for the development of satellite ocean-color algorithms and for predicting how ecosystem functioning may change in a future ocean.
Data Availability
All datasets generated for this study are included in the manuscript and/or the Supplementary Material.
Author Contributions
RB, XM, DR, JG, and IH proposed the study. XM, MC, MV, MA, NA-O, and TH-S collected the data. RB synthesized the data, re-tuned and further-developed the algorithms, organized, prepared and wrote the first version of the manuscript, and prepared all figures and tables. All authors contributed to the subsequent versions of the manuscript.
Funding
This work was funded by the King Abdullah University for Science and Technology (KAUST) Office of Sponsored Research (OSR) under the Virtual Red Sea Initiative (Grant # REP/1/3268-01-01). This work was also supported by the UK National Centre for Earth Observation (NCEO).
Conflict of Interest Statement
The authors declare that the research was conducted in the absence of any commercial or financial relationships that could be construed as a potential conflict of interest.
Acknowledgments
The authors would like to acknowledge all scientists and crew involved in the collection of the in situ data used in this manuscript. We thank Trevor Platt for providing helpful comments on our manuscript.
Supplementary Material
The Supplementary Material for this article can be found online at: https://www.frontiersin.org/articles/10.3389/fmicb.2019.01964/full#supplementary-material
References
Agirbas, E., Martinez-Vicente, V., Brewin, R. J. W., Racault, M.-F., Airs, R. L., and Llewellyn, C. A. (2015). Temporal changes in total and size-fractioned chlorophyll-a in surface waters of three provinces in the Atlantic Ocean (September to November) between 2003 and 2010. J. Mar. Syst. 150, 56–65. doi: 10.1016/j.jmarsys.2015.05.008
Agusti, S., Lubián, L. M., Morerno-Ostos, E., Estrada, M., and Duarte, C. M. (2019). Projected changes in photosynthetic picoplankton in a warmer subtropical ocean. Front. Mar. Sci. 5:506. doi: 10.3389/fmars.2018.00506
Álvarez, E., Morán, X. A. G., López-Urrutia, A., and Nogueira, E. (2016). Size-dependent photoacclimation of the phytoplankton community in temperate shelf waters (southern Bay of Biscay). Mar. Ecol. Prog. Ser. 543, 73–87. doi: 10.3354/meps11580
Álvarez, E., Nogueira, E., and López-Urrutia, Á. (2017). In vivo single-cell fluorescence and size scaling of phytoplankton chlorophyll content. Appl. Environ. Microbiol. 83, e03317–16. doi: 10.1128/AEM.03317-16
Belkin, I. M. (2009). Rapid warming of large marine ecosystems. Prog. Oceanogr. 81, 207–213. doi: 10.1016/j.pocean.2009.04.011
Blanchot, J., André, J. M., Navarette, C., Neveux, J., and Radenac, M. H. (2001). Picophytoplankton in the equatorial Pacific: vertical distributions in the warm pool and in the high nutrient low chlorophyll conditions. Deep Sea Res. I 48, 297–314. doi: 10.1016/S0967-0637(00)00063-7
Boyd, P. W., and Newton, P. (1999). Does planktonic community structure determine downward particulate organic carbon flux in different oceanic provinces? Deep Sea Res. I 46, 63–91. doi: 10.1016/S0967-0637(98)00066-1
Brewin, R., Ciavatta, S., Sathyendranath, S., Jackson, T., Tilstone, G., Curran, K., et al. (2017a). Uncertainty in ocean-color estimates of chlorophyll for phytoplankton groups. Front. Mar. Sci. 4:104. doi: 10.3389/fmars.2017.00104
Brewin, R. J., Devred, E., Sathyendranath, S., Hardman-Mountford, N. J., and Lavender, S. J. (2011). Model of phytoplankton absorption based on three size classes. Appl. Opt. 50, 4535–4549. doi: 10.1364/AO.50.004535
Brewin, R. J. W., Hirata, T., Hardman-Mountford, N. J., Lavender, S., Sathyendranath, S., and Barlow, R. (2012). The influence of the Indian Ocean Dipole on interannual variations in phytoplankton size structure as revealed by Earth Observation. Deep Sea Res. II 77–80, 117–127. doi: 10.1016/j.dsr2.2012.04.009
Brewin, R. J. W., Raitsos, D., Dall'Olmo, G., Zarokanellos, N., Jackson, T., Racault, M.-F., et al. (2015a). Regional ocean-colour chlorophyll algorithms for the Red Sea. Remote Sens. Environ. 165, 64–85. doi: 10.1016/j.rse.2015.04.024
Brewin, R. J. W., Raitsos, D. E., Pradhan, Y., and Hoteit, I. (2013). Comparison of chlorophyll in the Red Sea derived from MODIS-Aqua and in vivo fluorescence. Remote Sens. Environ. 136, 218–224. doi: 10.1016/j.rse.2013.04.018
Brewin, R. J. W., Sathyendranath, S., Hirata, T., Lavender, S. J., Barciela, R., and Hardman-Mountford, N. J. (2010). A three-component model of phytoplankton size class for the Atlantic Ocean. Ecol. Model. 221, 1472–1483. doi: 10.1016/j.ecolmodel.2010.02.014
Brewin, R. J. W., Sathyendranath, S., Jackson, T., Barlow, R., Brotas, V., Airs, R., et al. (2015b). Influence of light in the mixed layer on the parameters of a three-component model of phytoplankton size structure. Remote Sens. Environ. 168, 437–450. doi: 10.1016/j.rse.2015.07.004
Brewin, R. J. W., Sathyendranath, S., Lange, P. K., and Tilstone, G. (2014a). Comparison of two methods to derive the size-structure of natural populations of phytoplankton. Deep Sea Res. I 85, 72–79. doi: 10.1016/j.dsr.2013.11.007
Brewin, R. J. W., Sathyendranath, S., Tilstone, G., Lange, P. K., and Platt, T. (2014b). A multicomponent model of phytoplankton size structure. J. Geophys. Res. 119, 3478–3496. doi: 10.1002/2014JC009859
Brewin, R. J. W., Tilstone, G., Jackson, T., Cain, T., Miller, P., Lange, P. K., et al. (2017b). Modelling size-fractionated primary production in the Atlantic Ocean from remote sensing. Prog. Oceanogr. 158, 130–149. doi: 10.1016/j.pocean.2017.02.002
Bricaud, A., Claustre, H., Ras, J., and Oubelkheir, K. (2004). Natural variability of phytoplanktonic absorption in oceanic waters: influence of the size structure of algal populations. J. Geophys. Res. 109:C11010. doi: 10.1029/2004JC002419
Briggs, N., Perry, M. J. P., Cetinić, I., Lee, C., D'Asaro, E., Gray, A. M., et al. (2011). High-resolution observations of aggregate flux during a sub-polar North Atlantic spring bloom. Deep Sea Res. I 58, 1031–1039. doi: 10.1016/j.dsr.2011.07.007
Brotas, V., Brewin, R. J. W., Sá, C., Brito, A. C., Silva, A., Mendes, C. R., et al. (2013). Deriving phytoplankton size classes from satellite data: validation along a trophic gradient in the eastern Atlantic Ocean. Remote Sens. Environ. 134, 66–77. doi: 10.1016/j.rse.2013.02.013
Calleja, M. L., Al-Otaibi, N., and Morán, X. A. G. (2019). Dissolved organic carbon contribution to oxygen respiration in the central Red Sea. Sci. Rep. 9:4690. doi: 10.1038/s41598-019-40753-w
Calleja, M. L., Ansari, M. I., Røstad, A., Silva, L., Kaartvedt, S., Irigoien, X., et al. (2018). The mesopelagic scattering layer: a hotspot for heterotrophic prokaryotes in the Red Sea twilight zone. Front. Mar. Sci. 5:259. doi: 10.3389/fmars.2018.00259
Calvo-Díaz, A., and Morán, X. A. G. (2006). Seasonal dynamics of picoplankton in shelf waters of the southern Bay of Biscay. Aquat. Microb. Ecol. 42, 159–174. doi: 10.3354/ame042159
Calvo-Díaz, A., Morán, X. A. G., and Suárez, L. A. (2008). Seasonality of picophytoplankton chlorophyll a and biomass in the central Cantabrian Sea, southern Bay of Biscay. J. Mar. Syst. 72, 271–281. doi: 10.1016/j.jmarsys.2007.03.008
Campbell, J. W. (1995). The lognormal distribution as a model for bio-optical variability in the sea. J. Geophys. Res. 100, 13237–13254. doi: 10.1029/95JC00458
Chassot, E., Bonhommeau, S., Dulvy, N. K., Mélin, F., Watson, R., Gascuel, D., et al. (2010). Global marine primary production constrains fisheries catches. Ecol. Lett. 13, 495–505. doi: 10.1111/j.1461-0248.2010.01443.x
Chavez, F. P., Buck, K. R., Bidigare, R. R., Karl, D. M., Hebel, D. V., Latasa, M., et al. (1995). On the chlorophyll-a retention properties of glass-fiber GF/F filters. Limnol. Oceanogr. 40, 428–433. doi: 10.4319/lo.1995.40.2.0428
Chen, B., Liu, H., Huang, B., and Wang, J. (2014). Temperature effects on the growth rate of marine picoplankton. Mar. Ecol. Prog. Ser. 505, 37–47. doi: 10.3354/meps10773
Chisholm, S. W. (1992). “Phytoplankton size,” in Primary Productivity and Biogeochemical Cycles in the Sea, eds P. G. Falkowski and A. D. Woodhead (New York, NY: Springer), 213–237. doi: 10.1007/978-1-4899-0762-2_12
Christensen, J. H., Hewitson, B., Busuioc, A., Chen, A., Gao, X., Held, I., et al. (2007). “Regional climate projections,” in Climate Change 2007: The Physical Science Basis. Contribution of Working Group I to the Fourth Assessment Report of the Intergovernmental Panel on Climate, eds S. Solomon, D. Qin, M. Manning, Z. Chen, M. Marquis, K. B. Averyt, M. Tignor, and H. L. Miller (Cambridge; New York, NY: Cambridge University Press).
Ciavatta, S., Brewin, R. J. W., Skákala, J., Polimene, L., de Mora, L., Artioli, Y., et al. (2018). Assimilation of ocean-color plankton functional types to improve marine ecosystem simulations. J. Geophys. Res. Oceans 123, 834–854. doi: 10.1002/2017JC013490
Corredor-Acosta, A., Morales, C., Brewin, R. J. W., Auger, P. A., Pizarro, O., Hormazabal, S., et al. (2018). Phytoplankton size structure in association with mesoscale eddies off central-southern Chile: the satellite application of a phytoplankton size-class model. Remote Sens. 10:834. doi: 10.3390/rs10060834
Curran, K., Brewin, R. J. W., Tilstone, G. H., Bouman, H., and Hickman, A. (2018). Estimation of size-fractionated primary production from satellite ocean colour in UK shelf seas. Remote Sens. 10:1389. doi: 10.3390/rs10091389
Dall'Olmo, G., Westberry, T. K., Behrenfeld, M. J., Boss, E., and Slade, W. H. (2009). Significant contribution of large particles to optical backscattering in the open ocean. Biogeosciences 6, 947–967. doi: 10.5194/bg-6-947-2009
de Mora, L., Butenschön, M., and Allen, J. I. (2016). The assessment of a global marine ecosystem model on the basis of emergent properties and ecosystem function: a case study with ERSEM. Geosci. Model Dev. 9, 59–76. doi: 10.5194/gmd-9-59-2016
Devred, E., Sathyendranath, S., Stuart, V., Maas, H., Ulloa, O., and Platt, T. (2006). A two-component model of phytoplankton absorption in the open ocean: theory and applications. J. Geophys. Res. 111:C03011. doi: 10.1029/2005JC002880
Devred, E., Sathyendranath, S., Stuart, V., and Platt, T. (2011). A three component classification of phytoplankton absorption spectra: applications to ocean-colour data. Remote Sens. Environ. 115, 2255–2266. doi: 10.1016/j.rse.2011.04.025
Dierssen, H. M. (2010). Perspectives on empirical approaches for ocean color remote sensing of chlorophyll in a changing climate. Proc. Natl. Acad. Sci. U.S.A. 107, 17073–17078. doi: 10.1073/pnas.0913800107
Droppo, I. G. (2000). “Filtration in particle size analysis,” in Encyclopedia of Analytical Chemistry, ed R. A. Meyers (Chichester: John Wiley and Sons Ltd.), 5397–5413.
Efron, B. (1979). Bootstrap methods: another look at the jackknife. Ann. Stat. 7, 1–26. doi: 10.1214/aos/1176344552
Eppley, R. W., and Peterson, B. J. (1979). Particulate organic matter flux and planktonic new production in the deep ocean. Nature 282, 677–680. doi: 10.1038/282677a0
Fernández, E., Marañón, E., Morán, X. A. G., and Serret, P. (2003). Potential causes for the unequal contribution of picophytoplankton to total biomass and productivity in oligotrophic waters. Mar. Ecol. Prog. Ser. 254, 101–109. doi: 10.3354/meps254101
Field, C. B., Behrenfeld, M. J., Randerson, J. T., and Falkowski, P. (1998). Primary production of the biosphere: integrating terrestrial and oceanic components. Science 281, 237–240. doi: 10.1126/science.281.5374.237
Finkel, Z. V., Beardall, J., Flynn, K., Quigg, A., Rees, T. A. V., and Raven, J. A. (2010). Phytoplankton in a changing world: cell size and elemental stoichiometry. J. Plank. Res. 32, 119–137. doi: 10.1093/plankt/fbp098
Flombaum, P., Gallegos, J. L., Gordillo, R. A., Rincón, J., Zabala, L. L., Jiao, N., et al. (2013). Present and future global distributions of the marine Cyanobacteria Prochlorococcus and Synechococcus. Proc. Natl. Acad. Sci. U.S.A. 110, 9824–9829. doi: 10.1073/pnas.1307701110
Gasol, J. M., and Morán, X. A. G. (1999). Effects of filtration on bacterial activity and picoplankton community structure as assessed by flow cytometry. Aquat. Microb. Ecol. 16, 251–264. doi: 10.3354/ame016251
Gasol, J. M., and Morán, X. A. G. (2015). “Flow cytometric determination of microbial abundances and its use to obtain indices of community structure and relative activity,” in Hydrocarbon Lipid Microbiology Protocols Single-Cell and Single-Molecule Methods (Berlin: Springer), 1–29.
Gittings, J. A., Raitsos, D. E., Krokos, G., and Hoteit, I. (2018). Impacts of warming on phytoplankton abundance and phenology in a typical tropical marine ecosystem. Sci. Rep. 8:2240. doi: 10.1038/s41598-018-20560-5
Goericke, R. (2011). The size structure of marine phytoplankton – What are the rules? CalCOFI Report 52, 198–204. Available online at: http://scrippsscholars.ucsd.edu/rgoericke/content/size-structure-marine-phytoplankton-what-are-rules
Guidi, L., Stemmann, L., Jackson, G. A., Ibanez, F., Claustre, H., Legendre, L., et al. (2009). Effects of phytoplankton community on production, size and export of large aggregates: a world-ocean analysis. Limnol. Oceanogr. 54, 1951–1963. doi: 10.4319/lo.2009.54.6.1951
Hirata, T., Hardman-Mountford, N. J., Brewin, R. J. W., Aiken, J., Barlow, R., Suzuki, K., et al. (2011). Synoptic relationships between surface chlorophyll-a and diagnostic pigments specific to phytoplankton functional types. Biogeosciences 8, 311–327. doi: 10.5194/bg-8-311-2011
Hirata, T., Saux Picart, S., Hashioka, T., Aita-Noguchi, M., Sumata, H., Shigemitsu, M., et al. (2013). A comparison between phytoplankton community structures derived from a global 3D ecosystem model and satellite observation. J. Mar. Syst. 109–101, 129–137. doi: 10.1016/j.jmarsys.2012.01.009
Holt, J., Allen, J. I., Anderson, T. R., Brewin, R. J. W., Butenschön, M., Harle, J., et al. (2014). Challenges in integrative approaches to modelling the marine ecosystems of the North Atlantic: physics to fish and coasts to ocean. Prog. Oceanogr. 129, 285–313. doi: 10.1016/j.pocean.2014.04.024
Hu, S., Zhou, W., Wang, G., Cao, W., Xu, Z., Liu, H., et al. (2018). Comparison of satellite-derived phytoplankton size classes using in-situ measurements in the South China Sea. Remote Sens. 10:526. doi: 10.3390/rs10040526
IOCCG (2014). Phytoplankton Functional Types from Space. Technical report, ed S. Sathyendranath, Reports of the International Ocean-Colour Coordinating Group, No. 15, IOCCG, Dartmouth, NS.
Kheireddine, M., Ouhssain, M., Claustre, H., Uitz, J., Gentili, B., and Jones, B. (2017). Assessing pigment-based phytoplankton community distributions in the Red Sea. Front. Mar. Sci. 4:132. doi: 10.3389/fmars.2017.00132
Kheireddine, M., Ouhssain, M., Organelli, E., Bricaud, A., and Jones, B. H. (2018). Light absorption by suspended particles in the Red Sea: effect of phytoplankton community size structure and pigment composition. J. Geophys. Res. Oceans 123, 902–921. doi: 10.1002/2017JC013279
Knefelkamp, B., Carstens, K., and Wiltshire, K. H. (2007). Comparison of different filter types on chlorophyll-a retention and nutrient measurements. J. Exp. Mar. Biol. Ecol. 345, 61–70. doi: 10.1016/j.jembe.2007.01.008
Lamont, T., Brewin, R. J. W., and Barlow, R. (2018). Seasonal variation in remotely-sensed phytoplankton size structure around Southern Africa. Remote Sens. Environ. 204, 617–631. doi: 10.1016/j.rse.2017.09.038
Lange, P., Brewin, R. J. W., Dall'Olmo, G., Tarran, G., Sathyendranath, S., Zubkov, M., et al. (2018). Scratching beneath the surface: a model to predict the vertical distribution of Prochlorococcus using remote sensing. Remote Sens. 10:847. doi: 10.3390/rs10060847
Laws, E. A., Falkowski, P. G., Smith, W. O. Jr., Ducklow, H., and McCarth, J. J. (2000). Temperature effects on export production in the open ocean. Glob. Biogeochem. Cycles 14, 1231–1246. doi: 10.1029/1999GB001229
Legendre, L., and Le Fevre, J. (1991). “From individual plankton cells to pelagic marine ecosystems and to global biogeochemical cycles,” in Particle Analysis in Oceanography, eds S. Demers (Berlin: Springer), 261–300.
Li, W. K., McLaughlin, F. A., Lovejoy, C., and Carmack, E. C. (2009). Smallest algae thrive as the Arctic Ocean freshens. Science 326, 539–539. doi: 10.1126/science.1179798
Li, W. K. W., Zohary, T., Yacobi, Y., and Wood, A. (1993). Ultraphytoplankton in the eastern Mediterranean sea: towards deriving phytoplankton biomass from flow cytometric measurements of abundance, fluorescence and light scatter. Mar. Ecol. Prog. Ser. 102, 79–87. doi: 10.3354/meps102079
Lin, J., Cao, W., Wang, G., and Hu, S. (2014). Satellite-observed variability of phytoplankton size classes associated with a cold eddy in the South China Sea. Mar. Pollut. Bull. 83, 190–197. doi: 10.1016/j.marpolbul.2014.03.052
Liu, X., Devred, E., and Johnson, C. (2018). Remote sensing of phytoplankton size class in Northwest Atlantic from 1998 to 2016: bio-optical algorithms comparison and application. Remote Sens. 10:1028. doi: 10.3390/rs10071028
Logan, B. E. (1993). Theoretical analysis of size distributions determined with screens and filters. Limnol. Oceanogr. 38, 372–381. doi: 10.4319/lo.1993.38.2.0372
Logan, B. E., Passow, U., and Alldredge, A. L. (1994). Variable retention of diatoms on screens during size separations. Limnol. Oceanogr. 39, 390–395. doi: 10.4319/lo.1994.39.2.0390
Longhurst, A., Sathyendranath, S., Platt, T., and Caverhill, C. (1995). An estimate of global primary production in the ocean from satellite radiometer data. J. Plankt. Res. 17, 1245–1271. doi: 10.1093/plankt/17.6.1245
López-Urrutia, A., and Morán, X. A. G. (2015). Temperature affects the size–structure of phytoplankton communities in the ocean. Limnol. Oceanogr. 60, 733–738. doi: 10.1002/lno.10049
Maloney, C. L., and Field, J. G. (1991). The size-based dynamics of plankton food webs. I. A simulation model of carbon and nitrogen flows. J. Plankt. Res. 13, 1003–1038. doi: 10.1093/plankt/13.5.1003
Marañón, E. (2009). “Phytoplankton size structure,” in Encyclopedia of Ocean Sciences, eds J. H. Steele, K. Turekian, and S. A. Thorpe (Oxford: Academic Press), 85–92.
Marañón, E. (2015). Cell size as a key determinant of phytoplankton metabolism and community structure. Annu. Rev. Mar. Sci. 7, 241–264. doi: 10.1146/annurev-marine-010814-015955
Marañón, E., Cermeño, P., Latasa, M., and Tadonléké, R. D. (2012). Temperature, resources, and phytoplankton size structure in the ocean. Limnol. Oceanogr. 57, 1266–1278. doi: 10.4319/lo.2012.57.5.1266
Markwardt, C. B. (2008). “Non-linear least squares fitting in IDL with MPFIT,” in Proceedings of the Astronomical Data Analysis Software and Systems XVIII, ASP Conference Series, Quebec, Canada, vol. 411, eds D. Bohlender, P. Dowler, and D. Duran (San Francisco, CA: Astronomical Society of the Pacific), 1–4.
Michaels, A. F., and Silver, M. W. (1988). Primary production, sinking fluxes and the microbial food web. Deep Sea Res. I 35, 473–490. doi: 10.1016/0198-0149(88)90126-4
Morán, X. A. G., Fernández, E., and Pérez, V. (2004). Size-fractionated primary production, bacterial production and net community production in subtropical and tropical domains of the oligotrophic NE atlantic in autumn. Mar. Ecol. Prog. Ser. 274, 17–29. doi: 10.3354/meps274017
Morán, X. A. G., López-Urrutia, A., Calvo-Díaz, A., and Li, W. K. W. (2010). Increasing importance of small phytoplankton in a warmer ocean. Glob. Change Biol. 16, 1137–1144. doi: 10.1111/j.1365-2486.2009.01960.x
Moré, J. (1978). “The Levenberg-Marquardt Algorithm: implementation and theory,” in Numerical Analysis, ed G. A. Watson (Berlin: Springer-Verlag), 105–116.
Morel, A., and Bricaud, A. (1981). Theoretical results concerning light absorption in a discrete medium, and application to specific absorption of phytoplankton. Deep-Sea Res. 28, 1375–1393. doi: 10.1016/0198-0149(81)90039-X
Mouw, C. B., Barnett, A., McKinley, G. A., Gloege, L., and Pilcher, D. (2016). Phytoplankton size impact on export flux in the global ocean. Glob. Biogeochem. Cycles 30, 1542–1562. doi: 10.1002/2015GB005355
Nair, A., Sathyendranath, S., Platt, T., Morales, J., Stuart, V., Forget, M.-H., et al. (2008). Remote sensing of phytoplankton functional types. Remote Sens. Environ. 112, 3366–3375. doi: 10.1016/j.rse.2008.01.021
Neale, P., Cullen, J., and Yentsch, C. (1989). Bio-optical inferences from chlorophyll a fluorescence: what kind of fluorescence is measured in flow cytometry? Limnol. Oceanogr. 34, 1739–1748. doi: 10.4319/lo.1989.34.8.1739
Olson, R., Frankel, S., Chisholm, S., and Shapiro, H. (1983). An inexpensive flow cytometer for the analysis of fluorescence signals in phytoplankton: chlorophyll and DNA distributions. J. Exp. Mar. Biol. Ecol. 68, 129–144. doi: 10.1016/0022-0981(83)90155-7
O'Reilly, J. E., Maritorena, S., Mitchell, B. G., Siegel, D. A., Carder, K. L., Garver, S. A., et al. (1998). Ocean chlorophyll algorithms for SeaWiFS. J. Geophys. Res. 103, 24937–24953. doi: 10.1029/98JC02160
Pearman, J., Ellis, J., Irigoien, X., Sarma, Y., Jones, B. H., and Carvalho, S. (2017). Microbial planktonic communities in the Red Sea: high levels of spatial and temporal variability shaped by nutrient availability and turbulence. Sci. Rep. 7:6611. doi: 10.1038/s41598-017-06928-z
Platt, T., and Denman, K. L. (1977). Organisation in the pelagic ecosystem. HelgoaẼnder Wissenschaftliche Meeresuntersuchungen 30, 575–581. doi: 10.1007/BF02207862
Platt, T., and Denman, K. L. (1978). “The structure of pelagic marine ecosystems,” in Rapports et Procès-Verbaux des Rèunions Conseil Permanent International pour l’Exploration de la Mer. 173, 60–65.
Platt, T., and Jassby, A. D. (1976). The relationship between photosynthesis and light for natural assemblages of coastal marine phytoplankton. J. Phycol. 12, 421–430. doi: 10.1111/j.1529-8817.1976.tb02866.x
Platt, T., and Sathyendranath, S. (2008). Ecological indicators for the pelagic zone of the ocean from remote sensing. Remote Sens. Environ. 112, 13426–3436. doi: 10.1016/j.rse.2007.10.016
Prieur, L., and Sathyendranath, S. (1981). An optical classification of coastal and oceanic waters based on the specific spectral absorption curves of phytoplankton pigments, dissolved organic matter and other particulate materials. Limnol. Oceanogr. 26, 617–689. doi: 10.4319/lo.1981.26.4.0671
Racault, M.-F., Platt, T., Sathyendranath, S., Agirbas, E., Martinez Vicente, V., and Brewin, R. J. W. (2014). Plankton indicators and ocean observing systems: support to the marine ecosystem state assessment. J. Plankt. Res. 36, 621–629. doi: 10.1093/plankt/fbu016
Racault, M.-F., Raitsos, D. E., Berumen, M. L., Brewin, R. J. W., Platt, T., Sathyendranath, S., et al. (2015). Phytoplankton phenology indices in coral reef ecosystems: application to ocean-colour observations in the Red Sea. Remote Sens. Environ. 160, 222–234. doi: 10.1016/j.rse.2015.01.019
Raimbault, P., Rodier, M., and Taupier-Letage, I. (1988). Size fraction of phytoplankton in the Ligurian Sea and the Algerian Basin (Mediterranean Sea): size distribution versus total concentration. Mar. Microb. Food Webs 3, 1–7.
Raitsos, D. E., Brewin, R. J. W., Zhan, P., Dreano, D., Pradhan, Y., Nanninga, G. B., et al. (2017). Sensing coral reef connectivity pathways from space. Sci. Rep. 7:9338. doi: 10.1038/s41598-017-08729-w
Raitsos, D. E., Hoteit, I., Prihartato, P. K., Chronis, T., and Triantafyllou, G. Y. A. (2011). Abrupt warming of the Red Sea. Geophys. Res. Lett. 38:L14601. doi: 10.1029/2011GL047984
Raitsos, D. E., Lavender, S. J., Maravelias, C. D., Haralambous, J., Richardson, A. J., and Reid, P. C. (2008). Identifying four phytoplankton functional types from space: an ecological approach. Limnol. Oceanogr. 53, 605–613. doi: 10.4319/lo.2008.53.2.0605
Raitsos, D. E., Pradhan, Y., Hoteit, I., Brewin, R. J. W., and Stenchikov, G. (2013). Remote sensing the phytoplankton seasonal succession of the Red Sea. PLoS ONE 8:e64909. doi: 10.1371/journal.pone.0064909
Raitsos, D. E., Yi, X., Platt, T., Racault, M.-F., Brewin, R. J. W., Pradhan, Y., et al. (2015). Monsoon oscillations regulate fertility of the Red Sea. Geophys. Res. Lett. 42, 855–862. doi: 10.1002/2014GL062882
Richardson, T. L. (2019). Mechanisms and pathways of small-phytoplankton export from the surface ocean. Annu. Rev. Mar. Sci. 11, 57–74. doi: 10.1146/annurev-marine-121916-063627
Robinson, A., Bouman, H. A., Tilstone, G. H., and Sathyendranath, S. (2018a). High photosynthetic rates associated with pico and nanophytoplankton communities and high stratification index in the North West Atlantic. Continent. Shelf Res. 171, 126–139. doi: 10.1016/j.csr.2018.10.010
Robinson, A., Bouman, H. A., Tilstone, G. H., and Sathyendranath, S. (2018b). Size class dependent relationships between temperature and phytoplankton photosynthesis-irradiance parameters in the Atlantic Ocean. Front. Mar. Sci. 4:435. doi: 10.3389/fmars.2017.00435
Sahay, A., Ali, S. M., Gupta, A., and Goes, J. I. (2017). Ocean color satellite determinations of phytoplankton size class in the Arabian sea during the winter monsoon. Remote Sens. Environ. 198, 286–296. doi: 10.1016/j.rse.2017.06.017
Sammartino, M., Di Cicco, A., Marullo, S., and Santoleri, R. (2015). Spatio-temporal variability of micro-, nano- and pico-phytoplankton in the Mediterranean Sea from satellite ocean colour data of SeaWiFS. Ocean Sci. 11, 759–778. doi: 10.5194/os-11-759-2015
Sathyendranath, S., Brewin, R. J. W., Jackson, T., Mélin, F., and Platt, T. (2017). Ocean-colour products for climate-change studies: what are their ideal characteristics? Remote Sens. Environ. 203, 125–138. doi: 10.1016/j.rse.2017.04.017
Sathyendranath, S., Gouveia, A. D., Shetye, S. R., Ravindran, P., and Platt, T. (1991). Biological control of surface temperature in the Arabian Sea. Nature 349, 54–56. doi: 10.1038/349054a0
Sathyendranath, S., and Platt, T. (2007). Spectral effects in bio-optical control on the ocean system. Oceanologia 49, 5–39. Available online at: https://www.iopan.pl/oceanologia/491platt.pdf
Sathyendranath, S., Stuart, V., Cota, G., Maas, H., and Platt, T. (2001). Remote sensing of phytoplankton pigments: a comparison of empirical and theoretical approaches. Int. J. Remote Sens. 22, 249–273. doi: 10.1080/014311601449925
Sheldon, R. W. (1972). Size separation of marine seston by membrane and glass-fiber filters. Limnol. Oceanogr. 17, 494–498. doi: 10.4319/lo.1972.17.3.0494
Sieburth, J. M., Smetacek, V., and Lenz, J. (1978). Pelagic ecosystem structure: heterotrophic compartments of the plankton and their relationship to plankton size fractions. Limnol. Oceanogr. 23, 1256–1263. doi: 10.4319/lo.1978.23.6.1256
Silva, L., Calleja, M. L., Huete-Stauffer, T. M., Ivetic, S., Ansari, M. I., Viegas, M., et al. (2019). Low abundances but high growth rates of coastal heterotrophic bacteria in the Red Sea. Front. Microbiol. 9:3244. doi: 10.3389/fmicb.2018.03244
Skákala, J., Ford, D., Brewin, R. J. W., McEwan, R., Kay, S., Taylor, B., et al. (2018). The assimilation of phytoplankton functional types for operational forecasting in the northwest European shelf. J. Geophys. Res. Oceans 123, 5230–5247. doi: 10.1029/2018JC014153
Sosik, H., Chisholm, S., and Olson, R. (1989). Chlorophyll fluorescence from single cells: interpretation of flow cytometric signals. Limnol. Oceanogr. 34, 1749–1761. doi: 10.4319/lo.1989.34.8.1749
Steinberg, D. K., and Landry, M. R. (2017). Zooplankton and the ocean carbon cycle. Annu. Rev. Mar. Sci. 9, 413–444. doi: 10.1146/annurev-marine-010814-015924
Sun, X., Shen, F., Liu, D., Bellerby, R. G., Liu, Y., and Tang, R. (2018). In situ and satellite observations of phytoplankton size classes in the entire continental shelf sea, China. J. Geophys. Res. 123, 3523–3544. doi: 10.1029/2017JC013651
Tarran, G. A., and Bruun, J. T. (2015). Nanoplankton and picoplankton in the Western English Channel: abundance and seasonality from 2007-2013. Prog. Oceanogr. 137, 446–455. doi: 10.1016/j.pocean.2015.04.024
Tarran, G. A., Heywood, J. L., and Zubkov, M. V. (2006). Latitudinal changes in the standing stocks of nano-and picoeukaryotic phytoplankton in the Atlantic Ocean. Deep Sea Res. II 53, 1516–1529. doi: 10.1016/j.dsr2.2006.05.004
Uitz, J., Claustre, H., Morel, A., and Hooker, S. B. (2006). Vertical distribution of phytoplankton communities in open ocean: an assessment based on surface chlorophyll. J. Geophys. Res. 111:C08005. doi: 10.1029/2005JC003207
Uitz, J., Huot, Y., Bruyant, F., Babin, M., and Claustre, H. (2008). Relating phytoplankton photophysiological properties to community structure on large scales. Limnol. Oceanogr. 53, 614–630. doi: 10.4319/lo.2008.53.2.0614
Veldhuis, M., and Kraay, G. (1993). Cell abundance and fluorescence of picoplankton in relation to growth irradiance and nitrogen availability in the Red Sea. Netherlands J. Sea Res. 31, 135–145. doi: 10.1016/0077-7579(93)90003-B
Veldhuis, M., and Kraay, G. (2000). Application of flow cytometry in marine phytoplankton research: current applications and future perspectives. Sci. Mar. 64, 121–134. doi: 10.3989/scimar.2000.64n2121
Veldhuis, M., Kraay, G., Van Bleijswijk, J., and Baars, M. (1997). Seasonal and spatial variability in phytoplankton biomass, productivity and growth in the northwestern indian ocean: the southwest and northeast monsoon 1992-1993. Deep Sea Res. I 44, 425–449. doi: 10.1016/S0967-0637(96)00116-1
Vidussi, F., Claustre, H., Manca, B. B., Luchetta, A., and Marty, J. C. (2001). Phytoplankton pigment distribution in relation to upper thermocline circulation in the eastern Mediterranean Sea during winter. J. Geophys. Res. 106, 19939–19956. doi: 10.1029/1999JC000308
Ward, B. A. (2015). Temperature-correlated changes in phytoplankton community structure are restricted to polar waters. PLoS ONE 10:e0135581. doi: 10.1371/journal.pone.0135581
Ward, B. A., Dutkiewicz, S., Jahn, O., and Follows, M. J. (2012). A size-structured food-web model for the global ocean. Limnol. Oceanogr. 57, 1877–1891. doi: 10.4319/lo.2012.57.6.1877
Yao, F., Hoteit, I., Pratt, L. J., Bower, A. S., Köhl, A., Gopalakrishnan, G., et al. (2014b). Seasonal overturning circulation in the Red Sea: 2. Winter circulation. J. Geophys. Res. 119, 2263–2289. doi: 10.1002/2013JC009331
Keywords: phytoplankton, size, chlorophyll, Red Sea, temperature
Citation: Brewin RJW, Morán XAG, Raitsos DE, Gittings JA, Calleja MLl, Viegas M, Ansari MI, Al-Otaibi N, Huete-Stauffer TM and Hoteit I (2019) Factors Regulating the Relationship Between Total and Size-Fractionated Chlorophyll-a in Coastal Waters of the Red Sea. Front. Microbiol. 10:1964. doi: 10.3389/fmicb.2019.01964
Received: 14 May 2019; Accepted: 09 August 2019;
Published: 09 September 2019.
Edited by:
Hongbin Liu, Hong Kong University of Science and Technology, Hong KongReviewed by:
Yonghong Bi, Institute of Hydrobiology (CAS), ChinaSolange Duhamel, Lamont Doherty Earth Observatory (LDEO), United States
Nicholas Bock, Columbia University, United States, in collaboration with reviewer SD
Copyright © 2019 Brewin, Morán, Raitsos, Gittings, Calleja, Viegas, Ansari, Al-Otaibi, Huete-Stauffer and Hoteit. This is an open-access article distributed under the terms of the Creative Commons Attribution License (CC BY). The use, distribution or reproduction in other forums is permitted, provided the original author(s) and the copyright owner(s) are credited and that the original publication in this journal is cited, in accordance with accepted academic practice. No use, distribution or reproduction is permitted which does not comply with these terms.
*Correspondence: Robert J. W. Brewin, ci5icmV3aW5AZXhldGVyLmFjLnVr