 Suzhen Huang1,2
 Biyun Liu
- 1State Key Laboratory of Freshwater Ecology and Biotechnology, Institute of Hydrobiology, Chinese Academy of Sciences, Wuhan, China
- 2University of Chinese Academy of Sciences, Beijing, China
- 3Sinopec Research Institute of Petroleum Processing, Beijing, China
Polyphenols are allelochemicals secreted by aquatic plants that effectively control cyanobacteria blooms. In this study, sensitive response parameters (including CFPs) of Microcystis aeruginosa were explored under the stress of different polyphenols individually and their combination. The combined effects on M. aeruginosa were investigated based on the most sensitive parameter and cell densities. For pyrogallic acid (PA) and gallic acid (GA), the sensitivity order of parameters based on the EC50 values (from 0.73 to 3.40 mg L–1 for PA and from 1.05 to 2.68 mg L–1 for GA) and the results of the hierarchical cluster analysis showed that non-photochemical quenching parameters [NPQ, qN, qN(rel) and qCN] > photochemical quenching parameters [YII, qP, qP(rel) and qL] or others [Fv/Fm, F’v/F’m, qTQ and UQF(rel)] > cell densities. CFPs were not sensitive to ellagic acid (EA) and (+)-catechin (CA). The sensitivity order of parameters for M. aeruginosa with PA-GA mixture was similar to that under PA and GA stress. The quantitative (Toxicity Index, TI) and qualitative (Isobologram representation) methods were employed to evaluate the combined effects of PA, GA, and CA on M. aeruginosa based on cell densities and NPQ. TI values based on the EC50 cells suggested the additive effects of binary and multiple polyphenols, but synergistic and additive effects according to the EC50 NPQ (varied from 0.16 to 1.94). In terms of NPQ of M. aeruginosa, the binary polyphenols exhibited synergistic effects when the proportion of high toxic polyphenols PA or GA was lower than 40%, and the three polyphenols showed a synergistic effect only at the ratio of 1:1:1. Similar results were also found by isobologram representation. The results showed that increasing the ratio of high toxic polyphenols would not enhance the allelopathic effects, and the property, proportion and concentrations of polyphenols played an important role in the combined effects. Compared with cell densities, NPQ was a more suitable parameter as evaluating indicators in the combined effects of polyphenols on M. aeruginosa. These results could provide a method to screen the allelochemicals of polyphenols inhibiting cyanobacteria and improve the inhibitory effects by different polyphenols combined modes.
Introduction
Polyphenols are well known secondary metabolites in the plant kingdom not only because of their possible health benefits arising from such as their antioxidant activity, antimicrobial capacity and anticancer property (Belščak-Cvitanović et al., 2018; Bouarab-Chibane et al., 2019; Álvarez-Martínez et al., 2020), but also because of their allelopathic inhibition on nuisance phytoplankton in the aquatic ecosystem (Gao et al., 2017; Tan et al., 2019). Many polyphenols, such as pyrogallic acid (PA), gallic acid (GA), ellagic acid (EA), and (+)-catechin (CA), have been identified in aquatic plants (Nakai et al., 2000; Olate-Gallegos et al., 2019; Zolotareva et al., 2019), and confirmed evidently to have allelopathic inhibition against various cyanobacteria (Huang et al., 2016; Techer et al., 2016; Yu et al., 2019). Polyphenols from natural biomaterials have received more attention as alternatives for emergency control of cyanobacteria bloom because of their algae-inhibiting effects, which is specific to cyanobacteria, biodegradable and less toxic effect to other aquatic organisms (Mohamed, 2017; Tan et al., 2019).
Among polyphenols, such as pyrogallic acid (PA), performs a strong inhibitory activity against M. aeruginosa, which is one of the common dominant species of cyanobacteria blooms and the most serious all over the world (Qin et al., 2018; Benayache et al., 2019). Polyphenols exert inhibitory effects on cyanobacteria by direct oxidative damage for causing overproduction of free radicals, or leading to the programmed cell death for inducing signal molecules changes, such as the nitric oxide and hydrogen peroxide (Wang et al., 2013; Lu et al., 2017). Although polyphenols have obvious algae-inhibiting activity, how to explain individual allelochemical with the higher 50% effective concentrations (EC50 values) and much lower concentration released by aquatic plants is still a gap. Nakai et al. (2000) reported that the 72 h EC50 values of PA, GA, EA and CA were 0.65, 1.0, 5.1, and 5.5 mg L–1 for M. aeruginosa (NIES-87), respectively. However, the concentrations of polyphenols released to the culture water were μg L–1 levels (Hilt et al., 2006). It is all known that aquatic plants can release different types of allelochemical into the environment, and their contents and compositions are different for distinct aquatic plants (Tan et al., 2019). There is growing evidence that the combined effects of allelochemicals play an important role in the allelopathy of aquatic plants, and may help to reveal the mechanism of allelopathy in natural aquatic ecosystems (Gao et al., 2015, 2017). A variety of allelochemicals, which coexist in the same environment, show the combined effects, such as additive or synergistic effects. Previous research indicated that the combined effects of allelochemicals were related to their property, proportion and concentrations (Gao et al., 2015; Zuo et al., 2016b). The polyphenols with the proportion identified in the Myriophyllum spicatum-cultured solution presented a synergistic effect to inhibit M. aeruginosa growth (Zhu et al., 2010). Synergistic effects significantly reduced the concentration contribution of a single allelochemical to the EC50 value. Further study found that the effects of individual polyphenols such as PA and GA on the 72 h EC50 values of M. aeruginosa were different according to the cell densities, NPQ and YII parameters (Zhu et al., 2010). The value of EC50 cells was far higher than that of EC50 NPQ and EC50 YII. There were also differences between EC50 NPQ and EC50 YII.
Cyanobacteria photosynthetic systems are the main target sites of polyphenols, which have been used to indicate the response of photosynthesis to environmental stresses (Bussotti et al., 2020; Zhu et al., 2021). PA and GA can inhibit the photosystem II (PSII) activity of cyanobacteria, eventually lead to the suppression of the photosynthetic system (Zhu et al., 2010). Chlorophyll is one of the main photosynthetic pigments and the foundation of algae photosynthesis (Zhu et al., 2021). Most of the light energy absorbed by chlorophyll is used for photosynthesis, heat (non-photochemical quenching-NPQ) and chlorophyll fluorescence (Hanelt, 2018; Zulfugarov et al., 2018). The change of photosynthesis can cause the corresponding change of fluorescence emission because of the mutual competition for energy among these three ways (Zulfugarov et al., 2018). The fluorescence mainly reflects the efficiency of the photochemical energy conversion of PSII reaction centers (Murchie and Lawson, 2013). Different chlorophyll fluorescence parameters (CFPs) suggest different changes of PSII, which contains photochemical quenching parameters [e.g., YII, qP, qP(rel) and qL]; non-photochemical quenching parameters (e.g., NPQ, qN, qN(rel) and qCN); others [e.g. Fv/Fm, F’v/F’m, qTQ and UQF(rel)]. Different CFPs may present different sensitivities under the same stress (Wang et al., 2016). When Scenedesmus obliquus was exposed to isoproturon [3-(4-isopropylphenyl)-1,1-dimethylurea], the order of parameters sensitivity was UQF(rel) > YII > qP > cell densities > qP(rel) (Dewez et al., 2008). Fv/Fm and F’v/F’m were more sensitive parameters than the cell densities in the toxic test of allelochemical ferulic acid and NH4+ toxicity (Wang et al., 2016; Berg et al., 2017). Gan et al. (2019) studied the effects of lead concentrations on the five CFPs of marine microalgae Nitzschia closterium, and found the PSII electron flux per unit volume and effective quantum yield of PSII photochemical energy conversion were the most sensitive CFPs. The varied sensitivities of different CFPs may relate to the different toxicity mechanisms of tested compounds. Whether there is a more sensitive CFPs parameters to characterize the inhibitory effect of different polyphenols (independently or jointly) on cyanobacteria?
In this research, the sensitivities of different CFPs were studied based on the 72 h EC50 values of PA, GA, EA, and CA on M. aeruginosa including 12 kinds of CFPs and cell densities. Besides, the combined effects of three polyphenols PA, GA, and CA were studied with a series of different proportions. The 72 EC50 values of them were calculated based on cell densities and NPQ. The combined effects were analyzed according to quantitative and qualitative methods. Our aims are to (1) screen sensitive response parameter to individual polyphenols stress, (2) determine sensitive response parameters to combined polyphenols, (3) and find the combined effects of polyphenols with different properties, proportion based on cell densities and the most sensitive parameter. These results could provide a method to screen the allelochemicals of polyphenols inhibiting cyanobacteria and improve the inhibitory effects by different polyphenols combined modes.
Materials and Methods
Culture Conditions
M. aeruginosa (toxic FACHB 905) was provided by the Freshwater Algae Culture Collection of the Institute of Hydrobiology, the Chinese Academy of Sciences. It was axenically cultivated in MIII medium at 25 ± 2°C in an incubator with a light/dark cycle of 12:12 h and an irradiance of 57 μmol photons m–2s–1, and manually shaken three times every day. In this study, M. aeruginosa in the exponential growth phase was used.
Polyphenols Chemicals
The polyphenols PA (99.5%, Chemservice), GA (>96.0%, ACROS), EA (≥96.0%, Fluka) and CA (98%, TCI) were commercially obtained. Dimethyl sulfoxide (DMSO, > 98%) was of analytical grade.
Bioassays of Independent and Mixed Polyphenols
The dose-response relationships between polyphenols and M. aeruginosa were performed. The initial algae density was 1 × 10⁶ cells mL–1. The final concentrations of independent polyphenols in the test solution were, respectively, 0.5, 1, 2.5, 5, 7.5 and 10 mg L–1 for PA and GA, and 2.5, 5, 7.5, 10, 20, and 50 mg L–1 for EA and CA. PA, GA, and CA were selected to study the combined effects of polyphenols. The component ratios were 1:4, 2:3, 1:1, 3:2, and 4:1 in binary polyphenols, and 1:1:3, 1:2:2, 1:3:1, 1:1:1, 2:1:2, 2:2: 1, 3:1:1 in three polyphenols. The final concentrations of polyphenols in the test solution were 0.5, 1, 2.5, 5, 7.5, 10, and 15 mg L–1. The 50% inhibition concentrations of every polyphenol based on the CFPs and cell densities of M. aeruginosa were determined after exposure for 72 h. The stock solutions of polyphenols were prepared with DMSO, which in the test solution was lower than 0.3% (v/v). And the test results indicated that adding DMSO did not affect the photosynthetic activity and cells.
The inhibition percentage of PA and GA mixture on M. aeruginosa were determined according to CFPs and cell densities after 24 h. The proportion of mixture was: PA: GA/1:1. The final concentration of PA-GA in the test solution was 2.5 mg L–1. And the inhibition percentage was calculated by the following equation:
Inhibition percentage = 100 (Xcontrol – Xtreatment)/Xcontrol
where Xcontrol represented the different parameters of M. aeruginosa in control, and Xtreatment was the corresponding parameters of M. aeruginosa in treatment.
Determination of Cell Densities and Chlorophyll Fluorescence Parameters
The cell densities of M. aeruginosa were examined with a light microscope and hemocytometer (Huang et al., 2016). The CFPs were determined by pulse amplitude modulated fluorometer (Phyto-PAM Walz, Effeltrich, Germany). The details could be obtained in Campbell et al. (1998) and Mallick and Mohn (2003). Fo (minimum fluorescence), F’o (minimum fluorescence in the light-adapted state), Fs (steady-state fluorescence), F’m (maximal fluorescence in the light-adapted state) and Fm (maximal fluorescence) were determined. Fo was determined after a dark-adapted for 5 min. F’o was calculated according to the formula in Oxborough and Baker (1997). Fs was achieved by illuminating for 3 min with actinic light at 64 μmol photons m–2s–1, a similar light intensity to the cultivation during the experiment. The time of actinic light exposure was optimized before starting. Then a saturating light pulse was given to get F’m. Fm was determined in the presence of 10 mM 3-(3,4-dichlorophenyl)-1,1-dimethylurea (DCMU) due to state transition (Campbell et al., 1998). The 12 kinds of CFPs calculated from slow chlorophyll fluorescence induction kinetics were listed in Table 1 (Roháček and Barták, 1999; Kramer et al., 2004; Juneau et al., 2005).
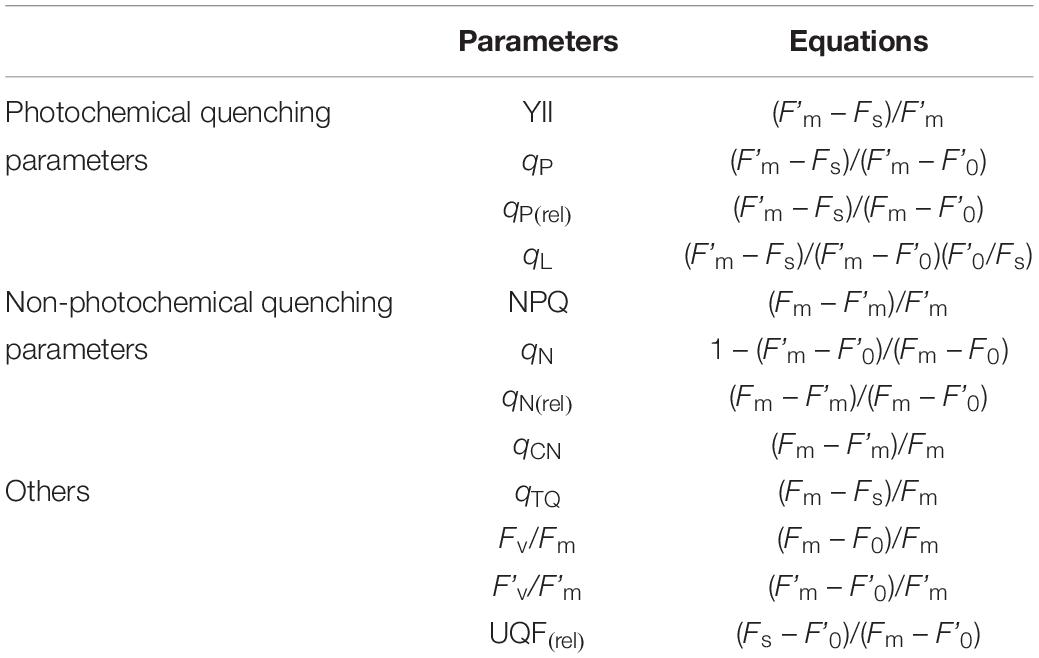
Table 1. The equations of chlorophyll fluorescence parameters used in this study.
Estimation of Combined Effects
Toxicity index (TI) and isobologram representation were employed to evaluate the combined effects of polyphenols on target organisms in this study.
TI Model
TI was calculated by the following equation (Gao et al., 2015):
TI = Σ(CmixA/EC50A).
Where CmixA was the concentration of component A at the EC50 value of the mixture (mg L–1), and EC50A was the EC50 value of component A measured individually (mg L–1). The additional effect was characterized by 0.5 < TI < 2. The value of TI > 2 represented antagonism and TI < 0.5 indicated synergism.
Toxic Unit and Isobolograms
The theory of toxic unit (TU) was introduced by Brown (1968) and Sprague (1970) and calculated by the equation:
TUA = CmixA/EC50A.
EC50A was the effective concentration required to gain 50% inhibition of component A individually, and CmixA corresponded to EC50 of A in the mixture. Then TU values of the binary mixtures were plotted on an isobologram, which characterizes the combined effects of binary mixtures on target organisms. The additivity line (linear equation: X + Y = 1.0) was a straight line joining TU of every single component, which represented the additive effect of the mixtures (Kortenkamp and Altenburger, 1998). In this research, Deneer’s method was employed to explain the endpoint of combined effects (Deneer, 2000). The additivity effects were the region between the up additivity line (linear equation: X + Y = 2.0) and low additivity line (linear equation: X + Y = 0.5). When an isobole was below the low additivity line, the components presented synergistic effects, whereas, it is depicted as an antagonistic effect above the up additivity line (Calamari and Alabaster, 1980).
Statistical Analysis
The 50% inhibition concentrations based on CFPs and cell densities of M. aeruginosa were calculated from probit regression generated by SPSS 13.0 for Windows. Tukey’s honestly significant difference test and T-test were used to test the statistical significance of the differences between controls and treatments. The dendrograms of hierarchical cluster analysis for CFPs and cell densities were done by SPSS 13.0 software. Ward’s method was applied and Squared Euclidean Distance was chosen as a measurement for hierarchical cluster analysis.
Results
Parameters of EC50 and Its Order of Individual Polyphenol on M. aeruginosa
The 72 h EC50 values of PA based on CFPs and cell densities of M. aeruginosa varied from 0.73 to 3.40 mg L–1 for PA, 1.05 to 2.68 mg L–1 for GA, 17.95 to 52.38 mg L–1 for EA, and 17.95 to 52.38 mg L–1 for CA (Table 2). As displayed in Table 2, the order of parameters according to the EC50 values was: qCN < NPQ < qN < qN(rel) < UQF(rel) < YII < qTQ < Fv/Fm < F’v/F’m < qP(rel) < cell densities < qP < qL for PA, NPQ < qN < qCN < qN(rel) < UQF(rel) < YII < qP(rel) < qL < qTQ < qP < Fv/Fm < F’v/F’m < cell densities for GA, qCN < NPQ < UQF(rel) < qTQ < YII < qP(rel) < qL < cell densities < qP < Fv/Fm < qN < F’v/F’m < qN(rel) for EA, and cell densities < NPQ < qTQ < YII < Fv/Fm < F’v/F’m < UQF(rel) < qCN < qN < qP(rel) < qL < qN(rel) < qP for CA. CFPs were more sensitive than cell densities in PA and GA, but which was not found in EA and CA. Besides, the parameters sensitivity order of PA was consistent with that of GA, and those of EA were close to CA. Therefore, the four polyphenols were divided into two subsets for further hierarchical cluster analysis.
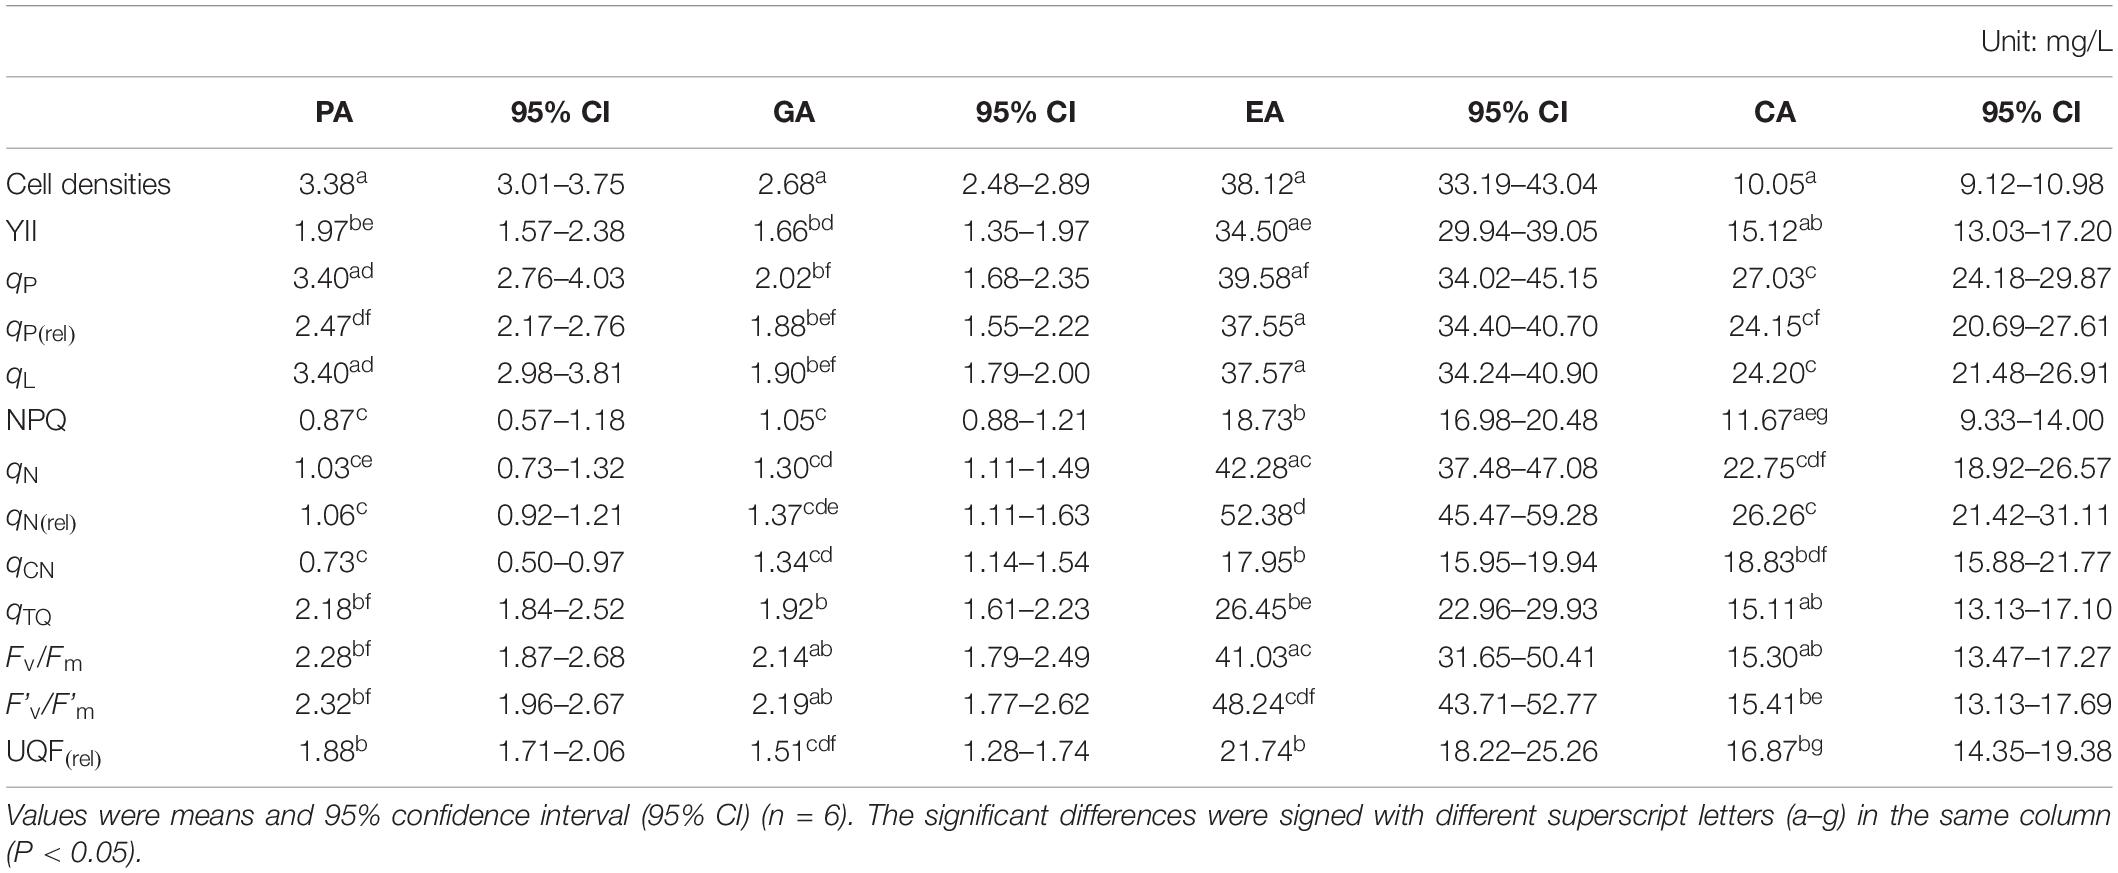
Table 2. The 72 h EC50 values of individual allelopathic polyphenol based on chlorophyll fluorescence parameters and cell densities of M. aeruginosa.
The results of hierarchical cluster analysis were presented in Figure 1. As shown in Figure 1A, the parameters of PA and GA were divided into three main clusters: (1) qP, qL and cell densities; (2) Fv/Fm, F’v/F’m, qTQ, YII, qP(rel) and UQF(rel); (3) qN, qN(rel), qCN and NPQ. Figure 1B displayed that three main clusters were gained from the parameters of EA and CA: (1) qCN, UQF(rel), NPQ, qTQ and YII; (2) cell densities, Fv/Fm, F’v/F’m and qN(rel); (3) qL, qP(rel), qP and qN. The clusters based on hierarchical cluster analysis agreed well with the results obtained from the above EC50 values.
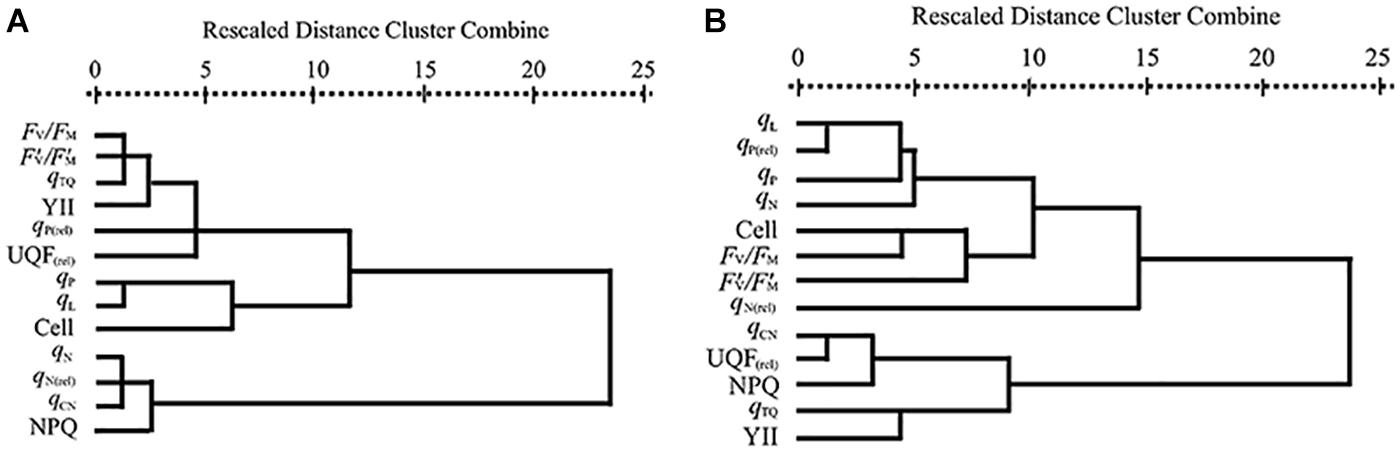
Figure 1. Dendrogram of hierarchical cluster analysis according to 72 h EC50 values of (A) PA and GA and (B) EA and CA to M. aeruginosa based on CFPs and cell densities. Cell means cell densities.
The Response Parameters and Its Order of PA-GA Mixture on M. aeruginosa
Figure 2 exhibited the inhibition percentage of PA-GA mixture on M. aeruginosa after 24 h. The inhibition percentages were more than 55% based on NPQ, qN, qCN and qN(rel), between 17.47 and 26.99% for Fv/Fm, qTQ, F’v/F’m, YII and UQF(rel), and lower than 10% for qL, qP(rel), cell densities and qP. It could be found that the sensitivity order of the parameters was non-photochemical quenching parameters > photochemical quenching parameters or others > cell densities. Based on all of the above results, NPQ and cell densities were selected for the following experiments.
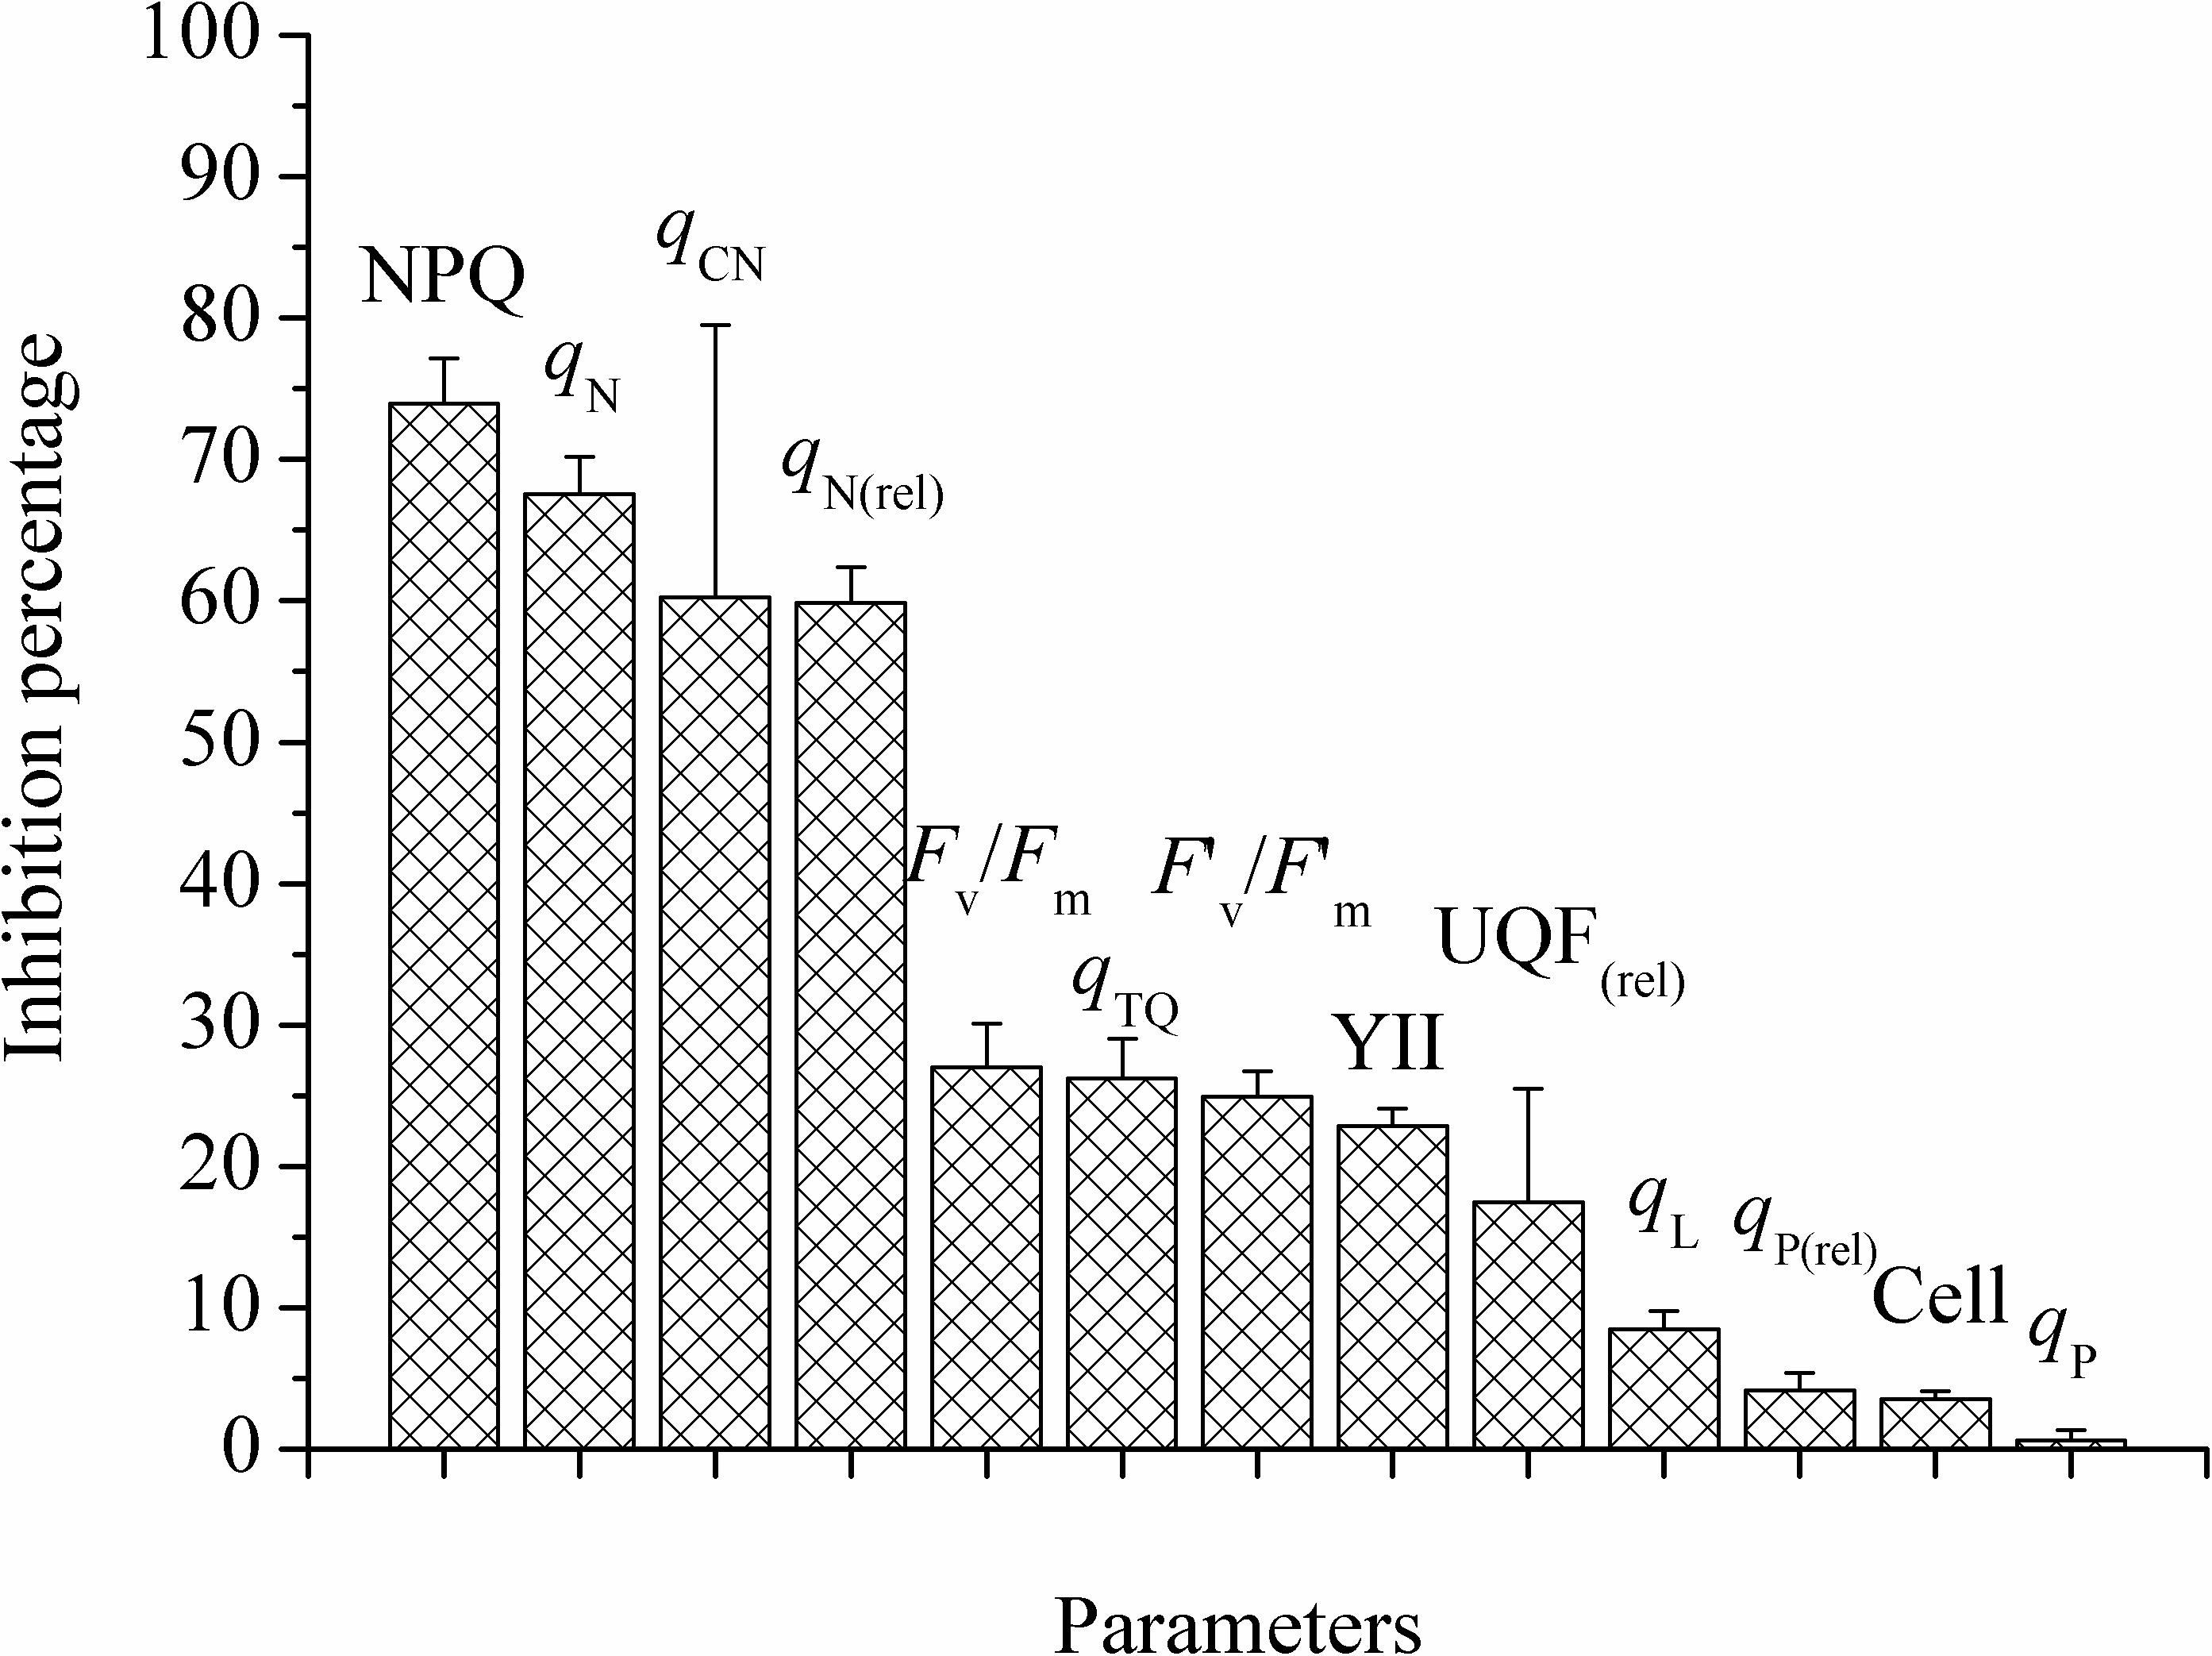
Figure 2. The inhibition percentages of different parameters with the mixture of PA and GA after 24 h for M. aeruginosa. The proportion of mixture was: PA: GA, 1:1. Values were means ± SD (n = 3). Cell means cell densities.
72 h EC50 Values of the Different Polyphenols Mixtures Based on Parameters NPQ and Cell Densities
The 72 h EC50 values of the mixtures were listed in Tables 3, 4. Except for the mixtures of PA:CA/3:2 and PA:GA:CA/1:2:2, the 72 h EC50 values of M. aeruginosa based on NPQ were much lower than those of cell densities (P < 0.05). The EC50 cells value was several times as lager as EC50 NPQ, and the highest times could reach 5.54 times in the mixture of PA:GA/4:1. Therefore, NPQ was more sensitive than cell densities. Except for PA:CA/3:2 and GA:CA/4:1, the EC50 cells values increased with the increase of the low toxic compound (CA) ratio in the mixtures of PA-CA and GA-CA, but which was not found in the mixtures of PA-GA, and PA-GA-CA. The strongest inhibition was shown in the mixture of PA:GA/4:1 with EC50 NPQ values of 0.46 ± 0.09 mg L–1, the mixture of GA:CA/1:4 presented the weakest inhibition with the EC50 cells values of 9.84 ± 0.26 mg L–1. And they were nearly 21 times difference in EC50 values.
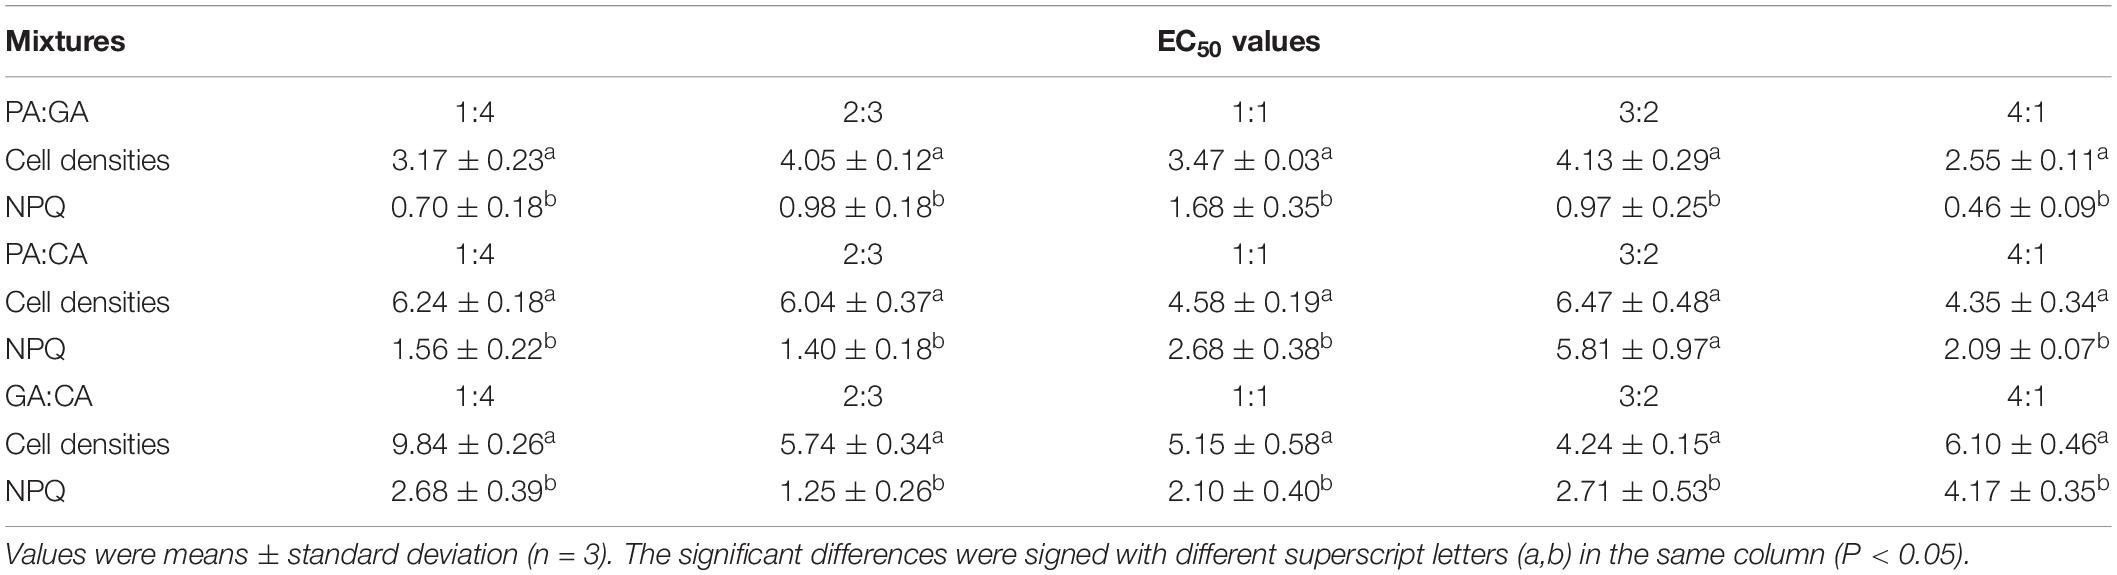
Table 3. The 72 h EC50 values (mg L–1) of the binary polyphenols mixtures on M. aeruginosa according to cell densities and NPQ at different proportions.
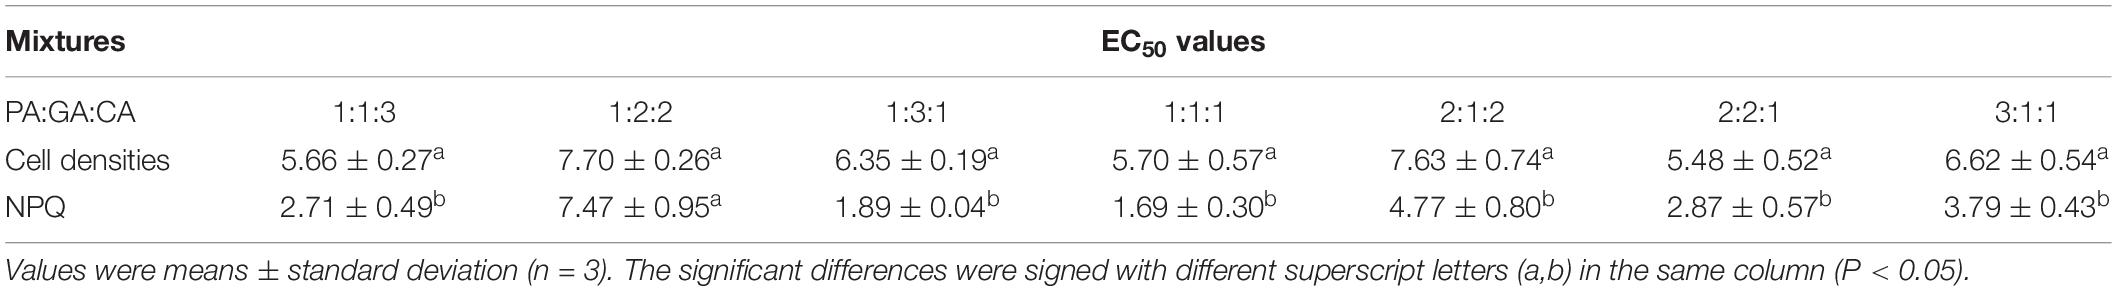
Table 4. The 72 h EC50 values (mg L–1) of the three polyphenols mixtures on M. aeruginosa according to cell densities and NPQ at different proportions.
Combined Effects Assessing by TI Mode
The TI values of the mixtures were reported on the histograms (Figures 3, 4). TI values based on the EC50 cells values ranged from 0.88 to 1.99, which were included in the interval [0.5–2.0], revealing the additive effects of binary and three polyphenols on M. aeruginosa (Figures 3A, 4A). No correlation could be observed between TI values and the proportions of polyphenols in the mixtures. The TI values based on the EC50 NPQ value varied from 0.16 to 1.94, covering the synergistic and cumulative effects (Figures 3B, 4B). Apart from the PA-GA/1:1, the mixture of PA-GA indicated a synergistic effect according to NPQ (Figure 3B). Other binary polyphenols presented synergistic effects at the ratio of 1:4 and 2:3 (Figure 3B). However, the three polyphenols only exhibited a synergistic effect at the ratio of 1:1:1 (Figure 4B). The synergistic effects of binary polyphenols were stronger than that of the three polyphenols by comparing their TI index (p < 0.05).
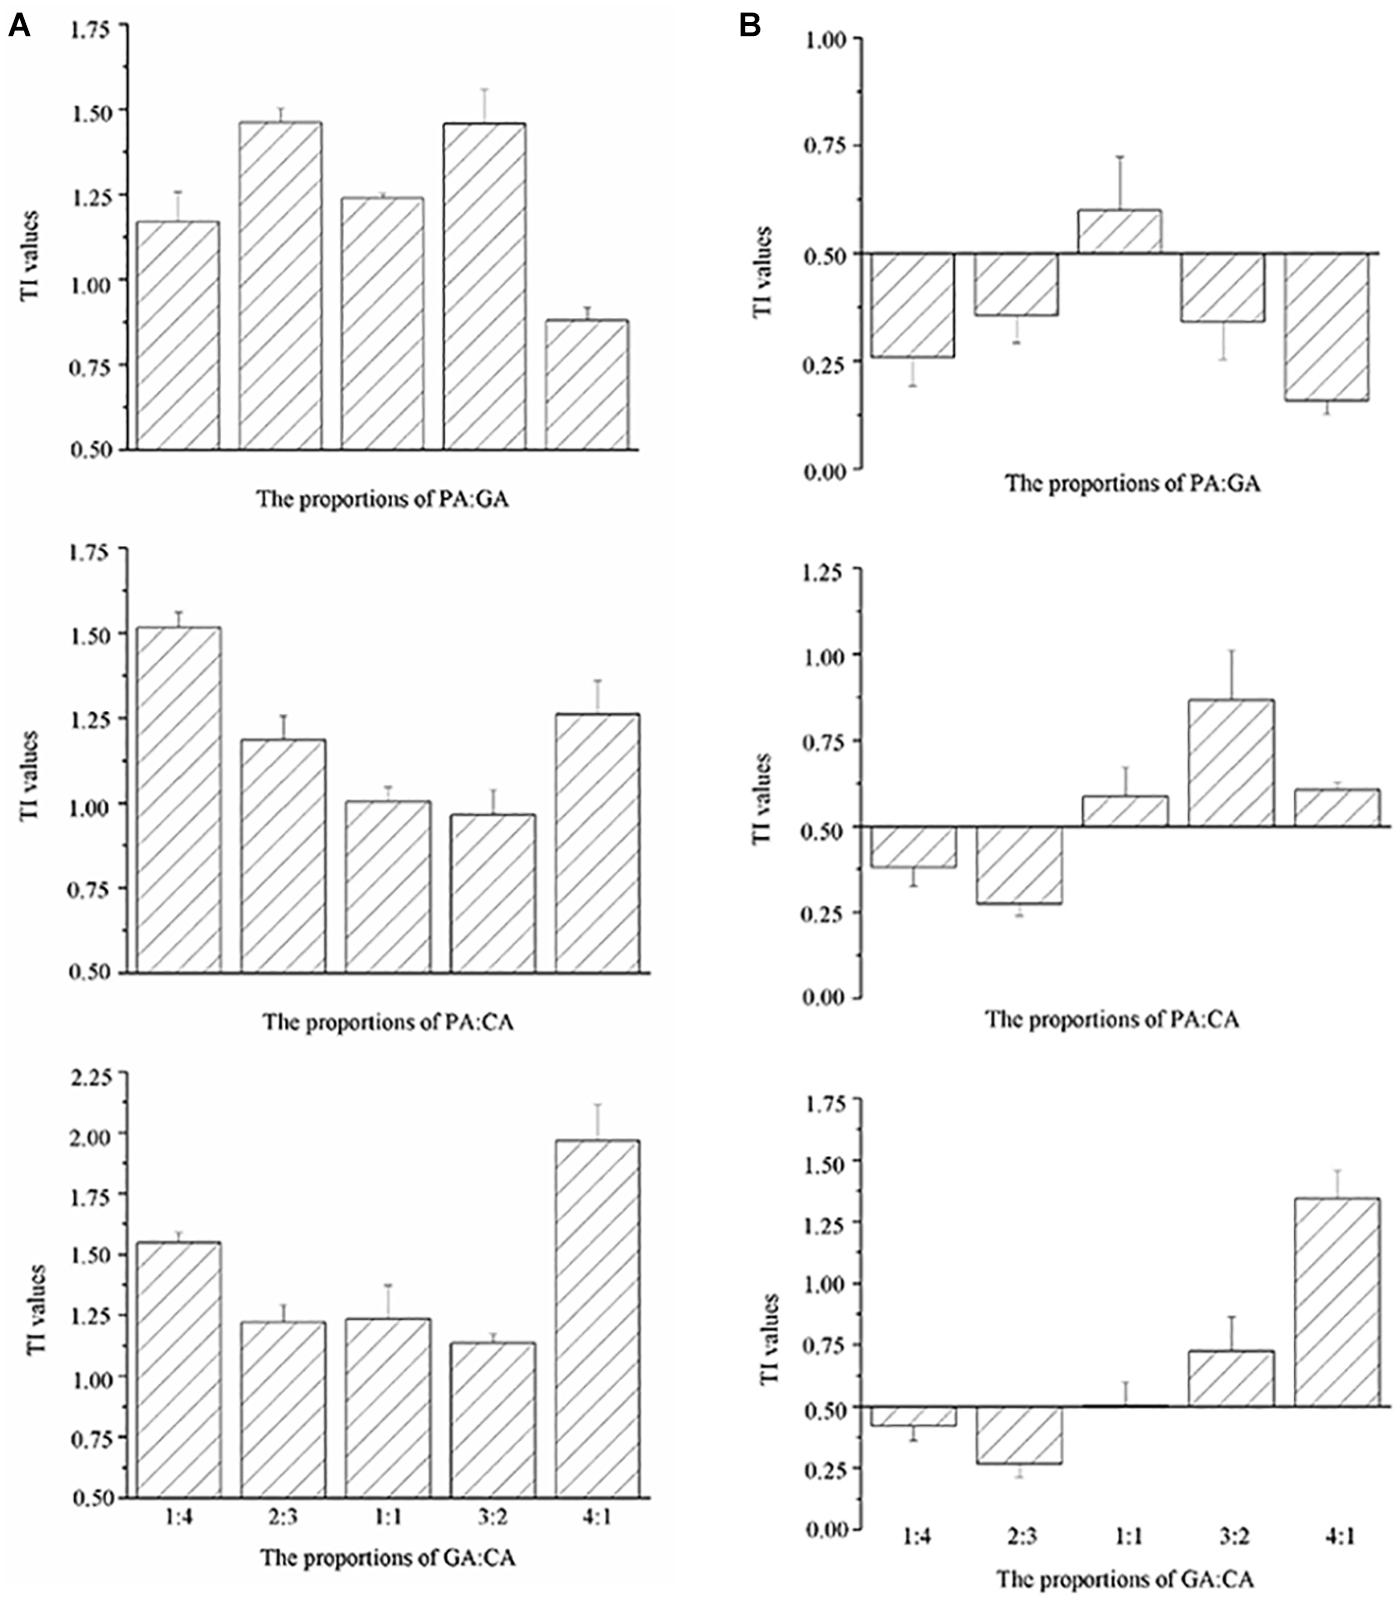
Figure 3. TI values calculated according to cell densities (A) and NPQ (B) of M. aeruginosa in the mixtures of binary polyphenols (means ± SD, n = 3).
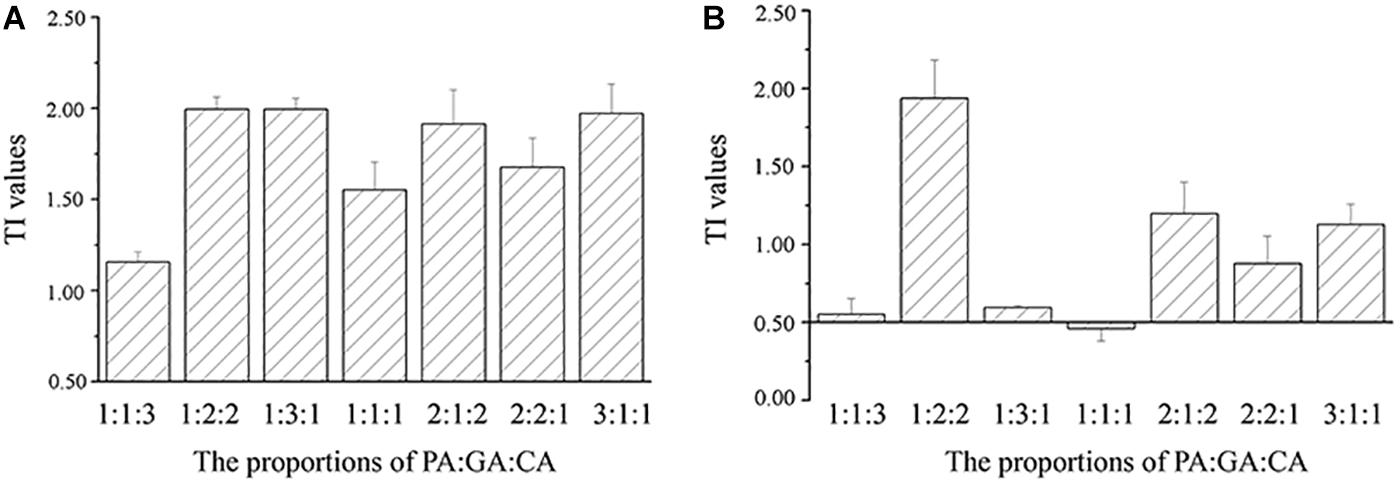
Figure 4. TI values calculated according to cell densities (A) and NPQ (B) of M. aeruginosa in the mixtures of three polyphenols (means ± SD, n = 3).
Combined Effects Assessing by Isobolograms
The TU values of the mixtures were shown on the isobologram (Figure 5). All the TU values based on the cell densities were between the straight lines X + Y = 2.0 and X + Y = 0.5, and the tested organisms were away from synergism and antagonism lines, revealing an additive effect of binary polyphenols on M. aeruginosa (Figure 5A). Figure 5B presented TU values of the binary polyphenols based on the EC50 NPQ values of M. aeruginosa. The isobolographic plots revealed synergistic effects at the ratio of PA:CA/1:4, PA:CA/2:3, GA:CA/1:4, and GA:CA/2:3 on M. aeruginosa. For high toxic compounds PA and GA, except for the ratio of 1:1, isobolograms indicated synergistic effects for the most studied combination ratios. The results suggested binary polyphenols exhibited synergistic effects when the percentages of high toxic PA or GA lower than 40%. The results of isobolograms were in agreement with those of TI values.
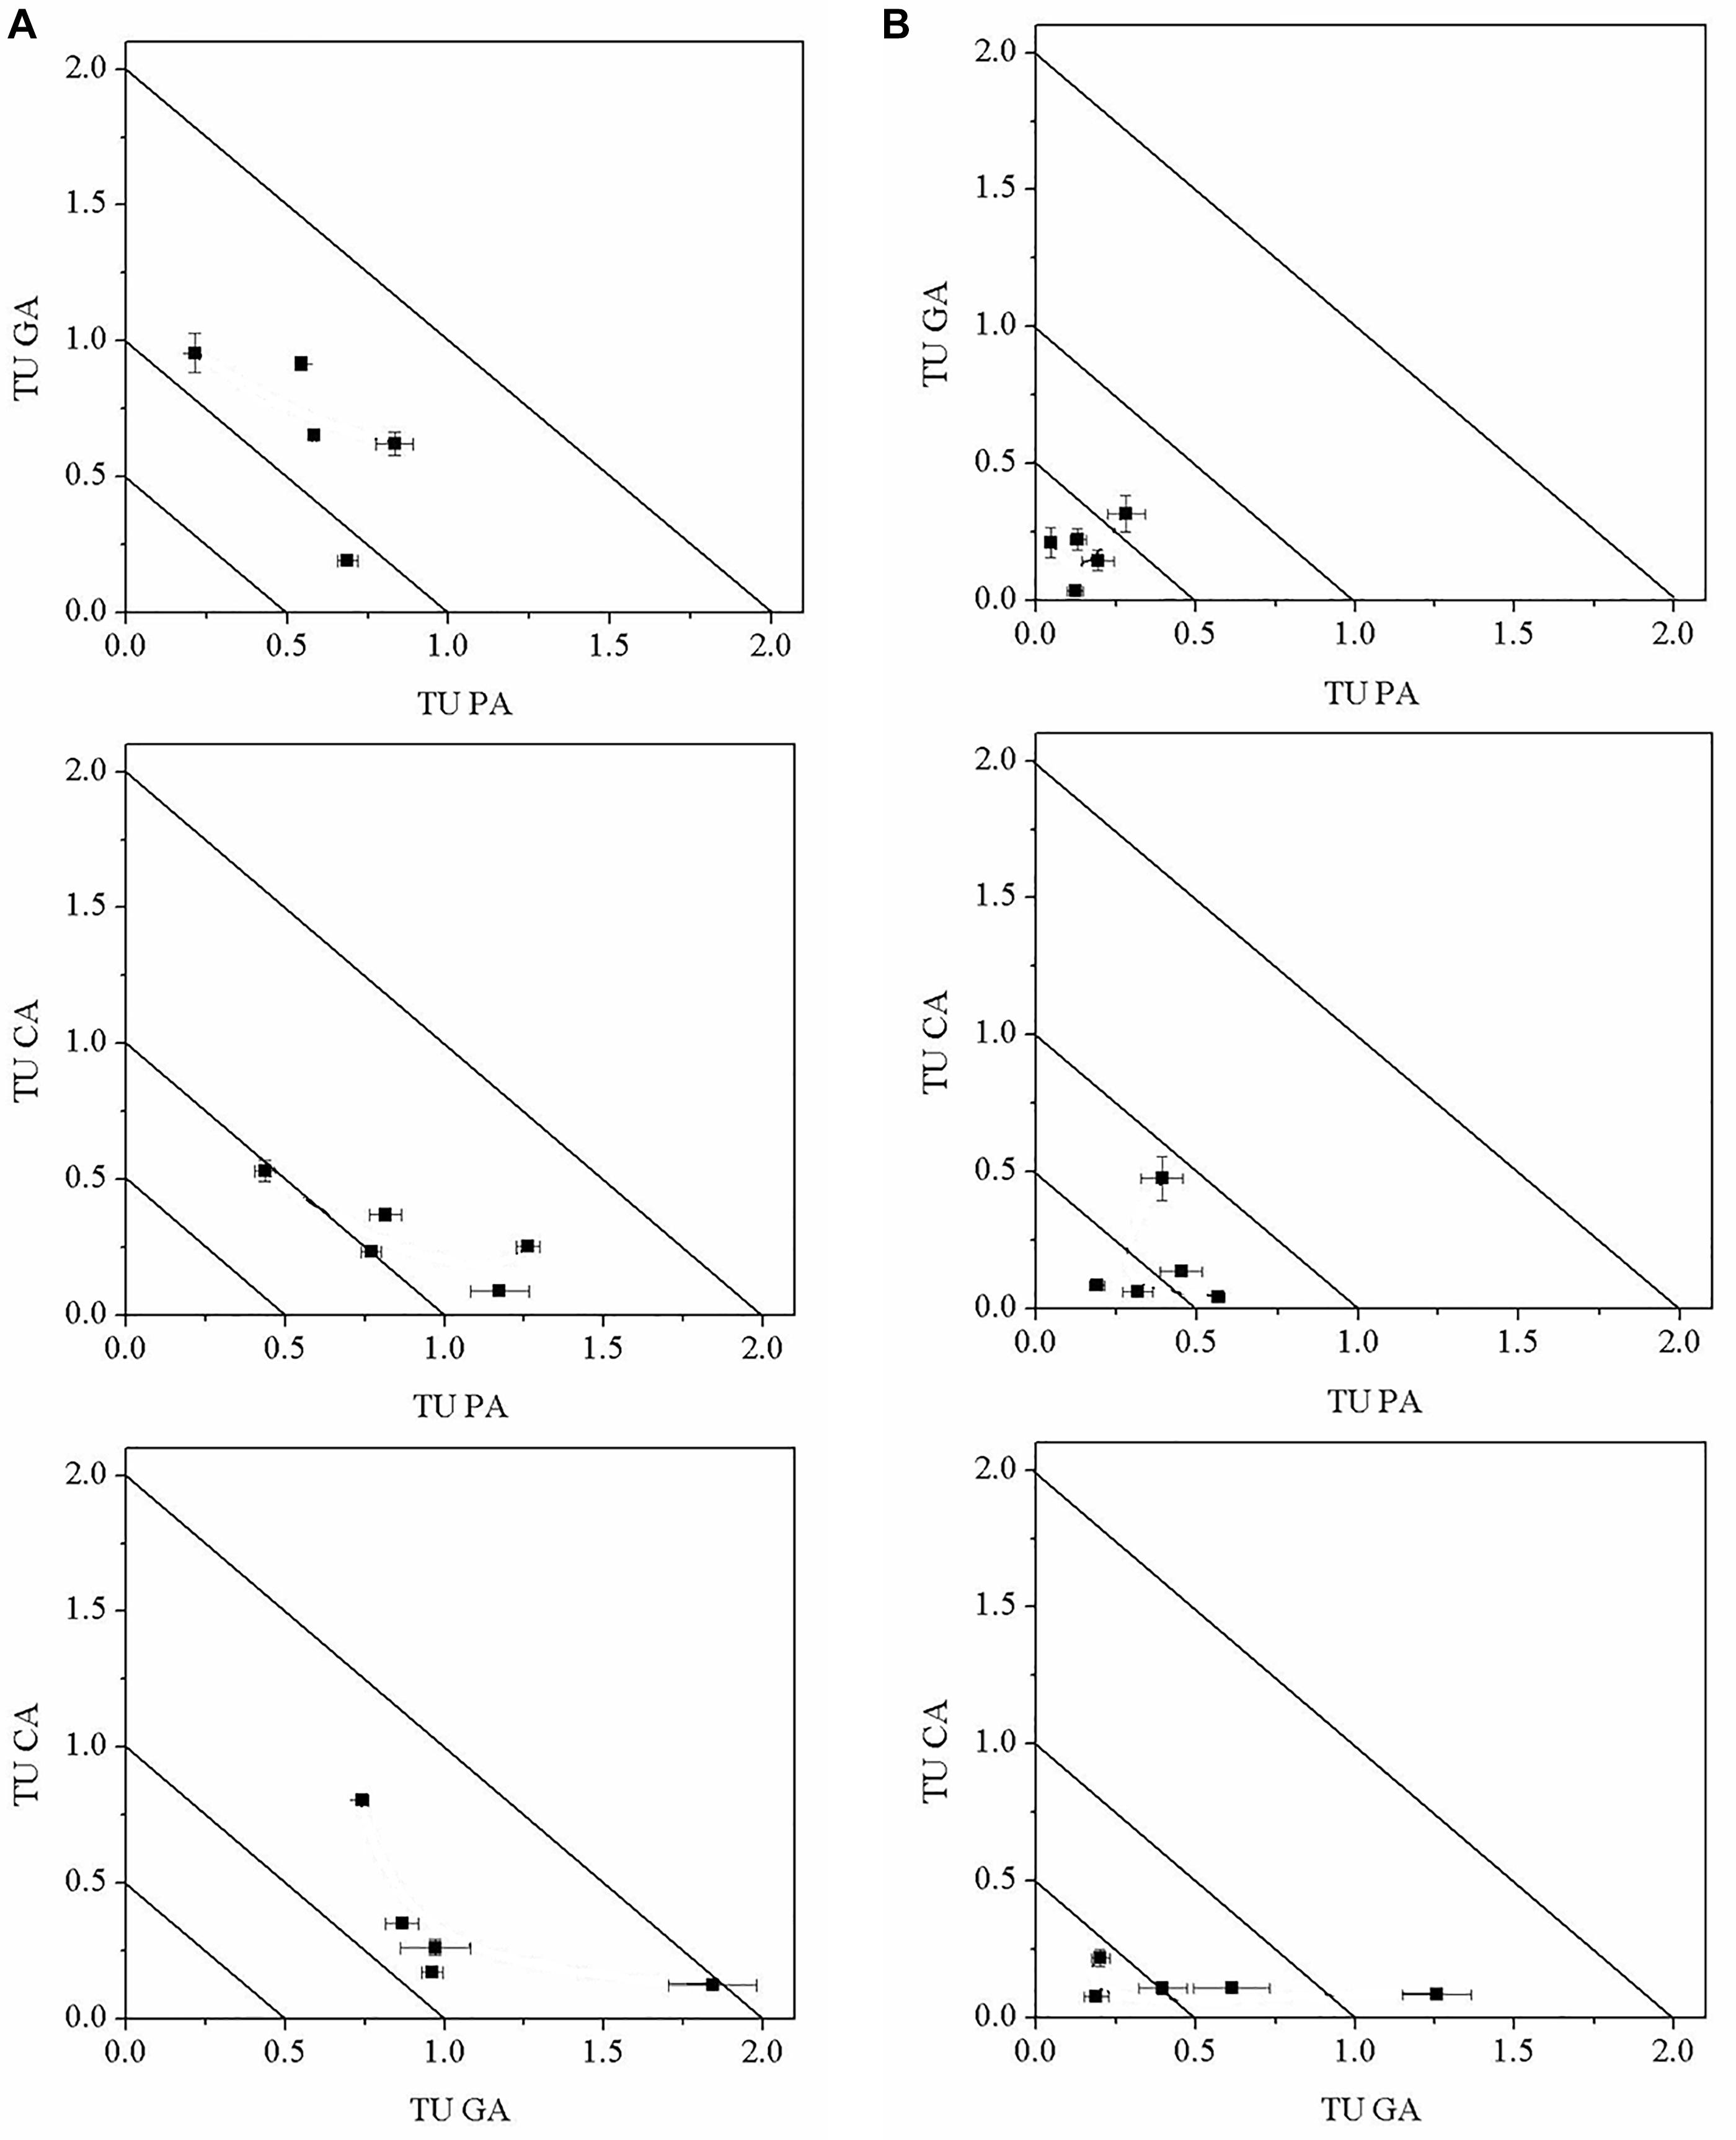
Figure 5. Isobologram representation according to cell densities (A) and NPQ (B) of M. aeruginosa in the mixtures of binary polyphenols (means ± SD, n = 3).
Discussion
Under environmental stress, the excess light energy may result in the formation of reactive oxygen species, which may irreversibly damage PSII and cause a continuous decline in photosynthetic efficiency (Weisz et al., 2017; Gao et al., 2018). The non-photochemical quenching parameters can be applied to estimate a share of energy dissipation within the antenna system, which is a self-protection mechanism of cells under excess light energy (Roach and Krieger-Liszkay, 2014; Xu et al., 2019). The excess light energy is eliminated by non-photochemical quenching to protect the normal progress of the photochemical reaction (Yong et al., 2018). Therefore, non-photochemical quenching parameters always increase to protect photosynthesis under mild stress or in the early stage of severe stress by quenching (e.g., pH-gradient build-up, LHC2 phosphorylation and zeaxanthin formation) and recovery (such as a stress-adapting D1 protein) mechanisms, but decrease with further damage (Cummings et al., 2018; Nowicka, 2019). Photochemical quenching parameters reflect the photochemical capacity of PSII in the light-adapted state and correspond to the steady-state fraction of oxidized PSII reaction centers (Zulfugarov et al., 2018). The decline of photochemical quenching parameters suggests the amount of energy used in photochemistry becomes small, namely, the actual photosynthetic efficiency is reduced (Campbell et al., 1998; Henriques, 2009). In this study, non-photochemical quenching parameters was the most sensitive parameters to PA and GA, followed by photochemical quenching parameters or others [Fv/Fm, F’v/F’m, qTQ, and UQF(rel)], and the least sensitive was cell densities. Under the stress of PA and GA, the PSII activity of M. aeruginosa was influenced at the beginning, but non-photochemical quenching could protect the photosynthesis (Sonani et al., 2018). The protective effects of non-photochemical quenching were gradually lost for further inhibition, and photochemical quenching parameters decreased followly, ultimatly, photosynthetic efficiency dropped significantly (Cummings et al., 2018). For instance, the expression of psbA gene encoding the stress-adapting D1 protein (the main components of PSII) was inhibited by PA in cyanobacteria Cylindrospermopsis raciborskii (Wu et al., 2013). The effect of environmental stress on photosynthesis was instant, but cell densities were a manifestation of cell growth and cell division, so cell densities lagged behind the response of chlorophyll fluorescence in time (Wang et al., 2016). However, for EA and CA, CFPs were not more sensitive than cell densities. This may be explained by the inhibitory site of PA and GA was PSII on M. aeruginosa, which was from the oxygen-evolving complex to the secondary PSII quinone electron acceptor (QB) and the entire electron transport chain; while EA and CA might show inhibitory effects on the photosynthesis by other mechanisms rather than photosynthetic system and the entire electron transport chain in toxicity bioassays, therefore, there is no obvious rule between the influence of CFPs and cell densities (Zhu et al., 2010; Wang et al., 2011). In return, the rule has been proved by PA-GA mixtures.
O2 and NAD(P)H were continuously produced through photosynthesis in M. aeruginosa cultured under light conditions (Hanelt, 2018). With the exposure of PA and GA, NAD(P)H was used as the electron donor to amplify the production of ROS by the pseudo-circular electron transport chain in photosynthesis and the ineffective redox cycle, which formed under inefficient electrons transfer within disrupted photosynthetic electron transport chain and might be greatly enhanced organisms toxicity, such as decrease of photosynthetic efficiency and cell growth rate, peroxidation of membrane lipid, destruction of cell structure and function, even cell death (Zhu et al., 2010; Wang et al., 2011; Gomes et al., 2017). However, the production of ROS was induced by the ineffective redox cycle for CA (Wang et al., 2011), and the EC50 value of CA was much higher than that of PA and GA as our research results show (2.97–25.80 times). So these might be the reasons for adding CA to the PA-GA mixtures did not change the sensitivity of NPQ. And similar results were also found in other researches, especially for monitoring photosynthesis inhibitors exposure in ecotoxicological test systems (Dewez et al., 2008; Macedo et al., 2008; Wang et al., 2016; Berg et al., 2017). CFPs were more sensitive than the growth during the effects of herbicides on macrophytes (Knauert et al., 2010). And CFPs served as the best markers for evaluating the quality of the edible blue-green algae Nostoc flagelliforme (Gao et al., 2014). Other CFPs such as YII, qP and qN could be used as early indicators of algae cells in response to heavy metals and fungicides (Lu et al., 2000; Dewez et al., 2005; Gan et al., 2019).
To study the action modes for highly effective inhibition of polyphenols with low concentrations on M. aeruginosa, two complementary methods, TI and TU models were used. The TI model is a quantitative evaluation of the combined effects between binary or multiple mixtures (Gao et al., 2015). In the combined effects of PA, GA and CA on M. aeruginosa, TI values showed different combined effects according to different parameter indicators. The combined effects of binary and multiple polyphenols based on cell densities indicated additive effects. However, the binary and three mixtures exhibited synergistic and additive effects on M. aeruginosa based on NPQ. Additionally, it was found that the synergistic effects of the two-dimensional combination of polyphenols were stronger than that of the three-dimensional combination by comparing their TI index. These may indicate that the combined effects of polyphenols were not only related to the species numbers of the mixtures, but also affected by other factors such as the property, proportion and concentrations of each substance in the mixtures (Zuo et al., 2016a,b). Of course, parameters chosen as evaluating indicators were important in the combined effects of polyphenols on M. aeruginosa, and suitable indicators might be helpful to reflect the mechanism of the combined effects (Wang et al., 2016). Compared with cell densities, CFPs, especially NPQ, were suitable parameters as evaluating indicators in the combined effects of polyphenols on M. aeruginosa. The TU model is a qualitative analysis of the combined effects of binary mixtures (Wilkinson et al., 2015). In this study, the results of the qualitative analysis were consistent with that of quantitative analysis.
Our research found that the combined effects of multiple polyphenol allelochemicals on M. aeruginosa were stronger than that of the single polyphenol treatment based on the sensitive response parameters NPQ. Although the inhibiting algae effects of the polyphenols with lower concentration could be explained partly by combined effects, allelopathy is complicated in natural habitats. The contents and types of polyphenols released by aquatic plants vary in different seasons and aquatic plants, which impacts the inhibitory activity of allelochemicals (Tazart et al., 2020). The environmental factors such as pH, light, and nutrition, also influence the effects of allelochemicals and sensitivity of target phytoplankton (Mohamed, 2017). The further research of these gaps is needed in the next step.
Conclusion
(1) Chlorophyll fluorescence parameters (CFPs) presented more sensitive than cell densities. For PA and GA inhibiting photosystem II (PSII) activity of M. aeruginosa 905, the sensitivity order of parameters based on the EC50 values was: non-photochemical quenching parameters [NPQ, qN, qN(rel) and qCN] > photochemical quenching parameters [YII, qP, qP(rel) and qL] or others [Fv/Fm, F’v/F’m, qTQ and UQF(rel)] > cell densities.
(2) The binary and three mixtures exhibited synergistic and additive effects on M. aeruginos based on NPQ, but additive effects based on the cell densities. According to NPQ, the synergistic effects were exhibited at binary polyphenols with a proportion of high toxic polyphenols (PA or GA) less than 40%, and three polyphenols only at the proportion of 1:1:1.
(3) The combined effects of polyphenols released by aquatic macrophytes with low concentration play an important role in inhibiting phytoplankton growth in natural aquatic ecosystems.
Data Availability Statement
The raw data supporting the conclusions of this article will be made available by the authors, without undue reservation, to any qualified researcher.
Author Contributions
SH and JZ conceived and designed the work, drafted the manuscript, and performed the experiments. BL revised the work critically for important intellectual content. LZ, XP, and XZ analyzed the results. FG and ZW revised the manuscript. All authors read and approved the final manuscript.
Funding
This study was supported by the National Nature Science Foundation of China (Grant No. 31830013), Frontier Special Projects of Wuhan Science and Technology Plan Application Foundation (Grant No. 2019020701011491), and the Key Research and Development Plan of Ningxia Hui Autonomous Region (Grant No. 2017BY087).
Conflict of Interest
The authors declare that the research was conducted in the absence of any commercial or financial relationships that could be construed as a potential conflict of interest.
Abbreviations
CFPs, chlorophyll fluorescence parameters; YII, the effective quantum yield of photochemical energy conversion in photosystem II (PSII); qP, a parameter estimating the fraction of PSII centers in open states based on a puddle model for the photosynthetic unit; qL, a parameter estimating the fraction of PSII centers in open states based on a lake model for the photosynthetic unit; qP(rel), relative photochemical quenching; NPQ, light induced photoprotection through thermal dissipation of energy in the antenna system; qN, light induced photoprotection through thermal dissipation of energy in thylakoid membrane; qN(rel), relative non-photochemical quenching; qCN, complete non-photochemical quenching; qTQ, total quenching; Fv/Fm, the maximum quantum yield of PSII photochemistry; F’v/F’m, the effective quantum yield of PSII photochemistry; UQF(rel), relative unquenched fluorescence; EC50, the higher 50% effective concentrations; TI, toxicity index; TU, toxic unit.
References
Álvarez-Martínez, F. J., Barrajón-Catalán, E., Encinar, J. A., Rodríguez-Díaz, J. C., and Micol, V. (2020). Antimicrobial capacity of plant polyphenols against gram-positive bacteria: a comprehensive review. Curr. Med. Chem. 27, 2576–2606. doi: 10.2174/0929867325666181008115650
Belščak-Cvitanović, A., Durgo, K., Huđek, A., Bačun-Družina, V., and Komes, D. (2018). “Overview of polyphenols and their properties,” in Polyphenols: Properties, Recovery, and Applications, ed. C. M. Galanakis (Sawston: Woodhead Publishing), 3–44. doi: 10.1016/b978-0-12-813572-3.00001-4
Benayache, N. Y., Nguyen-Quang, T., Hushchyna, K., McLellan, K., Afri-Mehennaoui, F. Z., and Bouaïcha, N. (2019). “An overview of cyanobacteria harmful algal bloom (CyanoHAB) issues in freshwater ecosystems,” in Limnology-Some New Aspects of Inland Water Ecology, ed. D. Gokce (London: IntechOpen).
Berg, G. M., Driscoll, S., Hayashi, K., Ross, M., and Kudela, R. (2017). Variation in growth rate, carbon assimilation, and photosynthetic efficiency in response to nitrogen source and concentration in phytoplankton isolated from upper San Francisco Bay. J. Phycol. 53, 664–679. doi: 10.1111/jpy.12535
Bouarab-Chibane, L., Forquet, V., Lantéri, P., Clément, Y., Léonard-Akkari, L., Oulahal, N., et al. (2019). Antibacterial properties of polyphenols: characterization and QSAR (quantitative structure-activity relationship) models. Front. Microbiol. 10:829. doi: 10.3389/fmicb.2019.00829
Brown, V. M. (1968). The calculation of the acute toxicity of mixtures of poisons to rainbow trout. Water Res. 2, 723–733. doi: 10.1016/0043-1354(68)90044-4
Bussotti, F., Gerosa, G., Digrado, A., and Pollastrini, M. (2020). Selection of chlorophyll fluorescence parameters as indicators of photosynthetic efficiency in large scale plant ecological studies. Ecol. Indic. 108:105686. doi: 10.1016/j.ecolind.2019.105686
Calamari, D., and Alabaster, J. S. (1980). An approach to theoretical models in evaluating the effects of mixtures of toxicants in the aquatic environment. Chemosphere 9, 533–538. doi: 10.1016/0045-6535(80)90069-7
Campbell, D., Hurry, V., Clarke, A. K., Gustafsson, P., and Öquist, G. (1998). Chlorophyll fluorescence analysis of cyanobacterial photosynthesis and acclimation. Microbiol. Mol. Biol. Rev. 62, 667–683. doi: 10.1128/MMBR.62.3.667-683.1998
Cummings, B. M., Needoba, J. A., and Peterson, T. D. (2018). Effect of metformin exposure on growth and photosynthetic performance in the unicellular freshwater chlorophyte, Chlorella vulgaris. PLoS One 13:e0207041. doi: 10.1371/journal.pone.0207041
Deneer, J. W. (2000). Toxicity of mixtures of pesticides in aquatic systems. Pest Manag. Sci. 56, 516–520.
Dewez, D., Didur, O., Vincent-Héroux, J., and Popovic, R. (2008). Validation of photosynthetic-fluorescence parameters as biomarkers for isoproturon toxic effect on alga Scenedesmus obliquus. Environ. Pollut. 151, 93–100. doi: 10.1016/j.envpol.2007.03.002
Dewez, D., Geoffroy, L., Vernet, G., and Popovic, R. (2005). Determination of photosynthetic and enzymatic biomarkers sensitivity used to evaluate toxic effects of copper and fludioxonil in alga Scenedesmus obliquus. Aquat. Toxicol. 74, 150–159. doi: 10.1016/j.aquatox.2005.05.007
Gan, T., Zhao, N., Yin, G., Chen, M., Wang, X., Liu, J., et al. (2019). Optimal chlorophyll fluorescence parameter selection for rapid and sensitive detection of lead toxicity to marine microalgae Nitzschia closterium based on chlorophyll fluorescence technology. J. Photochem. Photobiol. B Biol. 197, 111551. doi: 10.1016/j.jphotobiol.2019.111551
Gao, G., Shi, Q., Xu, Z., Xu, J., Campbell, D. A., and Wu, H. (2018). Global warming interacts with ocean acidification to alter PSII function and protection in the diatom Thalassiosira weissflogii. Environ. Exp. Bot. 147, 95–103. doi: 10.1016/j.envexpbot.2017.11.014
Gao, X., Yang, Y., Ai, Y., Luo, H., and Qiu, B. (2014). Quality evaluation of the edible blue–green alga Nostoc flagelliforme using a chlorophyll fluorescence parameter and several biochemical markers. Food Chem. 143, 307–312. doi: 10.1016/j.foodchem.2013.07.127
Gao, Y. N., Dong, J., Fu, Q. Q., Wang, Y. P., Chen, C., Li, J. H., et al. (2017). Allelopathic effects of submerged macrophytes on phytoplankton. Allelopathy J. 40, 1–22. doi: 10.26651/2017-40-1-1062
Gao, Y. N., Liu, B. Y., Ge, F. J., He, Y., Lu, Z. Y., Zhou, Q. H., et al. (2015). Joint effects of allelochemical nonanoic acid, N-phenyl-1-naphtylamine and caffeic acid on the growth of Microcystis aeruginosa. Allelopathy J. 35, 249–257.
Gomes, T., Xie, L., Brede, D., Lind, O.-C., Solhaug, K. A., Salbu, B., et al. (2017). Sensitivity of the green algae Chlamydomonas reinhardtii to gamma radiation: photosynthetic performance and ROS formation. Aquat. Toxicol. 183, 1–10. doi: 10.1016/j.aquatox.2016.12.001
Hanelt, D. (2018). Photosynthesis assessed by chlorophyll fluorescenceBioassays 2018, 169–198. doi: 10.1016/b978-0-12-811861-0.00009-7
Henriques, F. S. (2009). Leaf chlorophyll fluorescence: background and fundamentals for plant biologists. Bot. Rev. 75, 249–270. doi: 10.1007/s12229-009-9035-y
Hilt, S., Ghobrial, M. G. N., and Gross, E. M. (2006). In situ allelopathic potential of Myriophyllum verticillatum (Haloragaceae) against selected phytoplankton species. J. Phycol. 42, 1189–1198. doi: 10.1111/j.1529-8817.2006.00286.x
Huang, H., Xiao, X., Lin, F., Grossart, H.-P., Nie, Z., Sun, L., et al. (2016). Continuous-release beads of natural allelochemicals for the long-term control of cyanobacterial growth: preparation, release dynamics and inhibitory effects. Water Res. 95, 113–123. doi: 10.1016/j.watres.2016.02.058
Juneau, P., Green, B. R., and Harrison, P. J. (2005). Simulation of Pulse-Amplitude-Modulated (PAM) fluorescence: limitations of some PAM-parameters in studying environmental stress effects. Photosynthetica 43, 75–83. doi: 10.1007/s11099-005-5083-7
Knauert, S., Singer, H., Hollender, J., and Knauer, K. (2010). Phytotoxicity of atrazine, isoproturon, and diuron to submersed macrophytes in outdoor mesocosms. Environ. Pollut. 158, 167–174. doi: 10.1016/j.envpol.2009.07.023
Kortenkamp, A., and Altenburger, R. (1998). Synergisms with mixtures of xenoestrogens: a reevaluation using the method of isoboles. Sci. Total Environ. 221, 59–73. doi: 10.1016/s0048-9697(98)00261-7
Kramer, D. M., Johnson, G., Kiirats, O., and Edwards, G. E. (2004). New fluorescence parameters for the determination of QARedox state and excitation energy fluxes. Photosynth. Res. 79, 209–218. doi: 10.1023/B:PRES.0000015391.99477.0d
Lu, C., Chau, C., and Zhang, J. (2000). Acute toxicity of excess mercury on the photosynthetic performance of cyanobacterium, S. platensis-assessment by chlorophyll fluorescence analysis. Chemosphere 41, 191–196. doi: 10.1016/s0045-6535(99)00411-7
Lu, Z., Sha, J., Tian, Y., Zhang, X., Liu, B., and Wu, Z. (2017). Polyphenolic allelochemical pyrogallic acid induces caspase-3 (like)-dependent programmed cell death in the cyanobacterium Microcystis aeruginosa. Algal Res. 21, 148–155. doi: 10.1016/j.algal.2016.11.007
Macedo, R. S., Lombardi, A. T., Omachi, C. Y., and Rörig, L. R. (2008). Effects of the herbicide bentazon on growth and photosystem II maximum quantum yield of the marine diatom Skeletonema costatum. Toxicol. in Vitro 22, 716–722. doi: 10.1016/j.tiv.2007.11.012
Mallick, N., and Mohn, F. (2003). Use of chlorophyll fluorescence in metal-stress research: a case study with the green microalga Scenedesmus. Ecotoxicol. Environ. Saf. 55, 64–69. doi: 10.1016/s0147-6513(02)00122-7
Mohamed, Z. A. (2017). Macrophytes-cyanobacteria allelopathic interactions and their implications for water resources management —a review. Limnol. Ecol. Manag. Inland Waters 63, 122–132. doi: 10.1016/j.limno.2017.02.006
Murchie, E. H., and Lawson, T. (2013). Chlorophyll fluorescence analysis: a guide to good practice and understanding some new applications. J. Exp. Bot. 64, 3983–3998. doi: 10.1093/jxb/ert208
Nakai, S., Inoue, Y., Hosomi, M., and Murakami, A. (2000). Myriophyllum spicatum-released allelopathic polyphenols inhibiting growth of blue-green algae Microcystis aeruginosa. Water Res. 34, 3026–3032. doi: 10.1016/s0043-1354(00)00039-7
Nowicka, B. (2019). Practical aspects of the measurements of non-photochemical chlorophyll fluorescence quenching in green microalgae Chlamydomonas reinhardtii using Open FluorCam. Physiol. Plant. 168, 617–629. doi: 10.1111/ppl.13003
Olate-Gallegos, C., Barriga, A., Vergara, C., Fredes, C., García, P., Giménez, B., et al. (2019). Identification of polyphenols from chilean brown seaweeds extracts by LC-DAD-ESI-MS/MS. J. Aquat. Food Prod. Technol. 28, 375–391. doi: 10.1080/10498850.2019.1594483
Oxborough, K., and Baker, N. R. (1997). Resolving chlorophyll a fluorescence images of photosynthetic efficiency into photochemical and non-photochemical components–calculation of qP and Fv-/Fm-; without measuring Fo. Photosynth. Res. 54, 135–142. doi: 10.1023/A:1005936823310
Qin, B., Yang, G., Ma, J., Wu, T., Li, W., Liu, L., et al. (2018). Spatiotemporal changes of cyanobacterial bloom in large shallow eutrophic Lake Taihu, China. Front. Microbiol. 9:451. doi: 10.3389/fmicb.2018.00451
Roach, T., and Krieger-Liszkay, A. (2014). Regulation of photosynthetic electron transport and photoinhibition. Curr. Protein Peptide Sci. 15, 351–362. doi: 10.2174/1389203715666140327105143
Roháček, K., and Barták, M. (1999). Technique of the modulated chlorophyll fluorescence: basic concepts, useful parameters, and some applications. Photosynthetica 37:339. doi: 10.1023/a:1007172424619
Sonani, R. R., Gardiner, A., Rastogi, R. P., Cogdell, R., Robert, B., and Madamwar, D. (2018). Site, trigger, quenching mechanism and recovery of non-photochemical quenching in cyanobacteria: recent updates. Photosynth. Res. 137, 171–180. doi: 10.1007/s11120-018-0498-8
Sprague, J. B. (1970). Measurement of pollutant toxicity to fish. II. Utilizing and applying bioassay results. Water Res. 4, 3–32. doi: 10.1016/0043-1354(70)90018-7
Tan, K., Huang, Z., Ji, R., Qiu, Y., Wang, Z., and Liu, J. (2019). A review of allelopathy on microalgae. Microbiology 165, 587–592. doi: 10.1099/mic.0.000776
Tazart, Z., Douma, M., Caldeira, A. T., Tebaa, L., Mouhri, K., and Loudiki, M. (2020). Highlighting of the antialgal activity of organic extracts of Moroccan macrophytes: potential use in cyanobacteria blooms control. Environ. Sci. Pollut. Res. Int. 27, 19630–19637. doi: 10.1007/s11356-020-08440-w
Techer, D., Fontaine, P., Personne, A., Viot, S., and Thomas, M. (2016). Allelopathic potential and ecotoxicity evaluation of gallic and nonanoic acids to prevent cyanobacterial growth in lentic systems: a preliminary mesocosm study. Sci. Tot. Environ. 547, 157–165. doi: 10.1016/j.scitotenv.2015.12.164
Wang, J., Zhu, J. Y., Gao, Y., Liu, B., Liu, S., He, F., et al. (2013). Study on toxicity of allelochemicals released by submerged macrophytes to phytoplankton by flow cytometry. Allelopathy J. 31, 199–210. doi: 10.4141/CJPS2012-133
Wang, J., Zhu, J. Y., Liu, S., Liu, B., and Wu, B. (2011). Generation of reactive oxygen species in cyanobacteria and green algae induced by allelochemicals of submerged macrophytes. Chemosphere 85, 977–982. doi: 10.1016/j.chemosphere.2011.06.076
Wang, R., Hua, M., Yu, Y., Zhang, M., Xian, Q., and Yin, D. (2016). Evaluating the effects of allelochemical ferulic acid on Microcystis aeruginosa by pulse-amplitude-modulated (PAM) fluorometry and flow cytometry. Chemosphere 147, 264–271. doi: 10.1016/j.chemosphere.2015.12.109
Weisz, D. A., Gross, M. L., and Pakrasi, H. B. (2017). Reactive oxygen species leave a damage trail that reveals water channels in Photosystem II. Sci. Adv. 3:eaao3013. doi: 10.1126/sciadv.aao3013
Wilkinson, A. D., Collier, C. J., Flores, F., and Negri, A. P. (2015). Acute and additive toxicity of ten photosystem-II herbicides to seagrass. Sci. Rep. 5:17443. doi: 10.1038/srep17443
Wu, Z., Shi, J., and Yang, S. (2013). The effect of pyrogallic acid on growth, oxidative stress, and gene expression in Cylindrospermopsis raciborskii (Cyanobacteria). Ecotoxicology 22, 271–278. doi: 10.1007/s10646-012-1023-z
Xu, Z., Gao, G., Tu, B., Qiao, H., Ge, H., and Wu, H. (2019). Physiological response of the toxic and non-toxic strains of a bloom-forming cyanobacterium Microcystis aeruginosa to changing ultraviolet radiation regimes. Hydrobiologia 833, 143–156. doi: 10.1007/s10750-019-3896-9
Yong, W., Sim, K., Poong, S., Wei, D., Phang, S., and Lim, P. (2018). Interactive effects of temperature and copper toxicity on photosynthetic efficiency and metabolic plasticity in Scenedesmus quadricauda (Chlorophyceae). J. Appl. Phycol. 30, 3029–3041. doi: 10.1007/s10811-018-1574-3
Yu, S., Li, C., Xu, C., Effiong, K., and Xiao, X. (2019). Understanding the inhibitory mechanism of antialgal allelochemical flavonoids from genetic variations: photosynthesis, toxin synthesis and nutrient utility. Ecotoxicol. Environ. Saf. 177, 18–24. doi: 10.1016/j.ecoenv.2019.03.097
Zhu, J., Liu, B., Wang, J., Gao, Y., and Wu, Z. (2010). Study on the mechanism of allelopathic influence on cyanobacteria and chlorophytes by submerged macrophyte (Myriophyllum spicatum) and its secretion. Aquat. Toxicol. 98, 196–203. doi: 10.1016/j.aquatox.2010.02.011
Zhu, X., Dao, G., Tao, Y., Zhan, X., and Hu, H. (2021). A review on control of harmful algal blooms by plant-derived allelochemicals. J. Hazardous Mater. 401:123403. doi: 10.1016/j.jhazmat.2020.123403
Zolotareva, E. K., Mokrosnop, V. M., and Stepanov, S. S. (2019). Polyphenol compounds of macroscopic and microscopic algae. Int. J. Algae 21, 3–29. doi: 10.15407/alg29.01.003
Zulfugarov, I. S., Pashayeva, A., Okhlopkova, Z. M., and Lee, C. H. (2018). Practical guide to measure chlorophyll fluorescence in plants and calculate main chlorophyll fluorescence parameters. Becmhuk CBΦY 2, 35–44. doi: 10.25587/SVFU.2018.64.12129
Zuo, S., Zhou, S., Ye, L., Ding, Y., and Jiang, X. (2016a). Antialgal effects of five individual allelochemicals and their mixtures in low level pollution conditions. Environ. Sci. Pollut. Res. 23, 15703–15711. doi: 10.1007/s11356-016-6770-6
Keywords: allelopathy, polyphenols, combined effect, cyanobacteria, cell densities, chlorophyll fluorescence parameters
Citation: Huang S, Zhu J, Zhang L, Peng X, Zhang X, Ge F, Liu B and Wu Z (2020) Combined Effects of Allelopathic Polyphenols on Microcystis aeruginosa and Response of Different Chlorophyll Fluorescence Parameters. Front. Microbiol. 11:614570. doi: 10.3389/fmicb.2020.614570
Received: 06 October 2020; Accepted: 12 November 2020;
Published: 01 December 2020.
Edited by:
Leda Giannuzzi, Consejo Nacional de Investigaciones Científicas y Técnicas (CONICET), ArgentinaReviewed by:
Shu Yuan, Sichuan Agricultural University, ChinaZakaria Tazart, Cadi Ayyad University, Morocco
Copyright © 2020 Huang, Zhu, Zhang, Peng, Zhang, Ge, Liu and Wu. This is an open-access article distributed under the terms of the Creative Commons Attribution License (CC BY). The use, distribution or reproduction in other forums is permitted, provided the original author(s) and the copyright owner(s) are credited and that the original publication in this journal is cited, in accordance with accepted academic practice. No use, distribution or reproduction is permitted which does not comply with these terms.
*Correspondence: Biyun Liu, bGl1YnlAaWhiLmFjLmNu
†These authors share first authorship