 Yuanyuan Ma
 Lifang Liu
 Qianjun Chen
 Yingjun Ma
- 1School of Computer and Information Engineering, Anyang Normal University, Anyang, China
- 2School of Education, Anyang Normal University, Anyang, China
- 3School of Computer, Central China Normal University, Wuhan, China
- 4School of Applied Mathematics, Xiamen University of Technology, Xiamen, China
Metabolites are closely related to human disease. The interaction between metabolites and drugs has drawn increasing attention in the field of pharmacomicrobiomics. However, only a small portion of the drug-metabolite interactions were experimentally observed due to the fact that experimental validation is labor-intensive, costly, and time-consuming. Although a few computational approaches have been proposed to predict latent associations for various bipartite networks, such as miRNA-disease, drug-target interaction networks, and so on, to our best knowledge the associations between drugs and metabolites have not been reported on a large scale. In this study, we propose a novel algorithm, namely inductive logistic matrix factorization (ILMF) to predict the latent associations between drugs and metabolites. Specifically, the proposed ILMF integrates drug–drug interaction, metabolite–metabolite interaction, and drug-metabolite interaction into this framework, to model the probability that a drug would interact with a metabolite. Moreover, we exploit inductive matrix completion to guide the learning of projection matrices U and V that depend on the low-dimensional feature representation matrices of drugs and metabolites: Fm and Fd. These two matrices can be obtained by fusing multiple data sources. Thus, FdU and FmV can be viewed as drug-specific and metabolite-specific latent representations, different from classical LMF. Furthermore, we utilize the Vicus spectral matrix that reveals the refined local geometrical structure inherent in the original data to encode the relationships between drugs and metabolites. Extensive experiments are conducted on a manually curated “DrugMetaboliteAtlas” dataset. The experimental results show that ILMF can achieve competitive performance compared with other state-of-the-art approaches, which demonstrates its effectiveness in predicting potential drug-metabolite associations.
Introduction
With the development of metabolomics technology, more and more metabolites have been identified. This progress provides unprecedented opportunities to obtain new insights into the effects of drugs on metabolites. Recently, Liu et al. (2020) integrated epidemiologic, pharmacologic, genetic, and gut microbiome data to analyze the relationships between drugs and metabolites, which provided a trail for targeted experimental pharmaceutical research to improve drug safety and efficacy. Exploring the potential drug-metabolite associations is also a novel route towards pharmacomicrobiomics and precision medicine. Doestzada et al. (2018) reviewed the complex interactions between host, intestinal microorganisms and drugs, and thought that pharmacomicrobiomics would provide an important foundation for personalized medicine and precision medicine. The earliest report about interactions between drugs and metabolites can be dated back to the 1930s with the discovery of sulphanilamide (Fuller, 1937). The activity of prontosil is due to the transformation of microbial azoreductases and the liberation of sulphanilamide. In addition, microbial metabolites can also inactivate drugs, such as digoxin. A study on Eggerthella lenta strains in 2013 (Haiser et al., 2013) found that these strains carried a two-gene cardiac glycoside reductase (cgr) operon that was transcriptionally activated by digoxin (Doestzada et al., 2018), and thus resulted in the inactivation of the drug in cardiovascular treatment.
Identifying drug-metabolite associations not only provides deep insights into understanding complex interaction mechanisms among them, but it can also benefit the screening of chemical compounds for drug development and improve microbe related therapy. The complex relationship between drugs, metabolites, and microbes has attracted extensive attention. However, conventional wet-lab research for verifying drug-metabolite interactions is generally labor-intensive, costly, and time-consuming. Computational approaches are a viable alternative. Shang et al. (2014) found that metabolites in the same pathway were usually associated with the similar or same disease. Based on this fact, they proposed a metabolite pathway-based random walk algorithm to prioritize the candidate disease metabolites (Shang et al., 2014). Yao et al. (2015) presented an approach based on global distance similarity to predict and prioritize disease related metabolites. Ma et al. (2020b) integrated multiple diseases and metabolite similarity networks to predict the potential associations between metabolites and diseases. Long and Luo (2020) used multi-source biomedical data to construct a three-level heterogeneous network and designed a novel network embedding representation framework to identify microbe-drug associations. Specifically, Long et al. (2020) exploited the conditional random field, graph convolutional network and a random walk with restart (RWR) to learn the latent feature representations of drugs and microbes, identifying some potential drug-microbe associations.
Although these studies have obtained some valuable results, there are two main limitations to the existing drug-microbe or metabolite-disease association mining approaches. Firstly, the accuracy of these methods is still unsatisfactory due to a lack of sufficient prior information for drugs, microbes, and diseases. Secondly, the local geometrical structure of nodes is important in the task of dimensionality deduction and data representation, which decides the effectiveness and efficiency of algorithms to a large extent. The algorithms mentioned above did not consider the local spectral information that resides in the original data, meaning their performances are not ideal.
In this study, we propose a novel computational approach, named inductive logistic matrix factorization (ILMF), to analyze latent drug-metabolite associations. ILMF integrates the advantages of logistic matrix factorization (LMF; Johnson, 2014; Liu et al., 2016) and inductive matrix completion (Natarajan and Dhillon, 2014; Chen et al., 2018) to learn low-dimensional embedding of drugs and metabolites, and predict the final interaction probabilities based on the two low-dimensional representation of drugs and metabolites. Specifically, ILMF first learns the latent representation of drugs and metabolites via clusDCA (Cho et al., 2015; Wang et al., 2015), which runs RWR on each node in each interaction network (e.g., metabolite–metabolite interaction network or similarity network) to compute “the diffusion state” of each point, and then utilizes a singular value decomposition (SVD)-based approach to obtain the consensus low-dimensional matrix representation for metabolites and drugs Zm and Zd, respectively. Secondly, based on Zm and Zd, ILMF exploits LMF to learn two projection matrices U and V, respectively, so that ZmV and ZdU have the same semantic space. Finally, a logistic function is used to predict the probability that a drug would interact with a metabolite in the same way that LMF does. Nevertheless, in contrast to LMF, ILMF captures the topological properties of nodes (i.e., drugs or metabolites) and takes advantage of the idea of inductive matrix completion (Luo et al., 2017) to generate the optimal projection of drugs and metabolites. In addition, ILMF also exploits the local spectral Vicus matrices (Wang B. et al., 2017) of drugs and metabolites to reveal the refined local geometrical structure inherent in drug–drug interaction network and metabolite–metabolite interaction network. An illustrative example of this pipeline is given in Figure 1, followed by a more detailed description of ILMF in section “Materials and Methods.”
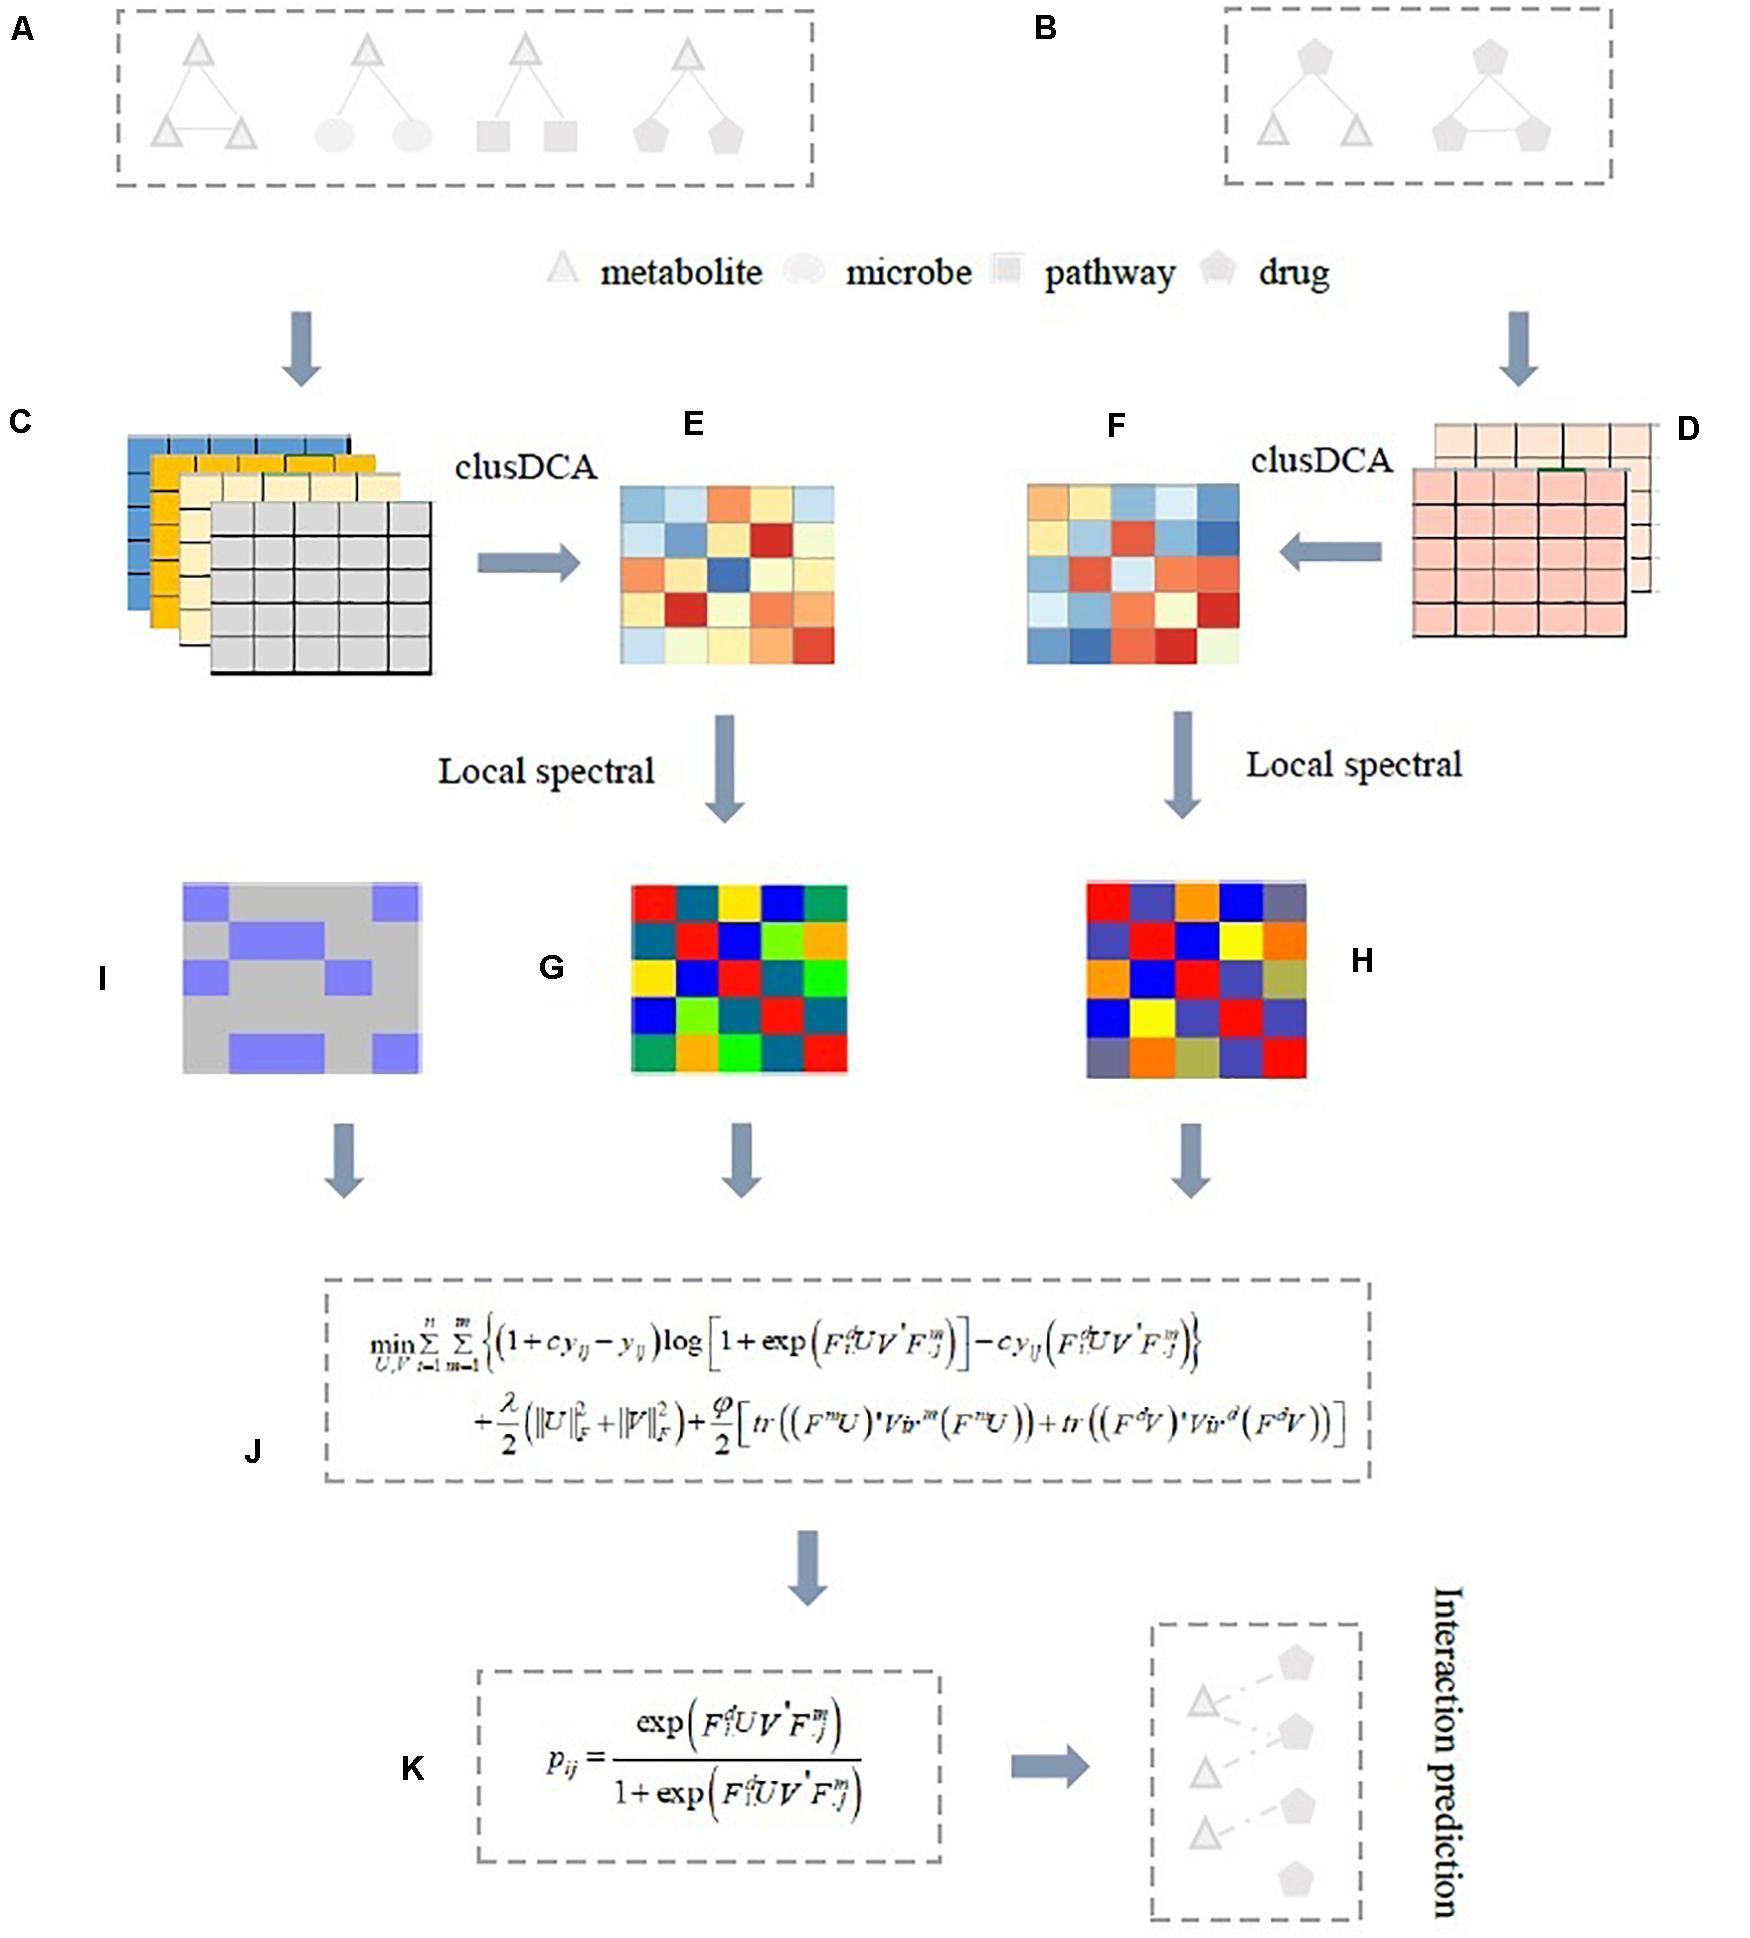
Figure 1. Illustrative example of ILMF for predicting potential drug-metabolite associations. (A) Metabolite–metabolite, metabolite-drug, metabolite-microbe, metabolite-pathway association matrices, or correlation matrices; (B) Drug-metabolite, drug–drug association, or correlation matrices; (C,D) Based on Gaussian interaction profile kernel function, metabolite–metabolite similarity matrices, and drug–drug similarity matrices obtained from four metabolite association data and two drug association data, respectively; (E) The fused metabolite–metabolite similarity matrix by integrating four metabolite-related data with clusDCA; (F) The fused drug–drug similarity matrix by integrating two drug association data with clusDCA. Then, the local spectral matrix of metabolites (G) And the local spectral matrix of drugs (H) Can be obtained based on these two fused similarity matrices with Vicus; (I) The drug-metabolite association matrix; (J) The proposed ILMF model. Finally, ILMF outputs the predicted drug-metabolite interaction probability scores (K). Here, a solid line indicates known associations, a dotted line indicates predicted drug-metabolite associations obtained from ILMF.
The contributions of this article are summarized as follows:
1. We propose a novel LMF-based framework, named ILMF, to predict drug-metabolite associations by integrating multiple biological networks. To the best of our knowledge, this is the first work to predict the latent drug-metabolite associations.
2. ILMF combines the advantages of inductive matrix completion and the local spectral Vicus matrix of each interaction network into this framework, and captures the optimal low-dimensional representation of drugs and metabolites.
3. We have manually curated a drug-metabolite association dataset (“DrugMetaboliteAtlas”) by retrieving relevant literature. This benchmark dataset can be used to evaluate the performance of various association prediction algorithms, which facilitates future research in drug-metabolite association prediction tasks.
The comprehensive experiments show that the proposed ILMF algorithm outperforms several state-of-the-art methods on the curated “DrugMetaboliteAtlas” dataset. In addition, the prediction ability of ILMF has also been confirmed by retrieving the latest published literature or information from databases.
Materials and Methods
Materials
The “DrugMetaboliteAtlas” dataset was downloaded from the BBRMI-NL website1 (Liu et al., 2020). It contains 1071 interactions from 87 commonly prescribed drugs and 150 clinically relevant metabolites. After removing drugs lacking significantly relevant metabolite associations, 42 drugs were reserved. In addition, we also manually curated the correlations between drug categories and the correlations between metabolites in the Rotterdam study (Liu et al., 2020).
Metabolite-microbe associations and metabolite-pathway associations were also downloaded from literature (Kurilshikov et al., 2019). The metabolite similarities from each type of association were computed based on the Gaussian interaction profile kernel (He et al., 2018; Ma et al., 2020b). After that, clusDCA (Wang et al., 2015) was used to fuse multiple drug–drug interaction networks and multiple metabolite–metabolite interaction networks. Simultaneously, the optimal low-dimensional matrix representations of metabolites and drugs Fm, Fd can also be obtained from this fusing process. Then, the local Vicus spectral matrices of metabolites and drugs Virm, Vird were computed based on the optimal low-dimensional matrix representations of metabolites and drugs Fm and Fd, respectively. Finally, the low-dimensional feature matrices of drugs and metabolites Fm and Fd, the local spectral matrices Virm and Vird were used as input of the proposed ILMF algorithm.
Problem Formalization
In this article, the set of drugs is denoted by , and the set of metabolites is denoted by , where, n and m are the number of drugs and metabolites, respectively. The known drug-metabolite interactions are represented as a n×m binary matrix Y ∈ Rn×m, where yij = 1 if a drug di has been observed to interact with a metabolite mj; otherwise yij = 0.
This study aimed to solve the problem of predicting the interaction probability of a drug-metabolite interaction pair, and subsequently rank the candidate drug-metabolite pairs based on these probabilities in descending order. Thus, the top-ranked pairs can be viewed as the most relevant interactions.
Metabolite–Metabolite Similarity
There are four metabolite related data sources: metabolite–metabolite correlation matrix Corm, metabolite-microbial species association matrix MM, metabolite-pathway association matrix MP, and drug-metabolite interaction matrix Y. Corm is obtained from literature (Liu et al., 2020); MM and MP are collected from literature (Kurilshikov et al., 2019).
For drug-metabolite association matrix Y, we use the Gaussian interaction profile kernel (He et al., 2018) to compute the similarity between any two metabolites. Let the j-th column y.j of Y denote the interaction profile between metabolite mj and all drugs. For any two metabolites mi and mj, the similarity between them can be measured as:
Where γm is a bandwidth parameter that needs to be normalized based on a new bandwidth parameter :
Here, m is the number of metabolites. |⋅| denotes Frobenius norm. is set to be 1 according to the previous study (Wang F. et al., 2017; He et al., 2018).
The Gaussian profile kernel similarity matrices Kmm and Kmp can also be computed based on metabolite-microbial species association matrix MM and metabolite-pathway association matrix MP, respectively.
Drug–Drug Similarity
There are two drug related data sources: drug–drug correlation matrix Cord and drug-metabolite interaction matrix Y. Cord, which were obtained from literature (Liu et al., 2020). Analogously, the Gaussian interaction profile kernel similarity matrix Kd between any two drugs can be computed in the same way.
After obtaining four metabolite–metabolite similarity matrices and two drug–drug similarity matrices derived from multiple data sources, we used clusDCA (Cho et al., 2015; Wang et al., 2015) to fuse these similarity matrices and finally acquire the optimal low-dimensional matrix representations of metabolite and drug features Fm and Fd, respectively.
Inductive Logistic Matrix Factorization
Logistic matrix factorization has been demonstrated to be effective in the prediction of drug-target interactions (Liu et al., 2016), metabolite-disease (Ma et al., 2020a), and personalized recommendations (Hu et al., 2008; Johnson, 2014; Liu et al., 2014). The main advantage of LMF is that it assigns higher levels of importance to the observed interaction pairs than unknown ones. In this study, we apply LMF for drug-metabolite interaction prediction. LMF maps drugs and metabolites into a shared low-dimensionality latent semantic space r≪min(m, n). The interaction probability pij of a drug-metabolite pair (di,mj) can be modeled as follows:
Where wi ∈ R1×r, hj ∈ R1×r are latent representations of drug di and metabolite mj, respectively. For convenience, we further represent the latent vectors of all drugs and metabolites as matrix form W ∈ Rn×r and H ∈ Rm×r, respectively.
The observed drug-metabolite interaction pairs are generally more reliable and important than the unknown interaction pairs. A higher level of importance was thus assigned to known interaction pairs than unknown ones. According to a previous study, we set the importance level to be c(c≥1). Eq. 3 can be written as follows:
Here, c is the important level parameter used to control the weight assigned to the observed drug-metabolite pairs. In the next experiments, we empirically set it to two.
Inspired by the ideas of inductive matrix completion (Jain and Dhillon, 2013; Zeng et al., 2020) and generalized matrix factorization (GMF) (Zhang et al., 2020), we designed a novel ILMF framework, ILMF, to predict the latent interaction probabilities between drugs and metabolites. In particular, we used Fd ∈ Rn×k1 and Fm ∈ Rm×k2 derived from clusDCA (see section “Drug–Drug Similarity”) to guide the learning process of projection matrices U ∈ Rk1×r and V ∈ Rk2×r, so that the latent representations of metabolites and drugs W = FdU ∈ Rn×r and H = FmV ∈ Rm×r can carry compatible and complementary information from multiple data sources. Thus, in the ILMF model, Eq. 3 can be rewritten as follows:
Where denotes the i-th row of Fd, denotes the j-th column of Fm. By substituting Eq. 5 into Eq. 4, we estimate the projection matrices U and V by maximizing the above likelihood function (Eq. 3), which is equivalent to minimizing the negative logarithm of Eq. 3. Thus, the objective function of the proposed ILMF framework can be defined as:
To avoid overfitting, the L2 regularization is generally imposed on U and V. Thus, Eq. 6 becomes:
Where λ is a regularization parameter used to tradeoff the balance between reconstruction errors and smooth solutions.
Note that, for new drugs (metabolites) that do not have any known connections with metabolites (drugs), ILMF can still predict their potential associations, once we get their similarity network from other data sources. This is different from GMF (Zhang et al., 2020). In GMF, the neighborhood information of nodes was used to generate two feature matrices, and then they were adaptively updated at each iteration. In contrast, ILMF fuses multiple similarity networks to produce the low-dimensional matrix representations of metabolites and drugs.
Vicus Matrix
As demonstrated in literature (Wang B. et al., 2017), Vicus has many of the same properties as Laplacian. However, compared with Laplacian, Vicus can capture the local geometrical structure that resides within the original data well. The reason for using Vicus instead of Laplacian is that the local connection information from neighboring nodes makes the learned graph more robust to noise and helps to alleviate the influence of outliers.
Let {x1,x2,…,xn} be the set of data points. Corresponding to xi, vi denotes the i-th vertex in a weighted network P, and N(i) represents xi ’s neighborhood, not including xi. Here, the neighborhood size of all nodes is consistent (— N_i — =k, i=1,2,…,n).
Based on the assumption that the cluster label of the i-th data point can be inferred from its nearest neighborhood N(i), we first extract a subnetwork Pi = (ViEi) such that Vi = N(i)⋃xi. Ei represents the edges connecting all points in Vi. Using the label diffusion algorithm (Zhou et al., 2004), a virtual label indicator vector can be reconstructed as:
Where α ∈ (0, 1) is a constant, C is the number of clusters, is the scaled cluster indicator of Pi. Si denotes the normalized transition matrix, i.e., . is a vector including K + 1 elements. Here, is the estimate of how likely it is that node i belongs to the k-th cluster. The goal is to maximize the concordance between and . Let βi ∈ RK + 1 be the i-th row of the matrix (1−α)(I−αSi)−1, representing label propagation at its terminal state. We set . Thus, can be approximated to:
Where βi[1:K] denotes the first K elements of βi and βi[K + 1]denotes the (K + 1)-th element in βi.
Next, we used matrix B to represent the linear relationship: :
To minimize the difference between and qk, an objective function can be defined as follows:
Here, Tr(•) denotes the trace of a matrix. Setting Vir = (I−B)T(I−B), we thus obtain the Vicus matrix. In this study, we propose to exploit the Vicus matrix as a graph regularization term to enhance the prediction performance of ILMF.
Note that each item in the Vicus matrix obtained from Eq. 11 represents the probability of vertex i having the same label as vertex j. Encoding the local neighborhood of each vertex in this way does not only preserve the geometric attributes of the Laplacian matrix but also improves the quality of clustering (Nelson et al., 2019). Wang B. et al. (2017) indicated the Vicus-based spectral clustering approach outperformed Laplacian-based methods on many biological tasks, such as single-cell RNA data clustering, recognition of rare cell populations, the ranking of genes related to cancer subtypes and so on. Therefore, in this manuscript, we use Vicus spectral matrix to model fine-grained connections between drugs and metabolites.
Vicus Regularization Based Inductive Logistic Matrix Factorization
The final drug-metabolite association prediction model can be constructed by considering the existing drug-metabolite links and the local geometrical structure of drugs and metabolites. By introducing Vicus regularization into Eq. 7, the proposed ILMF method is formulated as follows:
Where ϕ is a graph regularization parameter. Virm is the Vicus matrix of metabolites, and Vird is the Vicus matrix of drugs. Note that, in this study, we exploit the cosine similarity of the low-dimensional feature matrix of metabolites Fm (or drugsF^d) to compute the Vicus matrix Virm or Vird, respectively.
The optimization problem in Eq. 12 can be solved by an alternating gradient ascent scheme. In particular, we adopt the AdaGrad algorithm (Duchi et al., 2011) to update U and V. Further details can be found in the study by Liu et al. (2016). Once the projection matrices U and V have been obtained, the association probability of any drug-metabolite pair can be predicted by Eq. 5. However, for many unobserved interaction pairs, the learned latent representation of drugs and metabolites may not be accurate since they are only based on unknown drug-metabolite pairs.
To address this problem, we adopted the practices outlined in other literature (Ma et al., 2020a). Let and denote the sets of observed drugs and metabolites, respectively. denotes the set of K nearest neighbors of di in . Similarly, denotes the set of K nearest neighbors of mj in . We can replace the latent vector representation of a drug or metabolite with the representations of its neighbors. Then, for each drug di, the revised is defined as:
Where is a normalized term, Sd = cosine(Fd,Fd) denotes the consensus drug–drug similarity matrix derived from multiple similarity networks. dl indicates the l-th neighbor in sorted in descending order according to the similarity with di. α ∈ [0, 1] is a decay factor, and is a weight factor. Similarly, we can also obtain the optimal latent representation for each metabolite mj :
Where , Sm = cosine(Fm,Fm) indicates the consensus metabolite–metabolite similarity matrix. ml is the l-th neighbor in , which is sorted in descending order according to similarity with mj. is a weight factor.
Finally, the interaction probability of a drug-metabolite pair is redefined as follows:
To demonstrate the flowchart of ILMF, the pseudocode of ILMF is given in Table 1.
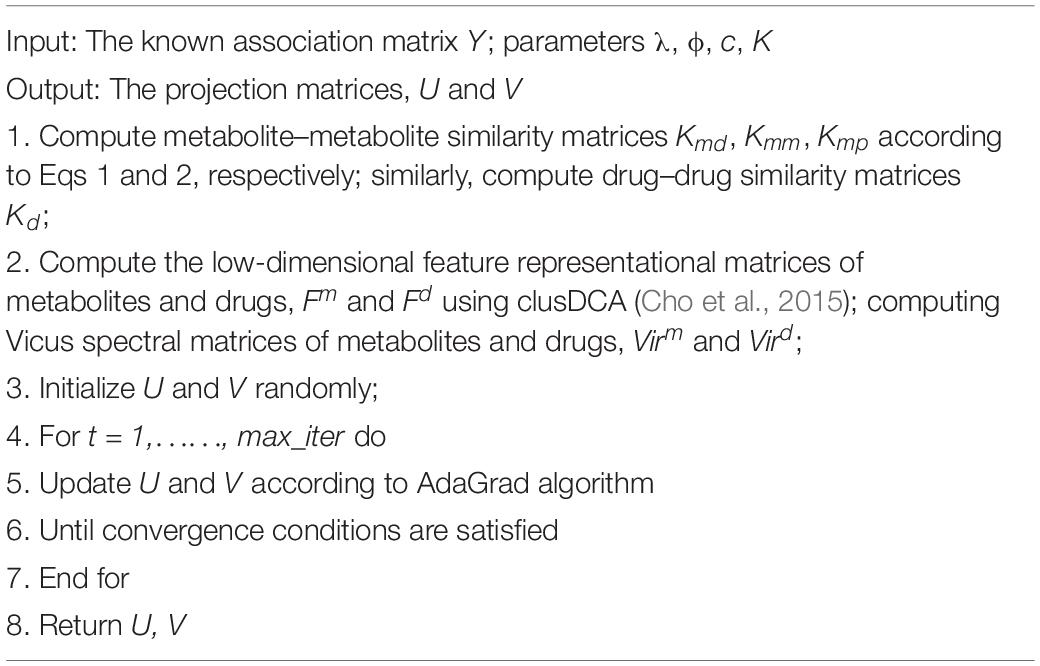
Table 1. The pseudocode of the ILMF algorithm.
Results and Discussion
Experimental Settings
Following the previous studies (Zheng et al., 2013; Ding et al., 2014; Liu et al., 2016; Zhang et al., 2018a,b, 2019, 2020; Ma et al., 2020a), the performance of various association prediction methods can be evaluated by performing fivefold cross-validation (CV). For each method, we perform fivefold CV five times. Then, we calculate the area under the receiver operating characteristic curve (AUC), the area under the precision-recall curve (AUPR) scores in each repetition of CV, and the final AUC and AUPR scores are obtained by calculating the average over the five repetitions.
The object of this study is to predict the latent drug-metabolite associations. For the known drug-metabolite interaction matrix Y ∈ Rn×m with n drugs and m metabolites, we conduct CV on randomly selected drug-metabolite pairs. Specifically, we randomly divide the observed and unobserved interaction pairs into five equal parts. Then, in each round, one is used as test data, the remaining entries in Y are used for training. Thus, each of the five test datasets (or training data) includes the same number of observed and unobserved interaction pairs.
Note that we do not consider the other two scenarios for CV experiments: random rows or columns selected for testing. It is mainly because the drug-metabolite association matrix is commonly sparse, and the drug–drug or metabolite–metabolite similarity information from external sources cannot provide enough aid for prediction.
Evaluation Metrics and Competing Approaches
In this study, the AUC, AUPR, and F1 value are used as the evaluation metrics. These metrics have been widely used in various association prediction tasks. To demonstrate the effectiveness and efficiency of our proposed ILMF algorithm in predicting drug-metabolite interaction, we compare the proposed ILMF method with the following several state-of-the-art approaches, namely, DTInet (Luo et al., 2017), IMCMDA (Chen et al., 2018) and GRNMF (Xiao et al., 2018). These approaches were originally designed for DTI prediction or miRNA-disease association prediction. Furthermore, we can obtain a variant of ILMF, which learns U and V with the consensus similarity matrices of drugs and metabolites instead of their Vicus matrices. Here, we denote this variant as ILMF–, which has a similar objective function to MNLMF (Ma et al., 2020a) and NRLMF (Liu et al., 2016).
For all the compared methods above, their performance is reported with best-tuned parameters.
Experimental Results
In this subsection, we conduct extensive experiments on the “DrugMetaboliteAtlas” dataset. Table 2 shows the performance of various algorithms in terms of AUC, AUPR, and F1. In Table 2, the highest score in each column is shown in bold typeface.
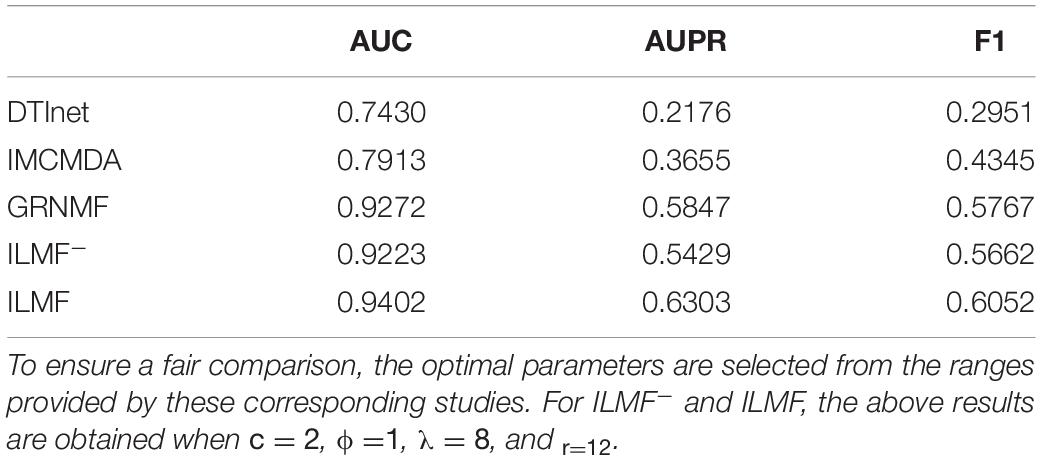
Table 2. The best performance of all methods on the “DrugMetaboliteAtlas” dataset.
As shown in Table 2, ILMF achieves the best performance in terms of AUC, AUPR, and F1 on the “DrugMetaboliteAtlas” dataset. Specifically, compared with the second-best GRNMF algorithm, the performance of ILMF increases by 1.40, 7.80, and 4.94% in terms of AUC, AUPR, and F1, respectively. Additionally, the prediction performance of DTInet and IMCMDA is not satisfactory. We can observe from Table 2 that ILMF outperforms IMCMDA 18.82, 72.45, and 39.29% in AUC, AUPR, and F1, respectively. One possible reason is that IMCMDA does not take advantage of the local geometrical structure that resided within the original data. For GRNMF, it does not consider the important level parameter c, for simplicity, it views the known drug-metabolite pairs and the unobserved drug-metabolite pairs as equally important in predicting the latent associations between drugs and metabolites.
By comparing ILMF and ILMF–, we can also further verify the benefits of using the Vicus matrices of drugs and metabolites, indicating that exploiting the local structure information of drugs and metabolites could improve the performance for drug-metabolite association prediction.
Parameter Analysis
There are several parameters in ILMF that need to be tuned: the important level parameter c, the dimensionality k1, k2 and r of projection matrices W and H, the regularization parameters λ and ϕ. For simplicity, we set k1 = 12 and k2 = 45 empirically. We adopted a grid search strategy to select the optimal combination from fixed ranges of λ and ϕ. In this study, we let λ and ϕ vary in the range {2−3,2−2,2−1,20,21,22,23}, r varies in the range {5,6,7,8,9,10,11,12} and c varies in the range {2,3,4,5,6,7,8}. We then conducted fivefold CV to evaluate the performance of ILMF under the combination of different parameters.
To demonstrate how λ and ϕ affect the performance of the proposed ILMF, we fix other parameters and change the values of λ and ϕ, respectively. The AUC and AUPR scores are shown in Figures 2A,B with respect to different combinations of λ and ϕ.
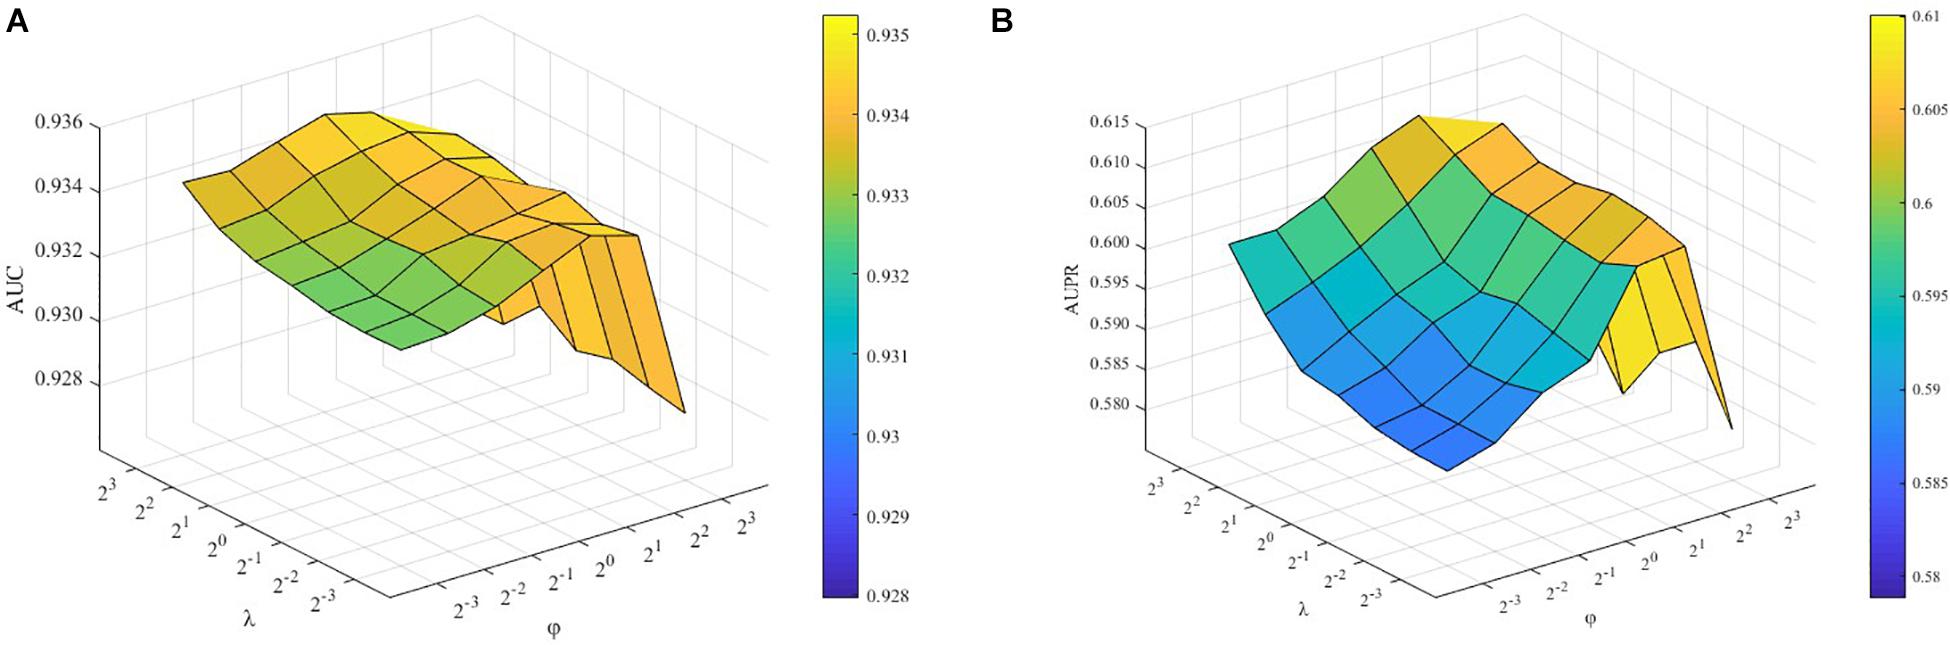
Figure 2. Performance of ILMF on “DrugMetaboliteAtlas” dataset with different values of λ and ϕ. (A) AUC versus λ and ϕ; (B) AUPR versus λ and ϕ.
λ and ϕ are the parameters controlling the influence of feature regularization and graph regularization. As Figure 2 shows, when we fix the values of λ and increase the values of ϕ, the AUC scores increase initially and decrease after achieving the highest performance. These results demonstrate the advantages of introducing two kinds of regularization terms.
In this study, we also conducted extensive experiments to demonstrate how c and r affect the performance of ILMF. We changed the values of c and r in the corresponding ranges with other parameters fixed. The AUC and AUPR scores are shown in Figures 3A,B with respect to different combinations of c and r. We can observe from Figure 3 that for a fixed value of c, the AUC scores increase as the values of r increase. However, when we fix the values of r and increase the values of c, the AUC scores decrease. Similar properties can be seen in terms of AUPR. This illustrates the importance and necessity of introducing levels of importance, which are assigned to the observed drug-metabolite interaction pairs.
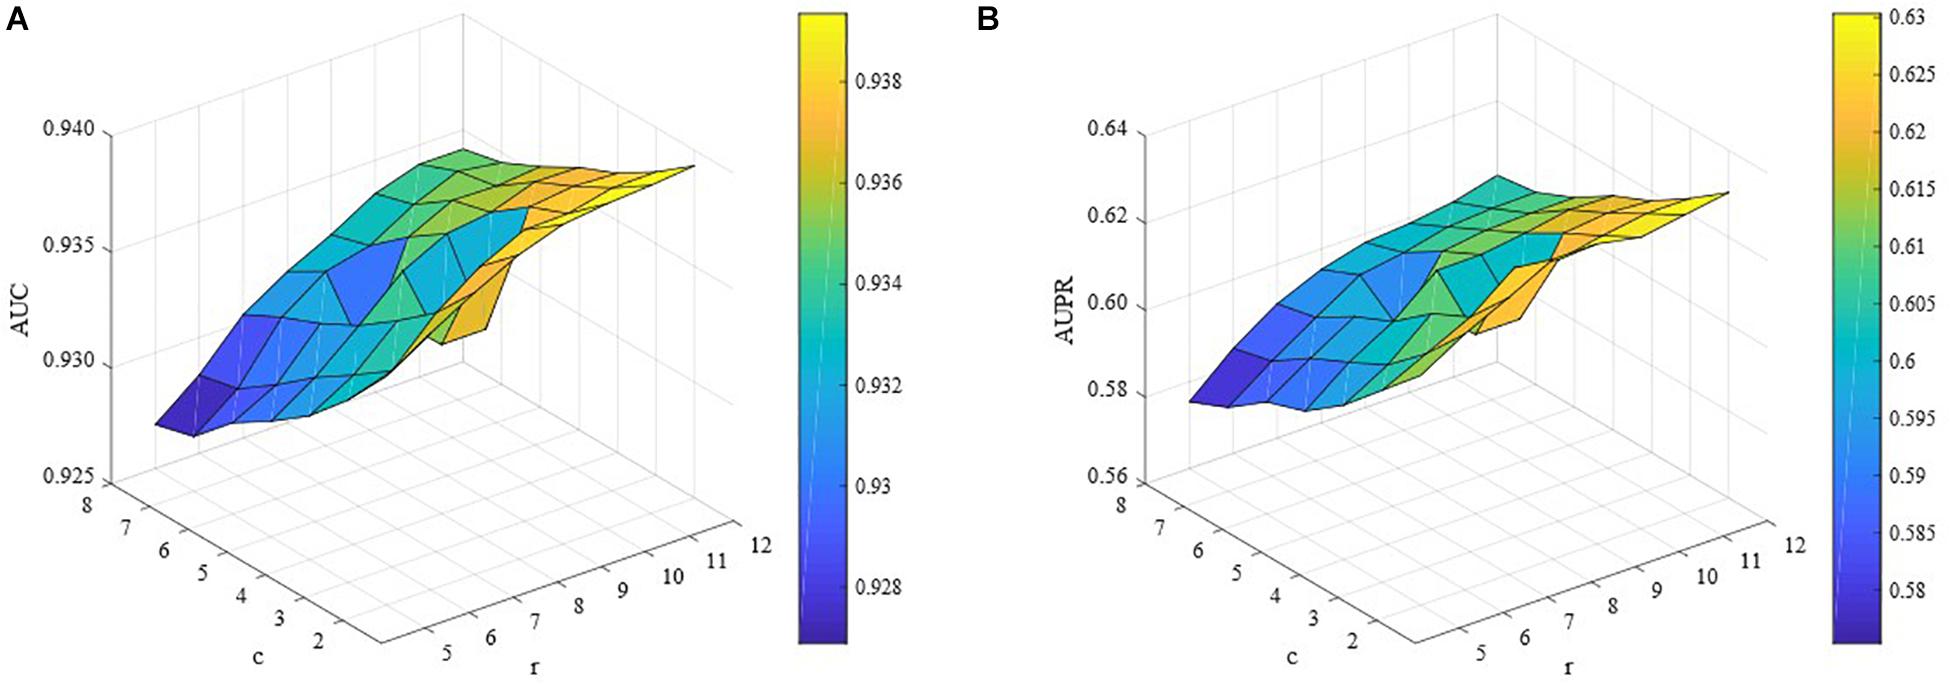
Figure 3. Performance of ILMF on “DrugMetaboliteAtlas” dataset with different values of c and r. (A) AUC versus c and r; (B) AUPR versus c and r.
Predicting Novel Drug-Metabolite Associations
In this section, we evaluate the prediction ability of ILMF in identifying novel drug-metabolite associations. In our experiments, the entire dataset is used to train the ILMF model, and the optimal parameters are used to make a prediction. The unknown drug-metabolite interaction pairs are ranked based on the predicted association scores.
Table 3 shows the top 20 novel associations predicted by ILMF on the “DrugMetaboliteAtlas” dataset. In this table, the fourth column shows the predicted interaction probabilities of novel drug-metabolite pairs. For each pair, we retrieval the possible interaction from HMDB, DrugBank and other databases that may contain it, and list the corresponding ATC/drug names in the last column of Table 3. Since only a few databases include drug-metabolite association information, the fraction of new drug-metabolite interactions correctly predicted by ILMF may increase in the future. These promising results, which indicate that ILMF can successfully identify many novel associations, demonstrates that it is effective in predicting latent drug-metabolite associations from a sparse binary matrix.
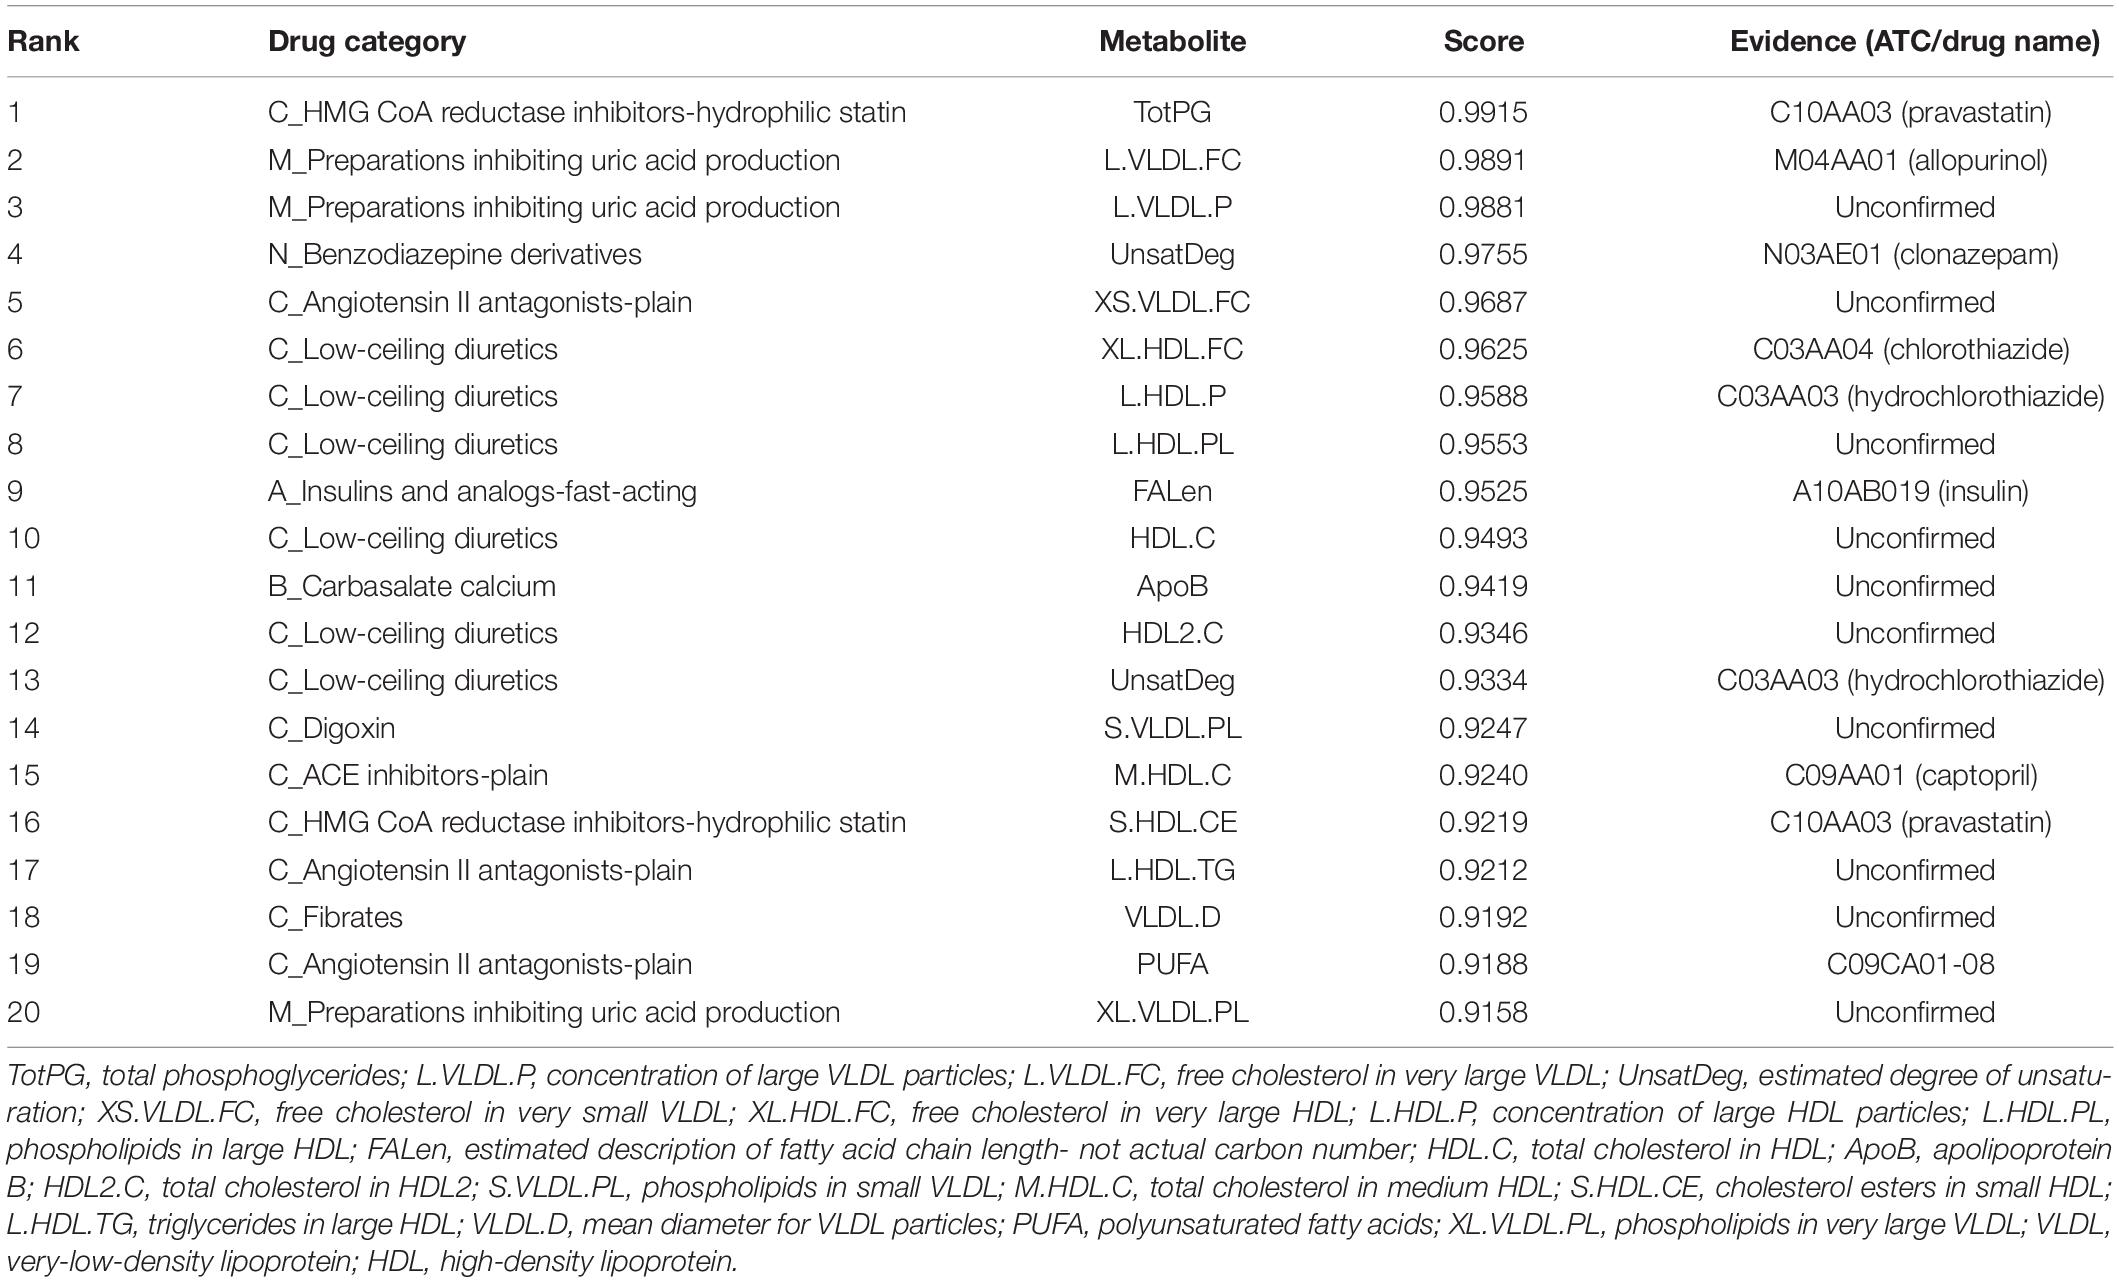
Table 3. Top 20 novel associations predicted by ILMF on the “DrugMetaboliteAtlas” dataset.
Note that the proposed ILMF is also effective when a new drug (or metabolite) without any known related metabolites (or drugs) is given. Once we have obtained the low-dimensional matrix representation of a new drug or of a metabolite, the interaction scores with known drugs or metabolites can be calculated by Eq. 15.
We further apply ILMF to detect the relationships between drugs and metabolites from a global view. ILMF is used to infer the metabolic potential of 42 drugs and chart the metabolic landscape of common drugs. First, we obtain a score matrix by applying ILMF on the whole “DrugMetaboliteAtlas” dataset. Then, hierarchical clustering is performed to explore the unknown relationships between drugs and metabolites (Figure 4). The scores indicate the interaction relationships between drugs and metabolites based on metabolic mechanisms. Therefore, the drugs and metabolites that are grouped may share metabolic overlaps in terms of pathways or microbial metabolites association profiles.
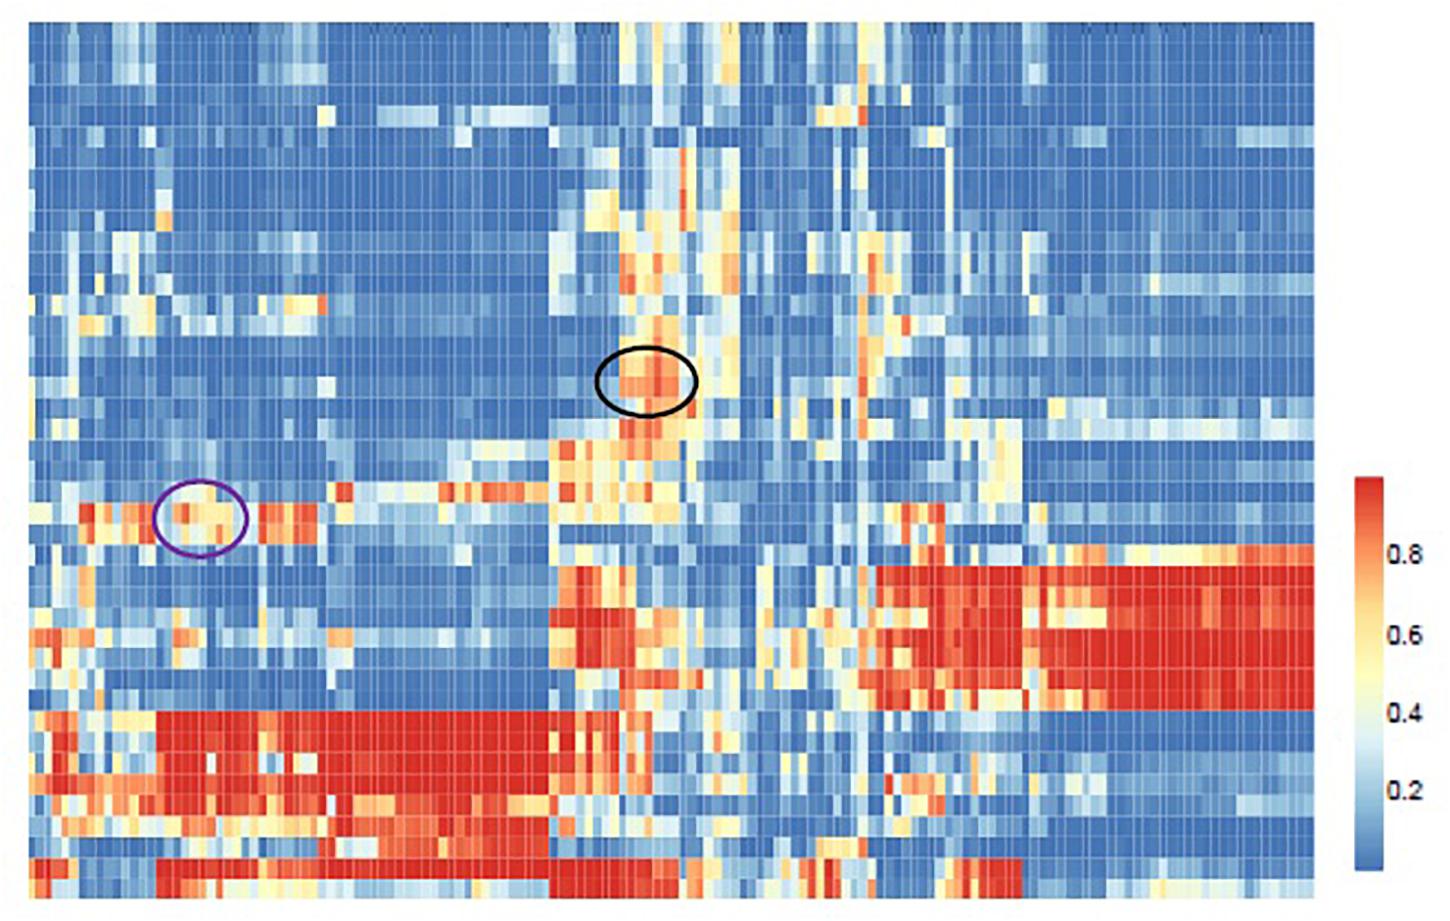
Figure 4. Global view of the predicted drug-metabolite associations. Hierarchical clustering of the ILMF scores between 42 drugs and 150 metabolites. The color of each cell represents the ILMF score of a drug (row) and a metabolite (column), where red/blue indicates high/low ILMF scores.
In Figure 4 the black circled region shows a module that consists of three categories of drugs (Antiarrhythmics-class III, ACE inhibitors-plain, and High-ceiling diuretics) and six kinds of metabolites (Total cholesterol in HDL2, Total cholesterol in HDL, Free cholesterol in medium HDL, Total cholesterol in medium HDL, Total lipids in medium HDL, and Apolipoprotein A-I). These drugs and metabolites, which have no associations in the original drug-metabolite association matrix are identified by the proposed ILMF. The relationships between these drugs and metabolites have been reported in some literature. Figure 5 shows the connectivity of this module by extracting the corresponding rows and columns from the predicted drug-metabolite scoring matrix. The green circle denotes the three drugs mentioned above. The pink diamond denotes six metabolites. Solid lines indicate the true associations between drugs and metabolites. Dot lines indicate the predicted associations by ILMF. The values on the lines are the predicted scores. The bigger the score, the more trustworthy the predicted drug-metabolite interaction pair. This setting is also applied to Figure 6.
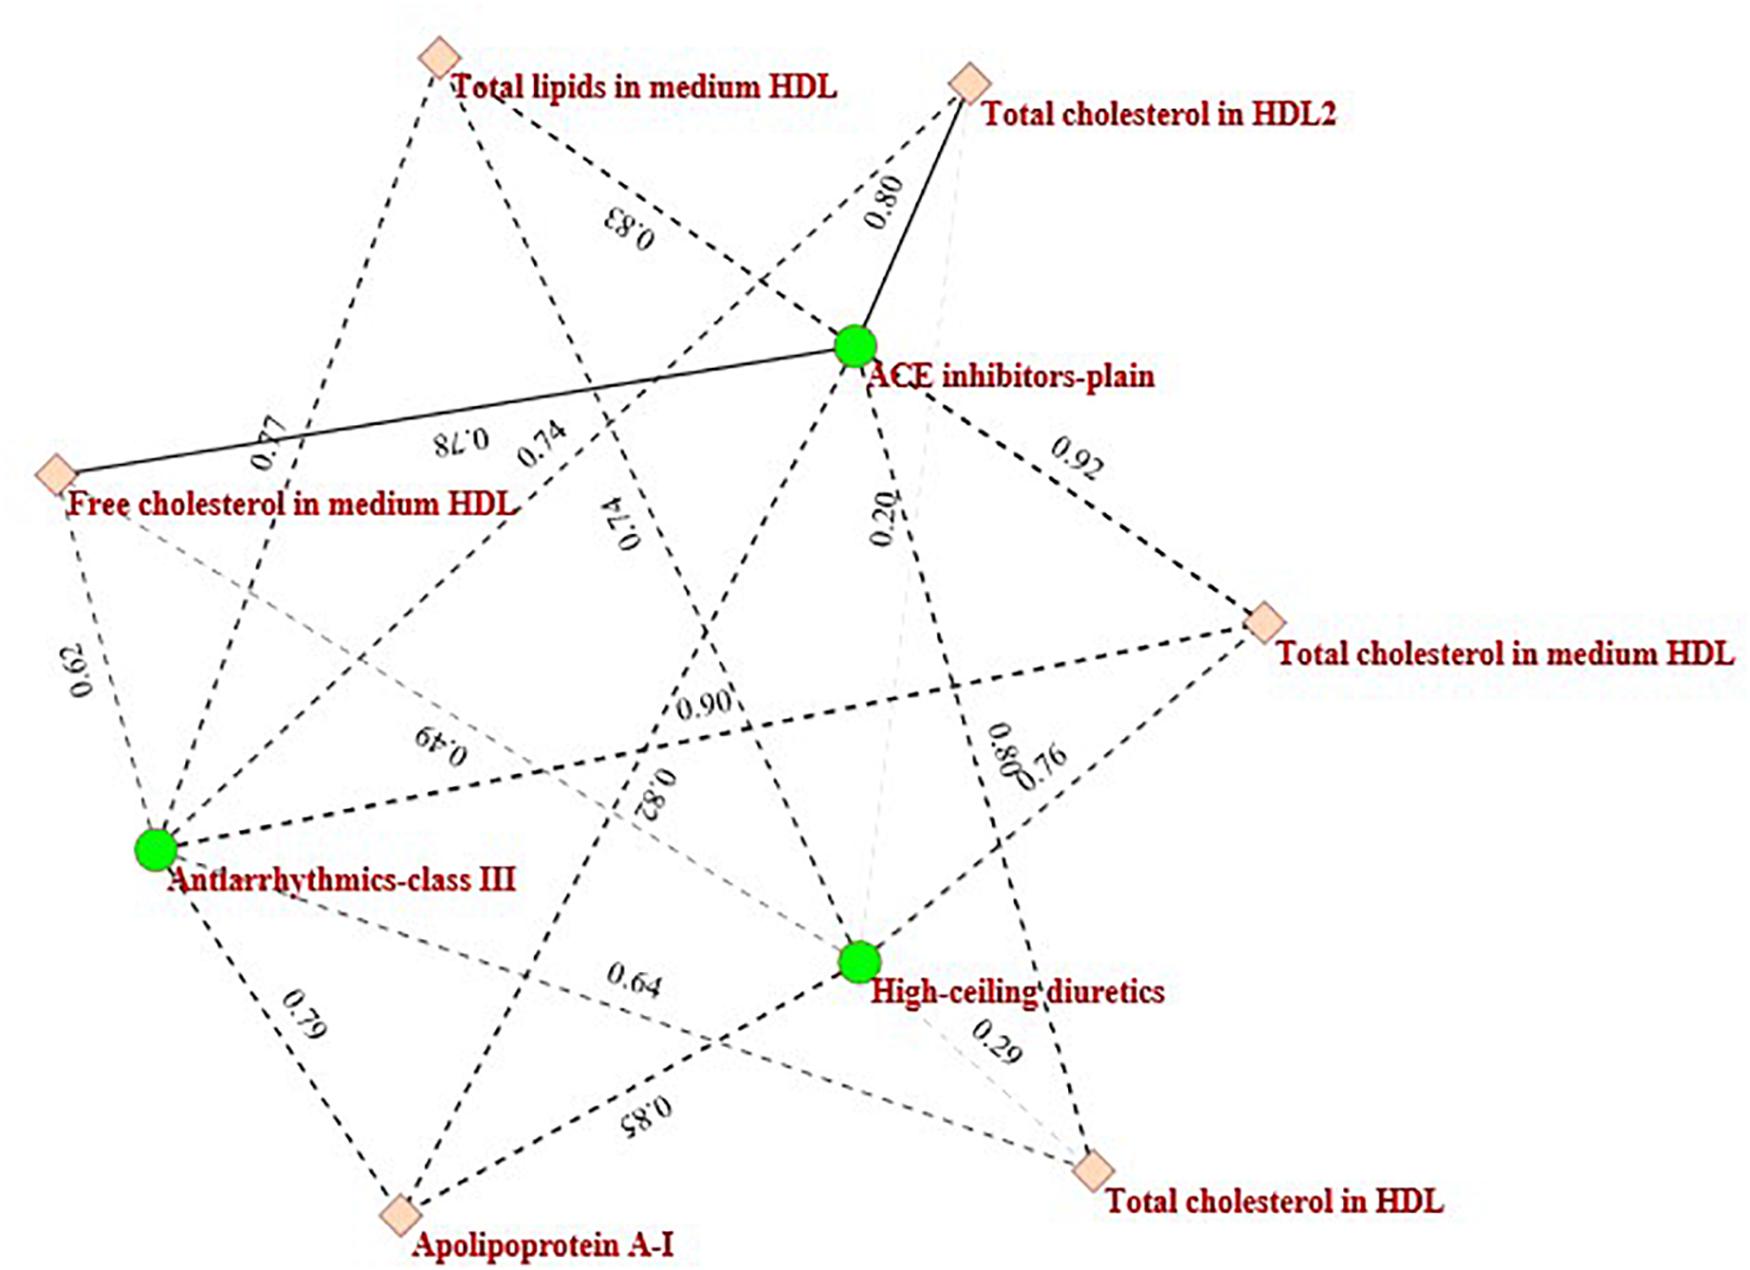
Figure 5. The sub-network consists of three drugs and six metabolites.
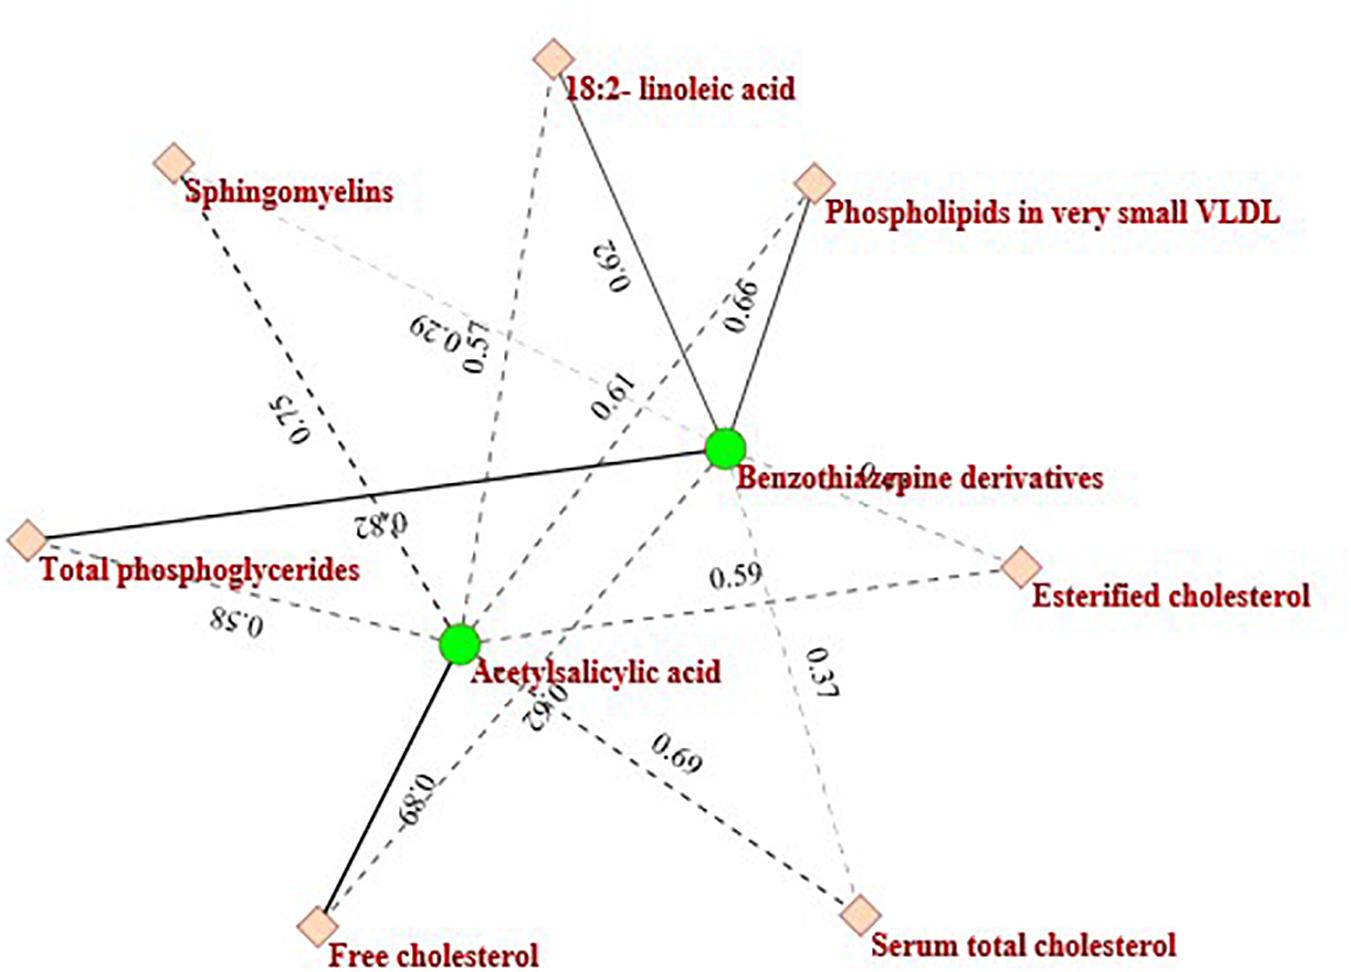
Figure 6. The sub-network consists of two drugs and seven metabolites.
As shown in Figure 5, Total cholesterol in medium HDL is highly related to Antiarrhythmics-class III and ACE inhibitors-plain and the predicted interaction scores between them are 0.90 and 0.92, respectively. This is consistent with the fact that high Total cholesterol level usually leads to other complications, including diabetes, hyperlipidemia, hypertension, hypothyroidism, choledochus obstruction, coronary heart disease, atherosclerosis, and so on (Nelson, 2013). Miyazaki et al. (1999) also reported that ACE activity was significantly increased in the aorta of cholesterol-fed monkeys.
Another example is the purple circled region, which contains two kinds of drugs (Antithrombotic agents-Acetylsalicylic acid: B01AC06 and Benzothiazepine derivatives: C08DB01) and seven metabolites (Sphingomyelins, Serum total cholesterol, Total phosphoglycerides, Esterified cholesterol, Free cholesterol, 18:2-linoleic acid, and Phospholipids in very small VLDL). The drugs and metabolites in this module are also clinically relevant. Figure 6 describes the heterogeneous interaction network of this module. As Figure 6 indicates, Acetylsalicylic acid is related to Sphingomyelins (interaction probability is 0.7531). This finding is also consistent with another previous report by Suwalsky et al. (2013).
There have also been other biologically meaningful modules detected by ILMF. In short, the two examples mentioned above show the potential of the proposed ILMF algorithm in identifying the unknown associations between drugs and metabolites, which further demonstrates its effectiveness and efficiency.
Conclusion
In this article, we propose a novel drug-metabolite association prediction method, named ILMF. ILMF could not only combine multiple-source drug–drug interaction, metabolite–metabolite interaction, and drug-metabolite association information into this framework but also take full advantage of the local geometrical structure inherent in the original data to improve prediction performance. In addition, we also exploited inductive matrix completion to guide the learning of projection matrices U, V based on the low-dimensional feature matrix of drugs (or metabolites) obtained from external data sources. The experimental results for the “DrugMetaboliteAtlas” dataset demonstrate the effectiveness of the proposed ILMF in predicting potential drug-metabolite associations. Moreover, in the last section of this study, we examine case studies on predicting novel drug-metabolite associations, the results of which may provide some valuable clues to biologists or clinicians.
Despite these promising findings, there are still some limitations to this proposed ILMF model. While fusing multiple types of biological data, the chemical structure information of drugs or metabolites is missing due to the fact that the initial “DrugMetaboliteAtlas” dataset only contains vague categories, particularly for metabolites. The low-dimension feature representation learning algorithm (clusDCA) is replaceable. More effective graph representation learning frameworks, such as graph convolution network (GCN), are expected to be combined with the ILMF framework to more accurately predict drug-metabolite associations. Lastly, the predicted drug-metabolite interactions need to be further validated in practice.
In the future, we will focus on developing new methods to explore the complex relationships between drugs and microbes, including the influence of microbes on drug activity or toxicity and so on.
Data Availability Statement
Publicly available datasets were analyzed in this study. This data can be found here: https://github.com/chonghua-1983/ILMF.
Author Contributions
YYM wrote the manuscript and developed the algorithms. YYM and LL developed the concept for the structure and content of the manuscript. QC wrote the code used in the manuscript. YJM critically revised the final manuscript. All authors reviewed and approved the final version of the manuscript.
Funding
This work was supported by the National Natural Science Foundation of China (No. 61532008), Key Research Projects of Henan Higher Education Institutions (No. 20B520002), and The Key Technology R&D Program of Henan Province (No. 202102310561).
Conflict of Interest
The authors declare that the research was conducted in the absence of any commercial or financial relationships that could be construed as a potential conflict of interest.
Footnotes
References
Chen, X., Wang, L., Qu, J., Guan, N.-N., and Li, J.-Q. (2018). Predicting miRNA–disease association based on inductive matrix completion. Bioinformatics 34, 4256–4265.
Cho, H., Berger, B., and Peng, J. (2015). Diffusion component analysis: unraveling functional topology in biological networks. in: International Conference on Research in Computational Molecular Biology. Berlin: Springer, 62–64.
Ding, H., Takigawa, I., Mamitsuka, H., and Zhu, S. (2014). Similarity-based machine learning methods for predicting drug–target interactions: a brief review. Briefings Bioinform. 15, 734–747. doi: 10.1093/bib/bbt056
Doestzada, M., Vila, A. V., Zhernakova, A., Koonen, D. P., Weersma, R. K., Touw, D. J., et al. (2018). Pharmacomicrobiomics: a novel route towards personalized medicine? Protein cell 9, 432–445. doi: 10.1007/s13238-018-0547-2
Duchi, J., Hazan, E., and Singer, Y. (2011). Adaptive subgradient methods for online learning and stochastic optimization. J. Mach. Learn. Res. 12, 2121–2159.
Fuller, A. (1937). Is p-aminobenzenesulphonamide the active agent in prontosil therapy? Lancet 229, 194–198. doi: 10.1016/s0140-6736(00)97447-6
Haiser, H. J., Gootenberg, D. B., Chatman, K., Sirasani, G., Balskus, E. P., and Turnbaugh, P. J. (2013). Predicting and manipulating cardiac drug inactivation by the human gut bacterium Eggerthella lenta. Science 341, 295–298. doi: 10.1126/science.1235872
He, B.-S., Peng, L.-H., and Li, Z. (2018). Human microbe-disease association prediction with graph regularized non-negative matrix factorization. Front. Microbiol. 9:2560. doi: 10.3389/fmicb.2018.02560
Hu, Y., Koren, Y., and Volinsky, C. (2008). Collaborative filtering for implicit feedback datasets. in: 2008 Eighth IEEE International Conference on Data Mining. Pisa, Italy: IEEE, 263–272.
Jain, P., and Dhillon, I. S. (2013). Provable inductive matrix completion. arXiv preprint arXiv:1306.0626. ∗∗.
Johnson, C. C. (2014). Logistic matrix factorization for implicit feedback data. Adv. Neural Inform. Proc. Syst. 27, 1–9.
Kurilshikov, A., Van Den Munckhof, I. C., Chen, L., Bonder, M. J., Schraa, K., Rutten, J. H., et al. (2019). Gut microbial associations to plasma metabolites linked to cardiovascular phenotypes and risk: a cross-sectional study. Circ. Res. 124, 1808–1820. doi: 10.1161/circresaha.118.314642
Liu, J., Lahousse, L., Nivard, M. G., Bot, M., Chen, L., Van Klinken, J. B., et al. (2020). Integration of epidemiologic, pharmacologic, genetic and gut microbiome data in a drug–metabolite atlas. Nat. Med. 26, 110–117.
Liu, Y., Wei, W., Sun, A., and Miao, C. (2014). Exploiting geographical neighborhood characteristics for location recommendation. in: Proceedings of the 23rd ACM International Conference on Conference on Information and Knowledge Management). New York: ACM, 739–748.
Liu, Y., Wu, M., Miao, C., Zhao, P., and Li, X.-L. (2016). Neighborhood regularized logistic matrix factorization for drug-target interaction prediction. PLoS Comput. Biol. 12:e1004760. doi: 10.1371/journal.pcbi.1004760
Long, Y., and Luo, J. (2020). Association mining to identify microbe drug interactions based on heterogeneous network embedding representation. IEEE J. Biomed. Health Inform. 25, 266–275. doi: 10.1109/jbhi.2020.2998906
Long, Y., Wu, M., Kwoh, C. K., Luo, J., and Li, X. (2020). Predicting human microbe-drug associations via graph convolutional network with conditional random field. Bioinformatics 36, 4918–4927. doi: 10.1093/bioinformatics/btaa598
Luo, Y., Zhao, X., Zhou, J., Yang, J., Zhang, Y., Kuang, W., et al. (2017). A network integration approach for drug-target interaction prediction and computational drug repositioning from heterogeneous information. Nat. Commun. 8, 1–13.
Ma, Y., He, T., and Jiang, X. (2020a). Multi-network logistic matrix factorization for metabolite–disease interaction prediction. FEBS Lett. 594, 1675–1684. doi: 10.1002/1873-3468.13782
Ma, Y., Liu, G., Ma, Y., and Chen, Q. (2020b). Integrative analysis for identifying co-modules of microbe-disease data by matrix tri-factorization with phylogenetic information. Front. Genet. 11:83. doi: 10.3389/fgene.2020.00083
Miyazaki, M., Sakonjo, H., and Takai, S. (1999). Anti-atherosclerotic effects of an angiotensin converting enzyme inhibitor and an angiotensin II antagonist in cynomolgus monkeys fed a high-cholesterol diet. Br. J. Pharmacol. 128, 523–529. doi: 10.1038/sj.bjp.0702833
Natarajan, N., and Dhillon, I. S. (2014). Inductive matrix completion for predicting gene–disease associations. Bioinformatics 30, i60–i68.
Nelson, R. H. (2013). Hyperlipidemia as a risk factor for cardiovascular disease. Primary Care 40, 195–211. doi: 10.1016/j.pop.2012.11.003
Nelson, W., Zitnik, M., Wang, B., Leskovec, J., Goldenberg, A., and Sharan, R. (2019). To embed or not: network embedding as a paradigm in computational biology. Front. Genet. 10:381. doi: 10.3389/fgene.2019.00381
Shang, D., Li, C., Yao, Q., Yang, H., Xu, Y., Han, J., et al. (2014). Prioritizing candidate disease metabolites based on global functional relationships between metabolites in the context of metabolic pathways. PloS One 9:e104934. doi: 10.1371/journal.pone.0104934
Suwalsky, M., Belmar, J., Villena, F., Gallardo, M. J., Jemiola-Rzeminska, M., and Strzalka, K. (2013). Acetylsalicylic acid (aspirin) and salicylic acid interaction with the human erythrocyte membrane bilayer induce in vitro changes in the morphology of erythrocytes. Arch. Biochem. Biophys. 539, 9–19. doi: 10.1016/j.abb.2013.09.006
Wang, B., Huang, L., Zhu, Y., Kundaje, A., Batzoglou, S., and Goldenberg, A. (2017). Vicus: exploiting local structures to improve network-based analysis of biological data. PLoS comput. Biol. 13:e1005621. doi: 10.1371/journal.pcbi.1005621
Wang, F., Huang, Z.-A., Chen, X., Zhu, Z., Wen, Z., Zhao, J., et al. (2017). LRLSHMDA: laplacian regularized least squares for human microbe–disease association prediction. Sci. Rep. 7, 1–11.
Wang, S., Cho, H., Zhai, C., Berger, B., and Peng, J. (2015). Exploiting ontology graph for predicting sparsely annotated gene function. Bioinformatics 31, i357–i364.
Xiao, Q., Luo, J., Liang, C., Cai, J., and Ding, P. J. B. (2018). A graph regularized non-negative matrix factorization method for identifying microRNA-disease associations. Bioinformatics 34, 239–248. doi: 10.1093/bioinformatics/btx545
Yao, Q., Xu, Y., Yang, H., Shang, D., Zhang, C., Zhang, Y., et al. (2015). Global prioritization of disease candidate metabolites based on a multi-omics composite network. Sci. Rep. 5:17201.
Zeng, X., Zhu, S., Lu, W., Liu, Z., Huang, J., Zhou, Y., et al. (2020). Target identification among known drugs by deep learning from heterogeneous networks. Chem. Sci. 11, 1775–1797. doi: 10.1039/c9sc04336e
Zhang, W., Chen, Y., Li, D., and Yue, X. (2018a). Manifold regularized matrix factorization for drug-drug interaction prediction. J. Biomed. Inform. 88, 90–97. doi: 10.1016/j.jbi.2018.11.005
Zhang, W., Yue, X., Lin, W., Wu, W., Liu, R., Huang, F., et al. (2018b). Predicting drug-disease associations by using similarity constrained matrix factorization. BMC Bioinform. 19:233. doi: 10.1186/s12859-018-2220-4
Zhang, W., Jing, K., Huang, F., Chen, Y., Li, B., Li, J., et al. (2019). SFLLN: a sparse feature learning ensemble method with linear neighborhood regularization for predicting drug–drug interactions. Inform. Sci. 497, 189–201. doi: 10.1016/j.ins.2019.05.017
Zhang, Z.-C., Zhang, X.-F., Wu, M., Ou-Yang, L., Zhao, X.-M., and Li, X.-L. (2020). A graph regularized generalized matrix factorization model for predicting links in biomedical bipartite networks. Bioinformatics 36, 3474–3481. doi: 10.1093/bioinformatics/btaa157
Zheng, X., Ding, H., Mamitsuka, H., and Zhu, S. (2013). Collaborative matrix factorization with multiple similarities for predicting drug-target interactions. in: Proceedings of the 19th ACM SIGKDD international conference on Knowledge discovery and data mining). New York: ACM, 1025–1033.
Keywords: logistic matrix factorization, drug-metabolite association, Vicus matrix, human metabolites, graph regularization
Citation: Ma Y, Liu L, Chen Q and Ma Y (2021) An Inductive Logistic Matrix Factorization Model for Predicting Drug-Metabolite Association With Vicus Regularization. Front. Microbiol. 12:650366. doi: 10.3389/fmicb.2021.650366
Received: 07 January 2021; Accepted: 08 March 2021;
Published: 01 April 2021.
Edited by:
Qi Zhao, University of Science and Technology Liaoning, ChinaReviewed by:
Jin-Xing Liu, Qufu Normal University, ChinaWen Zhang, Huazhong Agricultural University, China
Copyright © 2021 Ma, Liu, Chen and Ma. This is an open-access article distributed under the terms of the Creative Commons Attribution License (CC BY). The use, distribution or reproduction in other forums is permitted, provided the original author(s) and the copyright owner(s) are credited and that the original publication in this journal is cited, in accordance with accepted academic practice. No use, distribution or reproduction is permitted which does not comply with these terms.
*Correspondence: Yuanyuan Ma, Y2hvbmdodWFfMTk4M0AxMjYuY29t