 Emma Barahona1
 Elisa San Isidro1
 Laura Sierra-Heras1
 Inés Álvarez-Melcón1
 Emilio Jiménez-Vicente1
 José María Buesa1
 Juan Imperial1
 Luis M. Rubio1,2*
- 1Centro de Biotecnología y Genómica de Plantas, Universidad Politécnica de Madrid (UPM), Instituto Nacional de Investigación y Tecnología Agraria y Alimentaria (INIA-CSIC), Madrid, Spain
- 2Departamento de Biotecnología-Biología Vegetal, Escuela Técnica Superior de Ingeniería Agronómica, Alimentaria y de Biosistemas, Universidad Politécnica de Madrid, Madrid, Spain
Nitrogenase-dependent H2 production by photosynthetic bacteria, such as Rhodobacter capsulatus, has been extensively investigated. An important limitation to increase H2 production using genetic manipulation is the scarcity of high-throughput screening methods to detect possible overproducing mutants. Previously, we engineered R. capsulatus strains that emitted fluorescence in response to H2 and used them to identify mutations in the nitrogenase Fe protein leading to H2 overproduction. Here, we used ultraviolet light to induce random mutations in the genome of the engineered H2-sensing strain, and fluorescent-activated cell sorting to detect and isolate the H2-overproducing cells from libraries containing 5 × 10⁵ mutants. Three rounds of mutagenesis and strain selection gradually increased H2 production up to 3-fold. The whole genomes of five H2 overproducing strains were sequenced and compared to that of the parental sensor strain to determine the basis for H2 overproduction. No mutations were present in well-characterized functions related to nitrogen fixation, except for the transcriptional activator nifA2. However, several mutations mapped to energy-generating systems and to carbon metabolism-related functions, which could feed reducing power or ATP to nitrogenase. Time-course experiments of nitrogenase depression in batch cultures exposed mismatches between nitrogenase protein levels and their H2 and ethylene production activities that suggested energy limitation. Consistently, cultivating in a chemostat produced up to 19-fold more H2 than the corresponding batch cultures, revealing the potential of selected H2 overproducing strains.
Introduction
The nitrogen-fixing and photosynthetic purple non-sulfur bacterium (PNSB) Rhodobacter capsulatus evolves H2 using two genetically distinct nitrogenases, a Mo-nitrogenase and an Fe-only nitrogenase, when cultured under anaerobic, illuminated conditions with organic compounds and in the total absence of nitrogen or in the presence of a poor nitrogen source (Scolnik and Haselkorn, 1984; Strnad et al., 2010). Nitrogenases are two-component enzymes (Bulen and LeComte, 1966) formed by a dinitrogenase (called MoFe protein in the Mo-nitrogenase and FeFe protein in the Fe-only nitrogenase) and a dinitrogenase reductase (called the Fe protein), which catalyze the reduction of N2 into NH3 in a reaction that also produces, at a minimum, one mol of H2 per mol of reduced N2 (Seefeldt et al., 2020).
N2 + 8 H+ + 8 e− + 16 MgATP + 16 H2O → H2 + 2 NH3 + 16 MgADP + 16 Pi.
The specific substrate-reducing activities of the R. capsulatus nitrogenases have been described (Schneider et al., 1991, 1997). The relative H2 to NH3 production varies with the component ratio and nitrogenase type, being much higher in lower electron fluxes and for the Fe-only nitrogenase compared to the Mo-nitrogenase, making potential H2 production much higher than predicted from the above equation.
Rhodobacter capsulatus also expresses two hydrogenases: a cytosolic H2-sensing [Ni-Fe] hydrogenase encoded by hupU and hupV (Vignais and Billoud, 2007), and a membrane-bound uptake [Ni–Fe] hydrogenase that catalyzes the reversible reaction 2H+ + 2e− ↔ H2 (Colbeau et al., 1993; Vignais et al., 2005). This latter enzyme is a heterodimer of the hupA and hupB gene products. The hupC gene product is a cytochrome b-type protein that anchors HupAB to the membrane and receives electrons from HupA (Vignais and Billoud, 2007). Transcription of hupABC is controlled by a promoter in response to H2 and involves a HupUV H2-sensor and a two-component regulatory system consisting of a histidine kinase HupT and a response regulator HupR. In the absence of H2, HupT and HupUV interact to form a complex in which HupT has increased auto kinase activity. Autophosphorylated HupT transfers a phosphate group to HupR, which in this state is unable to activate transcription. In the presence of H2, HupUV binds H2 and HupT is released. Although trans-phosphorylation between HupT and HupR can occur, in this state HupT appears to function rather in a phosphatase mode, leaving HupR in the active, unphosphorylated state, which can now activate transcription (Vignais et al., 2005).
Diverse approaches have been used to increase H2 production by genetic manipulation of microorganisms. Increase of H2 production by hydrogenase obtained by directed mutagenesis or by removing genes related to their synthesis, regulation or assembly has been reported (Jahn et al., 1994; Masukawa et al., 2002; Liu et al., 2010). Nitrogenases are also excellent H2-producing enzymes, and H2 production via nitrogenase has also been improved, mainly in cyanobacteria (Bandyopadhyay et al., 2010; Masukawa et al., 2010; Skizim et al., 2012) and PNSB (Rey et al., 2007; Kim et al., 2008; Liu et al., 2010; Wang et al., 2010; Barahona et al., 2016; Zhang et al., 2016). An important limitation to improve H2-producing enzymes is the scarcity of high-throughput screening methods for H2 overproducing microorganisms. In this context, a combination of fluorescence-activated cell sorting (FACS), an engineered R. capsulatus strain that generates fluorescein in response to H2, and the in vivo expression of random variants of the nitrogenase NifH protein in the engineered strain, has been used previously to detect and separate H2 overproducing cells in screenings involving over a million variants per experiment (Barahona et al., 2016).
Here, we subjected R. capsulatus to directed genome evolution to increase H2 production. Random UV mutagenesis of engineered H2-sensing strains was combined with FACS to detect and isolate the resulting H2-overproducing cells. Three rounds of mutagenesis/selection were performed to achieve 2- to 3-fold increase in H2 production over the parental H2-sensing strain. The effect of removing H2 from the gas phase of R. capsulatus cultures to accelerate H2 evolution was also investigated.
Materials and methods
Bacterial strains, growth media, and growth conditions
Bacterial strains used in this study are listed in Supplementary Table S1. R. capsulatus strains were cultivated either in rich YPS medium or RCV minimal medium (Weaver et al., 1975). RCV medium contained 30 mM DL-malate and 10 mM (NH4)2SO4 as sole carbon and nitrogen source, respectively. When required for nitrogenase derepression, ammonium was omitted (RCV0) and, when indicated, RCV was supplemented with 10 mM L-serine (in this work, called RCVS). For Petri dishes medium was solidified with 1.5% agar. The medium was supplemented with kanamycin (Km; 50 μg/ml) or rifampicin (Rif; 25 μg/ml) when required. Cultures were incubated at 30°C either under chemotrophic (aerobic) or phototrophic (anaerobic) conditions. Petri dishes were incubated at 30°C inside illuminated (300 lux) anaerobic jars in the presence of anaerobic gas generator bags (AnaeroGen™, Thermo Scientific, United States).
To determine growth curves of R. capsulatus-derived strains, precultures in RCV medium were diluted to an OD600 of 0.15 and transferred in triplicate to 24-multiwell plates. Cultures were grown at 30°C in presence of oxygen with shaking (700 rpm) using a SPECTROstar Nano instrument (BMG LABTECH, Germany) to determine the OD600, and growth was recorded every hour for 44 h.
To derepress nitrogenase in batch cultures, R. capsulatus cells precultured in RCV were transferred to 100-ml capped vials containing 60 ml of RCV0 medium and adjusted to an initial OD600 of 0.18. Vials were sparged with N2 to completely remove air. Cultures were grown at 30°C phototrophically (six 60 W light bulbs providing 300 lux at 25 cm of the vials) for 22 h.
Nitrogenase was also derepressed in continuous cultures. The system consisted of an illuminated 300 ml bioreactor containing 150 ml of RCV0. The bioreactor was inoculated with anaerobically grown R. capsulatus cells to an initial OD600 of 0.3 and the reactor was made anaerobic by sparging N2 for 1 h (t = 0 h). After 16 h of diazotrophic growth, the gas phase was renewed by sparging N2 for 1 h. Then, a peristaltic pump was used to replace fresh medium for reactor contents at a flow of 2.5 ml/min until the end of the experiment. At t = 39.5 h, the bioreactor was opened again both to release any H2 produced and to renew the N2 atmosphere by sparging. H2 measurements were taken at 0, 16, 17, 22.5, 25.5, 39.5, 40, 46, 49, and 63 h.
Ultraviolet light mutagenesis
Ultraviolet light (UV light) mutagenesis was performed on R. capsulatus wild-type, S1, and S2 strains to generate random mutations along the genome. Each strain was cultured for 48 h on two Petri dishes containing solid YPS medium. One of the two Petri dishes was exposed to UV light while the second plate was used as control. The procedure was carried out in the dark to prevent photoreactivation. After UV light exposure, a loop of cells from each Petri dish was resuspended in 1 ml YPS and vortexed vigorously. Serial dilutions (from 10−1 to 10−6) were plated onto solid YPS to give 30–300 colonies/plate and incubated at 30°C for 48 h. Colony counts were performed to estimate survival rates. Nine UV treatment times were tested. At 30 s, and at 1, 3, 5, 6, and 8 min, there were no survival differences between UV-treated plates and non-treated controls. At 10 min, the survival rate in UV-treated plates was 90% of the control. At 13 min, the survival rate was 8% for R. capsulatus wild type and 10% for the S2 strain. No survivors were obtained after 15 min of UV illumination. Therefore, a 13-min exposure to UV light was used to generate libraries of random mutants. Each library contained ca. 3 × 10⁹ colony-forming units.
Flow cytometry
Rhodobacter capsulatus cells grown under diazotrophic conditions in 100-ml capped vials, containing 60 ml of RCVS medium, were collected by centrifugation in Falcon tubes for 15 min at 4°C, 4,500×g, resuspended in 5 ml PBS supplemented with 10% glycerol, and incubated for 30 min at 4°C. Cells were then collected, resuspended in 1 ml of an 8:1:1 mixture of PBS, fluorescein di-β-D-galactopyranoside (FDG) and propidium iodide (PI), and incubated at 37°C for 30 min to facilitate FDG entrance into the cells. When cleaved by β-galactosidase, FDG releases fluorescein, which cannot diffuse across the cytoplasmic membrane (Plovins et al., 1994). Cells were collected by centrifugation, resuspended in RCV medium, and analyzed in a FACSVantage (sorter) flow cytometer using an argon ion laser to excite the fluorochrome (488 nm) and a 0.5 μm filament filter to separate very small particles. About 5 × 10⁵ cells were analyzed in each experiment. The cell sorter was programmed with very stringent parameters to separate individual cells leading to clonal populations. Only a few cells from a subpopulation exhibiting 10–100-fold more fluorescence than the population average were sorted and recovered in 96-well microplates containing RCV medium. These stringent sorting conditions were chosen to ensure that just one highly fluorescent cell, or none, went into the receiving well. As a result, only a single microplate was filled in a 2-h experiment, and about one-half of the wells produced no growth when their contents were used as inoculum. Grown cultures were then diluted to normalize their OD and transferred to RCVS medium in 96-well microplates to derepress nitrogenase overnight and prepare for 4-methylumbelliferone β-D-galactopyranoside (MUG) assays.
4-Methylumbelliferone β-D-galactopyranoside activity assays
4-Methylumbelliferone β-D-galactopyranoside β-galactosidase activity assays were carried out as described in (Barahona et al., 2016). R. capsulatus cultures were incubated overnight under diazotrophic conditions inside a glove box in a 96-well plate (black/clear Optilux™ flat bottom; BD Biosciences) covered with a transparent adhesive sealer. Portions of 120 μl from each culture were transferred to a 96-well microplate containing 100 μl of Z-Buffer (Miller, 1972) in each well, then supplemented with 25 μl MUG solution (1 mg/ml solution in dimethyl sulfoxide) and incubated at room temperature for 2 h in darkness. MUG hydrolysis by β-galactosidase was quantified by fluorescence emission at 445 nm (372 nm excitation wavelength) in a Genios Pro (Tecan) microplate fluorometer.
In vivo nitrogenase acetylene reduction assay
To determine acetylene reduction activity in R. capsulatus, 1 ml portions of cultures grown under diazotrophic conditions were transferred to 9-ml sealed vials with a 94% N2/6% acetylene gas phase and incubated at 30°C in presence of light for 30 min. Ethylene formation was detected in 50 μl samples withdrawn from the gas phase by using a Shimadzu GC-2014 gas chromatograph equipped with a 9-ft long, 1/8-in diameter Porapak R column. In vivo nitrogenase activity units are defined as nmol ethylene formed per min per ml of culture at an OD600 equal to 1 (nmol C2H4 min−1 OD600−1).
H2 production measurements
To determine H2 production in R. capsulatus cultures grown under diazotrophic conditions, 250 μl samples were withdrawn at the indicated times from the gas phase of 100 ml capped vials. H2 production in R. capsulatus continuous cultures was also determined in 250 μl gas phase samples withdrawn at the indicated times. Samples were injected in a Shimadzu GC-8A gas chromatograph equipped with a 6-ft long, 1/8-in diameter Molecular Sieve column 5A. Each measurement had two technical replicates per biological replicate. H2 production activity is presented either as total H2 released or as H2 released per hour and ml of culture (OD600 = 1).
Immunoblot detection of NifH and NifDK proteins
For SDS-PAGE, cells from 1-ml culture samples were collected by centrifugation, resuspended in 2× Laemmli sample buffer supplemented with 0.1 M dithiothreitol (to a concentration equivalent to an OD600 of 4), and electrophoresed in 12% acrylamide/bisacrylamide (29:1) gels. For immunoblot analysis, proteins were transferred to nitrocellulose membranes for 40 min at 20 V using a Transfer-Blot® Semi Dry system (Bio-Rad). Immunoblot analyses were carried out with antibodies raised against a 1:1 mixture of Azotobacter vinelandii and Rhodospirillum rubrum NifH proteins (1:2,500 dilution) or with antibodies raised against R. capsulatus NifDK (1:2,000 dilution; antibody kindly donated by Yves Jouanneau, CNRS, Grenoble). Secondary HRP-conjugated anti-rabbit antibody (Invitrogen, United States) was used at 1:15,000 dilution.
Whole-genome DNA sequencing and data analysis
For second-generation genome sequencing, total DNA from bacterial cultures was isolated using the NZY Tissue gDNA isolation kit (NZYTech), following the manufacturer’s instructions, and eluted in a final volume of 100 μl. A negative control that contained no sample was included in the DNA isolation process to check for cross-contamination during the experiments. DNA samples were quantified using the Qubit dsDNA HS Assay kit (Thermo Fisher Scientific) and sequenced by an external service provider (AllGenetics & Biology SL). Briefly, libraries were constructed using the Nextera XT DNA Library Prep kit (Illumina) according to the manufacturer’s instructions, and they were dual indexed for post-sequencing demultiplexing. The fragment size distribution of the libraries was checked with an Agilent 2,100 Bioanalyzer using the Agilent DNA 1000 Kit. Libraries were quantified with the Qubit dsDNA HS Assay Kit and pooled in equimolar amounts. Pooled libraries were then sequenced with an Illumina MiSeq (2 × PE, 300 bp) sequencer.
For third-generation genome sequencing, total DNA extraction from S2– R. capsulatus culture was performed using DNeasy Blood & Tissue Kit (QIAGEN) according to PacBio guidelines for handling high-molecular-weight DNA for successful constructions of SMRTbell™ libraries. Quick Ampure XP bead clean-up was then performed to remove RNA contamination. DNA quality (i.e., integrity, purity, and concentration) necessary for library preparations was evaluated from gel images of DNA samples and by Qubit® fluorimetry. Barcoded libraries were prepared, and the size was selected by performing one 0.45 × (sample volume to beads volume ratio) clean followed by another 0.4 x clean using Ampure beads to remove DNA fragments smaller than 3–5 kb. Sequence data were demultiplexed and genomes assembled using PacBio’s Microbial Assembly Tool.
Raw genome sequencing reads were processed to correct or eliminate erroneous reads. Error correction algorithms, from simple trimming processes using base quality scores to complex error correction approaches based on the frequency of erroneous reads in the set being assembled, were carried out. Subsequently, single-nucleotide polymorphisms (SNV) were mapped to the S2– R. capsulatus genome used as reference. Initial DNA sequence comparisons detected more than a thousand differences between the reference genome and UV-mutated derivatives, but most of those laid in regions of lower sequence coverage and were considered population polymorphisms. Thus, only SNVs present in more than 65% of the reads, and that were also present in subsequent strain derivatives (3 rounds of mutagenesis were performed), were considered for further analysis. All procedures were performed using Geneious version 6.1.8 software. SNVs were confirmed by performing Basic Local Alignment Search Tool (BLAST) against the reference genome.
Statistical analysis
Statistical analyses were carried out using Prism software. One-way ANOVA tests were performed to compare the means of multiple sets of data (p < 0.05). Adjusted p values were determined by the Bonferroni test.
Results
We sought to develop a method to generate and in vivo identify H2 overproducing PNSB variants that could be easily implemented in the set-up of an academic R&D laboratory. This method starts by generating a huge library of random mutants that is subsequently screened in groups of half a million at a time by FACS using a fluorescence signal as proxy for H2 production. The selection procedure favors speed and standardization, and balances, on one hand, a significant increase in fluorescence signal with, on the other hand, obtaining a manageable number of selected overproducing strains. We found out that about 1% of the mutant population emitted 10-100-fold higher signal than average, and that a 2–3-h FACS experiment could sort out and collect 96 of them in a single plate. Because the number of isolated clones was relatively small, a growth test and secondary H2 production proxy screening were then performed to validate the FACS selection before real H2 production was determined. To “fix” advantageous mutations for H2 production, we decided to pursue stepwise increments rather than performing a deeper– and much longer–screening of an individual mutagenic library. Thus, the 2–3 highest H2 overproducing mutants were used in subsequent cycles of mutagenesis and screening. At the end, a collection of H2 overproducing R. capsulatus mutants was analyzed by whole genome sequencing to gain insights into the genetic basis of their phenotypes and to establish the mutation genealogy.
First round of UV mutagenesis and screening for H2-overproducing strains
Rhodobacter capsulatus S1 and S2 sensor strains contain a copy of lacZ (PhupA::lacZ) integrated in the chromosome between hypF and hupA (Supplementary Table S1). They express LacZ and catalyze the formation of fluorescein from fluorescein di-β-D-galactopyranoside (FDG) in response to endogenously produced H2 (Barahona et al., 2016). In addition, S2 lacks the hupAB structural genes for the uptake-hydrogenase and is unable to consume H2. Random genome-wide mutagenesis of S2 was performed as starting point to generate strains with enhanced in vivo H2 production. S2 cells growing on solid YPS medium were exposed to UV light, serially diluted, and plated again to assess survival. About 3 × 10⁹ colony-forming units (10% survival rate) were recovered after mutagenesis. Mutagenized cells (UV-S2) were pooled, derepressed for nitrogenase in RCVS medium, incubated with FDG, and analyzed by FACS flow cytometry (Figure 1A). Wild-type, S1, and S2 cells derepressed for nitrogenase and treated with FDG were used as controls. About 5 × 10⁵ mutagenic events were processed per FACS sample. UV-S2 cells emitting 10 to 100-fold more fluorescence than the main population (1.4% of the total population in the P2 areas of Figure 1A) were sorted by the flow cytometer and some of them were collected into a 96-well microplate containing RCV medium. After incubation, growth was observed in 52% of the inoculated wells. Grown cultures were then transferred to RCVS medium inside an anaerobic glovebox for nitrogenase derepression and secondary MUG-based β-galactosidase activity determinations. Fourteen mutants exhibited at least 2.5-fold higher MUG-derived fluorescence than S2 (Figure 1B). Derepressed cultures showed statistically significant increases in H2 production rates compared to S1 and S2 (see Round 1 box in Figure 2). S2-derived strains 2G, 11F, and 11G were selected as the highest H2 producers and further analyzed in time-course H2-production experiments (Figure 3A).
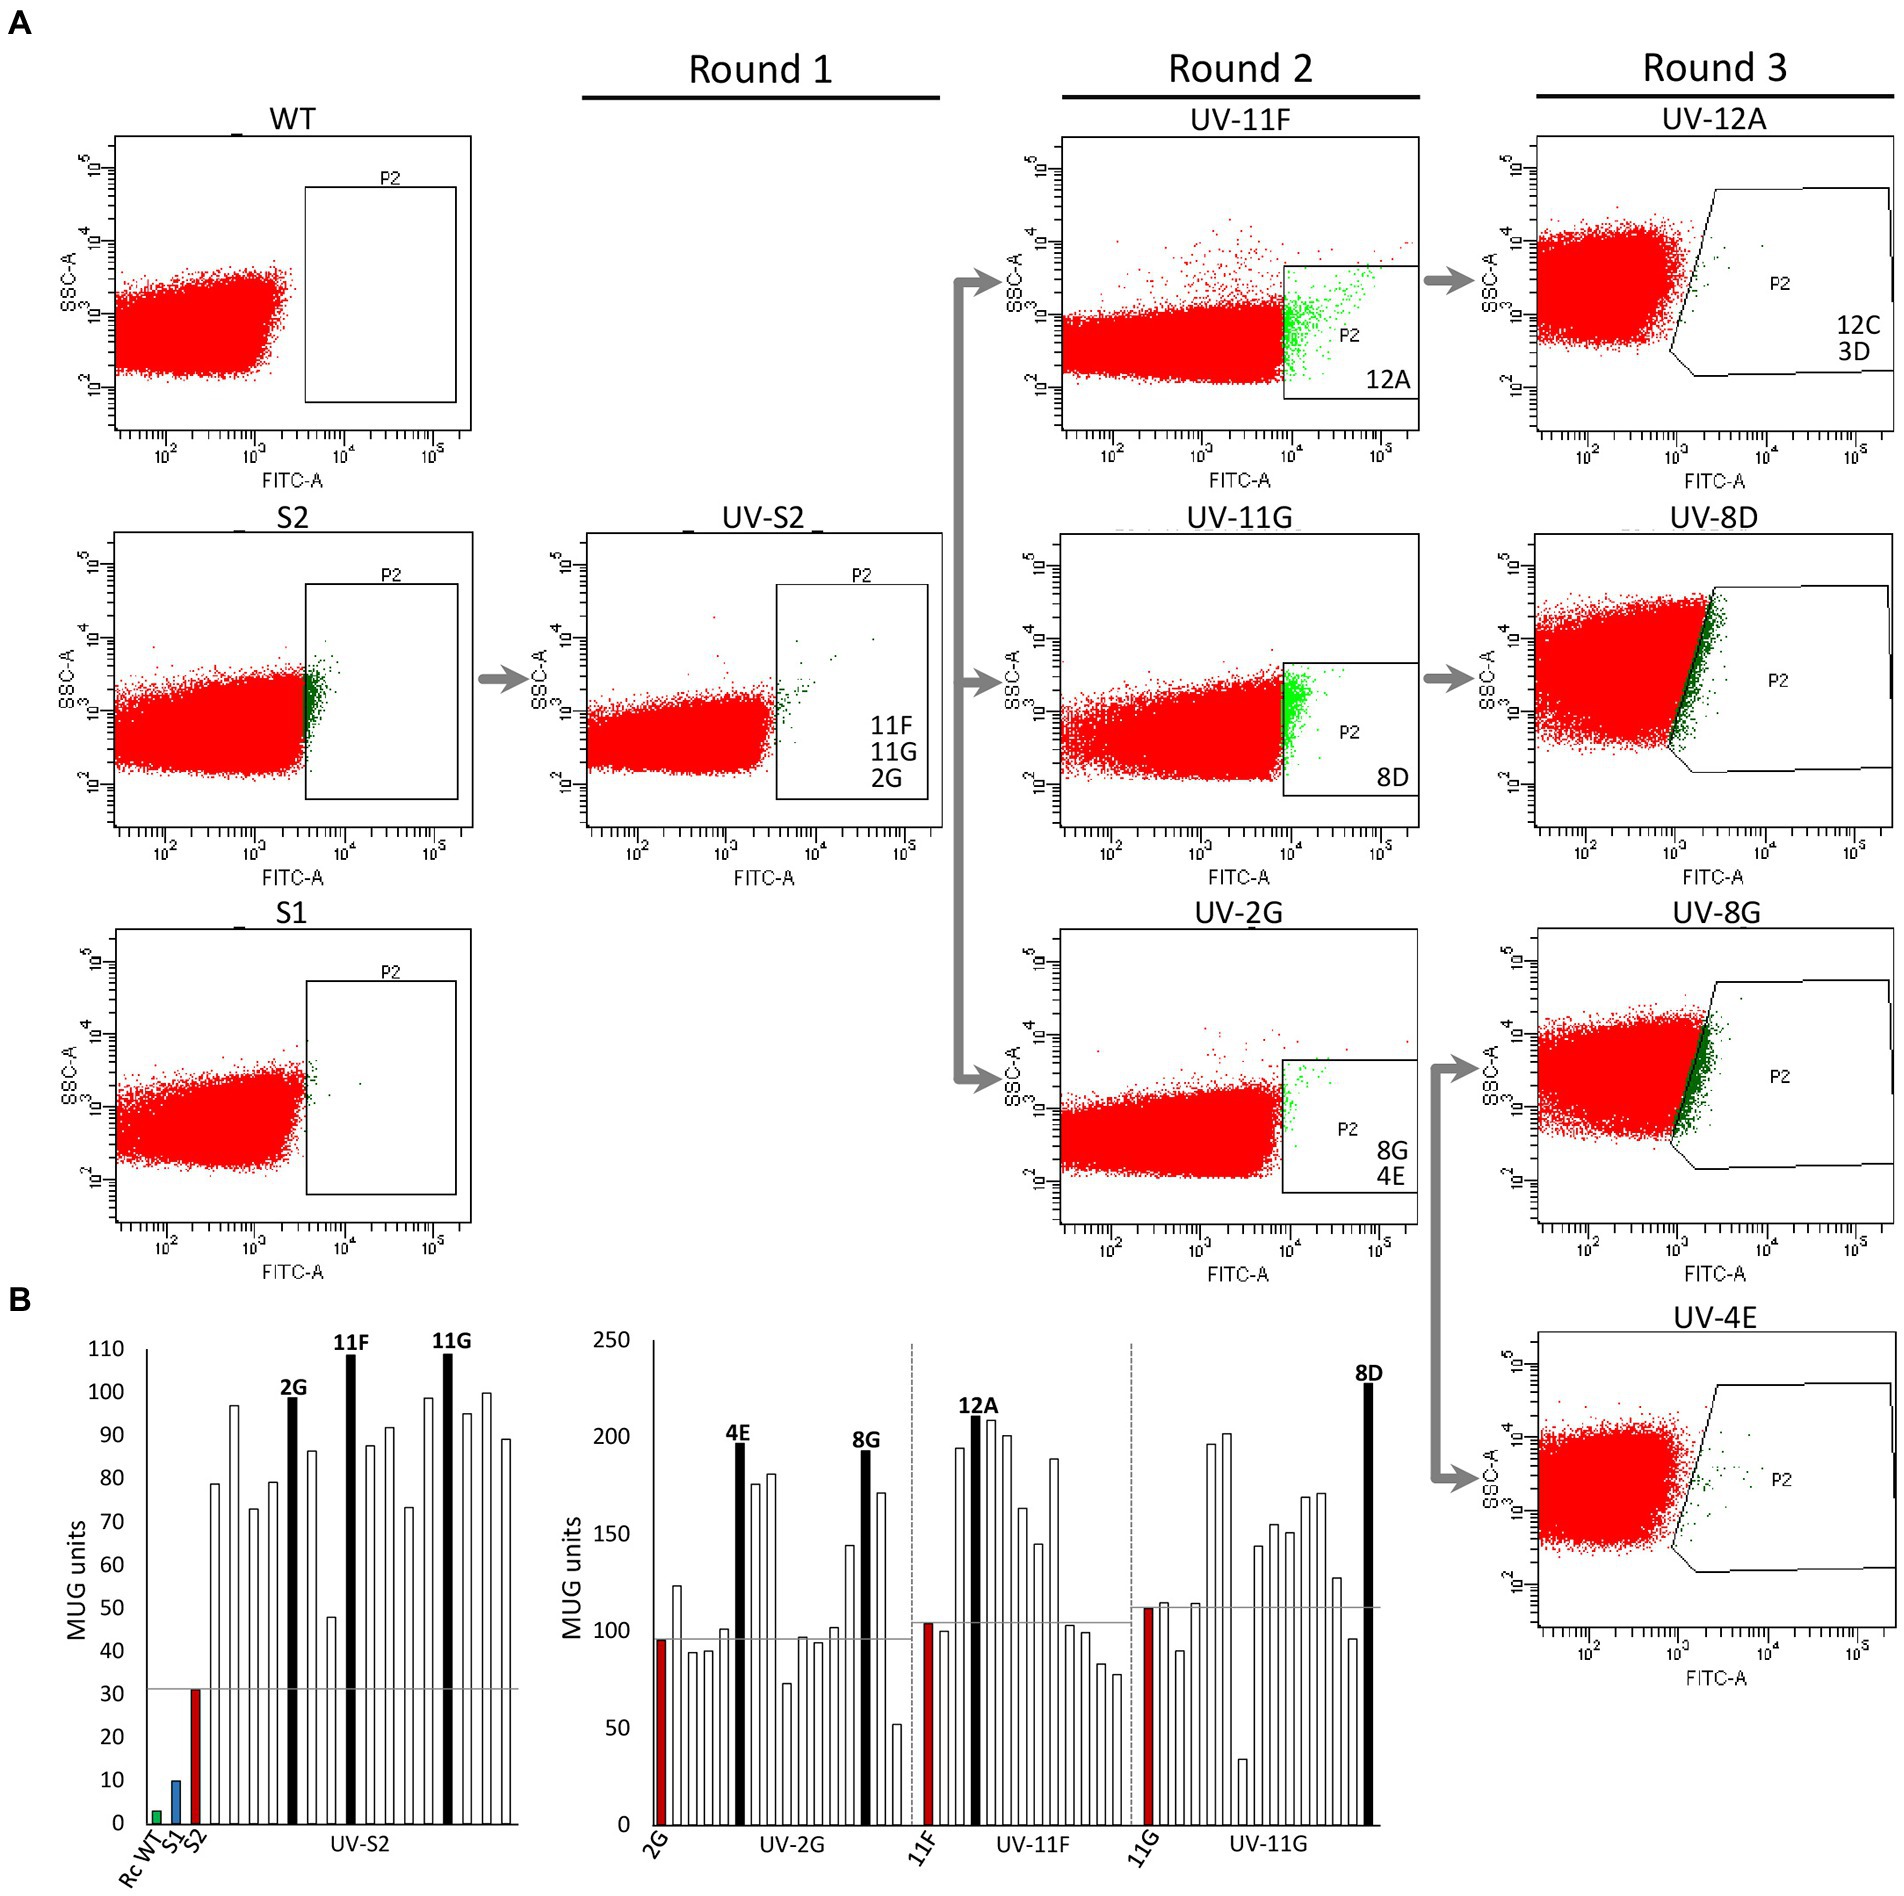
Figure 1. High-throughput selection of Rhodobacter capsulatus cells emitting fluorescence in response to H2. (A) Fluorescence activated cell sorting. Dot-plot showing side-scattered light (SSC) versus fluorescence generated by fluorescein isothiocyanate (FITC) in R. capsulatus populations of wild type, S1, S2, UV-S2 (pool of S2 cells after UV treatment), and derivative strains obtained by further rounds of UV mutagenesis. P2 indicates areas used for cell sorting into 96-well plates. Strains analyzed in depth in this study (e. g. 11F, 11G, and 2G) are shown in the P2 area from which they were isolated. (B) Examples of beta-galactosidase activity (MUG hydrolysis in 96-well plate format) of clones sorted by FACS. Left, UV-S2. Right, UV-2G, UV-11F, and UV-11G sorted populations. Green and blue bars show wild-type and S1 and S2 activities, respectively. Red bars show activities of strain subject to each mutagenic treatment. Black bars represent activities of clones selected for further rounds of mutagenesis.
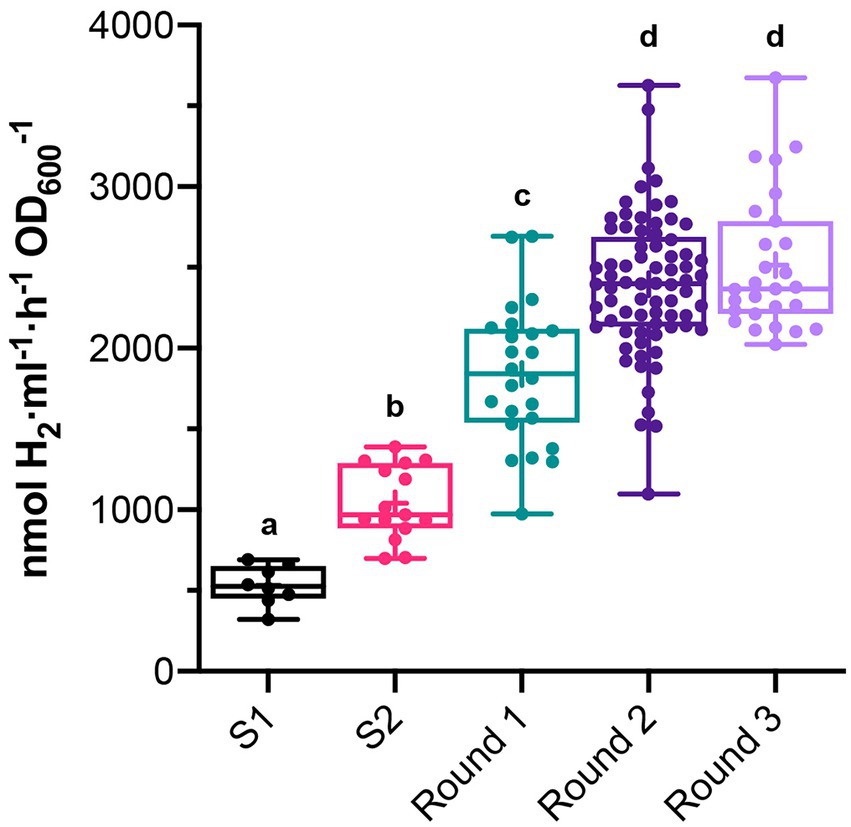
Figure 2. In vivo H2 production in batch cultures of clones that had high β-galactosidase activity in previous MUG assays. Measurements were taken after each round of UV mutagenesis. In vivo H2 production of S1 and S2 are shown as reference. Boxes show 25th to 75th percentiles, the median (line), and the mean (+). Whiskers show from minimum to maximum values. Each dot represents H2 production of a different clone. Different letters indicate statistically significant differences (p < 0.05 for S1 vs. S2, and p < 0.0001 for the rest of group comparisons).
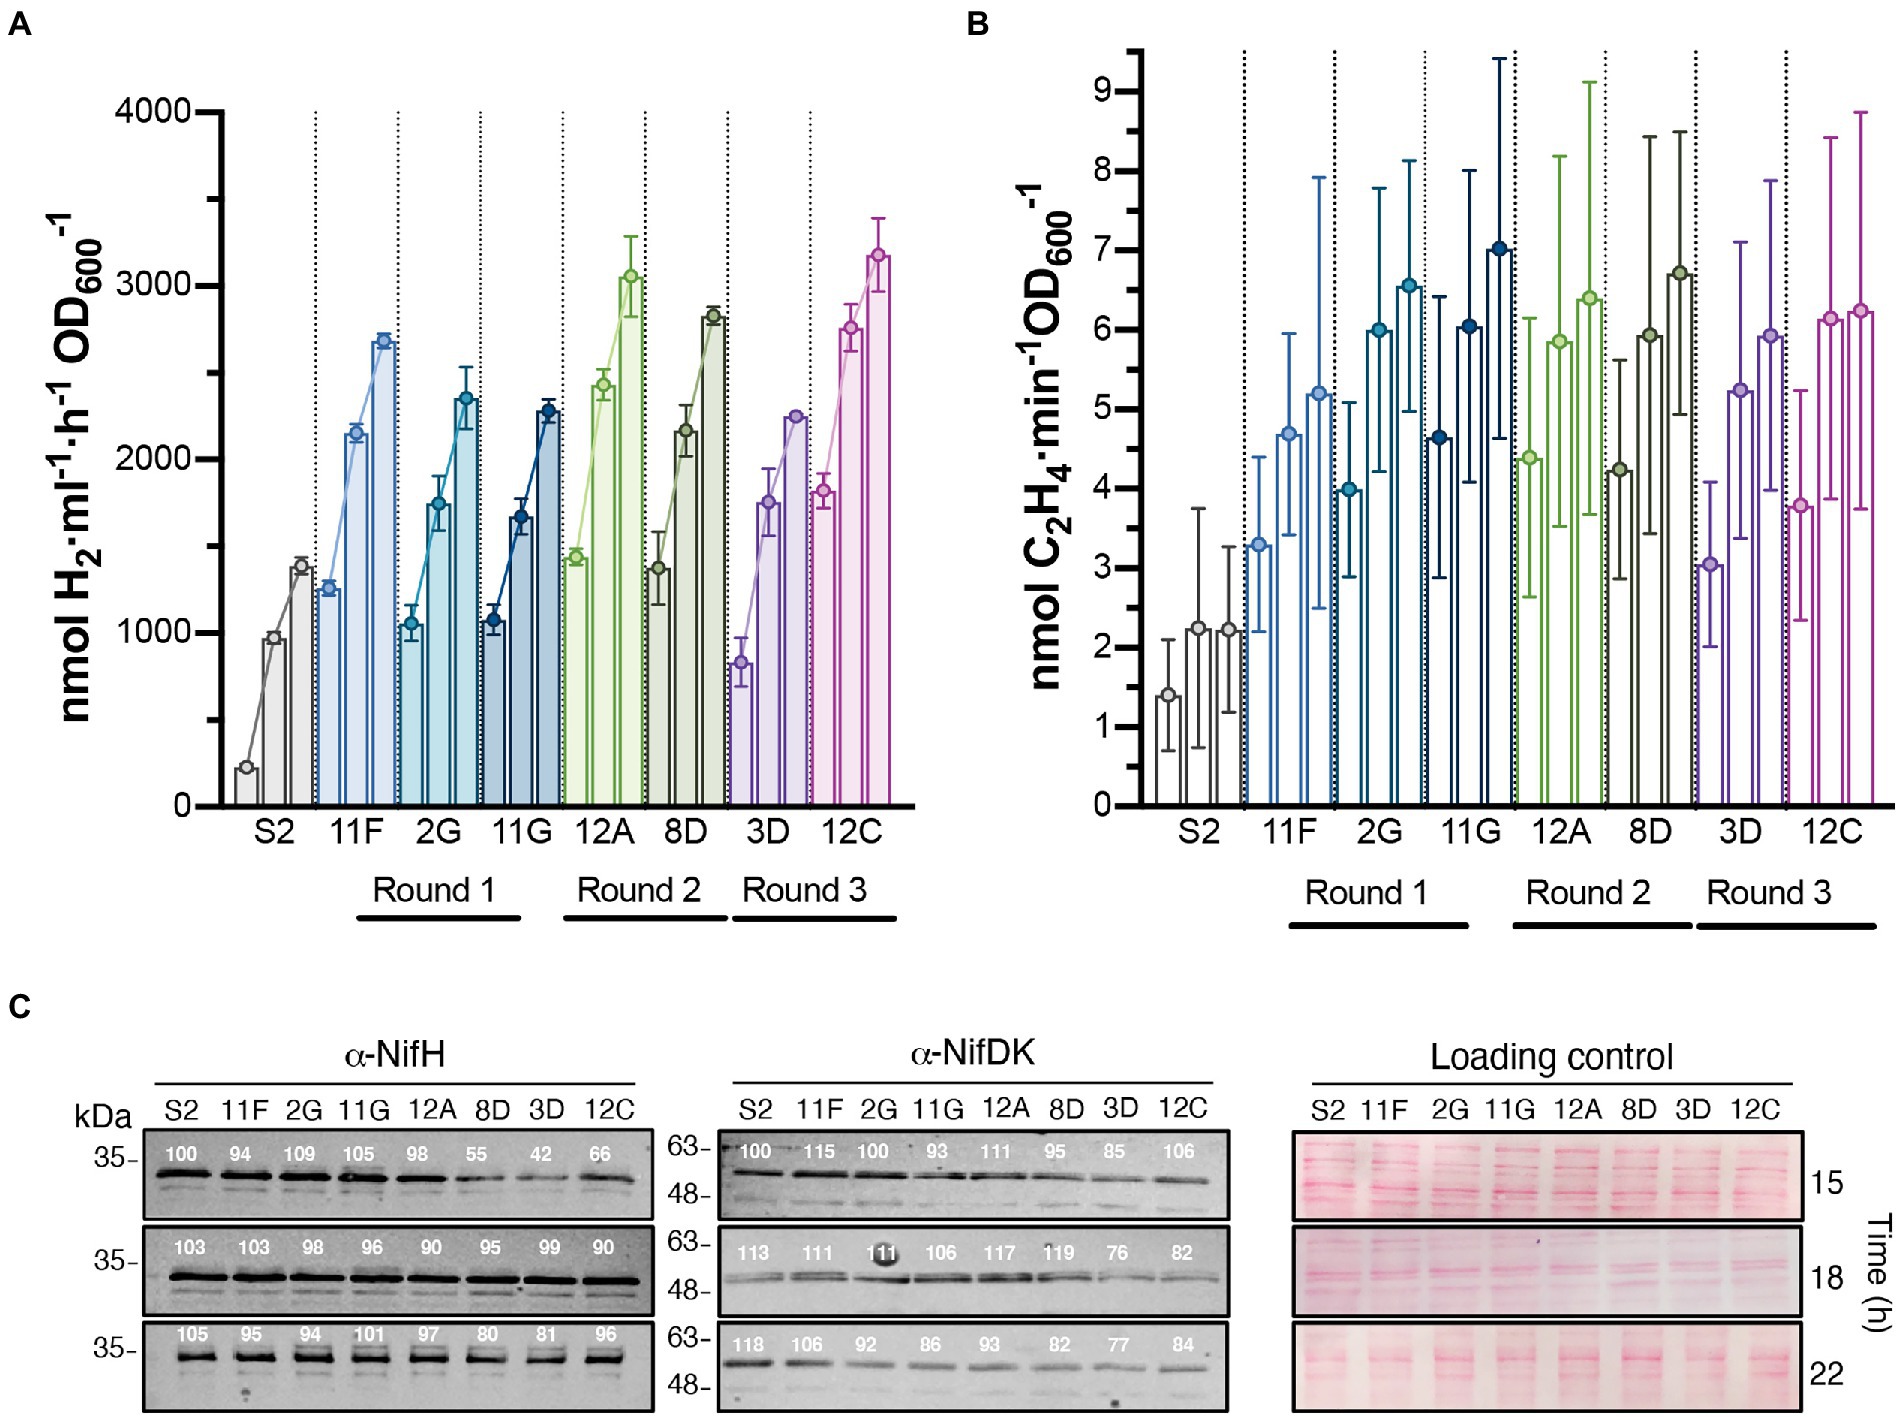
Figure 3. Time course of H2 production in batch cultures of selected strains isolated after each round of UV mutagenesis. In vivo H2 (A) and ethylene (B) production of S2 and the highest H2 overproducing variants. The three bars of each strain represent activities at 15, 18, and 22 h after the start of nitrogenase depression. Data represent the mean ± SD of biological replicates (n = 6 for H2, n = 4 for ethylene). Each biological replicate had 2 technical replicates. Statistically significant differences in H2 production between S2 and H2 overproducers existed at all measured times (p < 0.0001). Differences in ethylene production between S2 and H2 overproducers were statistically significant at 22 h (p < 0.05). (C) Immunoblot detection of nitrogenase NifH and NifDK components in cell-free soluble extracts from cultures shown in panel B. Normalized quantification of band intensity is indicated above each band. Ponceau staining of membranes is shown as loading control. Full uncropped gels are available as Supplementary Figure S5.
Additional rounds of mutagenesis and screening to further increase H2 production
2G, 11F, and 11G strains were separately subjected to a second round of UV mutagenesis and FACS screening. The percentage of cells in selective P2 areas of FACS was 0.027, 0.5, and 0.01%, for UV-11F, UV-11G, and UV-2G, respectively (Figure 1A). As in round 1, cultures presenting over twice the β-galactosidase activity of their parental strains were monitored for H2 production, and the highest H2 producers were selected (Figure 1B). Selected strains were used in subsequent rounds of UV mutagenesis and screening while statistically significant increases in H2 production rates were observed. Significant differences were observed between S1, S2, and mutants generated in mutagenic rounds 1 and round 2, but not between round 2 and round 3 mutants (Figure 2). Therefore, no further rounds of mutagenesis were performed after round 3. Supplementary Figure S1 shows the genealogy of R. capsulatus strains generated in this work.
The H2 production rates of selected strains subject to subsequent rounds of UV mutagenesis are shown in Figure 3A. H2 production rates of additional derivative strains can be found in Supplementary Figure S2. Rates were determined in time-course experiments after nitrogenase derepression, and statistically significant differences between S2 and derivative strains were observed at all investigated times. Strains 12A, 8D, and 12C stood out as the highest overproducers, with average production rates of 3,056, 2,830, and 3,180 nmol H2 ml−1 h−1 OD600−1, respectively (compared to average S2 production of 1,388 nmol H2 ml−1 h−1 OD600−1).
Mo-nitrogenase is the enzyme responsible for H2 production in R. capsulatus growing photoheterotrophically in the absence of fixed N and when the growth medium contains Mo. In vivo nitrogenase activity in S2 and derivative strains was estimated by the acetylene-to-ethylene reduction method. Ethylene production was lower in S2 than in the derivative strains at all analyzed times, although differences were only statistically significant 22 h after derepression (Figure 3B). Correlations between H2 and ethylene production activities were observed for all strains, indicating that H2 overproduction phenotypes were not due to changes in nitrogenase substrate specificity (i. e. preference of H+ over acetylene), as reported previously for nifH mutant experiments (Barahona et al., 2016). On the contrary, nitrogenase activities did not correlate with the accumulation of the NifH and NifDK components of Mo-nitrogenase, as S2 accumulated more Nif polypeptides than most of its derivative strains (Figure 3C). 8D, 3D, and 12C had slightly altered NifH and NifDK accumulation profiles compared to the other strains.
Improving H2 production under continuous culture conditions with intermittent gas exchange
After maximum accumulation of nitrogenase polypeptides occurred, the rates of H2 production decelerated over time in all strains and, finally, decreased between 38 and 39 h (Supplementary Figure S3). Consistently, acetylene reduction activities were lower at 39 h than at 22 h after nitrogenase derepression (data not shown). The slight decrease of NifH and NifDK accumulation over time (Figure 3C) cannot entirely account for the magnitude of this effect, and therefore, additional factors must be involved. One possibility is the limitation of electrons and ATP supply to nitrogenase. However, because aerobic non-diazotrophic growth also stopped at similar culture OD (Supplementary Figure S4), it appears that the observed decrease was caused by more general, physiological causes. Typically, substrate limitation or waste accumulation are responsible for batch cultures entering the stationary growth phase. Therefore, continuous culture experiments were undertaken.
Continuous culture conditions were established that maintained culture density at OD600 = 1.6 (Figure 4A), and H2 production by S2, 8D, and 12C strains was determined during 63-h experiments (Figures 4B,C). Periodic atmosphere changes to replenish N2 and to remove accumulated H2 were also implemented. Figure 4B shows that all accumulated H2 disappeared after atmosphere regeneration at 17 and 40 h. H2 production rates increased during the experiment and were always higher in 12C and 8D than S2 (Figure 4). At 63 h, strains 12C and 8D produced 63 ± 1 μmol H2 h−1 ml−1 OD600−1 and 52 ± 2 μmol H2 h−1 ml−1 OD600−1, respectively, compared to 12 ± 1 μmol H2 h−1 ml−1 OD600−1 in the S2 strain. Comparison with their maximum H2 production rates in batch cultures (ca. 1–3 μmol H2 h−1 ml−1 OD600−1, see Figure 3A) indicated that continuous culture conditions effectively removed some limitations to H2 production. The total volume of H2 produced in 63 h by strains 8D and 12C was 4 and 5 l H2 per L of culture, respectively (Figure 4C).
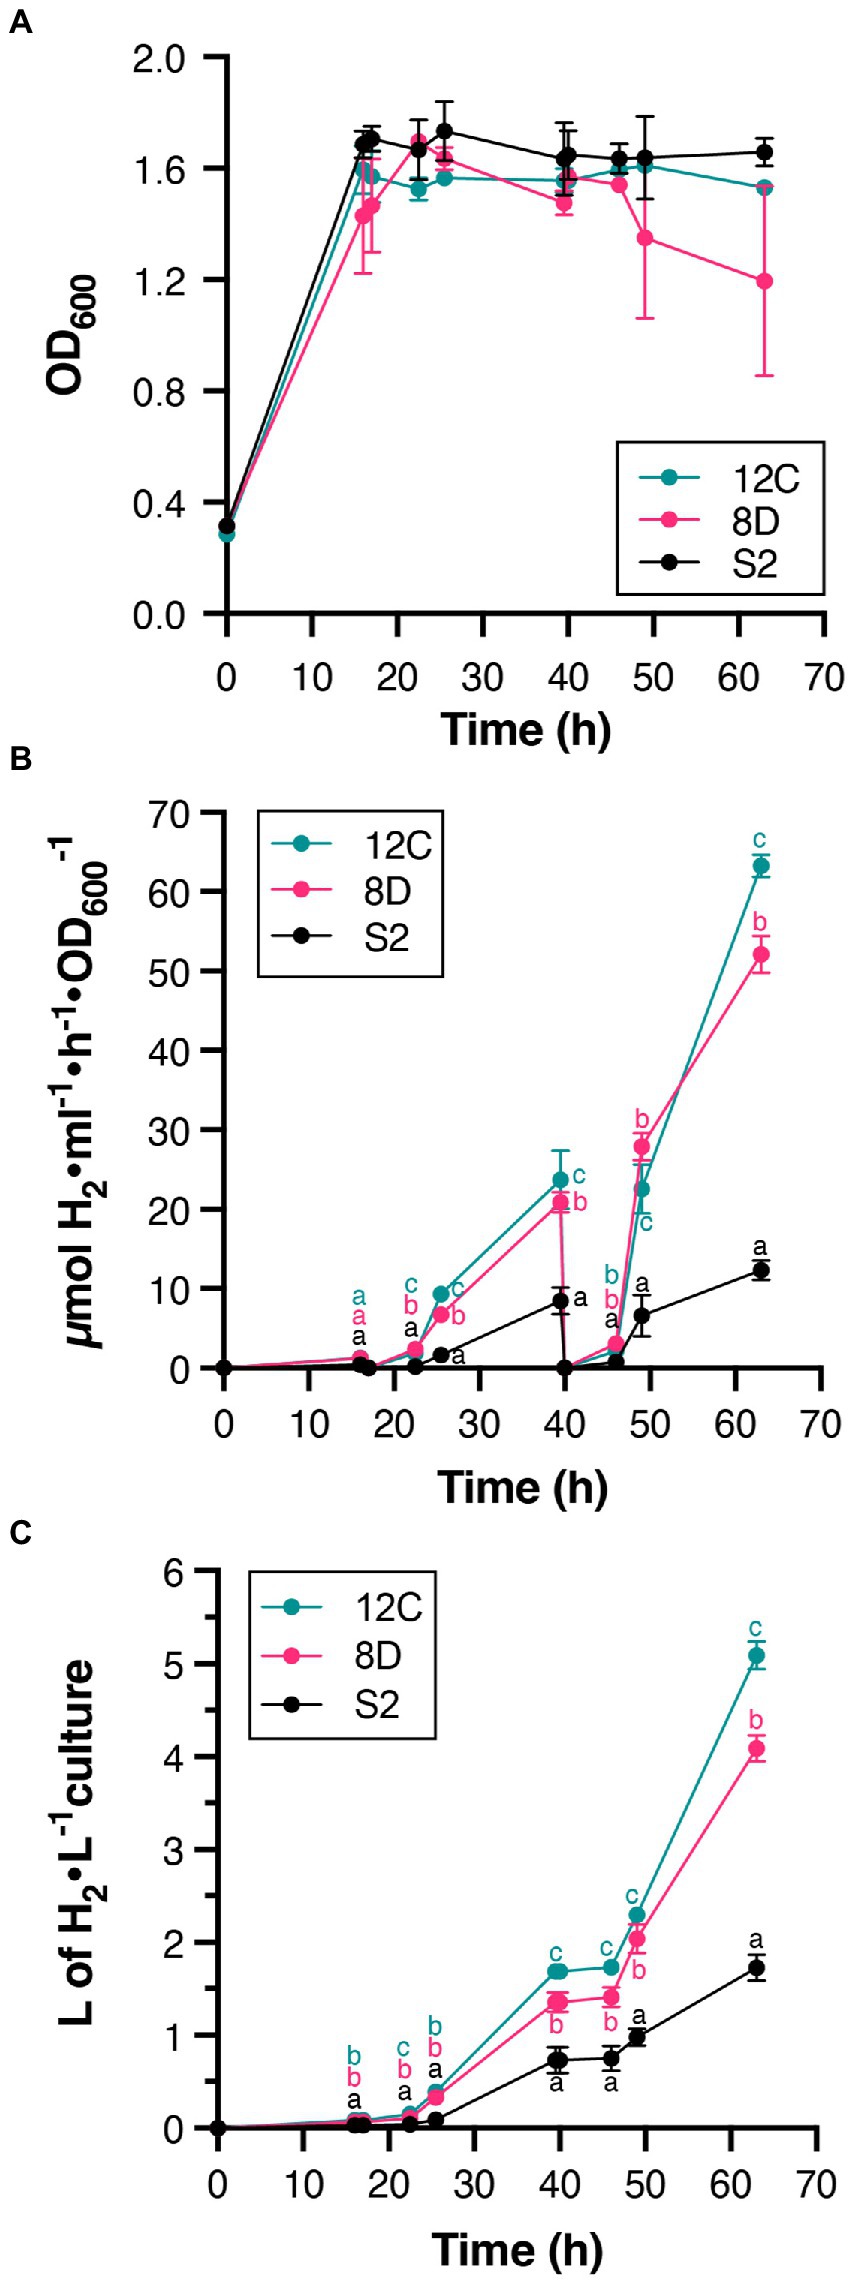
Figure 4. H2 production in continuous cultures of S2, 8D, and 12C strains. (A) Stability of culture OD during the experiment. Continuous culture conditions were established once the OD600 reached 1.6. (B) Time course of in vivo H2 accumulation. Note the disappearance of accumulated H2 at times 17 and 40 h due to complete regeneration of the gas phase. (C). The total amount of H2 produced. Statistically significant differences in H2 production between S2 and H2 overproducers existed at all measured times. Different letters (a, b, or c) indicate statistically significant differences (p < 0.05). In all panels, data represent the mean ± SD of biological replicates (n = 4 for S2, n = 2 for 8D and 12C) with two technical replicates each.
Identification of mutations in Rhodobacter capsulatus H2 overproducing strains
Mutations present in 11F, 12A, 12C, 3D, and 8D strains were identified by whole genome sequencing (Illumina MiSeq, PE 2 × 300 bp, 100 × coverage) and mapped to the R. capsulatus S2 chromosomal DNA sequence. Due to the large number of differences in the DNA sequences of the mutants and S2, only SNVs that were present in more than 65% of the mutant reads, and that were also present in subsequent strain derivatives, were considered. These stringent criteria represent a conservative approach. Therefore, the chosen mutations might not encompass all possible changes but rather represent the minimum relevant changes caused by UV that, altogether, affect H2 production phenotype. Mutations identified in the selected H2 overproducing strains are listed in Table 1 and Supplementary Table S2. SNVs were identified that resulted in amino acid changes within functional gene sequences or changes in promoters and terminator regions. Point mutations leading to nucleotide deletions that create frameshifts were also observed. A total of 35 genomic changes, uniformly and randomly distributed across the genome, were identified among strains (Supplementary Table S2). These changes included two deletions and 31 SNVs, 21 of which resulted in amino acid changes. In seven cases, two mutations were localized very close in the same ORFs. As expected, parental variations were maintained in second- and third-round mutants (except for eda mutation in 11F).
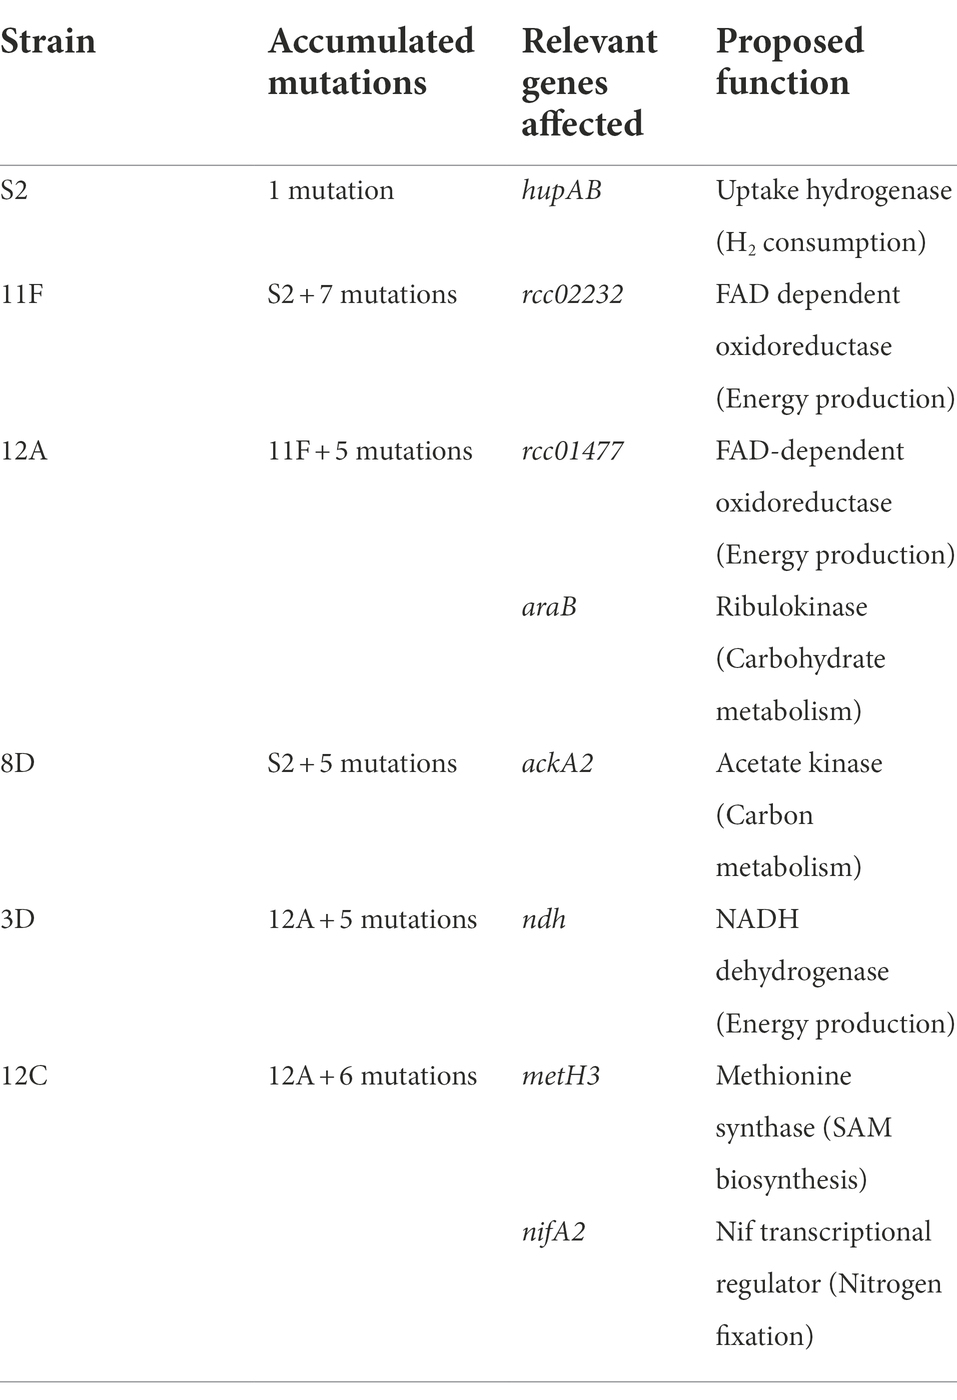
Table 1. Mutations accumulated in Rhodobacter capsulatus H2 overproducing strains.
Table 1 lists mutations in genes that could be relevant to H2-overproducing phenotypes. Deletion of structural uptake hydrogenase genes (hupAB) was confirmed in S2 and all derivatives were sequenced in this study. Obviously, the absence of HupAB prevented consumption of H2 produced by nitrogenase. 8D had a mutation in ackA2, encoding acetate kinase, which possibly affects carbon metabolism. 11F had a mutation in rcc02232, a gene linked to a nitrogen fixation gene cluster that encodes a FAD-dependent oxidoreductase, and possibly affects electron donation to nitrogenase. Importantly, this mutation was carried over to 12A, 12C, and 3D derivative strains. 12A had additional mutations in rcc01477 (encoding another FAD-dependent oxidoreductase) and araB (encoding a ribulokinase involved in arabinose catabolism), with implications in carbohydrate metabolism and electron transfer. In addition to mutations carried over from 11F and 12A, 3D has a mutation in a ndh gene encoding a subunit of an NADH dehydrogenase, and thus involved in energy production. Most importantly, strain 12C has mutations in metH3, encoding a methionine synthase necessary for S-adenosylmethionine (SAM) biosynthesis, and in nifA2, a second, initially redundant, nif-specific transcriptional regulator located in nif cluster B (Demtröder et al., 2019). SAM is required for the biosynthesis of the iron-molybdenum cofactor of nitrogenase by NifB (Curatti et al., 2006). Notably, NifH and NifDK accumulation in 12C was not much lower than in the other analyzed strains (Figure 3C).
Discussion
Biohydrogen generation by photosynthetic bacteria, such as PNSB, exhibits low productivity making them unsuitable to generate H2 for large-scale applications (Chandrasekhar et al., 2015). However, their production has been insufficiently explored, being underdeveloped, and remains a promising renewable source of H2 considering the energy input (sunlight) and purity of product output (Gupta et al., 2013; Chandrasekhar et al., 2015; Jiménez-Llanos et al., 2020; Chai et al., 2021). Several strategies to enhance photo-fermentative biohydrogen production have been described, such as immobilization of bacteria for continuous H2 production (Fiβler et al., 1995; Elkahlout et al., 2019), modification of carbon substrates, nitrogen source, and micronutrients contained in the H2 production medium (Liu et al., 2009; Laocharoen and Reungsang, 2014; Chen et al., 2017), and genetic modifications (Barahona et al., 2016; Feng et al., 2018b; Ma et al., 2021), among others.
Previously, we were able to increase H2 production by R. capsulatus 10-fold through the development of a biotechnological tool for the detection of H2-overproducing mutants expressing randomly generated nitrogenase variants (Barahona et al., 2016). The tool was based on the sensing hydrogenase of R. capsulatus and produced a fluorescent signal proportional to the amount of H2 produced by each variant. Here, we have used it for genome-wide screening of mutations leading to enhanced H2 production, thus expanding the impact of this tool.
This work focuses on methodology for non-designed enhancement of H2 production activity through the detection of rare overproducers within a very large population of cells. One outcome from this work is that this method did not accumulate mutations on nitrogenase or hydrogenase genes, which would be obvious targets for a designed mutant strategy. It appears that a panoply of mutations, probably resulting in small production increments, underly the H2 overproducing phenotype. As a result, the proposed methodology does not allow to unequivocally assign specific genotypes as responsible for the observed H2 overproducing phenotype, and the putative contribution of each one of the identified mutations towards this phenotype will require further experimentation.
To identify genes and pathways involved in H2 metabolism, we performed random DNA mutagenesis of R. capsulatus S2 using UV mutagenesis. Random mutagenesis of bacteria and algae using both physical (UV) and chemical (e.g. ethyl methane sulfonate) mutagens has been used extensively to improve microorganism activities useful at industrial scale (Joshi et al., 2013; Lee et al., 2014; Perin et al., 2015). UV radiation (250–290 nm) induces either formation of thymine dimers that cause transition of G and C to adenine A and thymine T and/or deletion of A–T base pairs in the DNA. R. capsulatus has an efficient photoreactivation system that repairs DNA damage induced by UV (Barbe et al., 1987). Thus, in this work, UV mutagenesis was performed in absence of visible light. Point mutations in R. capsulatus regulatory sequences and other key genes could result in enhanced H2 production. The possibility of mutation bias resulting from the UV treatment cannot be ruled out as no other chemical random mutagenesis was performed in parallel. The survivors of mutagenic treatment were screened in groups of 5 × 10⁵ CFU. About 0.01 to 1% of them exhibited enhanced fluorescence compared to the population average and the parental strain. The effectiveness of FACS high-throughput screening was confirmed by secondary β-galactosidase and H2 production activities.
The greatest differences in H2 production were observed at 22 h, where all selected strains produced higher levels than S2. The highest H2-overproducing strains were subject to subsequent rounds of UV mutagenesis and FACS to continue improving H2 production. Thus, accumulation of mutations after each round could be closely linked to the enhancement of H2 production. Differences in H2 production rates were lower at 39 than 22 h, probably due to depletion of nutrients in batch cultures, as previously reported (Bianchi et al., 2010; Boran et al., 2010; Feng et al., 2018a). Overall, H2 production was enhanced 6-fold by deleting the hupAB genes (uptake hydrogenase) and by performing random mutagenesis. In addition, continuous cultures of selected mutant strains were shown to produce 19-fold more H2 than the corresponding batch cultures.
Nitrogenase variants greatly enhancing H2 production have been previously obtained. The most active H2 producers lost the ability to reduce acetylene into ethylene (Barahona et al., 2016; Zheng and Harwood, 2019). In contrast to the nitrogenase-focused approach, all variants analyzed by genome-wide screening exhibited higher acetylene reduction activities than the S2 parental strain, although nitrogenase structural proteins, NifH and NifDK, were expressed at similar levels. This observation suggests that changes selected in the genome of variants do not affect nitrogenase substrate specificity and could be altering either (i) other nitrogenase-related proteins, or proteins that are involved in nitrogen fixation-related pathways, or (ii) regulatory regions or factors. One aspect not investigated here was the possible contribution of the Fe-only nitrogenase to the H2 overproduction phenotype. A comparative characterization of H2 production by Mo- and Fe-only nitrogenases in a hupB− mutant of R. capsulatus indicated higher production from the Fe-only nitrogenase operating under N2 atmosphere (Krahn et al., 1996). However, in our experiments, the Fe-only nitrogenase is repressed because the culture medium contains molybdate. Thus, mutations derepressing its expression in presence of molybdate would be required.
Regarding regulatory mutations, it is noteworthy that round 2 mutant 12C, one of the strongest H2 overproducers, contains a mutation in nifA2. R. capsulatus contains two copies of the nifA transcriptional activator gene, nifA1 and nifA2, and their gene products equally activate both nif and anf promoters (Demtröder et al., 2019). However, the regulation of nifA2 differs from that of nifA1 in that it is subject not only to NtrC nitrogen control, but also to the general, redox-responding RegAB regulatory system (Elsen et al., 2000).
Regarding mutations in nitrogenase-related functions or pathways, none of the mutations accumulated in selected H2 overproducers targeted well-characterized functions related to nitrogen fixation. However, some of them affect genes with proposed functions that could be relevant to nitrogen fixation. Strain 11F –and hence 12A and its derivatives– contained a mutation in rcc02232, a proposed FAD oxidoreductase, while 12A and its derivatives accumulated an additional mutation in rcc01477, another proposed FAD oxidoreductase. FAD-dependent oxidoreductases play a role in energy-generating systems and here they may be part of an ancillary system, unknown until now, that can feed reducing power or ATP to the nitrogenase system. This possibility is further substantiated by the presence of a ndh mutation in 3D, 12A-derived strain. Although many NADH oxidases have been linked to oxidative stress control, regeneration of NAD+ is also critical for cellular energy generation.
Another set of selected mutations is that of C metabolism-related functions. In strain 12A and derivatives, a mutation in araB, a ribulokinase, was selected, while strain 8D showed a mutation in ackA2, an acetate kinase. Gene ackA2 has been implicated in a 1,2-propanediol degradation pathway that is overexpressed in mutants in the RegAB general redox regulatory system (Schindel and Bauer, 2016). AraB, on the other hand, catalyzes the conversion of ribulose to ribulose-5-phosphate (Agarwal et al., 2012). Ribulose-5-phosphate, besides constituting an energy vector, can feed into the pentose phosphate pathway. It has been reported that polysaccharide production substantially increases in R. capsulatus mutants lacking nitrogenase activity (Klein et al., 1991). This suggests that nitrogen fixation and polysaccharide production pathways may be competing for metabolites or reducing power. Were this the case, it is possible that a mutation in araB could result in higher energy availability to nitrogenase, thus explaining its higher H2 production.
Finally, one of the mutations in the overproducing strain 12C is located within the metH3 gene that codes for a methionine synthase. Methionine is a precursor of S-adenosyl-methionine (SAM), and SAM is required for NifB activity in the synthesis of the NifB-co cofactor, a precursor to the nitrogenase catalytic cofactor, FeMo-co (Buren et al., 2020). However, in the absence of data regarding alteration of SAM levels in strain 12C, the effect of this mutation is difficult to rationalize. This gene could simply be involved in the relative availability of sulfur that might affect the relative NH3 vs. H2 produced. Or its mutation might alter the relative expression of Mo– vs. Fe– only nitrogenase affecting H2 produced.
At present it is difficult to rationalize the role of the above mutations that result in a nitrogenase able to efficiently evolve H2 while not being affected in its ability to reduce N2, within a specific framework. Further investigation of the phenotypes of these mutations will probably clarify some of the complex metabolic interactions that the proposed functions of the genes implicated suggest. This will probably unearth subtle redox and energy interactions in the nitrogen fixation process that have so far escaped detection but that are, nonetheless, important to determine the fate of electrons through nitrogenase. In this respect, it is important to keep in mind that alterations in the electron flux through nitrogenase can alter its preference for different substrates (e. g. protons or N2). Purified nitrogenase allocates 25% of the electrons fed to it to proton reduction (Simpson and Burris, 1984), and this has been mechanistically explained (Seefeldt et al., 2020). However, in vivo, higher ratios of proton reduction have been observed, especially in symbiotic systems under stressful conditions for the legume symbiont (Schubert and Evans, 1976), an observation that is also commonly explained by the complexities of the nitrogenase catalytic mechanism: given that nitrogenase needs to store six electrons for the stepwise reduction of N2 to NH3, it is expected that when the electron flux is suboptimal, electrons can leak out to protons and be lost as H2. Hence, any mutations that negatively affect the efficiency of the flux of electrons through nitrogenase would probably result in a higher proportion of electrons allocated to protons, and thus a higher production of H2. The selected mutations would fit within this category.
It is surprising that no nitrogenase mutations were identified in this screening. Future developments should include combining mutations identified in (Barahona et al., 2016) and this study, as well as exploiting the Fe-only nitrogenase activity by deregulating it or by changing culture conditions to express it.
Data availability statement
The datasets presented in this study can be found in online repositories. The names of the repository/repositories and accession number(s) can be found at: GenBank BioProject PRJNA859503.
Author contributions
LR initiated and directed this research. EB, EI, LS-H, and IÁ-M performed molecular biology. EB performed cellular biology, flow cytometry, and biochemical assays. EJ-V contributed biochemical assays. JB and EB performed fermentations. EB and JI performed mutant sequence analysis. EB and LR performed the experimental design and data analysis. EB, JI, and LR wrote the manuscript. All authors contributed to the article and approved the submitted version.
Funding
European Research Council starting grant 205442 funded the generation of hydrogen sensor strains. Fundación Iberdrola “Ayudas a la Investigación en Energía y Medio Ambiente 2018” funded DNA sequencing Universidad Politécnica de Madrid grant RP160050022 funded the rest of the work. EI and LS-H are recipient of Becas de Colaboración del Ministerio de Educación y Formación Profesional in the years 2018/19 and 2019/20, respectively.
Acknowledgments
We thank Laura Molero Martín for help with flow cytometry.
Conflict of interest
The authors declare that the research was conducted in the absence of any commercial or financial relationships that could be construed as a potential conflict of interest.
Publisher’s note
All claims expressed in this article are solely those of the authors and do not necessarily represent those of their affiliated organizations, or those of the publisher, the editors and the reviewers. Any product that may be evaluated in this article, or claim that may be made by its manufacturer, is not guaranteed or endorsed by the publisher.
Supplementary material
The Supplementary material for this article can be found online at: https://www.frontiersin.org/articles/10.3389/fmicb.2022.991123/full#supplementary-material
References
Agarwal, R., Burley, S. K., and Swaminathan, S. (2012). Structural insight into mechanism and diverse substrate selection strategy of L-ribulokinase. Proteins 80, 261–268. doi: 10.1002/prot.23202
Bandyopadhyay, A., Stockel, J., Min, H., Sherman, L. A., and Pakrasi, H. B. (2010). High rates of photobiological H2 production by a cyanobacterium under aerobic conditions. Nat. Commun. 1:139. doi: 10.1038/ncomms1139
Barahona, E., Jimenez-Vicente, E., and Rubio, L. M. (2016). Hydrogen overproducing nitrogenases obtained by random mutagenesis and high-throughput screening. Sci. Rep. 6:38291. doi: 10.1038/srep38291
Barbe, J., Gibert, I., Llagostera, M., and Guerrero, R. (1987). DNA repair systems in the phototrophic bacterium Rhodobacter capsulatus. J. Gen. Microbiol. 133, 961–966. doi: 10.1099/00221287-133-4-961
Bianchi, L., Mannelli, F., Viti, C., Adessi, A., and De Philippis, R. (2010). Hydrogen-producing purple non-sulfur bacteria isolated from the trophic lake Averno (Naples, Italy). Int. J. Hydrog. Energy 35, 12216–12223. doi: 10.1016/j.ijhydene.2010.08.038
Boran, E., Özgür, E., van der Burg, J., Yücel, M., Gündüz, U., and Eroglu, I. (2010). Biological hydrogen production by Rhodobacter capsulatus in solar tubular photo bioreactor. J. Clean. Prod. 18, S29–S35. doi: 10.1016/j.jclepro.2010.03.018
Bulen, W. A., and LeComte, J. R. (1966). The nitrogenase system from Azotobacter: two-enzyme requirement for N2 reduction, ATP-dependent H2 evolution, and ATP hydrolysis. Proc. Natl. Acad. Sci. U. S. A. 56, 979–986. doi: 10.1073/pnas.56.3.979
Buren, S., Jimenez-Vicente, E., Echavarri-Erasun, C., and Rubio, L. M. (2020). Biosynthesis of nitrogenase cofactors. Chem. Rev. 120, 4921–4968. doi: 10.1021/acs.chemrev.9b00489
Chai, Y. H., Mohamed, M., Cheng, Y. W., Chin, B. L. F., Yiin, C. L., Yusup, S., et al. (2021). A Review on Potential of Biohydrogen Generation through Waste Decomposition Technologies. Biomass Conv. Bioref. 2, 1–26. doi: 10.1007/s13399-021-01333-z
Chandrasekhar, K., Lee, Y. J., and Lee, D. W. (2015). Biohydrogen production: strategies to improve process efficiency through microbial routes. Int. J. Mol. Sci. 16, 8266–8293. doi: 10.3390/ijms16048266
Chen, X., Lv, Y., Liu, Y., Ren, R., and Zhao, J. (2017). The hydrogen production characteristics of mixed photoheterotrophic culture. Int. J. Hydrog. Energy 42, 4840–4847. doi: 10.1016/j.ijhydene.2016.11.155
Colbeau, A., Richaud, P., Toussaint, B., Caballero, F. J., Elster, C., Delphin, C., et al. (1993). Organization of the genes necessary for hydrogenase expression in Rhodobacter capsulatus. Sequence analysis and identification of two hyp regulatory mutants. Mol. Microbiol. 8, 15–29. doi: 10.1111/j.1365-2958.1993.tb01199.x
Curatti, L., Ludden, P. W., and Rubio, L. M. (2006). NifB-dependent in vitro synthesis of the iron-molybdenum cofactor of nitrogenase. Proc. Natl. Acad. Sci. U. S. A. 103, 5297–5301. doi: 10.1073/pnas.0601115103
Demtröder, L., Pfänder, Y., Schäkermann, S., Bandow, J. E., and Masepohl, B. (2019). Nif A is the master regulator of both nitrogenase systems in Rhodobacter capsulatus. Microbiology 8:e921. doi: 10.1002/mbo3.921
Elkahlout, K. E., Sagir, E., Alipour, S., Koku, H., Gunduz, U., Eroglu, I., et al. (2019). Long-term stable hydrogen production from acetate using immobilized Rhodobacter capsulatus in a panel photobioreactor. Int. J. Hydrog. Energy 44, 18801–18810. doi: 10.1016/j.ijhydene.2018.10.133
Elsen, S., Dischert, W., Colbeau, A., and Bauer, C. E. (2000). Expression of uptake hydrogenase and molybdenum nitrogenase in Rhodobacter capsulatus is coregulated by the RegB-RegA two-component regulatory system. J. Bacteriol. 182, 2831–2837. doi: 10.1128/JB.182.10.2831-2837.2000
Feng, J., Yang, H., and Guo, L. (2018a). The photosynthetic hydrogen production performance of a newly isolated Rhodobacter capsulatus JL1 with various carbon sources. Int. J. Hydrog. Energy 43, 13860–13868. doi: 10.1016/j.ijhydene.2018.03.144
Feng, J., Yang, H., Wang, X., and Guo, L. (2018b). Enhanced hydrogen production performance of cbbR & pycA inactived R. sphaeroides mutant by improving the ammonium tolerance. Int. J. Hydrog. Energy 43, 18142–18150. doi: 10.1016/j.ijhydene.2018.07.196
Fiβler, J., Kohring, G. W., and Giffhorn, F. (1995). Enhanced hydrogen production from aromatic acids by immobilized cells of Rhodopseudomonas palustris. Appl. Microbiol. Biotechnol. 44, 43–46. doi: 10.1007/BF00164478
Gupta, S. K., Kumari, S., Reddy, K., and Bux, F. (2013). Trends in biohydrogen production: major challenges and state-of-the-art developments. Environ. Technol. 34, 1653–1670. doi: 10.1080/09593330.2013.822022
Jahn, A., Keuntje, B., Dörffler, M., Klipp, W., and Oelze, J. (1994). Optimizing photoheterotrophic H2 production by Rhodobacter capsulatus upon interposon mutagenesis in the hupL gene. Appl. Microbiol. Biotechnol. 40, 687–690. doi: 10.1007/BF00173330
Jiménez-Llanos, J., Ramírez-Carmona, M., Rendón-Castrillón, L., and Ocampo-López, C. (2020). Sustainable biohydrogen production by chlorella sp. microalgae: a review. Int. J. Hydrog. Energy 45, 8310–8328. doi: 10.1016/j.ijhydene.2020.01.059
Joshi, S. M., Inamdar, S. A., Jadhav, J. P., and Govindwar, S. P. (2013). Random UV mutagenesis approach for enhanced biodegradation of sulfonated azo dye, green HE4B. Appl. Biochem. Biotechnol. 169, 1467–1481. doi: 10.1007/s12010-012-0062-5
Kim, E.-J., Lee, M.-K., Kim, M.-S., and Lee, J. K. (2008). Molecular hydrogen production by nitrogenase of Rhodobacter sphaeroides and by Fe-only hydrogenase of Rhodospirillum rubrum. Int. J. Hydrog. Energy 33, 1516–1521. doi: 10.1016/j.ijhydene.2007.09.044
Klein, G., Klipp, W., Jahn, A., Steinborn, B., and Oelze, J. (1991). The relationship of biomass, polysaccharide and H2 formation in the wild-type and nifA/nifB mutants of Rhodobacter capsulatus. Arch. Microbiol. 155, 477–482. doi: 10.1007/Bf00244965
Krahn, E., Schneider, K., and Muller, A. (1996). Comparative characterization of H2 production by the conventional Mo nitrogenase and the alternative “iron only” nitrogenase of Rhodobacter capsulatus hup− mutants. Appl. Microbiol. Biot. 46, 285–290. doi: 10.1007/s002530050818
Laocharoen, S., and Reungsang, A. (2014). Isolation, characterization and optimization of photo-hydrogen production conditions by newly isolated Rhodobacter sphaeroides KKU-PS5. Int. J. Hydrog. Energy 39, 10870–10882. doi: 10.1016/j.ijhydene.2014.05.055
Lee, B., Choi, G.-G., Choi, Y.-E., Sung, M., Park, M. S., and Yang, J.-W. (2014). Enhancement of lipid productivity by ethyl methane sulfonate-mediated random mutagenesis and proteomic analysis in Chlamydomonas reinhardtii. Korean J. Chem. Eng. 31, 1036–1042. doi: 10.1007/s11814-014-0007-5
Liu, T., Li, X., and Zhou, Z. (2010). Improvement of hydrogen yield by hupR gene knock-out and nifA gene overexpression in Rhodobacter sphaeroides 6016. Int. J. Hydrog. Energy 35, 9603–9610. doi: 10.1016/j.ijhydene.2010.06.072
Liu, B.-F., Ren, N.-Q., Ding, J., Xie, G.-J., and Guo, W.-Q. (2009). The effect of Ni2+, Fe2+ and Mg2+ concentration on photo-hydrogen production by Rhodopseudomonas faecalis RLD-53. Int. J. Hydrog. Energy 34, 721–726. doi: 10.1016/j.ijhydene.2008.11.033
Ma, H., Yang, H., Zheng, X., Lie, T., and Yan, W. (2021). Promoting photo-fermentative hydrogen production performance by substituting the rnf promoter in Rhodobacter capsulatus. Int. J. Hydrog. Energy 46, 3742–3752. doi: 10.1016/j.ijhydene.2020.10.270
Masukawa, H., Inoue, K., Sakurai, H., Wolk, C. P., and Hausinger, R. P. (2010). Site-directed mutagenesis of the anabaena sp. strain PCC 7120 nitrogenase active site to increase photobiological hydrogen production. Appl. Environ. Microbiol. 76, 6741–6750. doi: 10.1128/AEM.01056-10
Masukawa, H., Mochimaru, M., and Sakurai, H. (2002). Disruption of the uptake hydrogenase gene, but not of the bidirectional hydrogenase gene, leads to enhanced photobiological hydrogen production by the nitrogen-fixing cyanobacterium anabaena sp. PCC 7120. Appl. Microbiol. Biotechnol. 58, 618–624. doi: 10.1007/s00253-002-0934-7
Miller, J. H. (1972). Experiments in Molecular Genetics. New York, NY: Cold Spring Harbor Laboratory.
Perin, G., Bellan, A., Segalla, A., Meneghesso, A., Alboresi, A., and Morosinotto, T. (2015). Generation of random mutants to improve light-use efficiency of Nannochloropsis gaditana cultures for biofuel production. Biotechnol. Biofuels 8:161. doi: 10.1186/s13068-015-0337-5
Plovins, A., Alvarez, A. M., Ibañez, M., Molina, M., and Nombela, C. (1994). Use of fluorescein-di-beta-D-galactopyranoside (FDG) and C12-FDG as substrates for beta-galactosidase detection by flow cytometry in animal, bacterial, and yeast cells. Appl. Microbiol. Biotechnol. 60, 4638–4641. doi: 10.1128/aem.60.12.4638-4641.1994
Rey, F. E., Heiniger, E. K., and Harwood, C. S. (2007). Redirection of metabolism for biological hydrogen production. Appl. Environ. Microbiol. 73, 1665–1671. doi: 10.1128/AEM.02565-06
Schindel, H. S., and Bauer, C. E. (2016). The RegA regulon exhibits variability in response to altered growth conditions and differs markedly between Rhodobacter species. Microb. Genom. 2:e000081. doi: 10.1099/mgen.0.000081
Schneider, K., Gollan, U., Dröttboom, M., Selsemeier-Voigt, S., and Müller, A. (1997). Comparative biochemical characterization of the iron-only nitrogenase and the molybdenum nitrogenase from Rhodobacter capsulatus. Eur. J. Biochem. 244, 789–800. doi: 10.1111/j.1432-1033.1997.t01-1-00789.x
Schneider, K., Müller, A., Schramm, U., and Klipp, W. (1991). Demonstration of a molybdenum- and vanadium-independent nitrogenase in a nifHDK-deletion mutant of Rhodobacter capsulatus. Eur. J. Biochem. 195, 653–661. doi: 10.1111/j.1432-1033.1991.tb15750.x
Schubert, K. R., and Evans, H. J. (1976). Hydrogen evolution: A major factor affecting the efficiency of nitrogen fixation in nodulated symbionts. Proc. Natl. Acad. Sci. U. S. A. 73, 1207–1211. doi: 10.1073/pnas.73.4.1207
Scolnik, P. A., and Haselkorn, R. (1984). Activation of extra copies of genes coding for nitrogenase in Rhodopseudomonas capsulata. Nature 307, 289–292. doi: 10.1038/307289a0
Seefeldt, L. C., Yang, Z. Y., Lukoyanov, D. A., Harris, D. F., Dean, D. R., Raugei, S., et al. (2020). Reduction of substrates by nitrogenases. Chem. Rev. 120, 5082–5106. doi: 10.1021/acs.chemrev.9b00556
Simpson, F. B., and Burris, R. H. (1984). A nitrogen pressure of 50 atmospheres does not prevent evolution of hydrogen by nitrogenase. Science 224, 1095–1097. doi: 10.1126/science.6585956
Skizim, N. J., Ananyev, G. M., Krishnan, A., and Dismukes, G. C. (2012). Metabolic pathways for photobiological hydrogen production by nitrogenase- and hydrogenase-containing unicellular cyanobacteria Cyanothece. J. Biol. Chem. 287, 2777–2786. doi: 10.1074/jbc.M111.302125
Strnad, H., Lapidus, A., Paces, J., Ulbrich, P., Vlcek, C., Paces, V., et al. (2010). Complete genome sequence of the photosynthetic purple nonsulfur bacterium Rhodobacter capsulatus SB 1003. J. Bacteriol. 192, 3545–3546. doi: 10.1128/JB.00366-10
Vignais, P. M., and Billoud, B. (2007). Occurrence, classification, and biological function of hydrogenases: an overview. Chem. Rev. 107, 4206–4272. doi: 10.1021/cr050196r
Vignais, P. M., Elsen, S., and Colbeau, A. (2005). Transcriptional regulation of the uptake [NiFe] hydrogenase genes in Rhodobacter capsulatus. Biochem. Soc. Trans. 33, 28–32. doi: 10.1042/BST0330028
Wang, D., Zhang, Y., Welch, E., Li, J., and Roberts, G. P. (2010). Elimination of Rubisco alters the regulation of nitrogenase activity and increases hydrogen production in Rhodospirillum rubrum. Int. J. Hydrog. Energy 35, 7377–7385. doi: 10.1016/j.ijhydene.2010.04.183
Weaver, P. F., Wall, J. D., and Gest, H. (1975). Characterization of Rhodopseudomonas capsulata. Arch. Microbiol. 105, 207–216. doi: 10.1007/BF00447139
Zhang, Y., Yang, H., Feng, J., and Guo, L. (2016). Overexpressing F0/F1 operon of ATPase in Rhodobacter sphaeroides enhanced its photo-fermentative hydrogen production. Int. J. Hydrog. Energy 41, 6743–6751. doi: 10.1016/j.ijhydene.2016.03.061
Keywords: nitrogenase, flow cytometry, hydrogenase, biological hydrogen production, hupA, mutagenesis
Citation: Barahona E, Isidro ES, Sierra-Heras L, Álvarez-Melcón I, Jiménez-Vicente E, Buesa JM, Imperial J and Rubio LM (2022) A directed genome evolution method to enhance hydrogen production in Rhodobacter capsulatus. Front. Microbiol. 13:991123. doi: 10.3389/fmicb.2022.991123
Edited by:
Chris Greening, Monash University, AustraliaReviewed by:
Quanyu Zhao, Nanjing Tech University, ChinaBenjamin Duffus, University of Potsdam, Germany
Copyright © 2022 Barahona, Isidro, Sierra-Heras, Álvarez-Melcón, Jiménez-Vicente, Buesa, Imperial and Rubio. This is an open-access article distributed under the terms of the Creative Commons Attribution License (CC BY). The use, distribution or reproduction in other forums is permitted, provided the original author(s) and the copyright owner(s) are credited and that the original publication in this journal is cited, in accordance with accepted academic practice. No use, distribution or reproduction is permitted which does not comply with these terms.
*Correspondence: Luis M. Rubio, bG0ucnViaW9AdXBtLmVz