Abstract
Through whole-genome re-sequencing of 18 Hymenopellis radicata germplasm resources collected from diverse regions in China, we identified significant variations in the form of Single Nucleotide Polymorphisms (SNPs) and Insertions and Deletions (InDels). These variations were comprehensively annotated, shedding light on the mutation types present in the entire genome of the H. radicata germplasm. This analysis revealed the number and position information of each mutation and provided insights into the overall genomic landscape of H. radicata germplasm. Utilizing SNP data, we delved into the population structure of the 18 H. radicata germplasm resources. The results indicated the presence of 2,335,179 Indel sites and 12,050,448 SNP sites. The population structure analysis unveiled two distinct subgroups among the H. radicata germplasm resources. Phenotypic statistics, principal component analysis, and phylogenetic tree results echoed the findings of the population structure analysis. Different strains of H. radicata from various regions in China exhibited notable differences in genetic diversity, mycelial growth rate, yield, and fruiting body characteristics. Significant disparities were observed between the two subgroups, while strains within each subgroup shared common characteristics. This research establishes a solid foundation for integrating H. radicata into diverse breeding programs. The data underscore the potential of H. radicata for genetic improvement and exploitation in breeding initiatives, paving the way for future advancements in this field.
1 Introduction
The Physalacricea Hymenopellis radicata mushroom, commonly known as Changgengu, belongs to the Basidiomycota, Agaricales, and Physalacriceae families (Yang et al., 2009). As a delectable and nutritionally rich rare edible fungus, it predominantly thrives in Sichuan, Yunnan, and Guizhou provinces (Hou et al., 2022). The fruiting body of H. radicata contains active components such as polysaccharides (Wang et al., 2018; Pan et al., 2022) and flavonoids (Zhang et al., 2022), making it a valuable source of natural antioxidants and medicinal supplements for food, pharmaceuticals, and health products. Despite efforts in optimizing cultivation methods (Xiao et al., 2021) and extracting bioactive components (Zhang et al., 2021) from domesticated strains, the existing cultivated strains have low yields and inconsistent quality. The breeding of H. radicata has proven to be comparatively inefficient, compounded by issues of disorganized strain management in the market, leading to challenges such as the presence of the same species and name. The industry’s growth is intricately tied to the quality of H. radicata strains. Given its widespread presence in the wild across our country, we can effectively harness these excellent resources to enhance the genetic diversity of the strains, facilitating the breeding of high-yield, superior, and unique H. radicata strains in China.
In H. radicata cultivation, the fruiting body characteristics often exhibit high variability, with phenotypic traits closely linked to genotype and environment. The unstable phenotypic characteristics pose challenges to genetic improvement in H. radicata. The utilization of existing genomic resources and the generation of additional genomic data can help unravel the molecular basis of phenotypic variation. In recent years, molecular resources for H. radicata have expanded, including de novo transcriptome assembly (Zhu et al., 2023), ISSR labeling (Lian et al., 2023), and fingerprint construction (Gong et al., 2022). However, these studies primarily focused on genome structure analysis, strain identification, and classification, lacking a comprehensive discussion on the genetic diversity of H. radicata strains.
In the exploration of genetic diversity, resequencing technology is often employed, in addition to molecular markers, to detect genetic variation in samples. Whole-genome resequencing, a high-throughput sequencing technique, it is possible to sequence the genomes of various members of a species whose genome sequence is known and compare the variations between individuals or populations (Ley et al., 2008). Comparing whole-genome re-sequenced individuals with reference genome sequences allows for the discovery of numerous Single Nucleotide Polymorphisms (SNPs) and Insertions and Deletions (InDels) sites. A notable example is the analysis conducted by Shen et al. (2020), which explored the genetic diversity and population genetic structure of 28 strains of Flammulina filiformis. Another study by Shi et al. (2019) involved the preliminary resequencing investigation of 18 Agaricus bisporus strains, leading to the identification of the largest hybrid strains in the world through SNP, InDel, and SV detection.
This study undertakes the complete genome resequencing of 18 H. radicata strains to detect, filter, and subtype SNP and InDel locations. Group genetic structure analysis, utilizing SNP data, is employed to construct a systematic development tree and perform principal component analysis. Simultaneously, the study seeks the theoretical basis for the protection and utilization of H. radicata resources, genetic localization of important agricultural characteristics, and polymorphic breeding based on molecular markers. These objectives are pursued in conjunction with the physiological epithetic indicators of all strains. This research aims to contribute valuable insights to the genetic variation in edible fungi, paving the way for the development of new molecular markers to assist in breeding, aligning with the advancements brought about by resequencing technology in this domain.
2 Materials and methods
2.1 Source of the tested strains
The Institute of Urban Agriculture, Chinese Academy of Agricultural Sciences, supplied 18 specimens of H. radicata collected from diverse provinces and cities across China. Based on their respective origins, the 18 strains were categorized into three groups: A, B, and C. Strains in Group A originated from the eastern coastal area, those in Group B were sourced from central China, and Group C comprised strains from southwest China. Details regarding their names and locations are presented in Table 1.
Table 1
| Number | Strains | Origin | Group | Number | Strains | Origin | Group |
|---|---|---|---|---|---|---|---|
| 1 | Or015 | Fuzhou, Fujian | A | 10 | Or007 | Linyi, Shandong | A |
| 2 | Or024 | Fuzhou, Fujian | A | 11 | Or019 | Biyang, Henan | B |
| 3 | Or022 | Fuzhou, Fujian | A | 12 | Or020 | Jiayu, Hubei | B |
| 4 | Or001 | Zhangzhou, Fujian | A | 13 | Or017 | Wuhan, Hubei | B |
| 5 | Or002 | Zhangzhou, Fujian | A | 14 | Or023 | Changsha, Hunan | B |
| 6 | Or004 | Zhangzhou, Fujian | A | 15 | Or018 | Xijiu, Guizhou | C |
| 7 | Or009 | Gaoyou, Jiangsu | A | 16 | Or012 | Chengdu, Sichuan | C |
| 8 | Or003 | Jining, Shandong | A | 17 | Or013 | Chengdu, Sichuan | C |
| 9 | Or034 | Junan, Shandong | A | 18 | Or014 | Chengdu, Sichuan | C |
Breed number and origin of 18 H. radicata strains.
2.2 Strain culture and sample collection
Solid medium (Potato Dextrose Agar, PDA) was prepared using 1 L of distilled water, 200 g of potato, 20 g of glucose, and 15 g of agar. The mycelium and medium were separated using cellophane. The mycelium was cultivated on a complete plate for subsequent DNA extraction and sequencing. Specifically, it was cultured in a 9 cm diameter petri dish containing 20 mL of PDA.
2.3 DNA extraction and genome sequencing of H. radicata
DNA extraction was carried out using the CTAB method (Zhang et al., 2010) following the crushing of an appropriate amount of mycelial tissue with liquid nitrogen. The purity of the extracted DNA was assessed using a spectrophotometer (K5800, Kaiao, Beijing, China). DNA samples with distinct electrophoretic bands and 260/280 nm values falling between 1.6 and 1.8 were selected for further analysis. High-quality DNA samples meeting these criteria were sent to Wuhan Hope Group Biotechnology Co., Ltd. for sequencing on the Illumina platform. The DNA sample underwent subsequent processes, including fragmentation, purification, terminal repair, 3′ terminal adenylation, junction head, fragment screening, and fragment enrichment through PCR.
2.4 Sequencing quality control
Raw data obtained through sequencing is processed using base recognition to generate clean data. The initial sequencing data may contain adapter sequences and low-quality sequences. To ensure the quality of subsequent data analysis, the fastp (Chen et al., 2018) program is employed to enhance the quality of the original data. Data noise is then reduced through data filtering. The clean data undergoes rigorous filtering, resulting in high-quality data suitable for subsequent information analysis. This high-quality data is essential for generating reliable results in the subsequent information analysis.
The filtering steps include: (1) filtering Reads that contain the adapter (for paired-end sequencing, both ends of the Reads are removed if one end contains the adapter); (2) removing low-quality Reads (bases with quality values below Q15 in Reads constitute more than 40% of all bases; for paired-end sequencing, if one end is low-quality Reads, both ends of the Reads will be removed); (3) eliminating Reads with more than 5; and removing Reads with more than 1.
2.5 Compared with the reference genome
Following data filtering, the clean data underwent alignment with the reference genome utilizing the BWA-mem (Bolger et al., 2014) program, yielding alignment results in SAM format. Subsequently, the alignment findings were converted to BAM format and sorted according to chromosomal order using the SAMtools (Li et al., 2009) software. To ensure the quality of the data, duplicate reads were identified and removed using Picard software. After eliminating duplicates, the alignment results were scrutinized using Qualimap 2 (Okonechnikov et al., 2016).
2.6 Genomic variation detection and annotation
Based on the alignment results, the GATK (McKenna et al., 2010) software was employed to identify SNPs and InDels. Subsequently, the ANNOVAR (Wang et al., 2010) software was utilized to annotate the detected SNPs and InDels. The annotation results were then leveraged for subsequent analysis and interpretation. Finally, the outcomes were utilized to discern genetic variations and explore their potential biological roles.
2.7 Population analysis
Based on SNP data, the population structure of H. radicata was investigated through the ADMIXTURE (Alexander et al., 2009) program. The optimal subpopulation number, K, was determined via cross-validation error. The precise procedure involves studying the population structure across various K values. We employed 10 different seeds for 10 repetitions of the analysis. The outcomes were clustered using Pong (Behr et al., 2016) in 10 iterations, and the most representative results were chosen for visualization. For all samples, the IBS matrix was computed using PLINK (Purcell et al., 2007). Subsequently, a phylogenetic tree was constructed using the neighbor-joining algorithm in PHYLIP (Shimada and Nishida, 2017). Principal component analysis based on SNP divergence was then conducted using EIGENSTRAT (Price et al., 2006).
2.8 Statistics of biological characters of different strains
Firstly, activated strains were inoculated onto a solid PDA medium using a 5 mm punch. Subsequently, they were placed in a constant temperature incubator at 25°C to avoid light during cultivation. A “cross” method was employed to mark the starting line and date on the back of the plate with a pen when the mycelium made contact with the medium surface. As the mycelium reached approximately 1 cm from the dish edge, the ending line and date were marked. The distance between the starting and ending lines was measured to calculate the average growth rate of mycelium. Each strain had three parallels, and the average value was determined for comparison and analysis. The formula for calculating the average growth rate (V, mm/d) is: V = D/d.
Secondly, mushroom cultivation was conducted in Pengzhou, Sichuan province, using the soil covering method in small areas. Each strain was set up in three identical replicate areas, each comprising 15 bags. The mature bag cultivation method was employed in production, involving substrate mixing, bagging, inoculation, and mushroom development management. In each small area, 20 harvested fruiting bodies were collected for quantitative trait statistics. The quantitative trait testing method followed the Guidelines for the conduct of tests for distinctness, uniformity, and stability rooting shank mushroom [Oudemansiella raphanipes (Berk.) Pegler & T.W.K. Young] (National Plant New Variety Test Standardization Technical Committee, 2020), with specific methods outlined in Table 2. Fresh fruiting bodies were harvested daily when the mushroom caps were fully expanded but not yet curled upwards. The weight of the fruiting bodies was recorded for each small area, and the total yield for the entire cultivation period was calculated to determine the yield per bag.
Table 2
| Number | Characters | Method |
|---|---|---|
| No. 1 | Pileus diameter | Measure the length of number 1 in Figure 1, 20 replicates |
| No. 2 | Pileus thickness | Measure the length of number 2 in Figure 1, 20 replicates |
| No. 3 | Stipe length | Measure the length of number 3 in Figure 1, 20 replicates |
| No. 4 | Stipe diameter | Measure the length of number 4 in Figure 1, 20 replicates |
Methods for determining quantitative traits of fruiting bodies.
Figure 1
3 Results and analysis
3.1 Genome sequencing analysis
In this investigation, 18 strains of H. radicata were sequenced utilizing the Illumina platform (Table 3). Raw reads ranged from 142,018,200 M to 32,595,990 M. After filtering, the reads were refined to a range of 325,866,758 M to 14,196,060 M. Clean databases range in size from 4.89 GB to 2.13 GB, while raw databases also fall within the 4.89 GB to 2.13 GB range. The sequencing results met the criteria for re-sequencing data analysis because the clean data Q20 ranged from 93.26% to 98.64%, the clean data Q30 ranged from 85.33% to 96.09%, and the GC content ranged from 45.59% to 48.50%.
Table 3
| Sample | Raw reads number (M) | Raw data bases (G) | Clean reads number (M) | Clean data bases (G) | Clean data Q20 | Clean data Q30 | Clean data GC% |
|---|---|---|---|---|---|---|---|
| Or001 | 292,246,120 | 4.39 | 290,622,120 | 4.35 | 97.7930 | 93.5679 | 47.9731 |
| Or002 | 276,714,300 | 4.15 | 274,909,180 | 4.12 | 97.9459 | 93.9989 | 48.1457 |
| Or003 | 305,329,340 | 4.58 | 303,543,200 | 4.55 | 97.6902 | 93.3225 | 48.3862 |
| Or004 | 284,761,740 | 4.27 | 283,114,880 | 4.24 | 97.6404 | 93.1906 | 48.0073 |
| Or007 | 289,265,420 | 4.34 | 287,622,600 | 4.31 | 97.8011 | 93.5098 | 48.3826 |
| Or009 | 286,800,600 | 4.30 | 285,116,860 | 4.27 | 97.5997 | 93.1156 | 48.5011 |
| Or012 | 323,283,200 | 4.85 | 323,283,200 | 4.84 | 98.1250 | 94.6436 | 46.7751 |
| Or013 | 325,831,840 | 4.89 | 325,831,840 | 4.88 | 97.3662 | 92.4603 | 46.5693 |
| Or014 | 325,203,040 | 4.88 | 325,203,040 | 4.87 | 97.7535 | 93.5750 | 47.2989 |
| Or015 | 325,959,900 | 4.89 | 325,959,900 | 4.89 | 98.3398 | 95.1298 | 46.6987 |
| Or017 | 310,126,920 | 4.65 | 310,126,920 | 4.65 | 98.3387 | 95.1136 | 46.6430 |
| Or018 | 309,087,860 | 4.64 | 309,087,860 | 4.63 | 98.4040 | 95.3102 | 46.7836 |
| Or019 | 308,710,460 | 4.63 | 308,710,460 | 4.63 | 98.6416 | 96.0939 | 46.7383 |
| Or020 | 309,491,240 | 4.64 | 309,491,240 | 4.64 | 98.1612 | 94.6065 | 46.3452 |
| Or022 | 308,801,140 | 4.63 | 308,802,140 | 4.63 | 97.2164 | 92.0595 | 46.3672 |
| Or023 | 309,706,700 | 4.65 | 309,706,700 | 4.64 | 98.2581 | 94.8948 | 46.7202 |
| Or024 | 309,290,740 | 4.64 | 309,290,740 | 4.64 | 98.4996 | 95.5830 | 46.6569 |
| Or034 | 142,018,200 | 2.13 | 142,018,200 | 2.13 | 93.2582 | 85.3306 | 45.5942 |
Quality of re-sequencing data for 18 strains of H. radicata.
H. radicata IJFM A160 (GenBank accession: GCA_015501595.1) was used the reference genome for this study. Table 4 presents a comparison of the resequencing results from 18 H. radicata samples with the reference genome. More than 57.62% of the entire dataset successfully aligned to the reference genome in a double-ended manner, while over 32.90% of the total data showed precise matches with the reference genome. Moreover, over 67.21% of the total data were mapped to the reference genome. These findings highlight discrepancies between the experimental material and the reference genome, suggesting the need for further investigation to accurately characterize the genetic differences among these 18 samples. Such an analysis could offer valuable insights into the genetic variability of H. radicata.
Table 4
| Sample | Total reads | Total mapped | Total pair reads | Total pair mapped | Properly paired | 1X (%) | 10X (%) |
|---|---|---|---|---|---|---|---|
| Or001 | 43,523,934 | 72.64% | 25,479,978 | 58.54% | 41.43% | 54.32 | 42.04 |
| Or002 | 40,743,576 | 72.50% | 24,054,682 | 59.04% | 41.54% | 54.40 | 41.64 |
| Or003 | 45,288,738 | 73.60% | 26,094,136 | 57.62% | 42.20% | 54.31 | 42.33 |
| Or004 | 41,780,177 | 71.56% | 24,588,954 | 58.85% | 39.86% | 54.57 | 41.50 |
| Or007 | 42,900,214 | 73.48% | 31,521,273 | 73.48% | 32.90% | 54.11 | 41.76 |
| Or009 | 43,575,939 | 74.16% | 25,250,443 | 57.95% | 42.89% | 54.84 | 42.52 |
| Or012 | 49,810,653 | 71.64% | 31,494,048 | 63.23% | 45.06% | 54.72 | 43.34 |
| Or013 | 50,909,618 | 71.48% | 31,588,549 | 62.05% | 42.83% | 55.27 | 43.78 |
| Or014 | 50,939,786 | 72.84% | 31,552,918 | 61.94% | 44.94% | 55.17 | 43.90 |
| Or015 | 50,193,035 | 71.87% | 31,569,266 | 62.90% | 44.25% | 54.56 | 43.53 |
| Or017 | 48,622,702 | 71.98% | 30,072,205 | 61.85% | 43.11% | 55.16 | 43.65 |
| Or018 | 48,138,851 | 72.01% | 30,038,907 | 62.40% | 44.00% | 55.00 | 43.49 |
| Or019 | 47,755,567 | 71.81% | 30,009,770 | 62.84% | 44.57% | 54.65 | 43.07 |
| Or020 | 48,798,468 | 70.84% | 29,955,844 | 61.39% | 40.89% | 55.05 | 42.99 |
| Or022 | 47,053,933 | 69.91% | 29,973,347 | 63.70% | 41.77% | 54.62 | 42.90 |
| Or023 | 48,393,451 | 71.93% | 30,054,633 | 62.10% | 43.32% | 55.14 | 43.64 |
| Or024 | 48,056,660 | 71.77% | 30,055,329 | 62.54% | 43.84% | 54.94 | 43.39 |
| Or034 | 20,877,936 | 67.21% | 13,943,666 | 66.79% | 40.34% | 52.09 | 32.89 |
Statistics of genome alignment and coverage.
3.2 SNP and InDel sites of the strain of H. radicata
After aligning with the reference genome, we identified 12,050,448 SNP sites and 2,335,179 InDel sites (refer to Table 5). Strain Or020 exhibited the fewest SNPs (502,973), while strain Or024 presented the highest count (692,787). The transitions ranged between 359,326 and 488,733, and transversions were observed between 143,627 and 204,054. InDel sites varied from the lowest in strain Or020 (92,542) to the highest in strain Or024 (136,963). Insertion sites ranged from 43,041 to 63,571, and deletion sites were observed between 49,501 and 73,392. Additionally, ANNOVAR software annotated the identified SNPs and InDels, and the annotations are displayed in Figure 2. Among the 18 H. radicata strains, SNPs located in the exon region constituted 53% of all identified SNPs. Among these, 70% were synonymous mutations, and 30% were non-synonymous mutations (Figure 2A). Regarding InDels, 22% of the total were located in the exon region, 27% in the intronic region, and 12% in the intergenic region (Figure 2B).
Table 5
| Sample | SNP | InDel | ||||
|---|---|---|---|---|---|---|
| Transition | Transversion | Total | Deletion | Insertion | Total | |
| Or001 | 477,282 | 198,026 | 675,308 | 68,233 | 60,511 | 128,744 |
| Or002 | 480,300 | 198,969 | 679,269 | 68,640 | 60,319 | 128,959 |
| Or003 | 478,923 | 199,418 | 678,341 | 69,966 | 61,529 | 131,495 |
| Or004 | 446,140 | 182,689 | 628,829 | 62,148 | 54,803 | 116,951 |
| Or007 | 479,231 | 199,379 | 678,610 | 69,794 | 61,274 | 131,068 |
| Or009 | 485,903 | 202,872 | 688,775 | 72,221 | 62,693 | 134,914 |
| Or012 | 487,966 | 203,843 | 691,809 | 73,192 | 63,186 | 136,378 |
| Or013 | 487,839 | 203,783 | 691,622 | 73,065 | 63,322 | 136,387 |
| Or014 | 488,423 | 203,966 | 692,389 | 73,361 | 63,598 | 136,959 |
| Or015 | 479,016 | 199,415 | 678,431 | 70,238 | 61,552 | 131,790 |
| Or017 | 488,053 | 203,822 | 691,875 | 73,013 | 63,241 | 136,254 |
| Or018 | 488,383 | 204,034 | 692,417 | 73,325 | 63,559 | 136,884 |
| Or019 | 488,012 | 203,803 | 691,815 | 73,156 | 63,357 | 136,513 |
| Or020 | 359,326 | 143,627 | 502,953 | 49,501 | 43,041 | 92,542 |
| Or022 | 479,768 | 199,655 | 679,423 | 70,064 | 61,484 | 131,548 |
| Or023 | 487,935 | 203,731 | 691,666 | 73,117 | 63,434 | 136,551 |
| Or024 | 488,733 | 204,054 | 692,787 | 73,392 | 63,571 | 136,963 |
| Or034 | 441,988 | 182,141 | 624,129 | 60,797 | 53,482 | 114,279 |
SNP and InDel variation of 18 strains of H. radicata in comparison with the reference genome.
Figure 2
3.3 Analysis of the population genetic structure of H. radicata
PLINK 1.9 was employed to filter SNPs across the entire genome using the parameter “-Indep-pairwise 50 5 0.5”, based on the outcomes of the preceding investigation. For population stratification, 176,640 SNPs with loose linkages were utilized. The population structure was examined using ADMIXTURE version 1.3.0 for K values ranging from 2 to 5, and the ideal K value was determined through cross-validation error (CV). It is important to note that the model has higher reliability when the error rate at K = 2 is low, indicating that the most appropriate number of subgroups is two. Additionally, Figure 3A displays the result of the simulation analysis at different K values. At K = 2, the 18 germplasms were divided into two subgroups (red and blue), with strains Or004 and Or020 showing different levels of mixing between these two subgroups. This is speculated to be the result of genetic drift. When K = 3, strains Or004 and Or020 were categorized into a distinct subgroup, while strains Or001 and Or002 exhibited genetic elements from both subgroups, marking the beginning of further divergence between the two groups. At K = 4, strain Or020 branched off into its own subset, and at K = 5, strain Or002 also formed a new subgroup. The stable and genetically similar breeds were generally divided into two subgroups. Strains Or001, Or002, Or004, and Or020 are examples of strains that possess genetic components from two or more subgroups. As the number of subgroups increased, the phenomenon of genetic drift became more pronounced.
Figure 3
3.4 Comparison of mycelial growth rate between two subgroups of strains
The mycelial growth rate of strains in subgroup I ranged from 1.23 ± 0.074 cm/d to 1.53 ± 0.172 cm/d, while that of strains in subgroup II varied from 1.55 ± 0.086 cm/d to 1.77 ± 0.165 cm/d. The specific mycelial growth rates of each strain are shown in Figure 4. Statistical analysis revealed that strains in subgroup I grew significantly slower than those in subgroup II (p < 0.0001). This indicates that under identical culture conditions, strains in subgroup II have a significant advantage in terms of the mycelial growth rate index.
Figure 4
3.5 Comparison of single bag yield of two subgroups of strains
We collected yield data for all strains throughout their growth period and calculated the yield per bag, as shown in Figure 5. The yield of strains in subgroup I ranged from 64.10 ± 22.513 g/bag to 222.9 ± 13.930 g/bag, while the yield of strains in subgroup II varied from 47.08 ± 11.267 g/bag to 197.55 ± 51.631 g/bag. Although the average yield of strains in subgroup I was higher than in subgroup II, both subgroups contained strains with both high and low yields. Overall, the yield of strains within the two subgroups varied widely, showing no significant differences between them (p = 0.0593).
Figure 5
3.6 Comparison of the quantity and characteristics between two subgroups of strains
As shown in Figure 6, the pileus diameter, pileus thickness, stipe diameter, and stipe length were measured for each strain. The strains from subgroup II had significantly larger pileus diameters (p < 0.001), pileus thickness (p < 0.01), and stipe diameter (p < 0.05) compared to those from subgroup I. However, there was no significant difference in stipe length between the two subgroups. On the whole, the strains in subgroup II exhibited larger pileus diameters, thicker pilei, and larger stipe diameters than those in subgroup I.
Figure 6
3.7 Population principal component analysis of H. radicata
Based on the extent of SNP differences detected in individual genomes, individuals were clustered into different subgroups and groups according to principal components, as depicted in Figure 7. Each point in the figure represents a sample, with greater distances between two points indicating more significant differences in the genetic backgrounds of the corresponding samples. The categorization of strains into two distinct groups, as determined by their locations and distances on the two-dimensional graph, aligns well with the results of the population genetic structure analysis (see Figure 8).
Figure 7
Figure 8
3.8 Cluster analysis of strain resources of H. radicata
The SNP identification data were used to construct a phylogenetic tree, which aided in understanding the evolutionary relationships among H. radicata populations from various geographical locations. According to the data, the strains in the two subgroups originated from four main branches. The first significant branch includes Or009, Or012, Or013, Or014, Or017, Or018, Or019, Or023, and Or024, which are present in Sichuan, Henan, Jiangsu, Hubei, Hunan, and Guizhou provinces. The second major branch comprises five strains: Or007, Or022, Or015, Or034, and Or003, found in Shandong and Fujian provinces. The third branch consists of strains Or001, Or002, and Or004, all located in Zhangzhou, Fujian Province. The unique strain Or020 originates from Jiayu, Hubei Province. As observed, strains conserved within the same region are closely related. There is minimal genetic difference between the strain populations from Shandong Province and Fujian Province. Strains from Hunan Province and Guizhou Province, as well as those from adjacent provinces, are genetically closer to those from Sichuan Province. Overall, the genetic analysis reveals a close relationship between the strains and their geographic distribution.
4 Discussion
We re-sequenced strains from various regions and successfully obtained a minimum of 2.3GB of clear data, with a Q30 exceeding 85.33% for each strain. The average genome coverage reached 71.93%. All strains were identified with a reference genome ratio of 12,050,448 SNP sites and 2,335,179 InDel sites. Using the SNP data for group genetic structure, principal component analysis, and constructing a systematic evolutionary tree, 18 strains were categorized into two subgroups. Furthermore, a statistical analysis of the growth rate, yield and fruiting body characteristics of the germ strains in the two subgroups revealed similarities within each subgroup and significant differences between them. The acquisition of this data contributes to understanding the genetic evolution of H. radicata.
The study of the evolution of edible fungi is a burgeoning topic. Numerous variables influence the diversification of mushroom populations, including geographical location. Several studies indicate that resequencing technology significantly enhance the effectiveness and accuracy of analysis by exploring the genetic diversity of germplasm resources of edible fungi in different regions (Bao and Xie, 2020). Branco et al. (2017) re-sequenced 55 strains of Suillus brevipes to analyze the differentiation process of these strains from different parts of the United States. They found that temperature was related to the genetic evolution of these strains, and some genes responsive to low-temperature stress were also discovered. Re-sequencing 33 Pleurotus eryngii populations from Europe and the Gobi Desert environment in China, Dai et al. (2024) discovered several genes involved in stress response and DNA repair connected to the adaptation to the Gobi Desert environment. Re-sequencing Agaricus bisporus strains from the Tibetan Plateau and the United States revealed significant independent divergence, as reported by Sun et al. (2019). Additionally, scientists identified a few crucial genes related to the cell wall and membrane that may play a role in the mushroom’s growth and development as well as its defensive mechanism against a hostile environment. The genes identified in the study employed to enhance the mushroom’s ability to adapt and survive in extreme environments. Moreover, the genetic diversity of the strains was analyzed at the later stages of mushroom molecular breeding. Zhu et al. (2019) re-sequenced Ganoderma lucidum isolates from South Korea and China and found many altered genes. The cultivation practices of mushrooms also impacted mushroom populations differently. Wild and domesticated Chinese Lentinula edodes were re-sequenced by Xiao et al. (2016). They separated the strains into three subgroups and filtered out 18 genes causing population variations, some of which were connected to stress responses. Re-sequencing 26 strains of Sarcomyxa edulis by Tian (2019). The results showed that the genetic distance between wild strain T24 and many cultivated strains was close, and there was gene exchange. It is speculated that these cultivated strains may have evolved from T24 strains. Shen et al. (2020) re-sequenced 28 wild and domesticated strains of Flammulina filiformis into five subgroups that were compatible with the breeding history of F. filiformis. Resequencing offers the benefit of obtaining information on variant genes as well as variable loci, crucial for environmental adaptation and population divergence. This has the potential to provide insight into the development of new varieties and offer new genetic resources for future breeding. It is also useful for understanding species genetic diversity.
4.1 Genetic diversity analysis of strains
Currently, numerous articles explore the genetic diversity of edible fungi, such as Agaricus blazei (Wan et al., 2021), Pleurotus eryngii (Lin et al., 2023), Lentinula edodes (Wu et al., 2023), and Agaricus bisporus (Gu et al., 2013). These studies employ SSR, ISSR and other molecular marker technologies to cluster strains. In contrast, our study utilizes resequencing technology to analyze individual differences between strains at the genomic level. Our findings demonstrate that resequencing technology is highly effective in analyzing the genetic diversity of strains.
In our study, significant differences in genetic variation between different strains were observed. Through sequencing analysis, we identified substantial variations in genetic makeup among breeds. Notably, strain Or020 exhibited significantly fewer SNPs and InDels compared to other strains, followed by strains Or004 and Or034. The presence of fewer mutation sites suggests more conserved sequences in the evolutionary process, indicating higher genetic stability. These strains may be better suited as primary cultivars. Simultaneously, it is noteworthy that among the detected SNPs, variations in all transmutation types were almost twice as many as in transversion types. This variation predominantly occurred in the exon region (53%) and intronic region (16%), encompassing crucial information for protein synthesis and covering most functional variations related to individual phenotypes. Increased variation in these two regions may resulted in greater phenotypic differences between strains, warranting further investigation into this variation. Regarding the detected InDel variants, the number of deletions and insertions was similar. Mutations in the coding region may lead to changes in protein structure and function, thereby influencing the properties of H. radicata. The SNP data were utilized for a group genetic structure analysis dividing the test strains into two subgroups (Figure 3B).
The blue-marked subgroups primarily consisted of strains from Fujian and Shandong, including the main Shandong variety Or034. The number of mutations detected in these subgroups was slightly higher than in the other population, suggesting a higher degree of variability in evolution. Strains with greater variability may hold greater potential for molecular breeding. Conversely, the red-marked subgroups mainly comprised strains from inland areas such as Sichuan and Hunan. The number of variations detected in these strains was slightly lower, indicating a more conservative evolution and stable inheritance of desirable traits. In future breeding efforts, we propose crossbreeding strains from the two subpopulations to obtain heterosis strains, playing a significant role in future production. Additionally, it is essential to collect more varieties for domestication, and expand the germplasm bank of H. radicata.
4.2 Diversity analysis of fruiting body characters
A comprehensive statistical analysis of yields and fruiting body characteristics across all strains revealed significant differences between the two subgroups in multiple aspects. Thile there is more similarity among strains within the same subgroup, notable differences exist between the two subgroups. Subgroup II demonstrated significant advantages in terms of mycelial growth rate and fruiting body characteristics. However, there was no significant difference in yield traits between the two subpopulations, possibly attributed to greater strain yield variation within subpopulations. In subsequent studies, we recommend hybridizing strains from the two subgroups to select superior strains.
Although the fruiting body characteristics exhibited remarkable quality, the average yield was slightly lower. The comprehensive analysis of cultivation data and biological results demonstrated good consistency, indicating that the selected traits in this study effectively represent the differences and commonalities among strains. These distinctions and similarities are primarily derived from the genetic material of the strains. The study revealed genetic differences among strains but commonalities in yield and fruiting body traits within the same subpopulation. These strains share a common background, potentially representing different strains of the same variety even the same variety. Apart from genetic material, these phenotypic differences and commonalities may also be linked to gene expression and metabolic pathways, which will be the focal point of our future research in analyzing the association between genotype and phenotype.
Furthermore, we observed that strain Or019 exhibits characteristics such as fast mycelial growth, high yield and good fruiting body traits, suggesting its potential as a major cultivar. Similar studies conducted by Lin et al. (2023) on Pleurotus eryngii have shown a strong correlation between SNP markers and fruiting body traits, aligning with our findings. In upcoming research, we plan to conduct multi-year cultivation experiments across various regions to investigate the stability of strain yield and fruiting body characteristics. We aim to collect more trait indicators through phenotypic analysis and develop molecular markers for association analysis using the detected variation sites. This will provide essential technical support for variety identification, trait prediction and crossbreeding. Additionally, testing strains’ tolerance to biological and abiotic stresses, screening dominant strains, and optimizing cultivation techniques are envisioned to enhance H. radicata quality and yield.
5 Conclusion
In this study, we conducted whole-genome re-sequencing on 18 strains of H. radicata sourced from different regions in China. The integration of bioinformatics analysis with population genetics allowed us to extract quantitative and positional information about SNPs and InDels. Additionally, the mycelial growth rate, yield, and fruiting body characteristics of the strains were collectively considered to explore commonalities and differences within the population. The 18 materials were categorized into two subgroups, each demonstrating its own set of advantages. Notably, strains within the same subgroup exhibited consistency in both yield and fruiting body characteristics.
For future endeavors, strains from each of the two subgroups can be chosen as parents and crossbred according to breeding objectives, aiming to obtain strains with excellent traits from both subgroups. The molecular markers we identified stand as valuable tools for genetic diversity analysis, gene localization of desirable traits, and the selection of high-quality germplasm in H. radicata.
Statements
Data availability statement
The original contributions presented in the study are included in the article/supplementary material, further inquiries can be directed to the corresponding author.
Author contributions
LC: Conceptualization, Formal analysis, Investigation, Methodology, Writing – original draft. DY: Investigation, Methodology, Resources, Writing – review & editing. QZ: Data curation, Formal analysis, Methodology, Writing – review & editing. YN: Data curation, Formal analysis, Software, Writing – review & editing. WL: Data curation, Investigation, Project administration, Writing – review & editing. RF: Formal analysis, Software, Supervision, Writing – review & editing. WM: Formal analysis, Project administration, Software, Writing – review & editing. XZ: Funding acquisition, Resources, Validation, Visualization, Writing – review & editing.
Funding
The author(s) declare financial support was received for the research, authorship, and/or publication of this article. This work was supported by Scientific and Technological Innovation Talents of Sichuan Province (no. 2022JDRC0034), the Agricultural Science and Technology Innovation Program (no. ASTIP-IUA-2023005), Local Financial Funds of National Agricultural Science and Technology Center, Chengdu (no. NASC2021KR06) and Technology Innovation Guidance Program (no. 22CX8NH219).
Conflict of interest
The authors declare that the research was conducted in the absence of any commercial or financial relationships that could be construed as a potential conflict of interest.
The reviewer QL declared a shared affiliation with the authors YN and WL to the handling editor at the time of review.
Publisher’s note
All claims expressed in this article are solely those of the authors and do not necessarily represent those of their affiliated organizations, or those of the publisher, the editors and the reviewers. Any product that may be evaluated in this article, or claim that may be made by its manufacturer, is not guaranteed or endorsed by the publisher.
References
1
AlexanderD. H.NovembreJ.LangeK. (2009). Fast model-based estimation of ancestry in unrelated individuals. Genome Res.19, 1655–1664. doi: 10.1101/gr.094052.109
2
BaoD. P.XieB. G. (2020). Some research directions worthy of attention in the genetics of edible mushrooms in China. Mycosystema39, 971–976. doi: 10.13346/j.mycosystema.200168
3
BehrA. A.LiuK. Z.Liu-FangG.NakkaP.RamachandranS. (2016). Pong: fast analysis and visualization of latent clusters in population genetic data. Bioinformatics32, 2817–2823. doi: 10.1093/bioinformatics/btw327
4
BolgerA. M.LohseM.UsadelB. (2014). Trimmomatic: a flexible trimmer for Illumina sequence data. Bioinformatics30, 2114–2120. doi: 10.1093/bioinformatics/btu170
5
BrancoS.BiK.LiaoH. L.GladieuxP.BadouinH.EllisonC. E.et al. (2017). Continental-level population differentiation and environmental adaptation in the mushroom Suillus brevipes. Mol. Ecol. Resour.26, 2063–2076. doi: 10.1111/mec.13892
6
ChenS.ZhouY.ChenY.GuJ. (2018). Fastp: an ultra-fast all-in-one FASTQ preprocessor. Bioinformatics34, i884–i890. doi: 10.1093/bioinformatics/bty560
7
DaiY.SunL.YinX.GaoM.ZhaoY.JiaP.et al. (2024). Pleurotus eryngii genomes reveal evolution and adaptation to the Gobi Desert environment. Front. Microbiol.10:10. doi: 10.3389/fmicb.2019.02024
8
GongN.MaX. Y.ChenX.LiuG. L.ZhaoY.XiaoJ.et al. (2022). Study on classification of Oudemansiella raphanipes based on HPLC and mult gene combined sequence identification. Northern Horticul.18, 117–123. doi: 10.11937/bfyy.1001-0009(2022)18-0117-07
9
GuM.ShenY.JinQ.FengW.SongT.TianF.et al. (2013). Development and application of SSR markers in Agaricus bisporus. Acta Agriculturae Zhejiangensis.25, 987–993. doi: 10.3969/j.issn.1004-1524.2013.05.14
10
HouY. C.YeS. C.LiangJ. M.YanD. X.WanyanH. Y.CaoB. H.et al. (2022). Extraction technology and in vitro antioxidant activity of polysaccharides from Oudemansiella radicata. Food Sci. Technol.47, 203–208. doi: 10.13684/j.cnki.spkj.2022.04.019
11
LeyT. J.MardisE. R.DingL.FultonB.McLellanM. D.ChenK.et al. (2008). DNA sequencing of a cytogenetically normal acute myeloid leukaemia genome. Nature456, 66–72. doi: 10.1038/nature07485
12
LiH.HandsakerB.WysokerA.FennellT.RuanJ.HomerN.et al. (2009). The sequence alignment/map format and SAMtools. Bioinformatics25, 2078–2079. doi: 10.1093/bioinformatics/btp352
13
LianY. P.ZhaoG. H.WuZ. Q.YuanB.KeL. N.ZhangZ. H.et al. (2023). Antagonistic and ISSR molecular markers of Oudemansiella raphanipes strains. Chin. J. Trop. Agric.43, 15–20. doi: 10.12008/j.issn.1009-2196.2023.1.004
14
LinJ. B.YanJ. J.HanX.ZhaoJ.GanY.MiaoR. Y.et al. (2023). Population diversity and characters of Pleurotus eryngii strains based on whole genome resequencing. Southwest China J. Agric. Sci.36, 1–12. Available at: https://link.cnki.net/urlid/51.1213.S.20230921.1500.066
15
McKennaA.HannaM.BanksE.SivachenkoA.CibulskisK.KernytskyA.et al. (2010). The genome analysis toolkit: a map reduce framework for analyzing next-generation DNA sequencing data. Genome Res.20, 1297–1303. doi: 10.1101/gr.107524.110
16
National Plant New Variety Test Standardization Technical Committee. NY/T 3715–2020 agricultural industry standard of the People’s Republic of China. Beijing: China Agriculture Press, (2020).
17
OkonechnikovK.ConesaA.Garcia-AlcaldeF. (2016). Qualimap 2: advanced multi-sample quality control for high-throughput sequencing data. Bioinformatics32, 292–294. doi: 10.1093/bioinformatics/btv566
18
PanW. J.ShiL. L.RenY. R.YaoC. Y.LuY. M.ChenY. (2022). Polysaccharide ORP-1 isolated from Oudemansiella raphanipes ameliorates age-associated intestinal epithelial barrier dysfunction in Caco-2 cells monolayer. Food Res. Int.162:112038(PA): 112038-112049. doi: 10.1016/j.foodres.2022.112038
19
PriceA. L.PattersonN. J.PlengeR. M.WeinblattM. E.ShadickN. A.ReichD. (2006). Principal components analysis corrects for stratification in genome-wide association studies. Nat. Genet.38, 904–909. doi: 10.1038/ng1847
20
PurcellS.NealeB.Todd-BrownK.ThomasL.FerreiraM. A.BenderD.et al. (2007). PLINK: a tool set for whole-genome association and population-based linkage analyses. Am. J. Hum. Genet.81, 559–575. doi: 10.1086/519795
21
ShenY. Y.JinQ. L.CaiW. M.FanL. J.FengW. L.SongT. T.et al. (2020). Analysis of population diversity and structure of Flammulina filiformis strains based on whole genome resequencing data. Mycosystema39, 1016–1028. doi: 10.13346/j.mycosystema.200041
22
ShiX. K.CaiZ. X.GuoZ. J.LuY. P.ChenM. Y.LiaoJ. H.et al. (2019). A preliminary report on resequencing 18 representative strains of Agaricus bisporus. Fujian J. Agric. Sci.34, 1167–1172. doi: 10.19303/j.issn.1008-0384.2019.10.008
23
ShimadaM. K.NishidaT. (2017). A modification of the PHYLIP program: a solution for the redundant cluster problem, and an implementation of an automatic bootstrapping on trees inferred from original data. Mol. Phylogenet. Evol.109, 409–414. doi: 10.1016/j.ympev.2017.02.012
24
SunL.FuY.YangY.WangX.CuiW.LiD.et al. (2019). Genomic analyses reveal evidence of independent evolution, demographic history, and extreme environment adaptation of Tibetan plateau Agaricus bisporus. Front. Microbiol.10:1786. doi: 10.3389/fmicb.2019.01786
25
TianF. H.Evaluation of germplasm resources and genes related to triterpene synthetic pathway of Sarcomyxa edulis in Northeast China. Changchun: Jilin Agricultural University, (2019).
26
WanC.LiL. J.XiongX.LuoW. M.WangY. (2021). Genetic diversity of Agricus blazei Murrill germplasm resources. Edible Fungi China40, 11–16. doi: 10.13629/j.cnki.53-1054.2021.09.003
27
WangY.JiaJ.RenX.LiB.ZhangQ. (2018). Extraction, preliminary characterization and in vitro antioxidant activity of polysaccharides from Oudemansiella radicata mushroom. Int. J. Biol. Macromol.120, 1760(PB): 1760-1769–1769. doi: 10.1016/j.ijbiomac.2018.09.209
28
WangK.LiM.HakonarsonH. (2010). ANNOVAR: functional annotation of genetic variants from high-throughput sequencing data. Nucleic Acids Res.38:e164. doi: 10.1093/nar/gkq603
29
WuX. Y.BaoH. C.LiX. L.YuH. B.WangH. X.YuC. Z.et al. (2023). ISSR analysis of genetic diversity of 26 Lentinula edodes strains. Seed42, 63–67. doi: 10.16590/j.cnki.1001-4705.2023.05.063
30
XiaoY.ChengX.LiuJ.LiC.NongW.BianY.et al. (2016). Population genomic analysis uncovers environmental stress-driven selection and adaptation of Lentinula edodes population in China. Sci. Rep.6, 1–12. doi: 10.1038/srep36789
31
XiaoZ. T.LinH. T.ZengL. X.HeH. Q.LinX.PengY. Y.et al. (2021). Efficient annual cultivation technique of Oudemansiella raphanipes (Heipijizong) without soil cover in factory. China Veg.6, 112–114. doi: 10.19928/j.cnki.1000-6346.2021.3026
32
YangZ. L.ZhangL. F.MuellerG. M.KostG. W.RexerK. H. (2009). A new systematic arrangement of the genus Oudemansiella s. str. (Physalacriaceae, Agaricales). Mycosystema28, 1–13. doi: 10.13346/j.mycosystema.2009.01.002
33
ZhangZ. F.WuC.CaiW. M.SongT. T.LvG. Y.. (2021). Effects of dehydration and extraction techniques on the physicochemical properties and antioxidant activities of Oudemansiella radicata polysaccharides. J. Food Meas. Charact.16, 180–190. doi: 10.1007/s11694-021-01154-8
34
ZhangY. J.ZhangS.LiuX. Z.WenH. A.WangM. (2010). A simple method of genomic DNA extraction suitable for analysis of bulk fungal strains. Lett. Appl. Microbiol.51, 114–118. doi: 10.1111/j.1472-765X.2010.02867.x
35
ZhangC.ZhaoJ.YanJ. J.MioaR. Y.LinJ. B.LiX.et al. (2022). Optimization of extraction process of total flavonoids from Oudemansiella raphanipes by response surface methodology. China Condiment47, 138–143. doi: 10.3969/j.issn.1000-9973.2022.11.026
36
ZhuL.GaoX.ZhangM.HuC.YangW.GuoL.et al. (2023). Whole genome sequence of an edible mushroom Oudemansiella raphanipes (Changgengu). J. Fungi9, 266–281. doi: 10.3390/jof9020266
37
ZhuF. L.XuX. L.ChenT. Q.ShiL. C.MiaoX. Q.LanJ.et al. (2019). The analysis of whole-genome resequencing of Ganoderma lucidum originated from South Korea. World Sci. Technol.21, 764–774. doi: 10.11842/wst.2019.04.032
Appendix
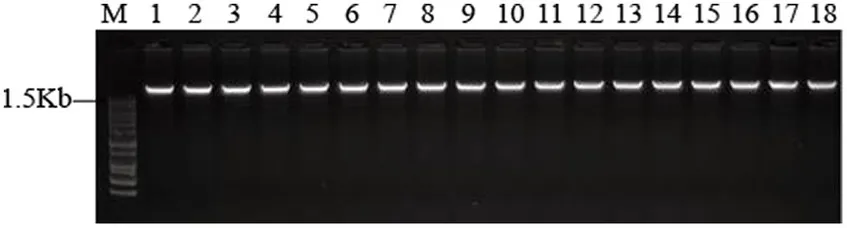
Agarose gel electrophoresis of the DNA. M: 1 Kb plus DNA ladder marker; 1–18: 18 strains of H. radicata.
 |
Summary
Keywords
Hymenopellis radicata, whole genome resequencing, SNP, INDEL, population genetic structure
Citation
Cao L, Yang D, Zhang Q, Ni Y, Li W, Feng R, Mu W and Zhao X (2024) Population genetic structure of Hymenopellis radicata germplasm resources based on genome re-sequencing. Front. Microbiol. 15:1287641. doi: 10.3389/fmicb.2024.1287641
Received
02 September 2023
Accepted
08 January 2024
Published
24 January 2024
Volume
15 - 2024
Edited by
Chenyang Huang, Institute of Agricultural Resources and Regional Planning, Chinese Academy of Agricultural Sciences, Beijing, China
Reviewed by
Qiang Li, Chengdu University, China
Bingzhi Chen, Fujian Agriculture and Forestry University, China
Hosein Salehian Dehkordi, Chinese Academy of Sciences (CAS), China
Updates
Copyright
© 2024 Cao, Yang, Zhang, Ni, Li, Feng, Mu and Zhao.
This is an open-access article distributed under the terms of the Creative Commons Attribution License (CC BY). The use, distribution or reproduction in other forums is permitted, provided the original author(s) and the copyright owner(s) are credited and that the original publication in this journal is cited, in accordance with accepted academic practice. No use, distribution or reproduction is permitted which does not comply with these terms.
*Correspondence: Xu Zhao, zhaoxu02@caas.cn
†These authors have contributed equally to this work
Disclaimer
All claims expressed in this article are solely those of the authors and do not necessarily represent those of their affiliated organizations, or those of the publisher, the editors and the reviewers. Any product that may be evaluated in this article or claim that may be made by its manufacturer is not guaranteed or endorsed by the publisher.