 Ye Li1
 Kurt Ash1,2Isablla Alamilla3
 Dominique Joyner1
 Daniel Edward Williams4Peter J. McKay3Brianna Green5
 Sydney DeBlander6
 Carman North7Fadime Kara-Murdoch1,3,4
 Cynthia Swift1,4
 Terry C. Hazen1,2,5,8,9*
- 1Department of Civil and Environmental Sciences, University of Tennessee, Knoxville, TN, United States
- 2Biosciences Division, Oak Ridge National Laboratory, Oak Ridge, TN, United States
- 3Battelle Memorial Institute, Columbus, OH, United States
- 4Center for Environmental Biotechnology, University of Tennessee, Knoxville, TN, United States
- 5Department of Microbiology, University of Tennessee, Knoxville, TN, United States
- 6College of Natural Science, Michigan State University, East Lansing, MI, United States
- 7Student Health Center, University of Tennessee, Knoxville, TN, United States
- 8Department of Earth and Planetary Sciences, University of Tennessee, Knoxville, TN, United States
- 9Institute for a Secure and Sustainable Environment, University of Tennessee, Knoxville, TN, United States
Wastewater-based epidemiology (WBE) has become a valuable tool for monitoring the prevalence of SARS-CoV-2 on university campuses. However, concerns about effectiveness of raw sewage as a COVID-19 early warning system still exist, and it’s not clear how useful normalization by simultaneous comparison of Pepper Mild Mottle Virus (PMMoV) is in addressing variations resulting from fecal discharge dilution. This study aims to contribute insights into these aspects by conducting an academic-year field trial at the student residences on the University of Tennessee, Knoxville campus, raw sewage. This was done to investigate the correlations between SARS-CoV-2 RNA load, both with and without PMMoV normalization, and various parameters, including active COVID-19 cases, self-isolations, and their combination among all student residents. Significant positive correlations between SARS-CoV-2 RNA load a week prior, during the monitoring week, and the subsequent week with active cases. Despite these correlations, normalization by PMMoV does not enhance these associations. These findings suggest the potential utility of SARS-CoV-2 RNA load as an early warning indicator and provide valuable insights into the application and limitations of WBE for COVID-19 surveillance specifically within the context of raw sewage on university campuses.
Introduction
Wastewater-Based Epidemiology (WBE) emerges as a valuable tool for the early detection and surveillance of COVID-19 outbreaks within university communities. As of December 22, 2023, a study by researchers at the University of California, Merced, reveals that 289 universities across 72 countries, encompassing 4,648 sites, have adopted WBE practices (WBE Collaborative, 2023). Through routine analysis of wastewater samples from dormitories and other campus facilities, health authorities can promptly identify potential infection clusters and implement preventive measures. This proactive approach curtails virus transmission among students, facilitating swift isolation and contact tracing, ultimately mitigating the impact of outbreaks on campus life.
The significant early warning capability of WBE is evident in COVID-19 surveillance, encompassing two crucial dimensions. Firstly, it signals the onset of an outbreak at its initial stage, and secondly, it forecasts an impending surge in the number of infected individuals. Noteworthy studies highlight the effectiveness of WBE in providing advanced indications of COVID-19 outbreaks (Rotondo et al., 2022; Contini et al., 2023), with reported early warning days varying from two days to three weeks for early COVID-19 trend detection. Karthikeyan et al. (2021) demonstrated accurate predictions of cases by a week and intermediate accuracy at three weeks using city wastewater. Similarly, Randazzo et al. (2020) identified positive SARS-CoV-2 results in wastewater samples twelve to sixteen days before the official reporting of COVID-19 cases in three out of seven wastewater catchment regions. Medema et al. (2020) identified a similar pattern, with wastewater samples indicating the presence of SARS-CoV-2 six days before the official reporting of the first cases. This detection was explicitly associated with the N3 gene, excluding the N1, N2, and E genes. Nemudryi et al. (2020) found SARS-CoV-2 RNA levels in wastewater exhibiting a lead time of two to four days before clinical results, and they were indicative of symptom onset by five to eight days. Ahmed et al. (2020a) emphasized the potential of wastewater monitoring as an early warning system, providing insights into the broader circulation of SARS-CoV-2, particularly in individuals with mild or no symptoms. However, Gerrity et al. (2021) propose that while wastewater surveillance may effectively function as a leading indicator for COVID-19 outbreaks, it may lag as an indicator for declining infection rates due to prolonged viral shedding. This introduces uncertainty concerning the timing and dynamics of infection rate trends as reflected in wastewater data. Moreover, most of the studies primarily examined wastewater rather than raw sewage when making early warning predictions. Additionally, Li et al. (2021) summarized that various methodological challenges can affect the accuracy of prevalence estimation in WBE.
One of the primary challenges in handling SARS-CoV-2 data revolves around the crucial normalization process. Raw sewage, which comprises a diverse range of liquids originating from toilets, sinks, showers, and dishwashing within a building, forms a complex matrix containing human waste components such as feces, urine, sputum, and nasal discharge. The viral levels present in sewage exhibit variability dependent on water usage patterns. To comprehensively understand such sewage, measurements of indicators associated with human waste or fluids are conducted simultaneously with the assessment of SARS-CoV-2 RNA load. Pepper Mild Mottle Virus (PMMoV) is systematically assessed with wastewater due to its acknowledged stability and minimal RNA load variation over time (Li et al., 2023a,b). This virus has been employed to detect pathogenic enteric viruses, as heightened RNA load of PMMoV often indicate increased levels of fecal contamination (Kitajima et al., 2018). Several studies consistently indicate that normalizing SARS-CoV-2 RNA load by PMMoV enhances correlations with COVID-19 cases at the community level. For example, Maal-Bared et al. (2023) observed that normalization led to an increase in rs by PMMoV in two wastewater treatment plants (WWTPs). Jafferali et al. (2021) recognized PMMoV as functionally effective, deeming it a potentially suitable internal reference standard for normalizing SARS-CoV-2 RNA load. Zhan et al. (2022) also reported improved correlations with COVID-19 cases when normalizing SARS-CoV-2 levels by PMMoV in campus data. However, an increasing number of reports cast doubt on the assumption that normalization by PMMoV contributes to the improvement of standardization and reporting in WBE data. Ai et al. (2021) reported that the normalization of the SARS-CoV-2 RNA load by PMMoV did not improve the correlation. Feng et al. (2021) reported that SARS-CoV-2 RNA load normalized by PMMoV reduced correlations in 8 out of 12 WWTPs. Nagarkar et al. (2022) also observed that the utility of PMMoV to normalize SARS-CoV-2 RNA load is not universal. These findings highlight the ongoing debate and complexity surrounding using PMMoV as a normalization factor in interpreting SARS-CoV-2 data in WBE. Additionally, although the associations between SARS-CoV-2 RNA load and COVID-19 cases are increasingly reported in the literature, it is noteworthy that most studies primarily concentrate on wastewater treatment plants (WWTPs).
This study aims to assess and compare the effects of PMMoV normalization on the correlations and early warning abilities related to SARS-CoV-2 RNA load in raw sewage and various factors, such as active COVID-19 cases, self-isolations, and their combination among all resident students at the University of Tennessee, Knoxville, over the course of one academic year. The findings of this study could enhance our comprehension of the potential applications and limitations of wastewater monitoring for COVID-19 surveillance, particularly within the context of raw sewage, on university campuses.
Materials and methods
Raw sewage sampling
In the summer of 2020, the University of Tennessee adopted WBE to proactively detect COVID-19 cases in student residence halls. These halls housed 7,486 individuals in Fall 2020 and 6,781 in Spring 2021, representing a microcosm of the campus community, which consisted of 30,559 students during the 2020 academic year. Over the course of the academic year from September 14, 2020, to September 21, 2021, sewage samples were regularly collected from 18 dormitories, 15 fraternities, and 14 sororities. Detailed information regarding the occupants of these student residence halls during the fall 2020 and spring 2021 semesters can be found in Table 1. Samples were taken downstream of dispense valves or sewer manholes just before merging with other sewer lines to ensure targeted sampling from buildings with distinct student populations. Sampling commenced at 8:00 am, which corresponds to a time when human activity typically surges, potentially leading to increased viral shedding from individuals and subsequently higher viral loads in the collected samples (Li et al., 2023a). Grab samples (>50 mL) were collected using a stainless-steel telescopic rod pole swivel dipper water swing sampler or a sterile Nalgene bottle. Samples were promptly transported to a Biosafety Level-2 laboratory within a cooler containing ice for processing within three hours of collection. Data utilized for analysis spanned from November 9, 2020, to June 4, 2021, coinciding with the commencement of detection for PMMoV.
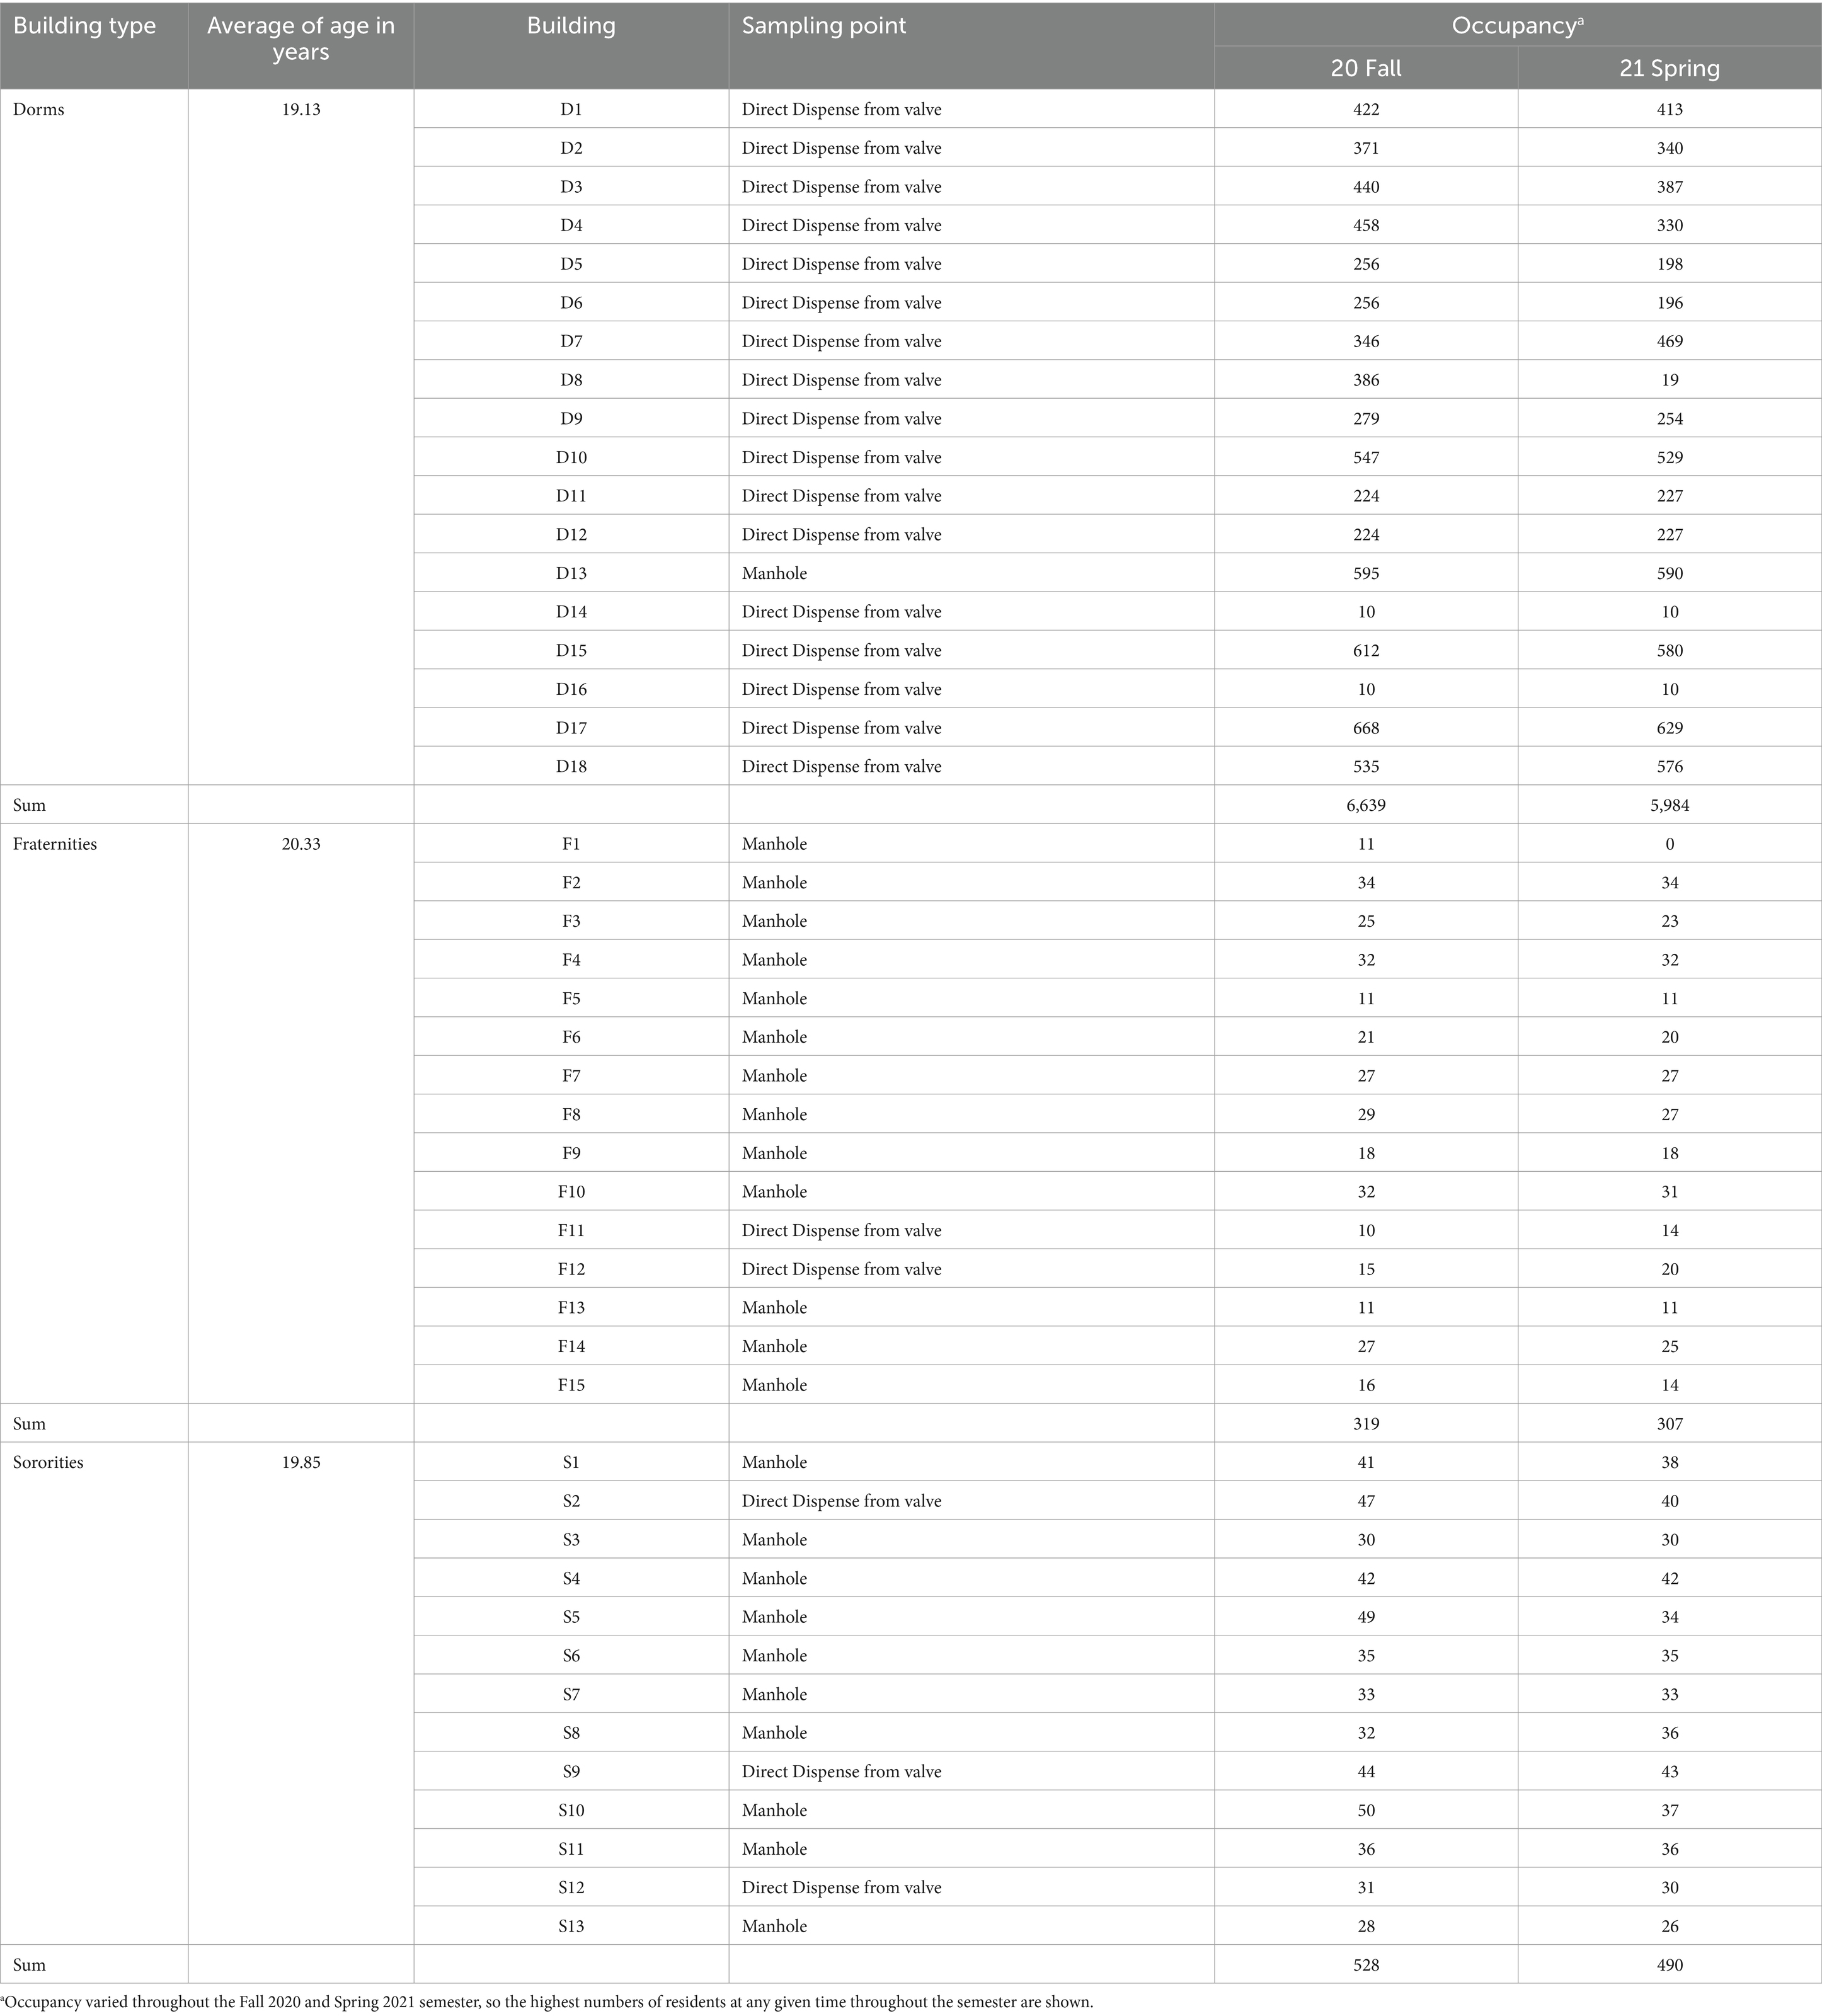
Table 1. Characteristics of student residence halls in the University of Tennessee, Knoxville.
Sample processing
The initial RNA load of SARS-CoV-2 and PMMoV RNA was promptly determined from 50 mL of thoroughly mixed raw sewage samples within 5 h of collection. Detailed information regarding the sampling procedure is available in the work by Ash et al. (2023). Subsequently, the raw sewage samples underwent a pasteurization process for 2 h at 60°C, followed by centrifugation at 5,000 × g for 10 min and filtration through 0.45 μm and 0.22 μm nitrocellulose filters to eliminate large suspended particulate matter. The filtered samples were concentrated using ultrafiltration with an Amicon Ultra-15 filtration device (EMD Millipore, Burlington, MA). The Amicon Ultra was centrifuged at room temperature at 4,000 × g for 30 min (Swing-arm rotor) or 5,000 × g for 20 min (Fixed-angle rotor). The resulting concentrate, approximately (~250 μL), was transferred to 2 mL DNA LoBind tubes, and RNA extractions were performed using a Qiagen viral RNA Mini Kit (Qiagen, Valencia, CA, USA). In brief, 60 μL of RNA was extracted from a homogenized sample using the Qiagen viral RNA Mini Kit, following the manufacturer’s instructions. This process involved initial lysis of the sample containing viral RNA, followed by binding the RNA to a specialized spin column where contaminants were removed through washing steps. After drying the column, the purified RNA was eluted using an elution buffer, resulting in concentrated RNA suitable for RT-qPCR. DNase/RNase-free water served as the extraction negative control. Throughout the procedure, precautions were taken to minimize the potential for inhibitors that could interfere with downstream RT-qPCR analysis. All RNA samples were stored at −80°C and subjected to RT-qPCR analysis within one day of RNA extraction.
RT-qPCR
RT-qPCR was employed to quantify the RNA load of SARS-CoV-2 and PMMoV RNA in each sample. Comprehensive details regarding the RT-qPCR methodology can be found in the publication by Ash et al. (2023). The CDC primer/probe assay for SARS-CoV-2 N1 was utilized, and quantification was conducted using the TaqPath 1-Step RT-qPCR Master Mix, CG (Thermo Fisher Scientific) on an Applied Biosystems QuantStudios 7 Pro Real-Time PCR System instrument (Figure 1).
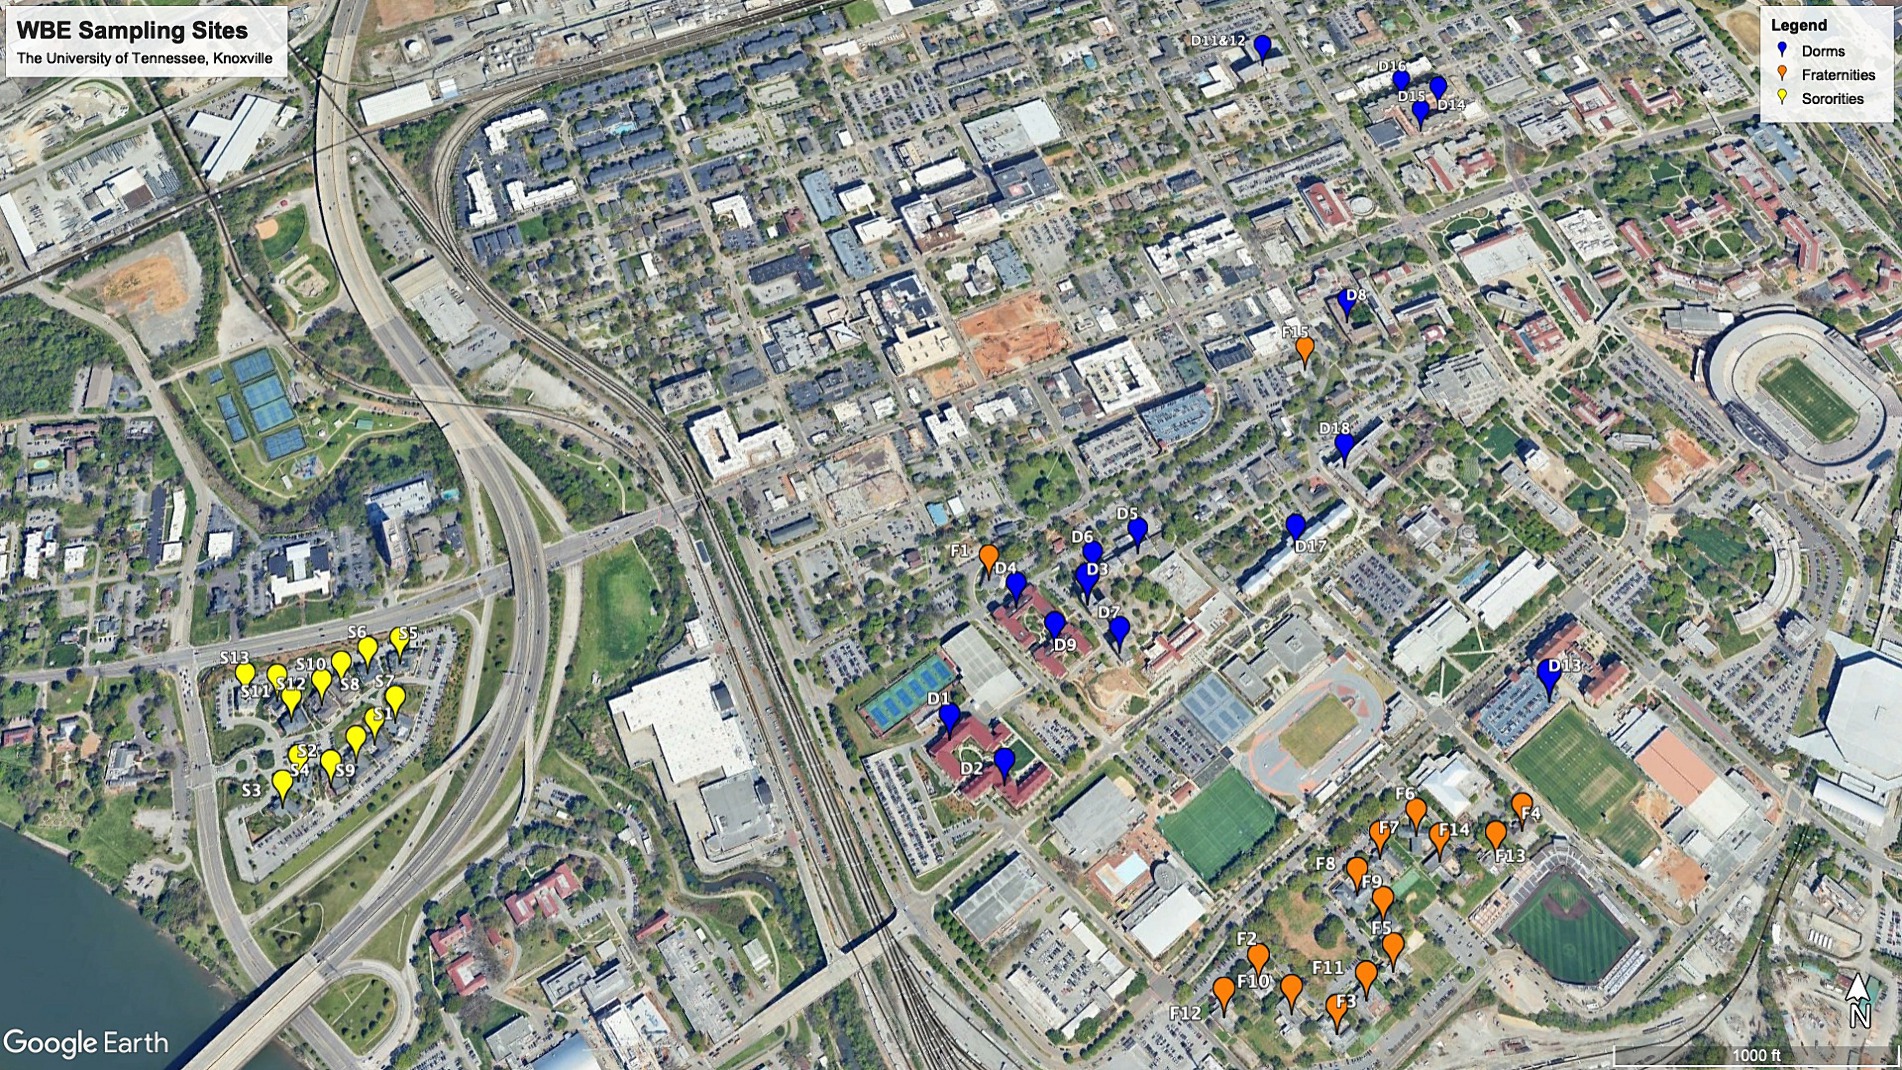
Figure 1. WEB sampling sites in the University of Tennessee, Knoxville.
Each 20 μL reaction comprised 5 μL of 4X Master Mix (Thermo Fisher Scientific), 0.25 μL of 10 μmol/L probe, 1 μL each of 10 μmol/L forward and reverse primers, 7.75 μL of nuclease-free water, and 5 μL of nucleic acid extract. The reagents were pipetted into 96-well plates and vortexed for 10 s. Thermocycling conditions were as follows: uracil-DNA glycosylase incubation for 2 min at 25°C, reverse transcription for 15 min at 50°C, activation of the Taq enzyme for 2 min at 95°C, and two-step cycling for 3 s at 95°C and 30 s at 55°C for 45 cycles. A positive test result was defined as an exponential fluorescent curve that crossed the threshold within 40 cycles (cycle threshold [Ct] <40).
PMMoV quantification was performed using RT-qPCR with the TaqPath 1-Step RT-qPCR Master Mix, CG (Thermo Fisher Scientific) on a QuantStudios 7 Pro instrument. In each 20 μL reaction, the components included 5 μL of 4X Master Mix (Thermo Fisher Scientific), 0.5 μL of 10 μmol/L probe, 1.8 μL each of 10 μmol/L forward and reverse primers, 8.9 μL of nuclease-free water, and 2 μL of nucleic acid extract. The reagents were pipetted into 96-well plates and vortexed for 10 s. Thermocycling conditions were as follows: uracil-DNA glycosylase incubation for 2 min at 25°C, reverse transcription for 15 min at 50°C, activation of the Taq enzyme for 10 min at 95°C, and two-step cycling for 30 s at 95°C and 1 min at 60°C for 40 cycles.
Each RT-qPCR run incorporated a series of three positive and negative controls, where the positive control comprised Mastermix and DNase/RNase-free water. All RT-qPCR reactions were conducted in triplicate, and results were considered valid only if the positive control yielded a positive outcome and the negative control remained negative. A sample was deemed positive only when all replicates were positive, each falling within the linear range of the standard curve.
The efficiency of the N1 standard curve was determined to be 94.7% (R2 = 1). The final quantification of SARS-CoV-2 RNA was calculated as the mean of three replicates of virus copies. The RT-qPCR outputs were subsequently converted to copies per liter. Notably, the detection limit for SARS-CoV-2 and PMMoV in this study was established at 20 and 10 copies/L, respectively (Bustin et al., 2009).
Data analysis
Statistical analysis was conducted to investigate the relationship between SARS-CoV-2 RNA load and reported cases during a significant event. Data reflecting daily new cases at residence-specific levels were utilized for statistical analysis from November 9, 2020, to June 04, 2021. To facilitate the analysis, weekly case counts were aggregated in three ways: raw sewage sample collection one week before, during the week of, and one week after active cases and self-isolations. Spearman’s correlation assessed the relationship between raw and PMMoV-normalized SARS-CoV-2 RNA load and the aggregated case counts. The use of Spearman’s correlation avoided the assumptions of normality and the absence of outliers associated with the Pearson correlation (Hauke and Kossowski, 2011). The correlation coefficient’s magnitude indicated the association’s strength and direction, measuring how closely the points aligned along the monotonic association. Non-detectable values in viral data were considered as twenty for statistical purposes, aligning with the detection limitation of N1.
Results
Active and isolation clinical COVID-19 cases
The Student Health Center provides valuable insights into the prevalence of COVID-19 on campus, reporting both active and isolated cases. Throughout the study period, an analysis of the data reveals a cumulative total of 2,321 active cases and 4,202 isolated cases spread across the 46 residence halls from September 14, 2020, to June 04, 2021 (Figure 2). The onset of the pandemic at the campus was marked by a significant surge in COVID-19 cases during the initial wave in September, with 778 active cases and 1,480 isolated cases. An in-depth analysis of specific timeframes throughout the study period reveals distinct waves of COVID-19 incidence. Following the September surge, subsequent months displayed varying degrees of activity. In October, there were 208 active cases and 345 isolation cases, indicating a notable decline from the initial peak. November saw a resurgence with 310 active cases and 628 isolation cases, suggesting a renewed increase in viral spread. December recorded 144 active cases and 55 isolation cases, signaling a potential decrease in cases toward the end of the year. As the new year began, January experienced a further rise with 170 active cases and 161 isolation cases. The trend continued in February with 292 active cases and 663 isolation cases, reaching another peak. March and April demonstrated a gradual decline, with 288 active cases, 757 isolation cases, 125 active cases, and 185 isolation cases, respectively. May saw a minimal presence, with only five active cases and two isolation cases, indicating a substantial reduction in COVID-19 incidence. Notably, during the winter break, spanning from December 12, 2020, to January 13, 2021, there remained a cumulative total of 160 active cases and 71 isolation cases, underscoring the persistent impact of the virus even during the holiday period.
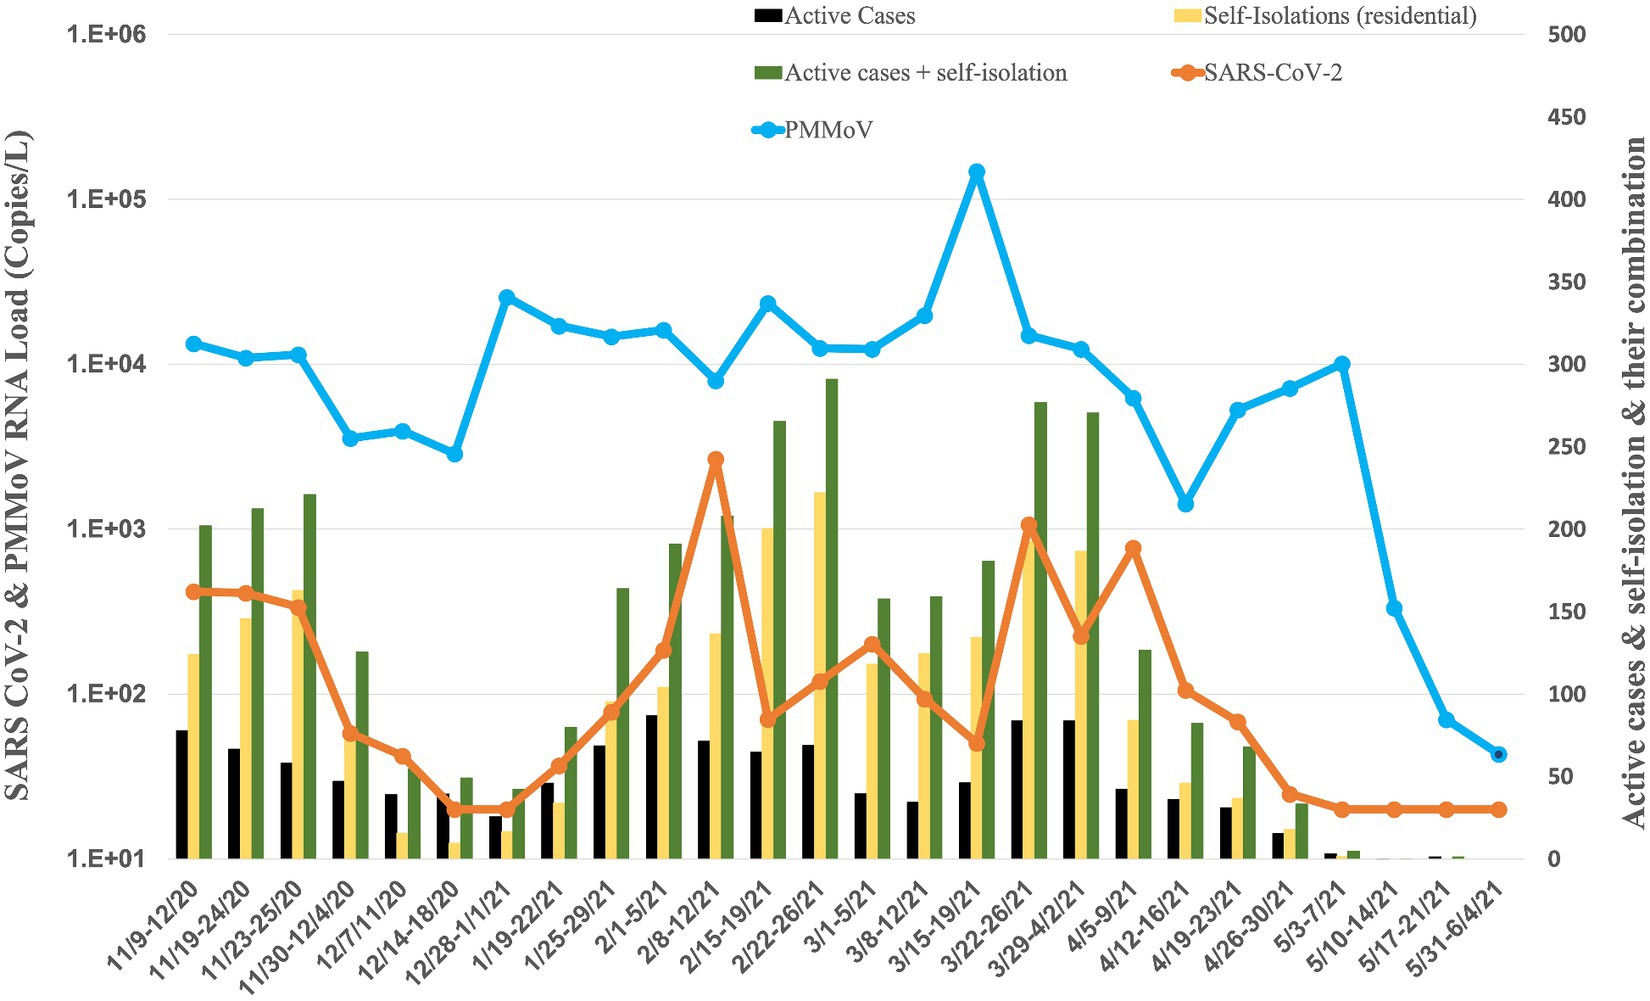
Figure 2. Average RNA load of SARS-CoV-2 in all residence halls, and active cases, and self-isolation students in the residential halls.
The RNA load of SARS-CoV-2 and PMMoV at different building types
The university implemented raw wastewater surveillance as a complementary strategy to clinical testing, aiming to detect the presence of SARS-CoV-2 on campus. This approach is particularly valuable in capturing individuals who may be asymptomatic or have mild symptoms and thus might not actively seek clinical screening. A comprehensive overview of the WBE project at the University of Tennessee, Knoxville, is provided in our paper by Ash et al. (2023). Figures 2–5 illustrate the measured viral copies per liter (copies/L) of the N1 genes across all residence halls, dormitories, fraternities, and sororities. The RNA load of SARS-CoV-2 RNA in raw sewage samples were 2.75 × 10² ± 5.49 × 10² copies/L for all residence halls, 1.97 × 10² ± 3.48 × 10² copies/L for dormitories, 6.93 × 10² ± 2.12 × 10³ copies/L for fraternities, and 1.30 × 10² ± 1.91 × 10² copies/L for sororities. Correspondingly, the RNA load of PMMoV RNA across all samples were 1.55 × 10⁴ ± 2.79 × 10⁴, 1.57 × 10⁴ ± 1.20 × 10⁴, 3.07 × 10⁴ ± 9.98 × 10⁴, and 5.26 × 10³ ± 2.74 × 10³ copies /L for all residence halls, dormitories, fraternities, and sororities, respectively.
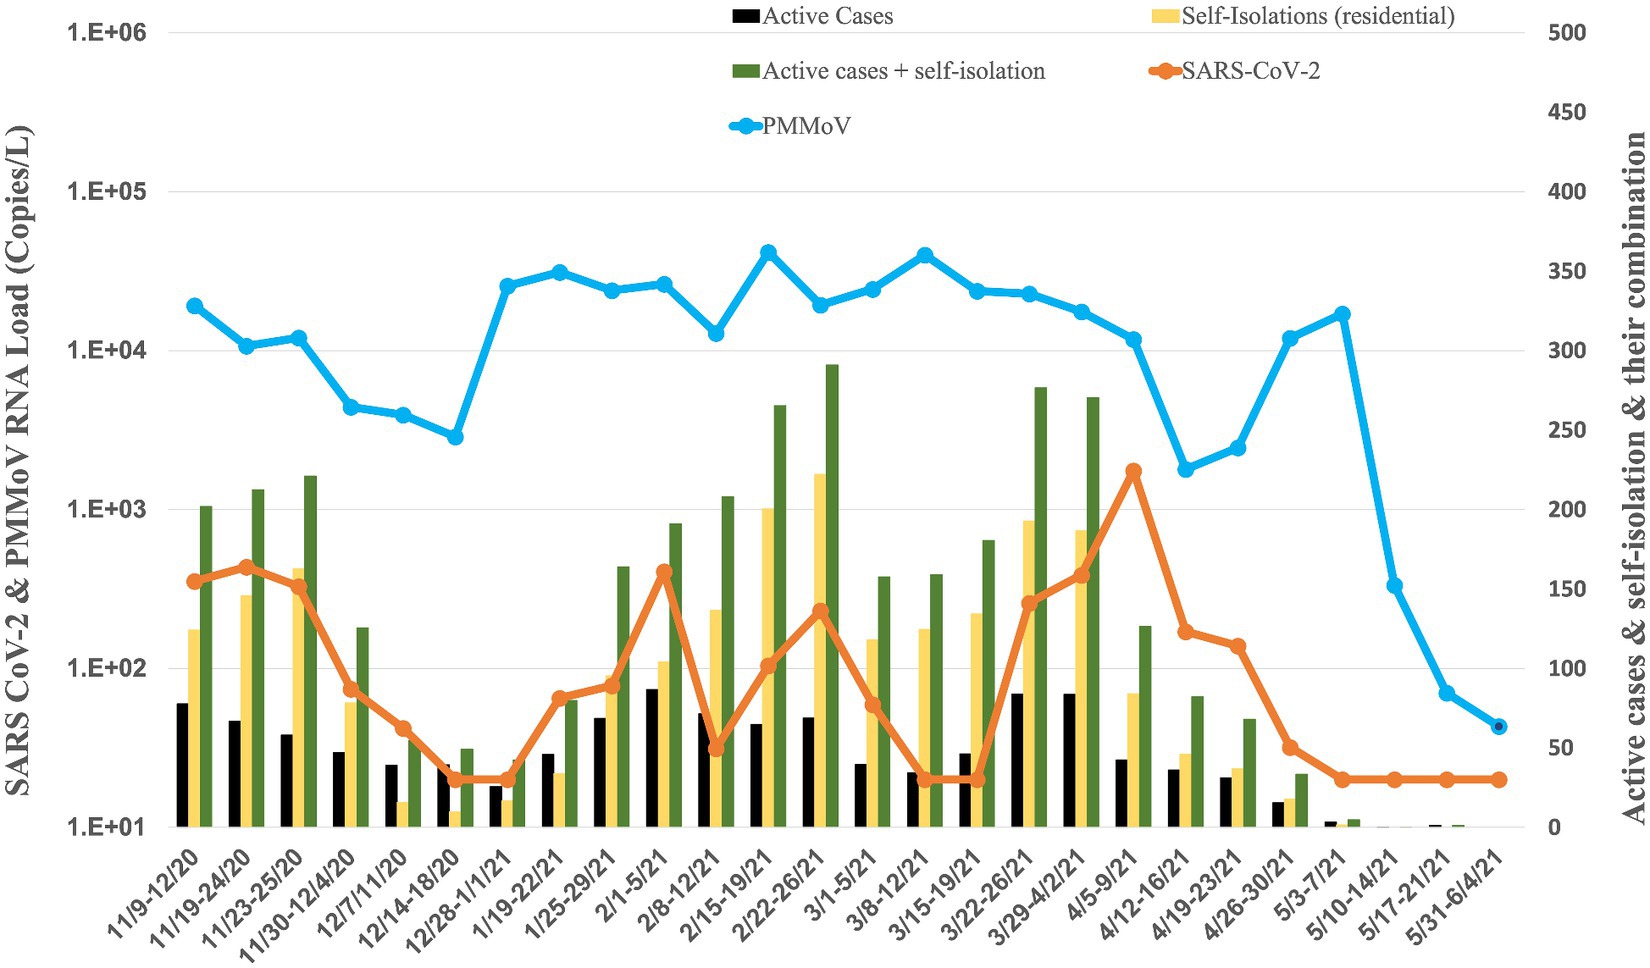
Figure 3. Average RNA load of SARS-CoV-2 in dorms, and active cases, and self-isolation student in the residential halls.
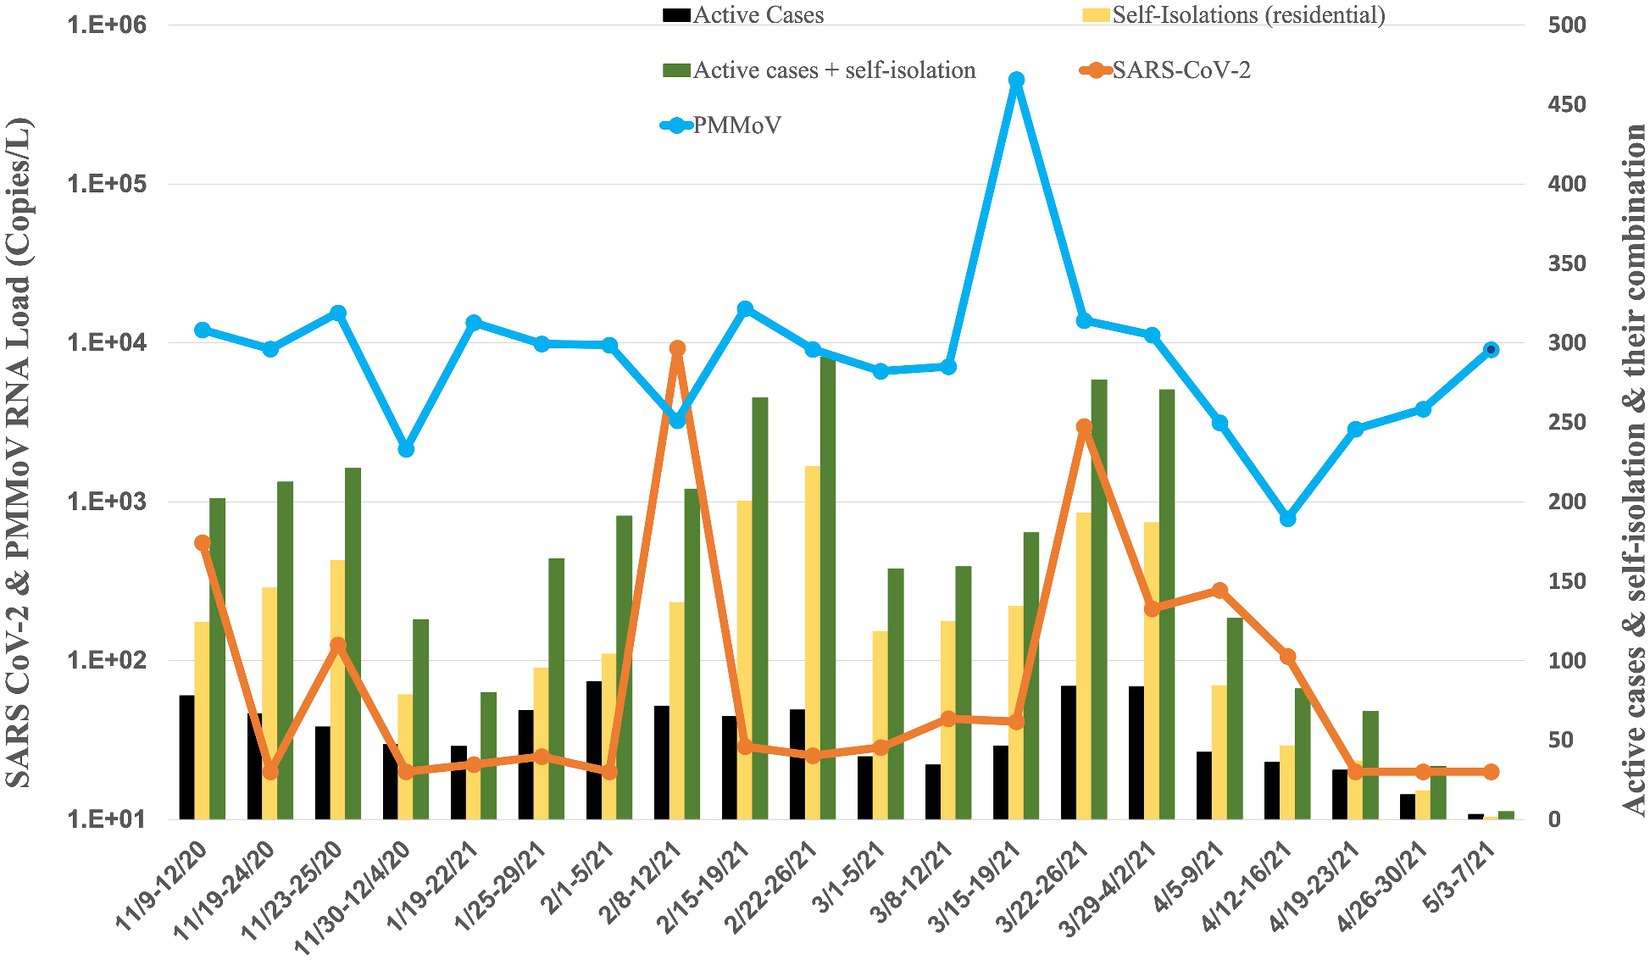
Figure 4. Average RNA load of SARS-CoV-2 in fraternity, and active cases, and self-isolation student in the residential halls.
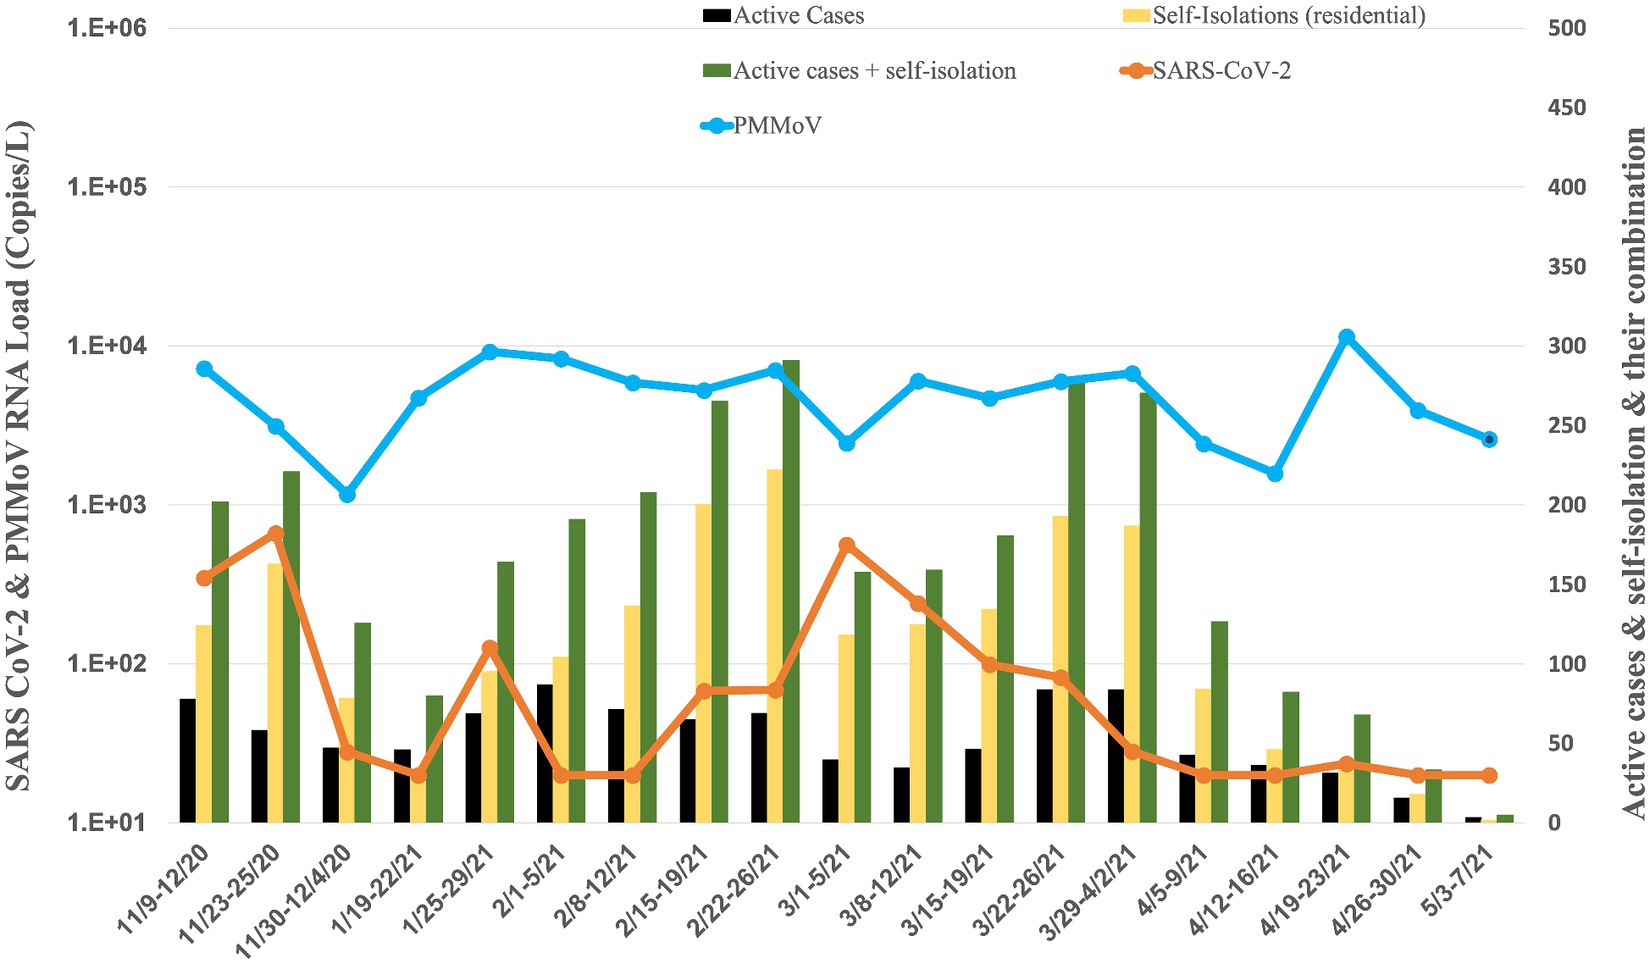
Figure 5. Average RNA load of SARS-CoV-2 in sororities, active cases, and self-isolation students in the residential halls.
All residence halls
Analyzing data of all residence halls (covering 18 dormitories, 15 fraternities, and 14 sororities) from November 2020 to May 2021, the temporal dynamics revealed fluctuating RNA load (Figure 2). Notably, in November 2020, the RNA load was 3.06 × 10² ± 1.70 × 10² copies/L, followed by a decrease in December 2020 to 2.74 × 101 ± 1.28 × 101 copies/L. January 2021 showed a slight increase to 5.74 × 101 ± 2.90 × 101 copies/L, while February 2021 witnessed a notable rise to 7.61 × 10² ± 1.27 × 10³ copies/L. Subsequent months displayed varying RNA load, with March at 3.28 × 10² ± 4.21× 10² copies/L, April at 2.43 × 10² ± 3.55 × 10² copies/L, and May at non-detectable.
The RNA load of PMMoV also exhibited variations across all residence halls during the same period (Figures 2–4, 6). In November 2020, the PMMoV RNA load was 9.84 × 10³ ± 4.32 × 10³ copies/L, increasing in December 2020 to 1.08 × 10⁴ ± 1.28 × 10⁴ copies/L. January 2021 recorded a further increase to 1.59 × 10⁴ ± 1.70 × 10³ copies/L. February 2021 exhibited a relatively stable RNA load at 1.50 × 10⁴ ± 6.53 × 10³ copies/L. March 2021 substantially increased to 4.15 × 10⁴ ± 5.97 × 10⁴ copies/L. April 2021 decreased to 5.04 × 10³ ± 2.53 × 10³ copies/L, and in May 2021, the RNA load was 2.63 × 10³ ± 4.97 × 10³ copies/L.
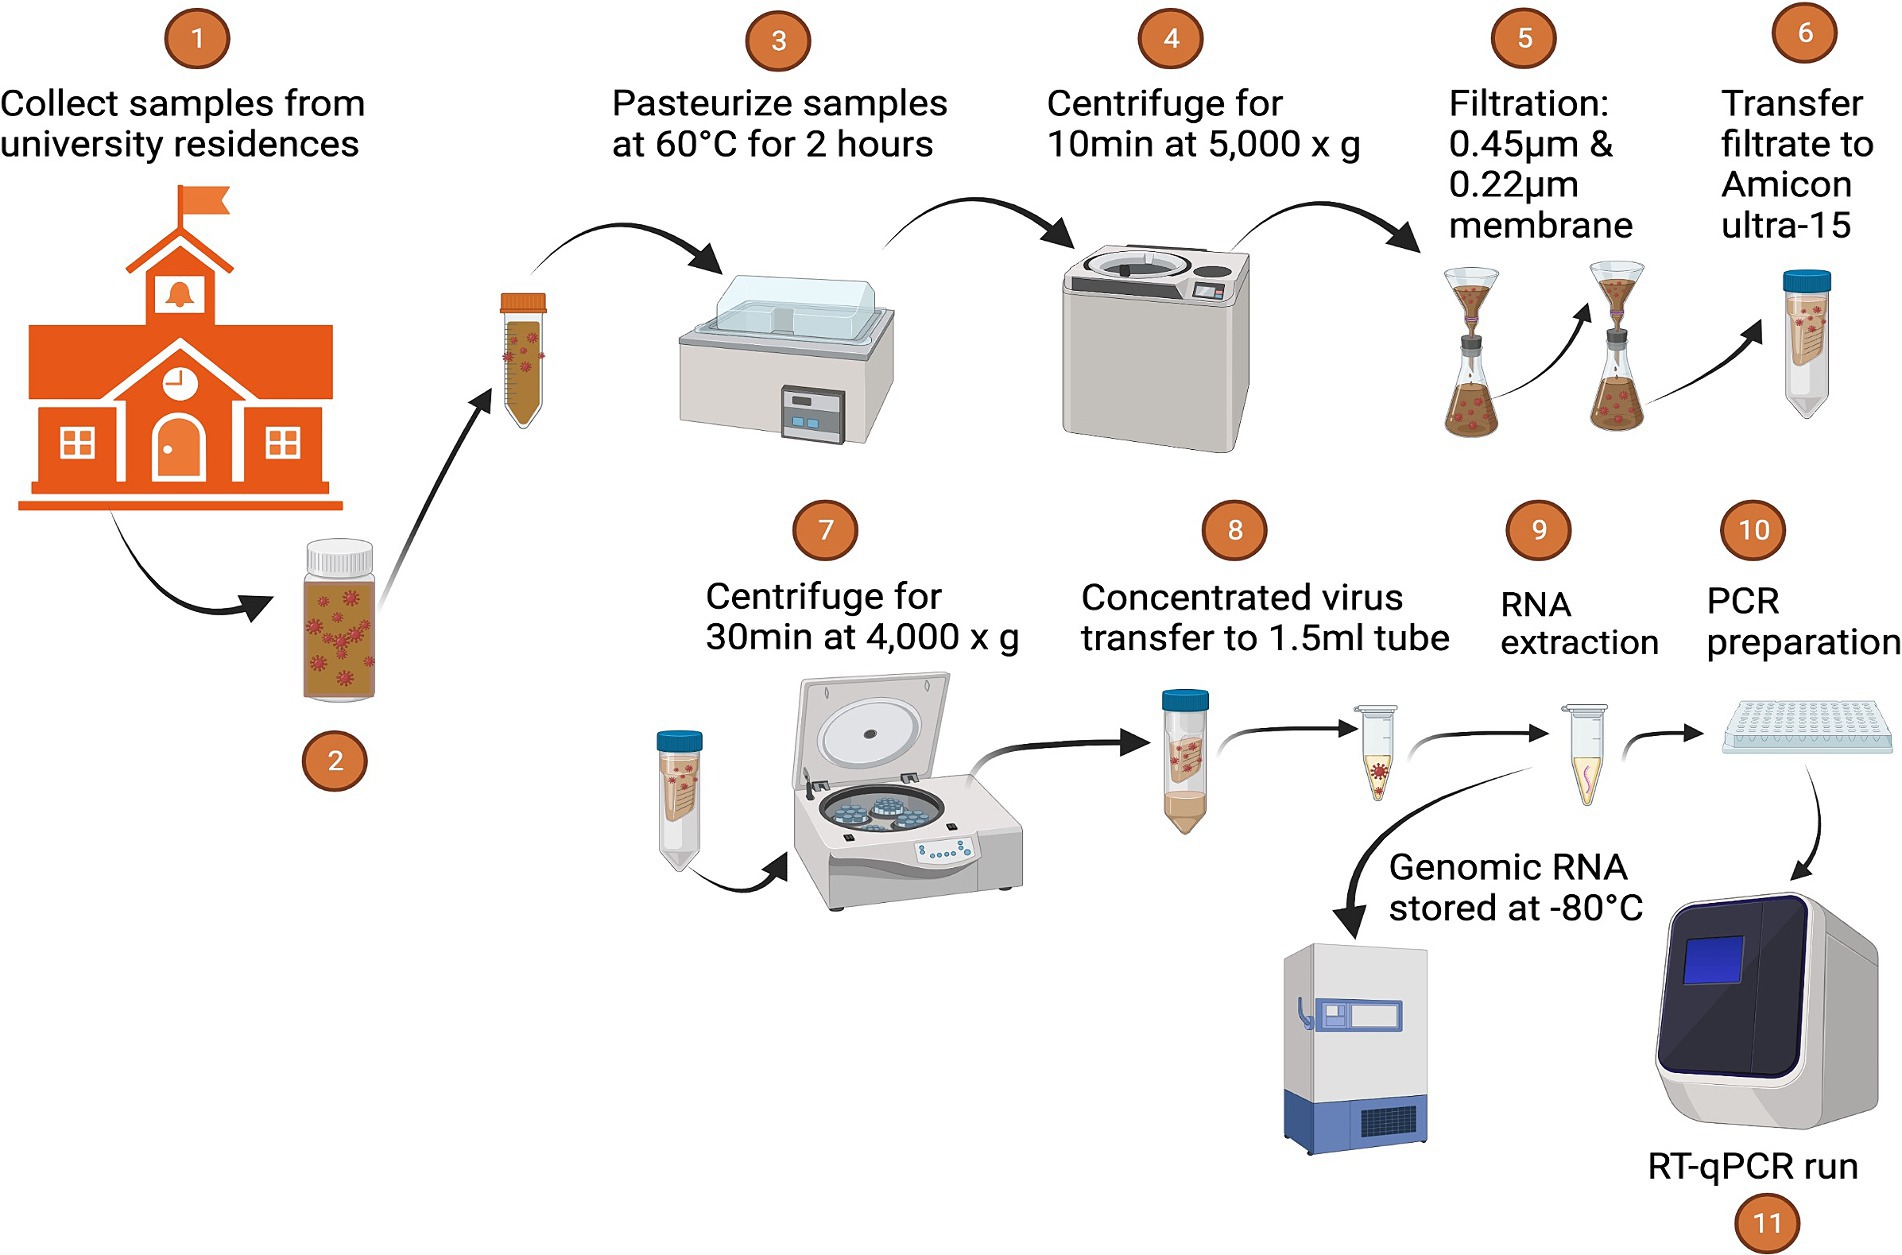
Figure 6. Sample processing.
Dormitories
The RNA load of SARS-CoV-2 in 18 dormitories exhibited temporal variations from November 2020 to May 2021 (Figure 3). In November 2020, the RNA load were 2.98 × 10² ± 1.56 × 10² copies per liter (copies/L), indicating a moderate level. This was followed by a notable decrease in December 2020, with a RNA load of 2.74 × 101 ± 1.28 × 101 copies/L, suggesting a significant reduction. January 2021 showed a slight increase to 7.16 × 101 ± 9.22 × 101 copies/L, followed by a moderate rise in February 2021, with a RNA load of 1.94 × 10² ± 1.65 × 10³ copies/L. March 2021 witnessed a similar level at 1.49 × 10² ± 1.66× 10² copies/L, while April 2021 displayed a substantial increase to 5.25 × 10² ± 8.23 × 10² copies/L. In May 2021, the RNA load decreased to a non-detectable level.
Concurrently, the RNA load of PMMoV in dormitories exhibited variations from November 2020 to May 2021 (Figure 3). In November 2020, the PMMoV RNA load was 1.16 × 10⁴ ± 6.08 × 10³ copies/L. December 2020 showed a similar level at 1.08 × 10⁴ ± 1.28 × 10⁴ copies/L. January 2021 increased to 2.75 × 10⁴ ± 5.10 × 10³ copies/L. February 2021 exhibited a relatively stable RNA load at 2.50 × 10⁴ ± 1.23 × 10⁴ copies/L. March 2021 displayed a similar level at 2.57 × 10⁴ ± 8.42 × 10³ copies/L. April 2021 decreased to 7.00 × 10³ ± 5.63 × 10³ copies/L, and in May 2021, the RNA load was 4.38 × 10³ ± 8.45 × 10³ copies/L.
Fraternities
The RNA load of SARS-CoV-2 in 15 fraternities exhibited dynamic changes from November 2020 to May 2021 (Figure 4). In November 2020, the RNA load was 1.80 × 10² ± 2.53× 10² copies per liter (copies/L). January 2021 decreased to 2.36 × 101 ± 1.89 × 100 copies/L, indicating a substantial reduction. February 2021 recorded a significant increase to 2.34× 10³ ± 4.62 × 10³ copies/L, suggesting a resurgence. The RNA load remained elevated in March 2021 at 6.60 × 10² ± 1.30 × 10³ copies/L. April 2021 displayed a moderate level at 11.06 × 10² ± 1.21× 10² copies/L; in May 2021, the RNA load was non-detectable.
Simultaneously, the RNA load of PMMoV in fraternities exhibited varying levels from November 2020 to May 2021 (Figures 6–4). In November 2020, the PMMoV RNA load was 9.71 × 10³ ± 5.67 × 10³ copies/L. January 2021 increased to 1.16 × 10⁴ ± 2.50 × 10³ copies/L. February 2021 exhibited a similar level at 9.62 × 10³ ± 5.40 × 10³ copies/L. March 2021 recorded a substantial increase to 9.86 × 10⁴ ± 1.99 × 10⁵ copies/L. April 2021 displayed a decrease to 2.66 × 10³ ± 1.31 × 10³ copies/L. In May 2021, the RNA load was 9.07 × 10³ copies/L.
Sororities
The RNA load of SARS-CoV-2 in 14 sororities displayed varying levels from November 2020 to May 2021 (Figure 5). In November 2020, the RNA load was 3.46 × 10² ± 3.18× 10² copies per liter (copies/L). January 2021 decreased to 7.34 × 101 ± 7.55 × 101 copies/L, indicating a substantial reduction. February 2021 recorded a further decrease to 4.41× 101 ± 2.78× 101 copies/L. March 2021 exhibited a modest increase to 2.02 × 10² ± 2.15× 10² copies/L. April 2021 displayed a lower RNA load at 2.09 × 101 ± 1.79× 100 copies/L. In May 2021, the RNA load was non-detectable, signifying a significant decrease or absence of viral presence in the raw sewage samples from sororities during that specific month.
Concurrently, the RNA load of PMMoV in sororities displayed varying levels from November 2020 to May 2021 (Figure 5). In November 2020, the PMMoV RNA load was 3.84 × 10³ ± 3.09 × 10³ copies/L. January 2021 increased to 6.97 × 10³ ± 3.81 × 10³ copies/L. February 2021 exhibited a similar level at 6.64 × 10³ ± 1.35 × 10³ copies/L. March 2021 decreased to 5.18 × 10³ ± 1.70 × 10³ copies/L. April 2021 displayed a further decrease to 4.86 × 10³ ± 4.53 × 10³ copies/L. In May 2021, the RNA load was 2.60 × 10³ copies/L.
Impacts of normalization on correlations between SARS-CoV-2 RNA load and COVID-19 cases
Tables 1, 2 provide a comprehensive summary of the Spearman correlation (rs) values, elucidating the strength of associations between unnormalized and normalized SARS-CoV-2 RNA load by PMMoV and various factors such as active cases, self-isolations, and the combination of active cases with self-isolations. The analysis encompasses all residence halls, dormitories, fraternities, and sororities. Interpretation of rs values adheres to the criteria outlined by von Sperling et al. (2020). Correlations with a rs exceeding 0.7 are considered strong; those ranging between 0.4 and 0.7 indicate moderate correlations and values falling between 0 and 0.4 denote weak associations. Negative values signify weakened associations, while positive values suggest improved associations.
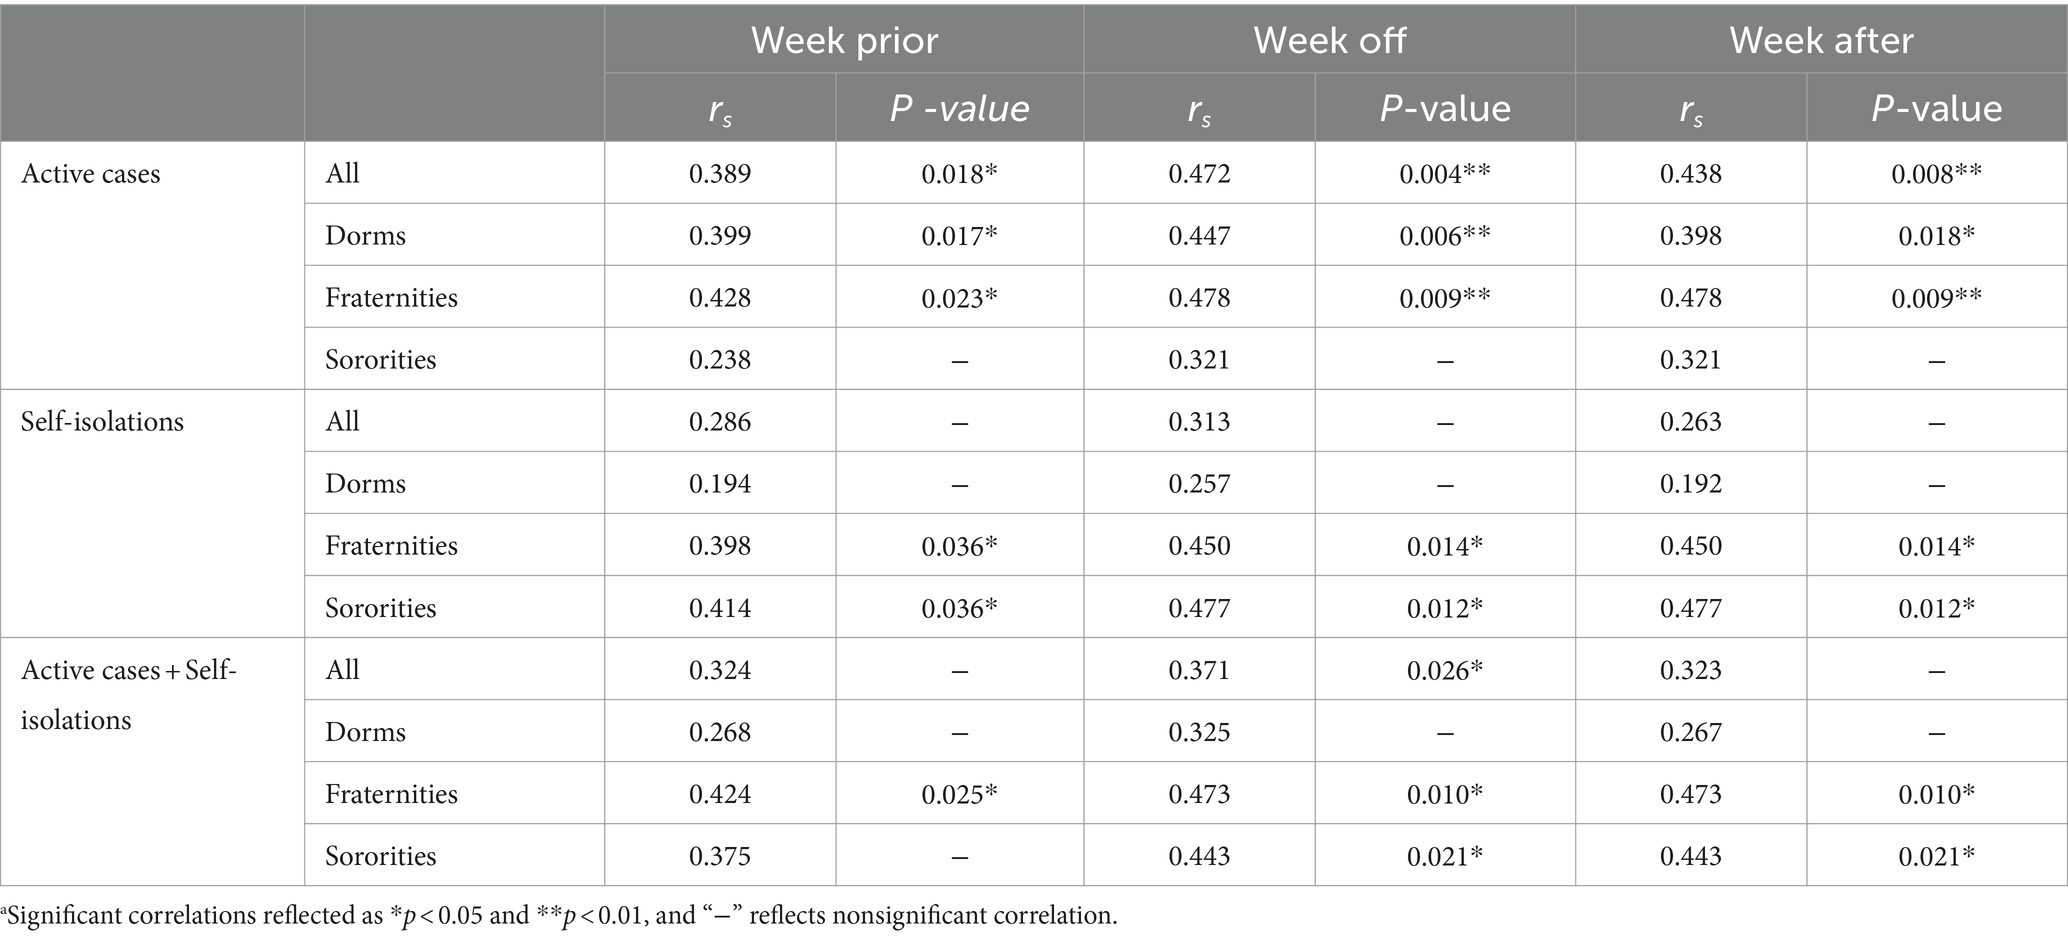
Table 2. Spearman correlation coefficients (rs) and significance p-values of wastewater measures (one-week prior average, at the week, and one-week after) against active, self-isolation and active cases plus self-isolation data without normalization.a
Active cases, both independently and in combination with self-isolations, demonstrated noteworthy correlations with SARS-CoV-2 RNA load across all residential halls, spanning from moderate to weak levels (rs = 0.472, p = 0.004; rs = 0.313, p = 0.063; rs = 0.371, p = 0.026). Post-normalization, the correlations involving either active cases alone or the combined metric of active cases with self-isolations and SARS-CoV-2 RNA load diminished, revealing no statistically significant associations.
In dormitories, active cases displayed significant correlations with SARS-CoV-2 RNA load, characterized by moderate levels (rs = 0.447, p = 0.006). Nevertheless, these correlations waned after normalization by PMMoV, resulting in statistically insignificant associations with SARS-CoV-2 RNA load.
Within fraternities, active cases, self-isolations, and their combination exhibited substantial correlations with SARS-CoV-2 RNA load, marked by moderate correlation levels (rs = 0.478, p = 0.009; rs = 0.450, p = 0.014; rs = 0.473, p = 0.010). However, normalization by PMMoV led to a reduction in these correlations, rendering the associations with SARS-CoV-2 RNA load statistically insignificant.
Similarly, self-isolations and the combined metric of active cases with self-isolations showed significant correlations with SARS-CoV-2 RNA load within sororities, characterized by moderate correlation levels (rs = 0.321, p = 0.103; rs = 0.477, p = 0.012; rs = 0.443, p = 0.021). Yet, normalization by PMMoV resulted in a reduction of these correlations, leading to statistically insignificant associations with SARS-CoV-2 RNA load.
Impacts of normalization correlations and early warning of COVID-19 cases trend
Tables 1, 2 elucidate the differences in rs values between unnormalized and normalized datasets. These values encapsulate the correlations between SARS-CoV-2 RNA load and various factors including active cases, self-isolations, and the combination of active cases with self-isolations. The analysis includes both a seven-day advance and a seven-day lag to discern lead times between WBE data and clinical cases, specifically emphasizing diverse student residence halls.
Preceding SARS-CoV-2 RNA load by one week demonstrated weakly significant correlations with active cases across all residential halls, while one week after, moderate correlations were observed with active cases (rs = 0.398, p = 0.018; rs = 0.438, p = 0.008). Importantly, weakly insignificant correlations were noted between the one-week advance and one-week lag of SARS-CoV-2 RNA load and both self-isolations and the combination with active cases.
Similarly, a seven-day advance and a seven-day lag of SARS-CoV-2 RNA load revealed weakly significant correlations with active cases across dormitories (rs = 0.399, p = 0.017; rs = 0.398, p = 0.018). Notably, weakly insignificant correlations were observed between the one-week advance and one-week lag of SARS-CoV-2 RNA load and both self-isolations and the combination with active cases (Table 3).
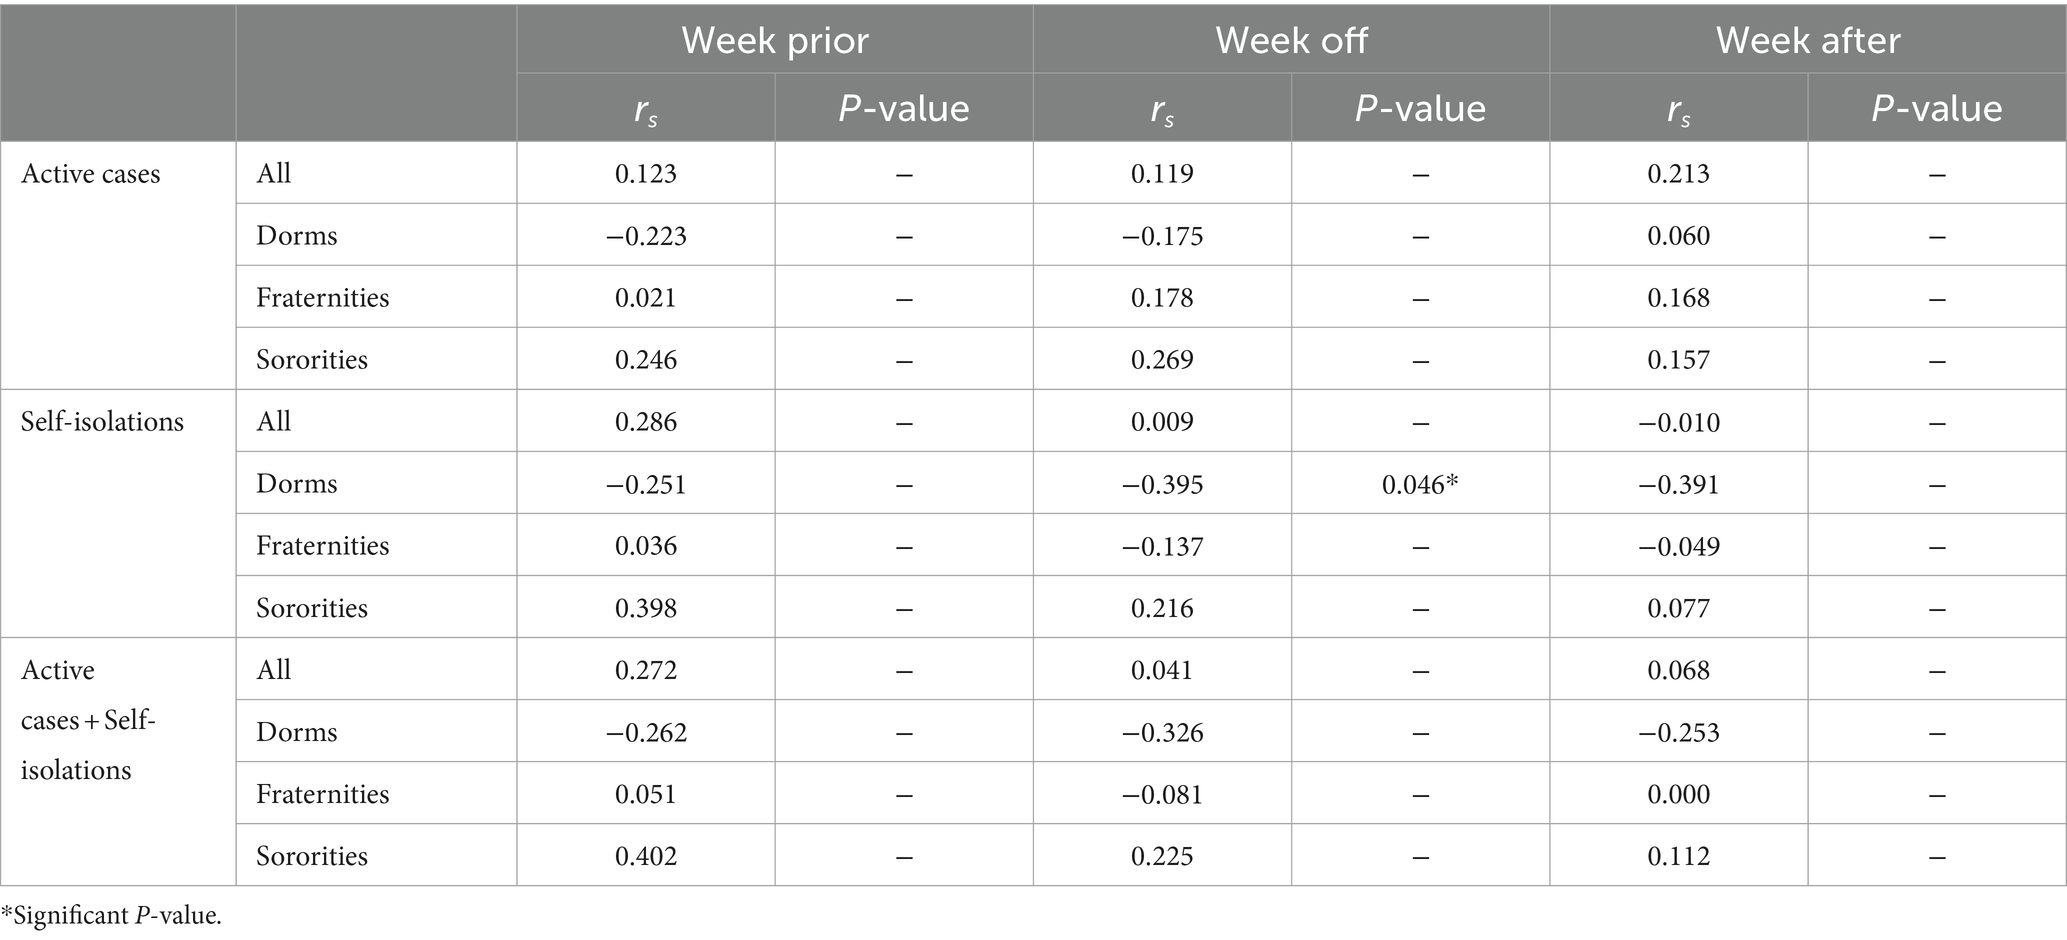
Table 3. Spearman correlation coefficients (rs) and significance p-values of wastewater measures (one-week prior average, at the week, and one week after) against active, self-isolation, and active cases plus self-isolation data with normalization (SARS-CoV-2/PMMoV).a
A seven-day advance and a seven-day lag of SARS-CoV-2 RNA load exhibited moderately significant correlations with active cases and the combination with self-isolations among fraternities (rs = 0.418, p = 0.023; rs = 0.478, p = 0.009; rs = 0.424, p = 0.025; rs = 0.473, p = 0.010). Furthermore, weakly significant correlations were identified between the one-week advance of SARS-CoV-2 RNA load and self-isolations, while a moderate correlation was observed for the one-week lag.
A seven-day advance and a seven-day lag of SARS-CoV-2 RNA load exhibited moderately significant correlations with self-isolations among sororities (rs = 0.414, p = 0.036; rs = 0.477, p = 0.012). Furthermore, moderate significant correlations were identified between the one-week lag of SARS-CoV-2 RNA load and the combination of active cases and self-isolations.
Normalization by PMMoV resulted in either a reduction or an insignificant impact on rs values for a seven-day advance and a seven-day lag of SARS-CoV-2 RNA load with active cases, self-isolations, and their combinations across all building types in this study.
Discussion
Integrating WBE into public health surveillance is progressing as a strategic response to the challenges posed by the COVID-19 pandemic. A crucial aspect of this approach is understanding the correlations between SARS-CoV-2 RNA load and COVID-19 cases, particularly in communities characterized by mobile populations and significant temporal fluctuations. This significance is accentuated in situations where reported clinical case numbers may not accurately reflect the actual residents in these communities.
In our study, we observed notable variations in SARS-CoV-2 RNA load among different building types, irrespective of whether they accommodated high (>200) or low (<50) student numbers in the corresponding residence halls. Our findings underscore a consistent alignment between SARS-CoV-2 RNA load in raw sewage from all student residence halls, as assessed through RT-qPCR, and the trends observed in active cases of COVID-19 across all residence halls. These results are in harmony with existing research, affirming that SARS-CoV-2 RNA load serve as an effective tool for estimating the dynamics of COVID-19 cases within diverse communities. Medema et al. (2020) reported a significant correlation between SARS-CoV-2 RNA load and cumulative COVID-19 prevalence, even in situations of low prevalence in the Netherlands. Xiao et al. (2022) documented that SARS-CoV-2 RNA load preceded new cases during the first wave of COVID-19 in MA, USA. Additionally, Ai et al. (2021) found a robust correlation between SARS-CoV-2 RNA load and confirmed cases in 8 sewersheds. Wurtzer et al. (2020) similarly reported correlations between SARS-CoV-2 RNA load and the number of symptomatic or non-symptomatic COVID-19 patients at local or regional scales. Furthermore, Schmitz et al. (2021) discovered a correlation between clinical data and corresponding sewage SARS-CoV-2 RNA load in student dorms at the University of Arizona during the fall semester of 2020.
Given that dormitories, fraternities, and sororities represented as microcosms of the campus, our study revealed that the SARS-CoV-2 RNA load identified in dormitories and fraternities correspondingly mirrored the trends observed in COVID-19 cases across all student residence halls. The greater proportion of undergraduates residing in dormitories might provide a more complete picture of the COVID-19 situation on campus. Fraternities may be factored into the analysis due to the correlation between males and the presence of fecal viruses (Daou et al., 2022). This correlation is consistent with the research conducted by Bitter et al. (2022), wherein the university was identified as a microcosm of the corresponding city and exhibited analogous trends in COVID-19 cases. Furthermore, our analysis revealed that Spearman rank correlations ranged from 0.447 to 0.478, with no relation to the size of the student residence halls, consistent with the findings of Feng et al. (2021), who noted similar correlations unrelated to the size of wastewater treatment plants. While our findings consistently showed alignment between SARS-CoV-2 RNA load in raw sewage from all student residence halls, as determined through RT-qPCR, and the trends observed in active cases of COVID-19 across these halls, our study relied solely on RNA load as a proxy for COVID-19 prevalence, which may not capture all cases, particularly those of asymptomatic individuals or those with low viral shedding. Therefore, caution should be exercised when interpreting and extrapolating our results to other settings or populations.
While the normalization of SARS-CoV-2 RNA load in wastewater by PMMoV has the potential to enhance comparability across studies, our investigation demonstrated that there was no substantial improvement in correlations between SARS-CoV-2 RNA load in raw wastewater and active cases, self-isolation, or their combination when compared to unnormalized data, irrespective of the student population in the respective residence halls. The results of this study add to the expanding body of research that questions the notion that normalization by PMMoV enhances the reporting and standardization of WBE data. Ai et al. (2021) reported that normalization by PMMoV did not significantly improve correlations with new case numbers or enhance estimation models across nine wastewater treatment plants serving populations ranging from 14,000 to 900,000. Similarly, Feng et al. (2021) found that normalizing SARS-CoV-2 RNA load to PMMoV did not improve correlation coefficients in all 12 WWTPs serving populations from 11,000 to 616,000. In the study by Greenwald et al. (2021), normalization by PMMoV led to a reduction in significant correlations to clinical cases in wastewater catchment areas serving populations from 2,930 to 1,500,000. A recent study by Nagarkar et al. (2022) found that PMMoV had a stronger correlation with samples from a larger sewershed, which served approximately 488,000 people and had higher levels of industrial and stormwater inputs. Zambrana et al. (2022) found that normalizing SARS-CoV-2 RNA load by PMMoV did not substantially change the correlation coefficients at various levels, including campus level (serving around 10,000 people), building level (serving around 500 people), or individual-building level (serving around 200 people) within the Stanford University campus. These findings contrast with other studies suggesting that normalization to PMMoV enhances relationships with clinical data. Other than PMMoV, Hsu et al. (2022) found that Paraxanthine was a more reliable population biomarker than PMMoV. Mitranescu et al. (2022) reported that the best normalization performance was achieved with a mixed fecal indicator calculated from both CrAssphage virus and PMMoV. It is crucial to note that these divergent conclusions were primarily attributed to the choice of matrix (solids versus liquid) (D'Aoust et al., 2021; Wolfe et al., 2021) and variances in analytical methods (Scott et al., 2021; Zhan et al., 2022).
Furthermore, the choice of molecular method/kit, particularly quantitative PCR, employed for the detection of SARS-CoV-2 and/or PMMoV RNA, may also influence the correlations between the two viruses. For instance, Jafferali et al. (2021) conducted a study comparing four concentration methods, including two variants of ultrafiltration-based methods and two adsorption and extraction-based methods. They consistently observed higher recovery of SARS-CoV-2 and PMMoV using the modified ultrafiltration-based method. In our study, we utilized the ultracentrifugation method, which, while effective, may be slightly less efficient than the modified method. Moreover, the choice of target genes (N1, N2, and E) for detecting SARS-CoV-2 can impact the performance of the assay, with different extraction methods yielding varying recoveries for these genes. Nalla Arun et al. (2020) conducted a comparative analysis of SARS-CoV-2 detection assays using seven different primer-probe sets and one assay kit. They found that the most sensitive assays utilized the E-gene primer-probe set described by Corman et al. (2020) and the N2 set developed by the CDC. In our study, we opted for the N1 target due to consistent contamination issues with the N2 set in our laboratory. More sensitive kits and/or advanced methods should be considered for future studies to enhance the accuracy and reliability of such comparisons.
Environmental uncertainties introduce complexities in normalizing SARS-CoV-2 RNA load in raw wastewater by PMMoV. Raw wastewater from university dormitories primarily consists of washing and bathing effluents, occasionally mixed with kitchen wastewater. In contrast, sewage wastewater derives from a broader spectrum, including residential sources (private residences, dormitories, hotels, and residential care facilities) and commercial facilities (including hospitals), creating a more intricate composition compared to university dormitory wastewater. Hamouda et al. (2021) underscored the role of microorganisms and physico-chemical properties, such as pH, solids, and disinfectants, in influencing the persistence and detection of SARS-CoV-2 RNA in wastewater. These factors impact the genetic material’s integrity, posing challenges in detection. Higher pH in wastewater has been linked to decreased RNA load of all three SARS-CoV-2 targets (Ahmed et al., 2020b; Maal-Bared et al., 2023). Sapula et al. (2021) reported the non-detection of SARS-CoV-2 in a wastewater plant with elevated pH levels (8.80 to 9.35). These findings also have implications for wastewater treatment plants receiving waste with high pH (pH > 7.75) from various sources, including lagoons, septic tanks, and industrial operations. Elevated pH levels can significantly affect virus adsorption to particles and the RNA load recovered, emphasizing the need for careful consideration of wastewater composition and pH variations in interpreting surveillance data. Accurate interpretation of WBE relies on addressing environmental uncertainties in both raw wastewater and influent wastewater.
The correlation between SARS-CoV-2 RNA load and PMMoV normalization may be influenced by the distinct characteristics of the two viruses in terms of their source and origin. SARS-CoV-2 is an enveloped virus, while PMMoV is non-enveloped. In contrast to wastewater transported to treatment plants, our study collected wastewater directly from manholes next to the buildings or from access points before the sewer pipe left the building and promptly processed it in the lab. This immediate processing could affect virus RNA load due to variations in decay rates and variability between the enveloped SARS-CoV-2 and non-enveloped PMMoV. Research conducted by Li et al. (2023b) has indicated a faster decay rate of SARS-CoV-2 RNA compared to PMMoV RNA in raw sewage. PMMoV RNA exhibited higher abundance and lower variability than pathogenic SARS-CoV-2 RNA (Li et al., 2023b). A study by Ye et al. (2016) found that up to 26% of enveloped viruses (murine hepatitis virus and Pseudomonas phage φ6) adsorbed to the solid fraction of wastewater, compared to 6% of non-enveloped viruses (Bacteriophage MS2 and T3). This implies that enveloped viruses may maintain greater integrity in wastewater with higher total suspended solids (TSS) and turbidity levels. Recognizing the distinct characteristics of enveloped and non-enveloped viruses is crucial for enhancing the precision and meaningfulness of interpretation the data in the context of WBE studies.
The study investigated the impact of normalizing SARS-CoV-2 RNA load by PMMoV on lead times associated with active cases, self-isolation, or their combination. The significant correlations observed one week prior when analyzing SARS-CoV-2 RNA load from all residence halls in this study, indicating a potential early warning utility. These results suggest that SARS-CoV-2 RNA load may serve as an early indicator, aligning with findings from other studies. Nemudryi et al. (2020) reported that SARS-CoV-2 RNA load in wastewater precedes clinical test results by 2 to 4 days at the community level. Greenwald et al. (2021) found that the strongest correlation between clinical testing data and SARS-CoV-2 RNA load was associated with a two-week lead time across six wastewater catchment areas. Karthikeyan et al. (2021) observed a strong correlation between SARS-CoV-2 RNA load in raw untreated wastewater and clinically cases at the county level. The integration of this correlation, along with historical reported case numbers and temporal information in an autoregressive integrated moving average model, facilitated the successful prediction of new reported cases up to 3 weeks in advance. Wu et al. (2022) found that SARS-CoV-2 RNA load in wastewater were correlated with clinically diagnosed new COVID-19 cases, revealing trends four to ten days earlier in wastewater than in clinical data during the initial wave of the pandemic at the Deer Island Wastewater Treatment Plant. However, Xiao et al. (2022) observed that this leading indicator effect was not apparent in the second wave from the same treatment plant. The authors attributed this change to the expansion of testing capacity, enabling more timely identification, and reporting of cases. Additionally, the diverse approaches to reporting cases, considering factors like disease onset, test date, and test result date, also contribute to the variability observed in lead times. Ai et al. (2021) emphasized this by noting that their clinical cases staggered the trend of SARS-CoV-2 RNA load by 3 days since positive cases were assigned a date based on the estimate of disease onset.
In the present study, normalizing SARS-CoV-2 RNA load by PMMoV did not result in enhancements of lead times associated with active cases, self-isolation, or their combination across all examined locations. Our observations are in alignment with the findings of Maal-Bared et al. (2023), who reported that the normalization of SARS-CoV-2 RNA load by PMMoV did not improve lead times for active cases in ten out of twelve communities.
The correlations observed were significantly weaker between the SARS-CoV-2 RNA load one week before and the occurrence of active cases, self-isolation, or their combination in all student residence halls. The strongest correlations were observed for comparisons with the SARS-CoV-2 RNA load during the week of and one week after the occurrence of active cases in all student residence halls. Consistent with our findings, Ai et al. (2021) also reported no enhancement in correlations for the estimation of leading times. This lack of improvement may be attributed to viral load variations associated with disease progression (Benefield et al., 2020; Walsh et al., 2020). Zheng et al. (2020) further emphasized that stool sample viral loads were highest during the third and fourth weeks after disease onset.
While our study provides valuable insights into the limitations of normalizing SARS-CoV-2 RNA load by PMMoV in wastewater, it is essential to acknowledge several limitations in our methodology and data interpretation. Firstly, the study was conducted within a specific context of university dormitories, which may not fully represent the broader community dynamics of wastewater surveillance. The findings may not be directly generalizable to other settings with different population densities, wastewater characteristics, and public health interventions. Additionally, the observational nature of the study limits our ability to establish causality between RNA load measurements and epidemiological outcomes. Other factors such as testing strategies, reporting practices, and population mobility could also influence the observed correlations and lead times. Furthermore, the study focused primarily on correlations between RNA load and clinical outcomes without considering other potential confounders or modifiers that could affect the relationship. Future research incorporating more comprehensive data sources and analytical methods could provide a more nuanced understanding of the utility of PMMoV normalization in predicting COVID-19 dynamics. Lastly, while our study contributes to the existing literature on wastewater surveillance, it is essential to recognize that WBE is just one component of a broader public health strategy and should be integrated with clinical data and epidemiological models for effective disease monitoring and control.
Conclusion
This year-long study monitored SARS-CoV-2 RNA load in the raw sewage of a university campus, aiming to understand the correlations with various aspects, including active COVID-19 cases, self-isolations, and their combination among all residence students. The findings revealed significant positive correlations between SARS-CoV-2 RNA load a week prior and during the week of monitoring from all student residence halls, dormitories, and fraternities and the occurrence of active COVID-19 cases among all residence students. This suggests that raw sewage monitoring can be a valuable tool for early warning and outbreak tracking within the campus setting. However, normalizing data using the fecal marker PMMoV did not demonstrate clear utility in interpreting campus-wide data. These results contribute to our understanding of the potential applications and limitations of wastewater monitoring for COVID-19 surveillance within the context of raw sewage on university campuses.
Data availability statement
The raw data supporting the conclusions of this article will be made available by the authors, without undue reservation.
Author contributions
YL: Conceptualization, Data curation, Formal analysis, Investigation, Methodology, Validation, Visualization, Writing – original draft, Writing – review & editing. KA: Data curation, Formal analysis, Investigation, Methodology, Software, Visualization, Writing – review & editing. IA: Formal analysis, Investigation, Methodology, Visualization, Writing – review & editing. DJ: Funding acquisition, Investigation, Methodology, Project administration, Resources, Software, Supervision, Writing – review & editing. DW: Investigation, Methodology, Resources, Validation, Writing – review & editing. PM: Data curation, Investigation, Methodology, Resources, Writing – review & editing. BG: Formal analysis, Investigation, Methodology, Resources, Writing – review & editing. SD: Formal analysis, Investigation, Methodology, Validation, Writing – review & editing. CN: Data curation, Formal analysis, Investigation, Methodology, Resources, Software, Validation, Visualization, Writing – review & editing. FK-M: Investigation, Methodology, Resources, Writing – review & editing. CS: Investigation, Methodology, Resources, Writing – review & editing. TH: Conceptualization, Data curation, Formal analysis, Funding acquisition, Investigation, Methodology, Project administration, Resources, Software, Supervision, Validation, Visualization, Writing – original draft, Writing – review & editing.
Funding
The author(s) declare that financial support was received for the research, authorship, and/or publication of this article. The funding for this project was generously provided by the University of Tennessee Office of Research and Engagement.
Acknowledgments
We extend our gratitude to Mike Humphrys from the Institute for Genome Sciences, School of Medicine, University of Maryland-Baltimore, for providing valuable insights into the selection of RT-qPCR assays and genome sequencing methods. Furthermore, we appreciate the guidance received from Betancourt at the University of Arizona. The funding for this project was generously provided by the University of Tennessee Office of Research and Engagement.
Conflict of interest
The authors declare that the research was conducted in the absence of any commercial or financial relationships that could be construed as a potential conflict of interest.
Publisher’s note
All claims expressed in this article are solely those of the authors and do not necessarily represent those of their affiliated organizations, or those of the publisher, the editors and the reviewers. Any product that may be evaluated in this article, or claim that may be made by its manufacturer, is not guaranteed or endorsed by the publisher.
References
Ahmed, W., Angel, N., Edson, J., Bibby, K., Bivins, A., O'Brien, J. W., et al. (2020a). First confirmed detection of SARS-CoV-2 in untreated wastewater in Australia: A proof of concept for the wastewater surveillance of COVID-19 in the community. Sci. Total Environ. 728:138764. doi: 10.1016/j.scitotenv.2020.138764
Ahmed, W., Bertsch, P. M., Bivins, A., Bibby, K., Farkas, K., Gathercole, A., et al. (2020b). Comparison of virus concentration methods for the RT-qPCR-based recovery of murine hepatitis virus, a surrogate for SARS-CoV-2 from untreated wastewater. Sci. Total Environ. 739:139960. doi: 10.1016/j.scitotenv.2020.139960
Ai, Y., Davis, A., Jones, D., Lemeshow, S., Tu, H., He, F., et al. (2021). Wastewater SARS-CoV-2 monitoring as a community-level COVID-19 trend tracker and variants in Ohio, United States. Sci. Total Environ. 801:149757. doi: 10.1016/j.scitotenv.2021.149757
Ash, K., Li, Y., Alamilla, I., Joyner, D., Williams, D. E., McKay, P., et al. (2023). SARS-CoV-2 raw wastewater surveillance from student residences on an urban university campus. Front. Microbiol. 14:1101205. doi: 10.3389/fmicb.2023.1101205
Benefield, A. E., Skrip, L. A., Clement, A., Althouse, R. A., Chang, S., and Althouse, B. M. (2020). SARS-CoV-2 viral load peaks prior to symptom onset: a systematic review and individual-pooled analysis of coronavirus viral load from 66 studies. medRxiv. doi: 10.1101/2020.09.28.20202028
Bitter, L. C., Kibbee, R., Jiménez, G. C., and Örmeci, B. (2022). Wastewater surveillance of SARS-CoV-2 at a Canadian university campus and the impact of wastewater characteristics on viral RNA detection. Acs Es&T Water 2, 2034–2046. doi: 10.1021/acsestwater.2c00060
Bustin, S. A., Benes, V., Garson, J. A., Hellemans, J., Huggett, J., Kubista, M., et al. (2009). The MIQE guidelines: minimum information for publication of quantitative real-time PCR experiments. Clin. Chem. 55, 611–622. doi: 10.1373/clinchem.2008.112797
Contini, C., Rotondo, J. C., Perna, B., Guarino, M., and De Giorgio, R. (2023). Advances in SARS-CoV-2 infection. MDPI 11:1048. doi: 10.3390/microorganisms11041048
Corman, V. M., Landt, O., Kaiser, M., Molenkamp, R., Meijer, A., Chu, D. K., et al. (2020). Detection of 2019 novel coronavirus (2019-nCoV) by real-time RT-PCR. Eur. Secur. 25:2000045. doi: 10.2807/1560-7917.ES.2020.25.3.2000045
Daou, M., Kannout, H., Khalili, M., Almarei, M., Alhashami, M., Alhalwachi, Z., et al. (2022). Analysis of SARS-CoV-2 viral loads in stool samples and nasopharyngeal swabs from COVID-19 patients in the United Arab Emirates. PLoS One 17:e0274961. doi: 10.1371/journal.pone.0274961
D'Aoust, P. M., Mercier, E., Montpetit, D., Jia, J.-J., Alexandrov, I., Neault, N., et al. (2021). Quantitative analysis of SARS-CoV-2 RNA from wastewater solids in communities with low COVID-19 incidence and prevalence. Water Res. 188:116560. doi: 10.1016/j.watres.2020.116560
Feng, S., Roguet, A., McClary-Gutierrez, J. S., Newton, R. J., Kloczko, N., Meiman, J. G., et al. (2021). Evaluation of sampling, analysis, and normalization methods for SARS-CoV-2 concentrations in wastewater to assess COVID-19 burdens in Wisconsin communities. Acs Es&T Water 1, 1955–1965. doi: 10.1021/acsestwater.1c00160
Gerrity, D., Papp, K., Stoker, M., Sims, A., and Frehner, W. (2021). Early-pandemic wastewater surveillance of SARS-CoV-2 in southern Nevada: methodology, occurrence, and incidence/prevalence considerations. Water Res X 10:100086. doi: 10.1016/j.wroa.2020.100086
Greenwald, H. D., Kennedy, L. C., Hinkle, A., Whitney, O. N., Fan, V. B., Crits-Christoph, A., et al. (2021). Tools for interpretation of wastewater SARS-CoV-2 temporal and spatial trends demonstrated with data collected in the San Francisco Bay Area. Water Res X 12:100111. doi: 10.1016/j.wroa.2021.100111
Hamouda, M., Mustafa, F., Maraqa, M., Rizvi, T., and Aly Hassan, A. (2021). Wastewater surveillance for SARS-CoV-2: lessons learnt from recent studies to define future applications. Sci. Total Environ. 759:143493. doi: 10.1016/j.scitotenv.2020.143493
Hauke, J., and Kossowski, T. (2011). Comparison of values of Pearson's and Spearman's correlation coefficients on the same sets of data. Quaestiones geographicae 30, 87–93. doi: 10.2478/v10117-011-0021-1
Hsu, S.-Y., Bayati, M., Li, C., Hsieh, H.-Y., Belenchia, A., Klutts, J., et al. (2022). Biomarkers selection for population normalization in SARS-CoV-2 wastewater-based epidemiology. Water Res. 223:118985. doi: 10.1016/j.watres.2022.118985
Jafferali, M. H., Khatami, K., Atasoy, M., Birgersson, M., Williams, C., and Cetecioglu, Z. (2021). Benchmarking virus concentration methods for quantification of SARS-CoV-2 in raw wastewater. Sci. Total Environ. 755:142939. doi: 10.1016/j.scitotenv.2020.142939
Karthikeyan, S., Ronquillo, N., Belda-Ferre, P., Alvarado, D., Javidi, T., Longhurst, C. A., et al. (2021). High-throughput wastewater SARS-CoV-2 detection enables forecasting of community infection dynamics in San Diego County. Msystems 6:45. doi: 10.1128/msystems.00045-21
Kitajima, M., Sassi, H. P., and Torrey, J. R. (2018). Pepper mild mottle virus as a water quality indicator. NPJ Clean Water 1:19. doi: 10.1038/s41545-018-0019-5
Li, X., Zhang, S., Shi, J., Luby, S. P., and Jiang, G. (2021). Uncertainties in estimating SARS-CoV-2 prevalence by wastewater-based epidemiology. Chem. Eng. J. 415:129039. doi: 10.1016/j.cej.2021.129039
Li, Y., Ash, K. T., Joyner, D. C., Williams, D. E., Alamilla, I., McKay, P., et al. (2023a). Decay of enveloped SARS-CoV-2 and non-enveloped PMMoV RNA in raw sewage from university dormitories. Front. Microbiol. 14:1144026. doi: 10.3389/fmicb.2023.1144026
Li, Y., Ash, K. T., Joyner, D. C., Williams, D. E., Alamilla, I., McKay, P. J., et al. (2023b). Evaluating various composite sampling modes for detecting pathogenic SARS-CoV-2 virus in raw sewage. Front. Microbiol. 14:1305967. doi: 10.3389/fmicb.2023.1305967
Maal-Bared, R., Qiu, Y., Li, Q., Gao, T., Hrudey, S. E., Bhavanam, S., et al. (2023). Does normalization of SARS-CoV-2 concentrations by Pepper mild mottle virus improve correlations and lead time between wastewater surveillance and clinical data in Alberta (Canada): comparing twelve SARS-CoV-2 normalization approaches. Sci. Total Environ. 856:158964. doi: 10.1016/j.scitotenv.2022.158964
Medema, G., Heijnen, L., Elsinga, G., Italiaander, R., and Brouwer, A. (2020). Presence of SARS-Coronavirus-2 RNA in sewage and correlation with reported COVID-19 prevalence in the early stage of the epidemic in the Netherlands. Environ. Sci. Technol. Lett. 7, 511–516. doi: 10.1021/acs.estlett.0c00357
Mitranescu, A., Uchaikina, A., Kau, A.-S., Stange, C., Ho, J., Tiehm, A., et al. (2022). Wastewater-based epidemiology for SARS-CoV-2 biomarkers: evaluation of normalization methods in small and large communities in southern Germany. Acs Es&T Water 2, 2460–2470. doi: 10.1021/acsestwater.2c00306
Nagarkar, M., Keely, S. P., Jahne, M., Wheaton, E., Hart, C., Smith, B., et al. (2022). SARS-CoV-2 monitoring at three sewersheds of different scales and complexity demonstrates distinctive relationships between wastewater measurements and COVID-19 case data. Sci. Total Environ. 816:151534. doi: 10.1016/j.scitotenv.2021.151534
Nalla Arun, K., Casto Amanda, M., Huang Meei-Li, W., Perchetti Garrett, A., Sampoleo, R., Shrestha, L., et al. (2020). Comparative performance of SARS-CoV-2 detection assays using seven different primer-probe sets and one assay kit. J. Clin. Microbiol. 58:557. doi: 10.1128/jcm.00557-20
Nemudryi, A., Nemudraia, A., Wiegand, T., Surya, K., Buyukyoruk, M., Cicha, C., et al. (2020). Temporal detection and phylogenetic assessment of SARS-CoV-2 in municipal wastewater. Cell Reports Med. 1:100098. doi: 10.1016/j.xcrm.2020.100098
Randazzo, W., Truchado, P., Cuevas-Ferrando, E., Simón, P., Allende, A., and Sánchez, G. (2020). SARS-CoV-2 RNA in wastewater anticipated COVID-19 occurrence in a low prevalence area. Water Res. 181:115942. doi: 10.1016/j.watres.2020.115942
Rotondo, J. C., Martini, F., Maritati, M., Caselli, E., Gallenga, C. E., Guarino, M., et al. (2022). Advanced molecular and immunological diagnostic methods to detect SARS-CoV-2 infection. Microorganisms 10:1193. doi: 10.3390/microorganisms10061193
Sapula, S. A., Whittall, J. J., Pandopulos, A. J., Gerber, C., and Venter, H. (2021). An optimized and robust PEG precipitation method for detection of SARS-CoV-2 in wastewater. Sci. Total Environ. 785:147270. doi: 10.1016/j.scitotenv.2021.147270
Schmitz, B. W., Innes, G. K., Prasek, S. M., Betancourt, W. Q., Stark, E. R., Foster, A. R., et al. (2021). Enumerating asymptomatic COVID-19 cases and estimating SARS-CoV-2 fecal shedding rates via wastewater-based epidemiology. Sci. Total Environ. 801:149794. doi: 10.1016/j.scitotenv.2021.149794
Scott, L. C., Aubee, A., Babahaji, L., Vigil, K., Tims, S., and Aw, T. G. (2021). Targeted wastewater surveillance of SARS-CoV-2 on a university campus for COVID-19 outbreak detection and mitigation. Environ. Res. 200:111374. doi: 10.1016/j.envres.2021.111374
von Sperling, M., Verbyla, M. E., and Oliveira, S. M. A. C. (2020). Relationship between monitoring variables. Correlation and regression analysis. Assessment of treatment plant performance and water quality data: A guide for students, researchers and practitioners. London: IWA Publishing.
Walsh, K. A., Jordan, K., Clyne, B., Rohde, D., Drummond, L., Byrne, P., et al. (2020). SARS-CoV-2 detection, viral load and infectivity over the course of an infection. J. Infect. 81, 357–371. doi: 10.1016/j.jinf.2020.06.067
WBE Collaborative . (2023). COVID-19WBECollaborative. Available at: www.COVID19wbec.org
Wolfe, M. K., Archana, A., Catoe, D., Coffman, M. M., Dorevich, S., Graham, K. E., et al. (2021). Scaling of SARS-CoV-2 RNA in settled solids from multiple wastewater treatment plants to compare incidence rates of laboratory-confirmed COVID-19 in their Sewersheds. Environ. Sci. Technol. Lett. 8, 398–404. doi: 10.1021/acs.estlett.1c00184
Wu, F., Xiao, A., Zhang, J., Moniz, K., Endo, N., Armas, F., et al. (2022). SARS-CoV-2 RNA concentrations in wastewater foreshadow dynamics and clinical presentation of new COVID-19 cases. Sci. Total Environ. 805:150121. doi: 10.1016/j.scitotenv.2021.150121
Wurtzer, S., Marechal, V., Mouchel, J., Maday, Y., Teyssou, R., Richard, E., et al. (2020). Evaluation of lockdown impact on SARS-CoV-2 dynamics through viral genome quantification in Paris wastewaters. MedRxiv.
Xiao, A., Wu, F., Bushman, M., Zhang, J., Imakaev, M., Chai, P. R., et al. (2022). Metrics to relate COVID-19 wastewater data to clinical testing dynamics. Water Res. 212:118070. doi: 10.1016/j.watres.2022.118070
Ye, Y., Ellenberg, R. M., and Graham, K. E., and Wigginton, K. R. (2016). Survivability, Partitioning, and Recovery of Enveloped Viruses in Untreated Municipal Wastewater. Environ. Sci. Technol. 50: 5077–5085. doi: 10.1021/acs.est.6b00876
Zambrana, W., Catoe, D., Coffman, M. M., Kim, S., Anand, A., Solis, D., et al. (2022). SARS-CoV-2 RNA and N antigen quantification via wastewater at the campus level, building cluster level, and individual-building level. Acs Es&T Water 2, 2025–2033. doi: 10.1021/acsestwater.2c00050
Zhan, Q., Babler, K. M., Sharkey, M. E., Amirali, A., Beaver, C. C., Boone, M. M., et al. (2022). Relationships between SARS-CoV-2 in wastewater and COVID-19 clinical cases and hospitalizations, with and without normalization against indicators of human waste. Acs Es&T Water 2, 1992–2003. doi: 10.1021/acsestwater.2c00045
Keywords: SARS-CoV-2, PMMoV, COVID-19, raw wastewater, sewage, WBE, RT-qPCR
Citation: Li Y, Ash K, Alamilla I, Joyner D, Williams DE, McKay PJ, Green B, DeBlander S, North C, Kara-Murdoch F, Swift C and Hazen TC (2024) COVID-19 trends at the University of Tennessee: predictive insights from raw sewage SARS-CoV-2 detection and evaluation and PMMoV as an indicator for human waste. Front. Microbiol. 15:1379194. doi: 10.3389/fmicb.2024.1379194
Edited by:
Joerg Jores, University of Bern, SwitzerlandReviewed by:
Chiara Mazziotta, University of Ferrara, ItalyMatthew D. Moore, University of Massachusetts Amherst, United States
Copyright © 2024 Li, Ash, Alamilla, Joyner, Williams, McKay, Green, DeBlander, North, Kara-Murdoch, Swift and Hazen. This is an open-access article distributed under the terms of the Creative Commons Attribution License (CC BY). The use, distribution or reproduction in other forums is permitted, provided the original author(s) and the copyright owner(s) are credited and that the original publication in this journal is cited, in accordance with accepted academic practice. No use, distribution or reproduction is permitted which does not comply with these terms.
*Correspondence: Terry C. Hazen, dGNoYXplbkB1dGsuZWR1