 Qinwei Qiu1,2†
 Jingjing Wang3,4†Yuhong Yan1,2†Bhaskar Roy5Yang Chen1,2Xiaoxiao Shang1,2
 Tongyi Dou3*
 Lijuan Han1,2*
- 1State Key Laboratory of Dampness Syndrome of Chinese Medicine, The Second Affiliated Hospital of Guangzhou University of Chinese Medicine, Guangzhou, China
- 2Guangdong Provincial Hospital of Chinese Medicine, Guangzhou, China
- 3School of Life and Pharmaceutical Sciences, Dalian University of Technology, Panjin, China
- 4Department of Scientific Research, KMHD, Shenzhen, China
- 5BGI Genomics, BGI-Shenzhen, Shenzhen, China
The human gut microbiome is a reservoir for antibiotic resistance gene (ARG). Therefore, characterizing resistome distribution and potential disease markers can help manage antibiotics at the clinical level. While much population-level research has highlighted the strong effect of donor geographic origin on ARG prevalence in the human gut, little is known regarding the effects of other properties, such as age, sex, and disease. Here we employed 2,037 fecal metagenomes from 12 countries. By quantifying the known resistance genes for 24 types of antibiotics in each community, we showed that tetracycline, aminoglycoside, beta-lactam, macrolide-lincosamide-streptogramin (MLS), and vancomycin resistance genes were the dominant ARG types in the human gut. We then compared the ARG profiles of 1427 healthy individuals from the 2,037 samples and observed significant differences across countries. This was consistent with expectations that regional antibiotic usage and exposure in medical and food production contexts affect distribution. Although no specific uniform pattern of ARG was observed, a significant increase in resistance potential among multiple disease groups implied that the disease condition may be another source of ARG variance. In particular, the co-occurrence pattern of some enriched bacterial species and ARGs that were obtained in type 2 diabetes (T2D) and liver cirrhosis patients implied that some disease-associated species may be potential hosts of enriched ARGs, which could be potential biomarkers for the prediction and intervention of such diseases. Overall, our study identifies factors associated with the human gut resistome, including substantial effects of region and heterogeneous effects of disease status, and highlights the value of ARG analysis in disease research and clinical applications.
Introduction
Antibiotic resistance in pathogens is a global health crisis (Klein et al., 2018). Abuse of antibiotics in clinical settings and food production results in the widespread adaptation of bacteria to antibiotic exposure, as well as to the rapid evolution and dissemination of antibiotics resistance genes (ARGs). The presence of ARGs generally indicates lower antibiotic susceptibility in pathogens, making these genetic markers valuable for clinical screening.
A tremendous number of microbes inhabit the human intestinal tract and play a vital role in human physiological function (Lynch and Pedersen, 2016). The human gut microbiome is considered a reservoir of ARGs, which makes it possible to investigate clinical resistance by gut microbiome analysis (Haak et al., 2018). Various approaches, such as the isolation of antibiotic resistant bacterial strains, DNA microarrays (Lu et al., 2015), and metagenomic expression libraries, have been used to characterize the resistome within a community (Boolchandani et al., 2019). Among these strategies, high-throughput sequencing-based metagenomic analysis is a powerful tool for ARG surveys. Several comparative resistome studies have been performed to date using sequence data analysis from fecal samples (Forslund et al., 2013; Hu et al., 2013; Gibson et al., 2015; Li et al., 2015, 2018; Rampelli et al., 2015; Fitzpatrick and Walsh, 2016; Pal et al., 2016; Pehrsson et al., 2016; Feng et al., 2018). Four significant from this research include: (i) The most abundant resistance determinants in the human gut are those for antibiotics available for a long time (Forslund et al., 2013). (ii) Robust differences in country-level resistance potential are observed, which correlate with local antibiotic consumption (Forslund et al., 2013; Hu et al., 2013; Pehrsson et al., 2016). (iii) Donor properties other than country of origin, such as age, sex, or body mass index (BMI), have minor influences on the resistome (Forslund et al., 2014) (iv) Resistance potential is significantly correlated with microbial community composition (Pehrsson et al., 2016; Feng et al., 2018).
However, most of these previous studies suffer from small sample size, which reduces the statistical power of the analyses. In thee integrated analyses of multiple data sets, generalized results demand increased sample sizes to overcome the ambiguous comparisons. Furthermore, the resistome in disease states is largely unexplored. Antibiotic intervention influences some phenotypes closely related to the gut microbiome, such as metabolic disorders (Yang et al., 2017; Fu et al., 2018), immunopathologies (Wypych and Marsland, 2018), cancer (Cao et al., 2018; Zhang et al., 2019), and hypertension. Thus, it is worthwhile to explore the characteristics of ARGs in disease states and its association with bacteria, which may provide a new perspective for the identification of disease markers.
In this study, we aim to explore the factors associated with ARG’s composition in a large samples size. By description of the ARG profiles of 2,037 individuals from 12 countries, we provide an overview of the human gut resistome. This investigation will enhance our understanding of ARG’s population distribution.
Materials and Methods
Data Sets
A total of 2,037 fecal metagenome samples from 1,004 Chinese, 32 Japanese, 62 Mongolian, 463 Israelis, 15 Austrian, 55 French, 239 British, 41 Swedish, 24 Canadian, 19 Peruvian, 32 EI Salvadoran, and 51 American (United States) individuals, were collected from the National Center for Biotechnology Information (NCBI) Sequence Read Achieve (SRA1) (Leinonen et al., 2011) and our unpublished datasets. Among them, 1,427 samples were from healthy individuals, while 610 Chinese samples were from disease state individuals. Seven disease states were surveyed: colorectal cancer (CRC), type 2 diabetes (T2D), liver cirrhosis, rheumatoid arthritis (RA), (pre)hypertension, psoriasis (our unpublished dataset), and ankylosing spondylitis (AS). All sequencing data were generated using pair-end shotgun sequencing by Illumina technology. Physiological data of all subjects, including age, sex, BMI, and health status were extracted from literature sources and are listed in Supplementary Table S1.
ARGs and Microbial Taxon Quantification
ARG profiles were acquired with the ARGs-OAP v. 2.0 pipeline (Yin et al., 2018). This pipeline consists of a regularly updated database, Structured Antibiotic Resistance Genes (SARG), that has a hierarchical structure (ARG type-subtype-reference sequence). SARG is an integrated database containing sequences from two other commonly used resistance gene databases, ARDB (Antibiotic Resistance Genes Database) and CARD (The Comprehensive Antibiotic Resistance Database). SARG version 2 is further complemented using a potential resistance protein collection from the NCBI-NR protein database. The abundance of a gene (unit: number of ARG sequences in one million sequences) is the ARG-like sequence number normalized to the corresponding ARG reference sequence length (nucleotide) and the total reads in each metagenomic sample. MetaPhlAn2 (Segata et al., 2012) was used to characterize taxonomic profiles of the sample fecal metagenomes.
ARG Total Abundance and Diversity Comparison
Both the total abundance and the diversity of resistance genes were considered. Richness of all subtypes was defined as the diversity in a sample. The total ARG abundance was obtained by using the sum of the normalized values of all subtypes. These two indices were compared between populations using Kruskal–Wallis and Wilcoxon sum-rank tests. ARG structure was visualized using non-metric multidimensional scaling (NMDS) analysis based on the abundance matrix of the subtypes, and then tested by permutational analysis of variance (PERMANOVA) from the R vegan package (Oksanen et al., 2019). The R vegan adonis function with 999 permutations and the Bray–Curtis method were used to calculate pairwise distances after the samples with missing phenotypic value were removed.
Identification of Discriminative ARGs and Enriched Bacteria
Specific indicator subtypes for each population were identified using the indval function from the R Laboratory for Dynamic Synthetic Vegephenonenology (labdsv) package (Roberts, 2019), where IV ranges from 0 to 1 with higher values for stronger indicators. ARG subtypes with IV value > 0.3 and p-value < 0.05 in a specific group were selected as potential indicators. Linear discriminant analysis effect size (LEfSe) (Segata et al., 2011) was used to identify enriched bacteria between healthy and disease groups, with the alpha value set for class normality and the threshold of Wilcoxon sum-rank test set to 0.05. The threshold on the logarithmic score of the linear discriminant analysis (LDA) was set to 2.0.
Association Analysis of Bacteria and ARGs
The Procrustes test for correlation analysis between ARGs and bacterial communities was performed in R with the vegan package (Oksanen et al., 2019). Spearman’s correlation analysis was employed to assess associations between ARG subtypes and bacterial species. Pairs with thresholds of correlation coefficient > 0.5, adjust p-value < 0.05, and with the two items both occurring in more than half of the samples were selected to build the network using software Gephi (Bastian et al., 2009).
Results
Overview of ARGs Detected in the Human Gut
There are 24 ARG types and 1208 subtypes in SARG v.2. We found 21 of 24 types, in total, in at least one of the 2,037 samples. The human gut resistomes that we analyzed were dominated by particular ARG types with high prevalence and abundance. For example, genes conferring resistance toward tetracycline, aminoglycoside, beta-lactam, macrolide-lincosamide-streptogramin (MLS), and vancomycin were shared by all samples (Figure 1A). Other common resistance gene types included bacitracin, multidrug, chloramphenicol, fosmidomycin, and polymyxin. However, there was an absence of carbomycin, fusidic-acid and spectinomycin resistance genes. ARGs resistant to puromycin, tetracenomycin_C, and fusaric-acid were considered rare types because of low detected rates, 0.30%, 0.15%, and 0.10%, respectively. At the subtype level, 809 subtypes were detected in at least one sample. There were 100 ubiquitous ARG subtypes defined by those present in at least half of our samples (Figure 1B). Most of the ubiquitous subtypes belong to the multidrug resistance type (34), followed by tetracycline (15), beta-lactam (10), MLS (9), aminoglycoside (8), vancomycin (7), and unclassified (7) resistance genes. Six tetracycline resistance genes (tet32, tetM, tetO, tetQ, tetW, and tet resistance protein) were detected in all 2,037 samples, indicating widespread occurrence in the human gut. Additional dominant subtypes that we found in the human microbiome included bacA (within the bacitracin type), vanR (within the vancomycin type), aadE (within the aminoglycoside type), CfxA2 (within the beta-lactam type), ermF and ermB (within the MLS type), and acrB (within the multidrug) (Figure 1C). The abundance of ARG types and subtypes that we found is shown in Supplementary Tables S2, S3.
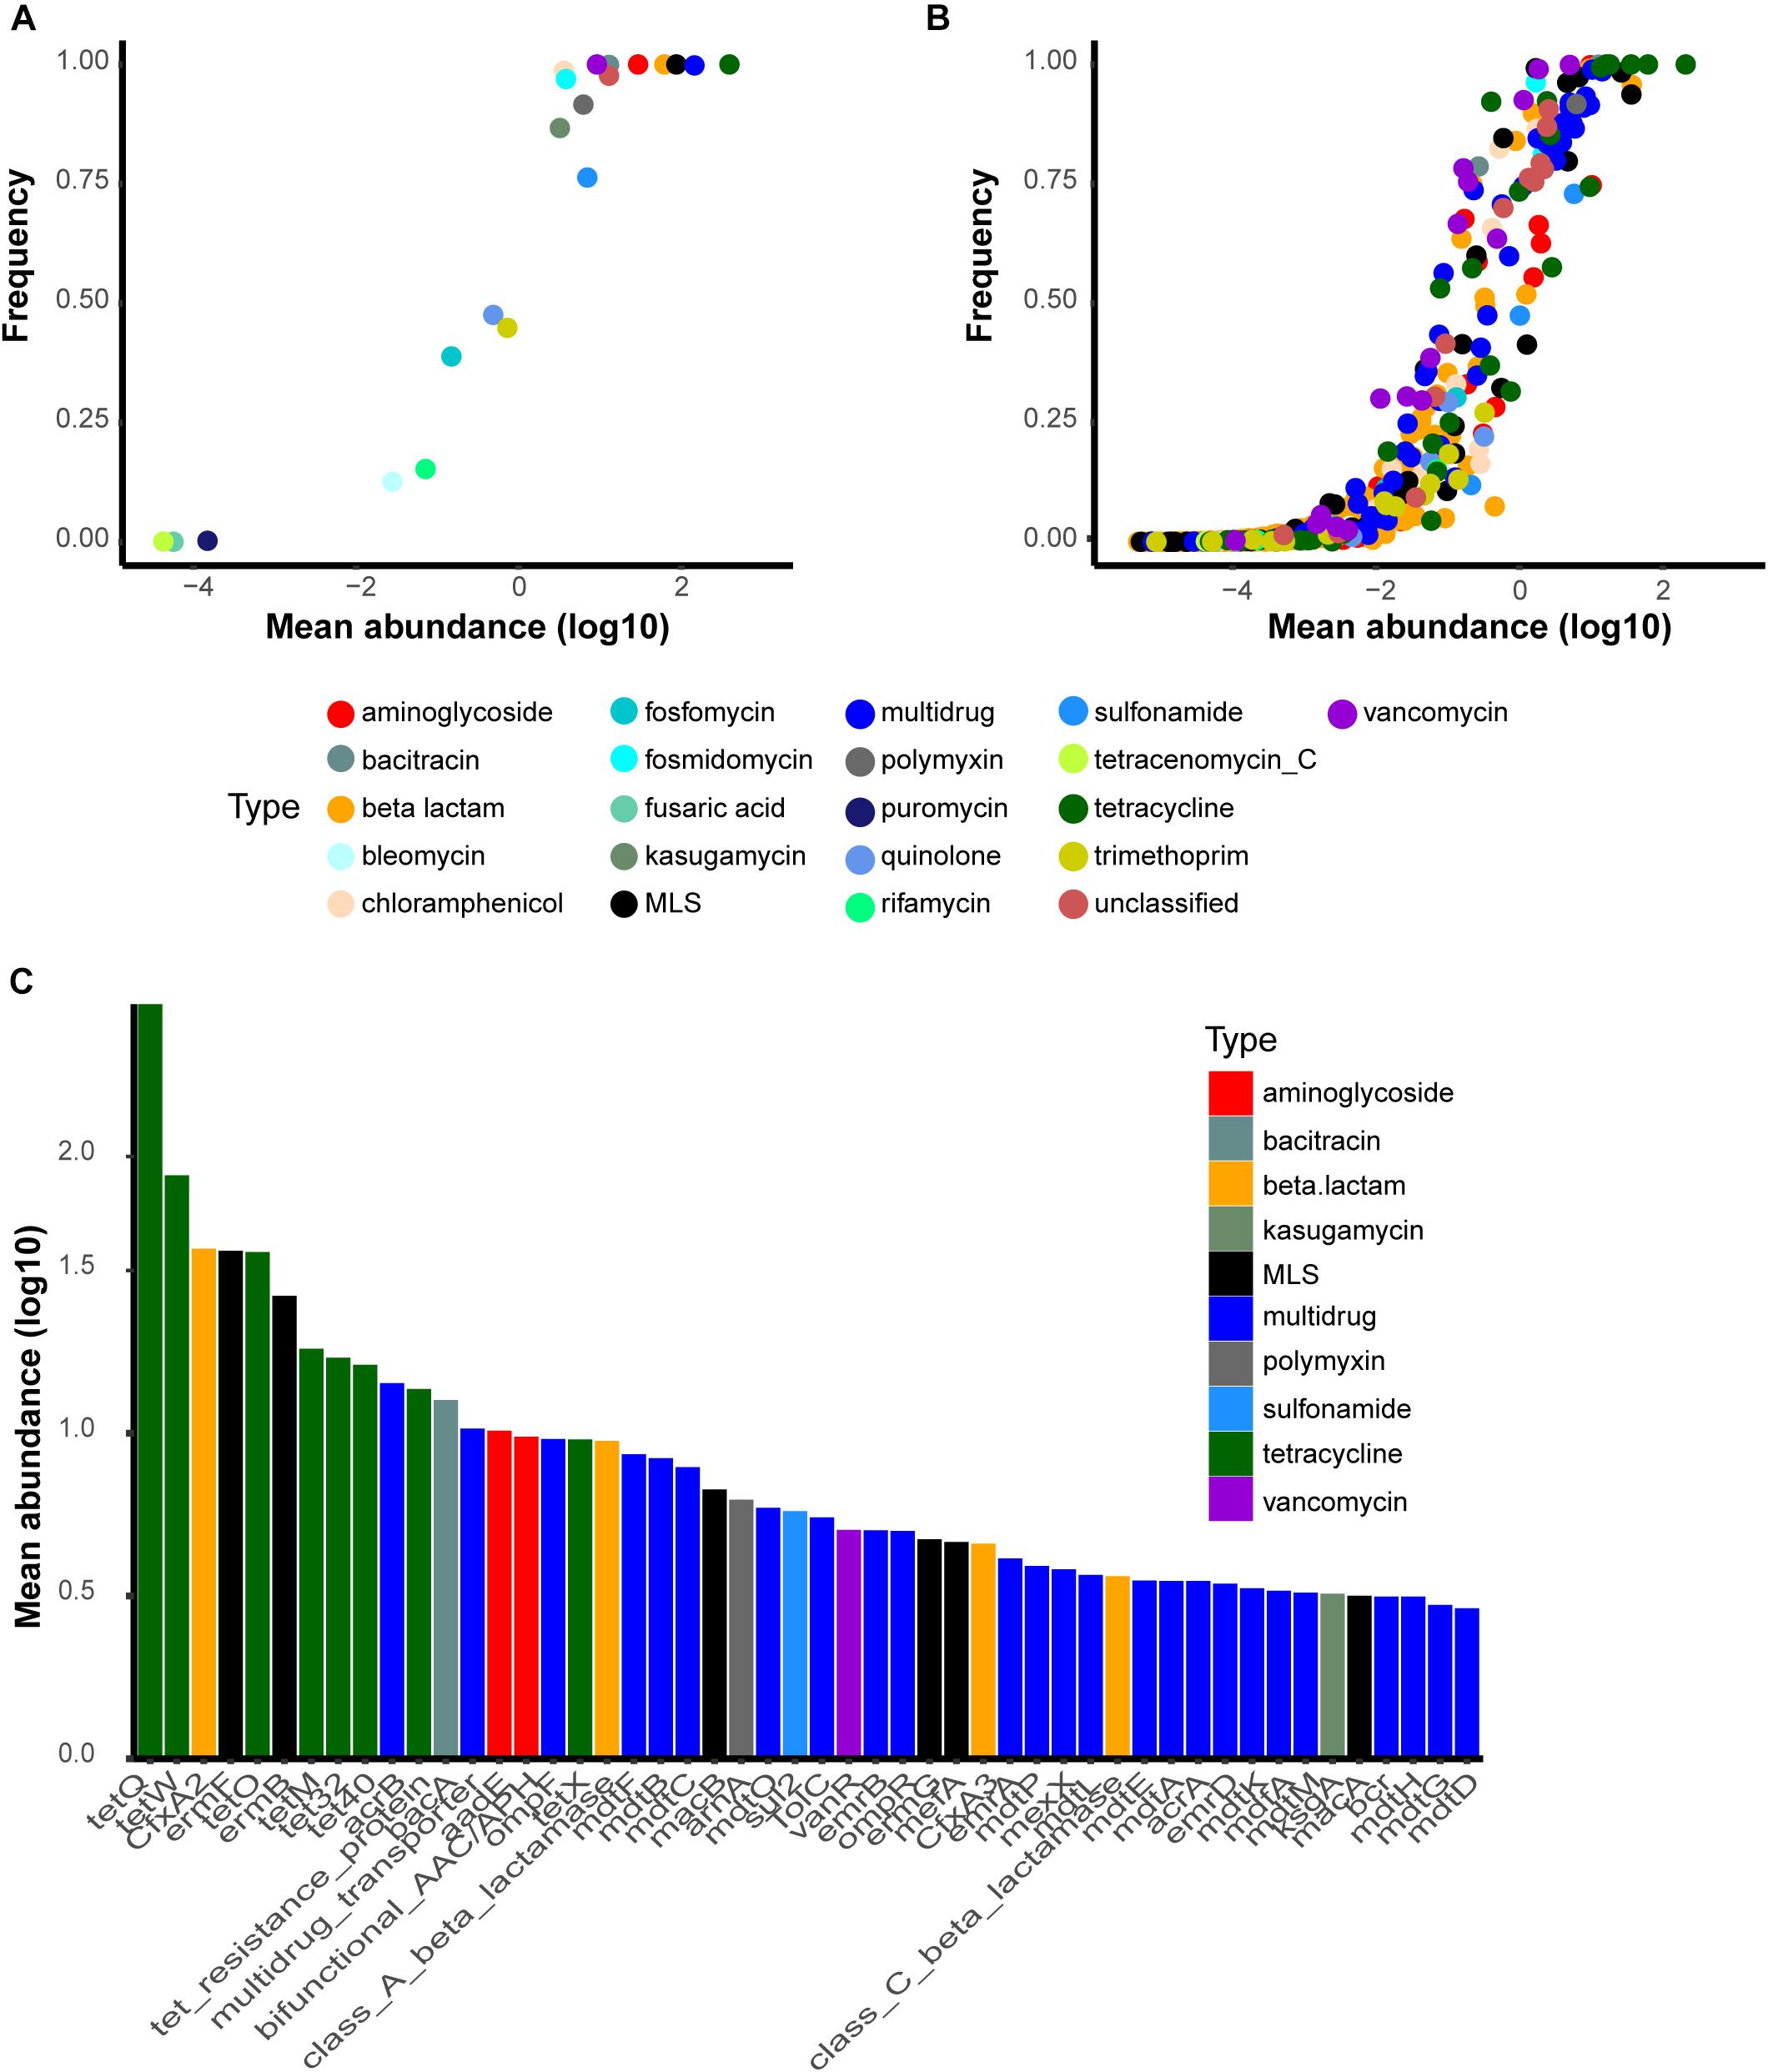
Figure 1. Most common antibiotic resistance gene (ARG) types and subtypes found in the present study. The y-axis is the detection rate and the x-axis represents the log10-transformed mean abundance of each ARG (A) types and (B) subtypes in all samples. (C) Top50 most abundant subtypes in the human gut. Abbreviations: bifunctional_AAC/APH, bifunctional aminoglycoside N-acetyltransferase and aminoglycoside phosphotransferase.
Geographic Origin and Health Status Impacting on ARGs
Geographic factors are widely accepted to be associated with ARGs profile (Forslund et al., 2013; Hu et al., 2013; Pehrsson et al., 2016). To verify this hypothesis, a permutational multivariate analysis of variance (PERMANOVA) was applied based on the subtype profile of 2,037 samples. The result confirmed that geographic origin was a strong influential factor impacting on ARGs (R2 = 0.2, p-value = 0.001). The result also suggested a significant difference across health states with a p-value of 0.001, although it was much weaker than geographic origin (R2 = 0.05). ARG baseline distribution and its alteration in disease groups were described in subsequent sections.
The Gut ARG Distribution Profile Baseline in Healthy Individuals
We visualized subtype profile patterns using NMDS to evaluate resistome composition similarities among 1,427 health samples. The results revealed that resistance subtype profiles were structured by country but with limited overlap (Figure 2A, PERMANOVA analysis: R2 = 0.21, p-value = 0.001), which implied that the distribution of antibiotic resistance genes and the abundance of those genes were geographically distinct. The five widespread types, tetracycline, multidrug, MLS, aminoglycoside, and beta-lactam accounted for >85% of the total antibiotic resistance genes in each of the 12 countries, but the composition of those types varied across the populations (Figure 2B). For example, the tetracycline type was the most abundant and accounted for more than 50% in the majority of countries, except in the United Kingdom, Sweden, Peru, and EI Salvador, where resistance potentials for multidrug were higher. The United States antibiotic resistome had a relative bias toward aminoglycoside and less MLS, which was in contrast to Mongolia.
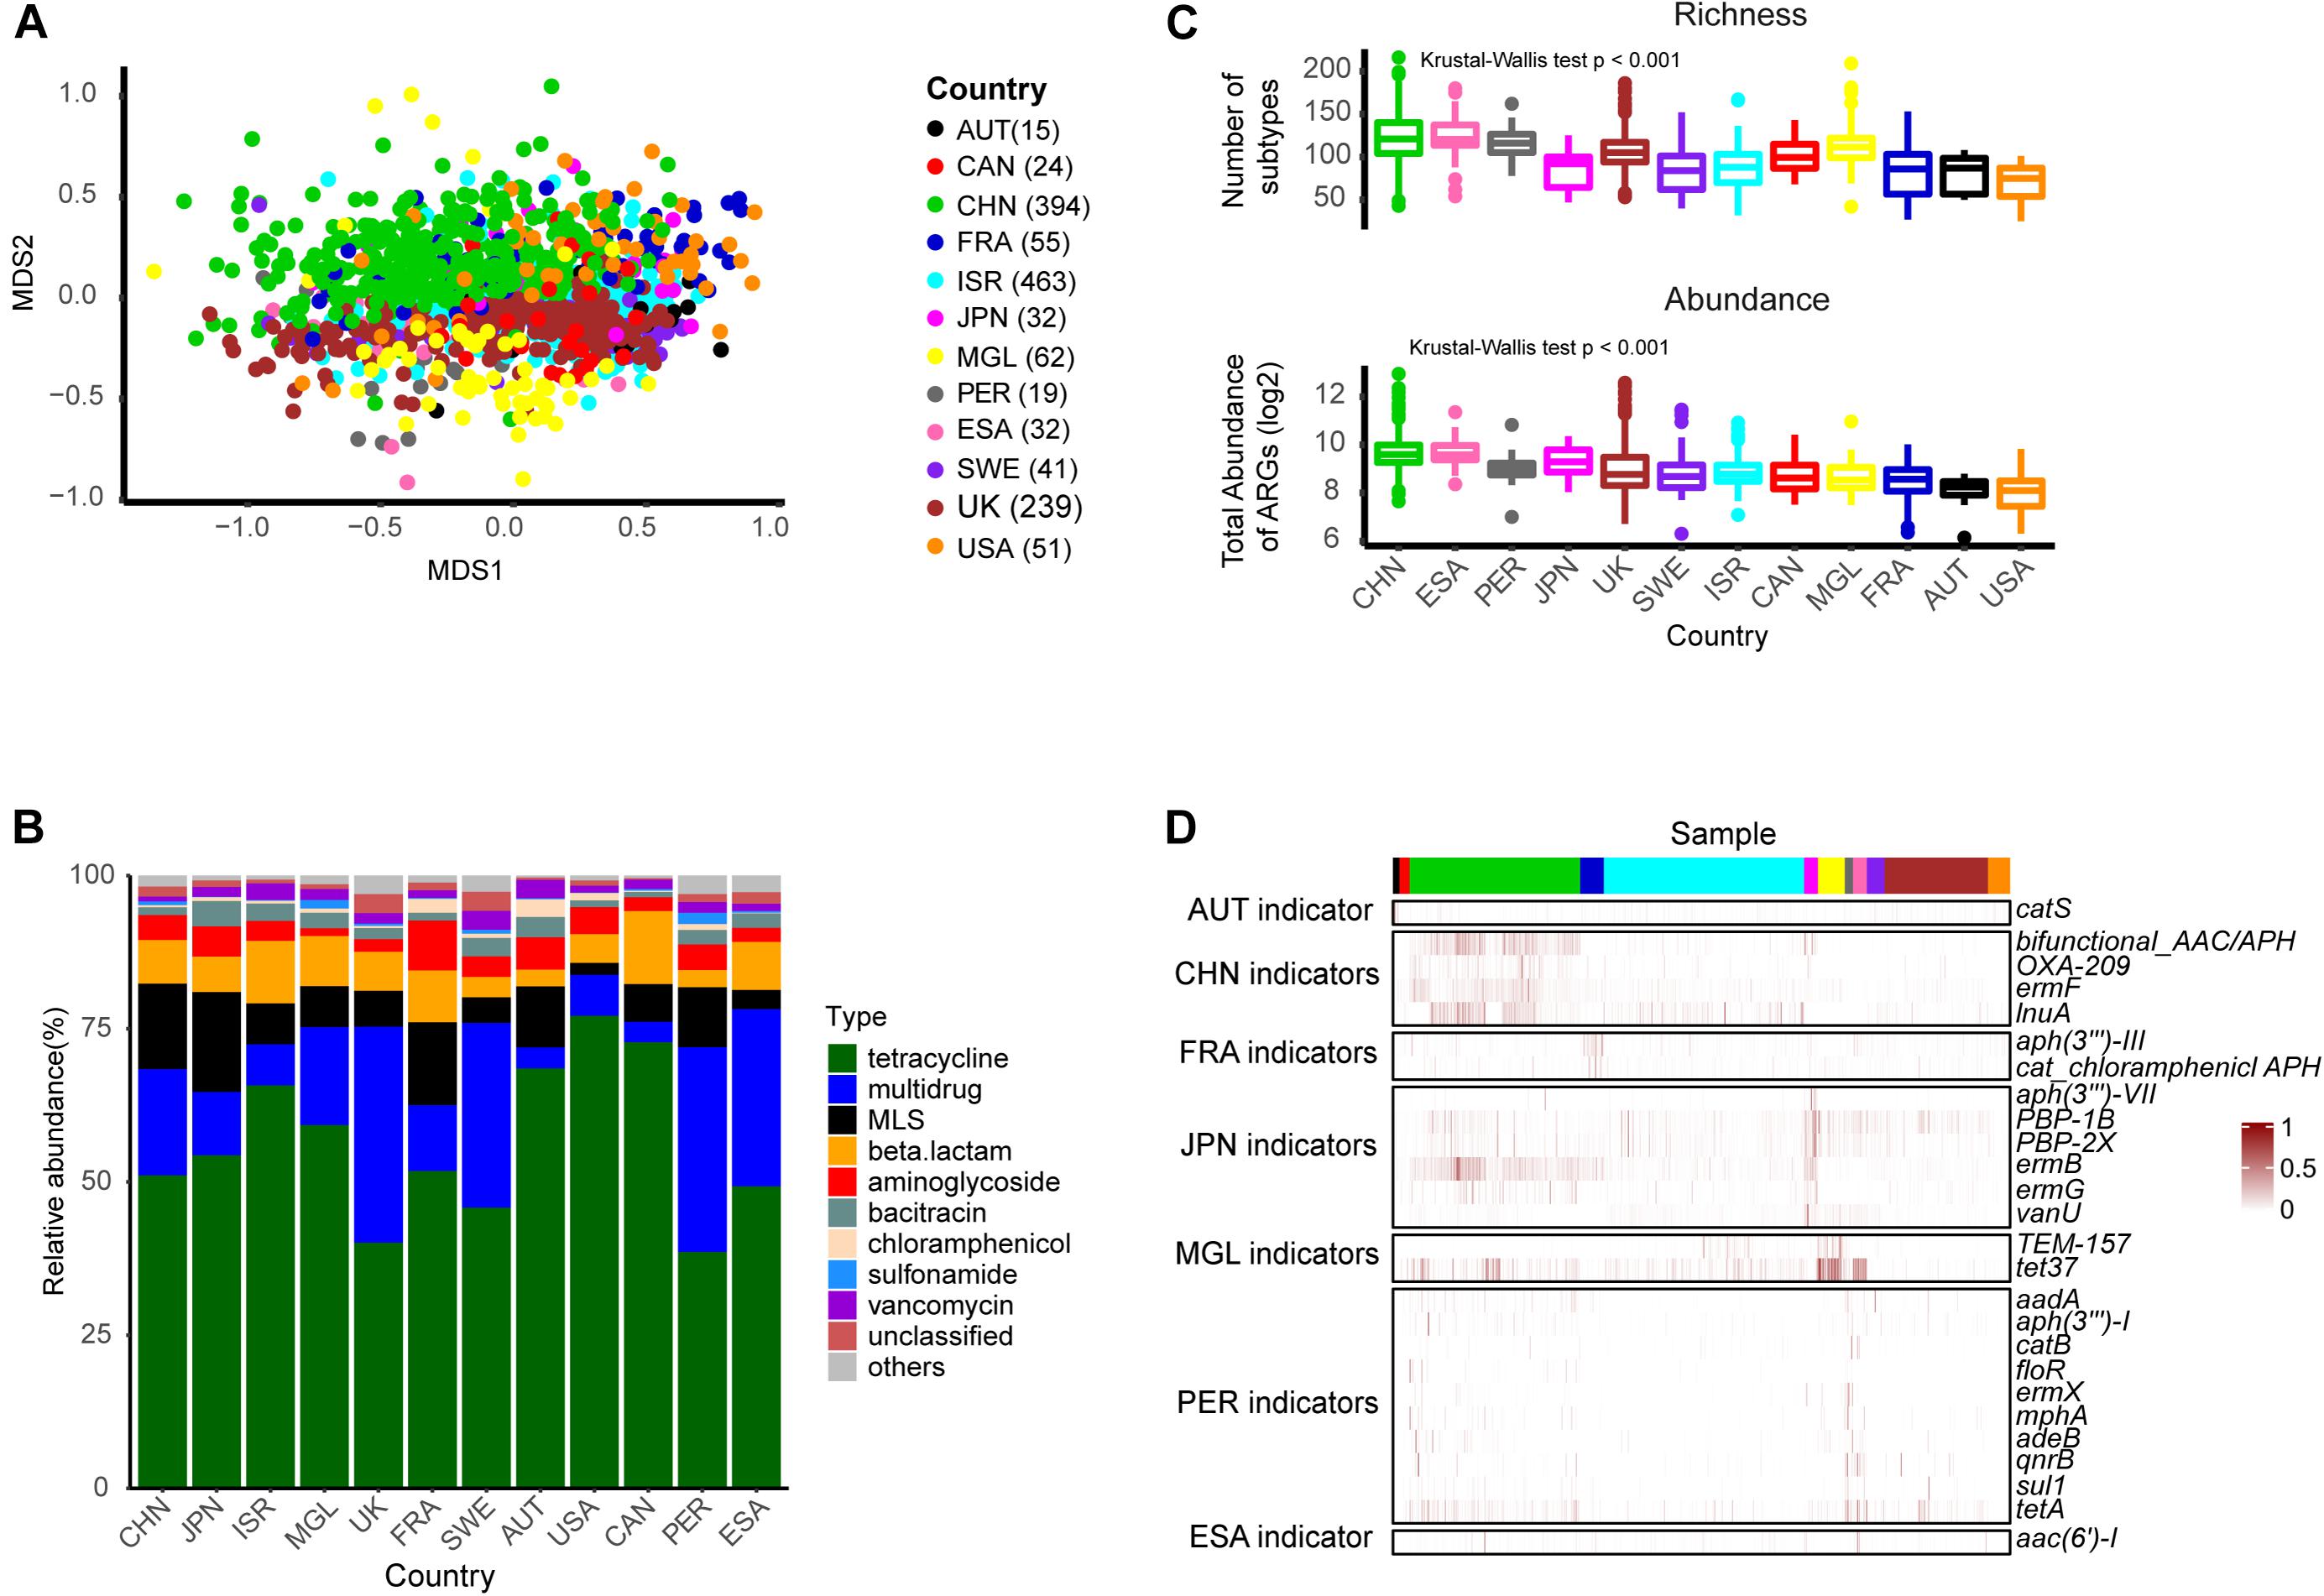
Figure 2. The ARG profile in healthy individuals across different countries. (A) Non-metric multidimensional scaling (NMDS) plot based on subtype profiles of 1,427 healthy individuals. (B) Composition of types. (C) Richness of subtypes and total resistance potential across countries. (D) Heatmap of scaled abundance for the 26 indicator subtypes (row) in each sample (column). The number in the brackets indicated the corresponded number of individuals. Abbreviations: AUT, Austria; CHN, China; CAN, Canada; ESA, EI Salvador; FRA, France; ISR, Israeli; JPN, Japan; MGL, Mongolia; PER, Peru; SWE, Sweden.
We then compared ARG richness and potential resistance across different countries, based on the number of subtypes and total abundance for each sample, respectively. As shown in Figure 2C, there were significant differences among these populations. Chinese and EI Salvador samples presented higher resistance potential than the others, which was consistent with previous studies (Pehrsson et al., 2016; Feng et al., 2018; Li et al., 2018). Region-specific subtypes were identified using the R package labdsv. We identified 26 subtypes according to the criteria of IV > 0.3, p-value < 0.05 (Figure 2D and Supplementary Table S4) including six aminoglycoside subtypes [aac(6′)-I, aadA, aph(3″)-I, aph(3″′)-III, aph(3′)-VII, and bifunctional aminoglycoside N-acetyltransferase and aminoglycoside phosphotransferase], six MLS subtypes (ermB, ermF, ermG, ermX, lnuA, mphA), four beta-lactam subtypes(OXA-209, PBP-1B, PBP-2X, TEM-157), four chloramphenicol subtypes (catB, catS, floR, and cat chloramphenicol acetyltransferase), two tetracycline subtypes (tet37, tetA), one multidrug subtype (adeB), one quinolone type (qnrB), one sulfonamide (sul1), and one vancomycin (vanU). Ten markers were enriched in the Peruvian population, which involved a limited sample number in the present study. Japanese and Chinese counts were closely behind, accounting for six and four markers, respectively. Previous studies (Hu et al., 2013) have mentioned that ermF was China’s representative ARG subtype. Correspondingly, we also found the ermF gene subtype (IV = 0.36, p-value = 0.001) within the MLS type to be a Chinese indicator. Another subtype, however, bifunctional aminoglycoside N acetyltransferase and aminoglycoside phosphotransferase may be more representative of China, because we found a higher indval value (IV = 0.51, p-value = 0.001) for it.
In general, our results based on a large baseline number of samples, were consistent with previous findings: that is, the composition of the human-associated resistome was geographic-specific.
ARG Abundance and Richness in Most Disease State
To describe bias caused by disease, we focused on the 1,004 Chinese samples from seven independent disease state studies: CRC, T2D, liver cirrhosis, RA, (pre)hypertension, psoriasis, and AS. We first examined whether factors such as sample region, age, sex, or BMI could have confounding effects in a healthy subset of the data population (Table 1). Similar to the above results, the geographic effect was obvious. Conversely, the effect of age, sex, or BMI was not significant. To avoid interference of geographic origin, we analyzed each disease dataset separately.
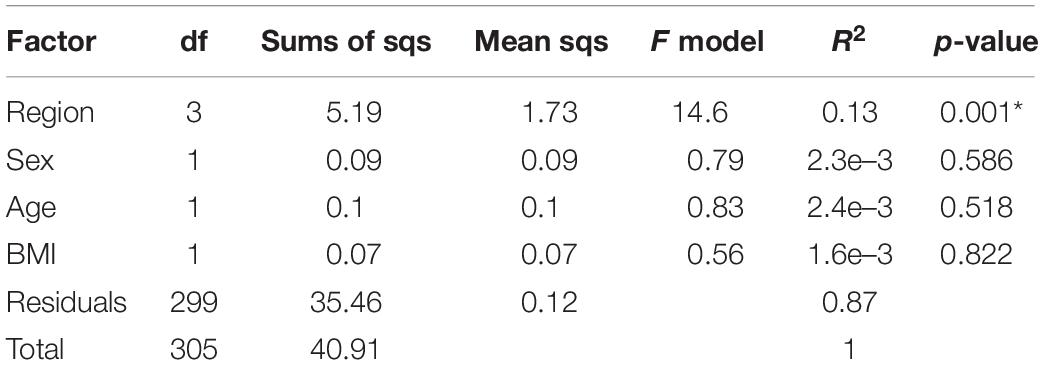
Table 1. PERMANOVA analysis based on healthy Chinese population.
ARG total abundance and richness were compared in each of the seven datasets, and remarkable differences emerged in most (Figure 3). Both indices in T2D (Richness: p-value = 0.019; Abundance: p-value = 0.006) and liver cirrhosis (Richness: p-value = 0.001; Abundance: p-value < 0.001) went beyond those in healthy controls significantly. AS groups had richer ARG diversity (p-value = 0.034), while patients with other diseases had no apparent effect on ARG profiles.
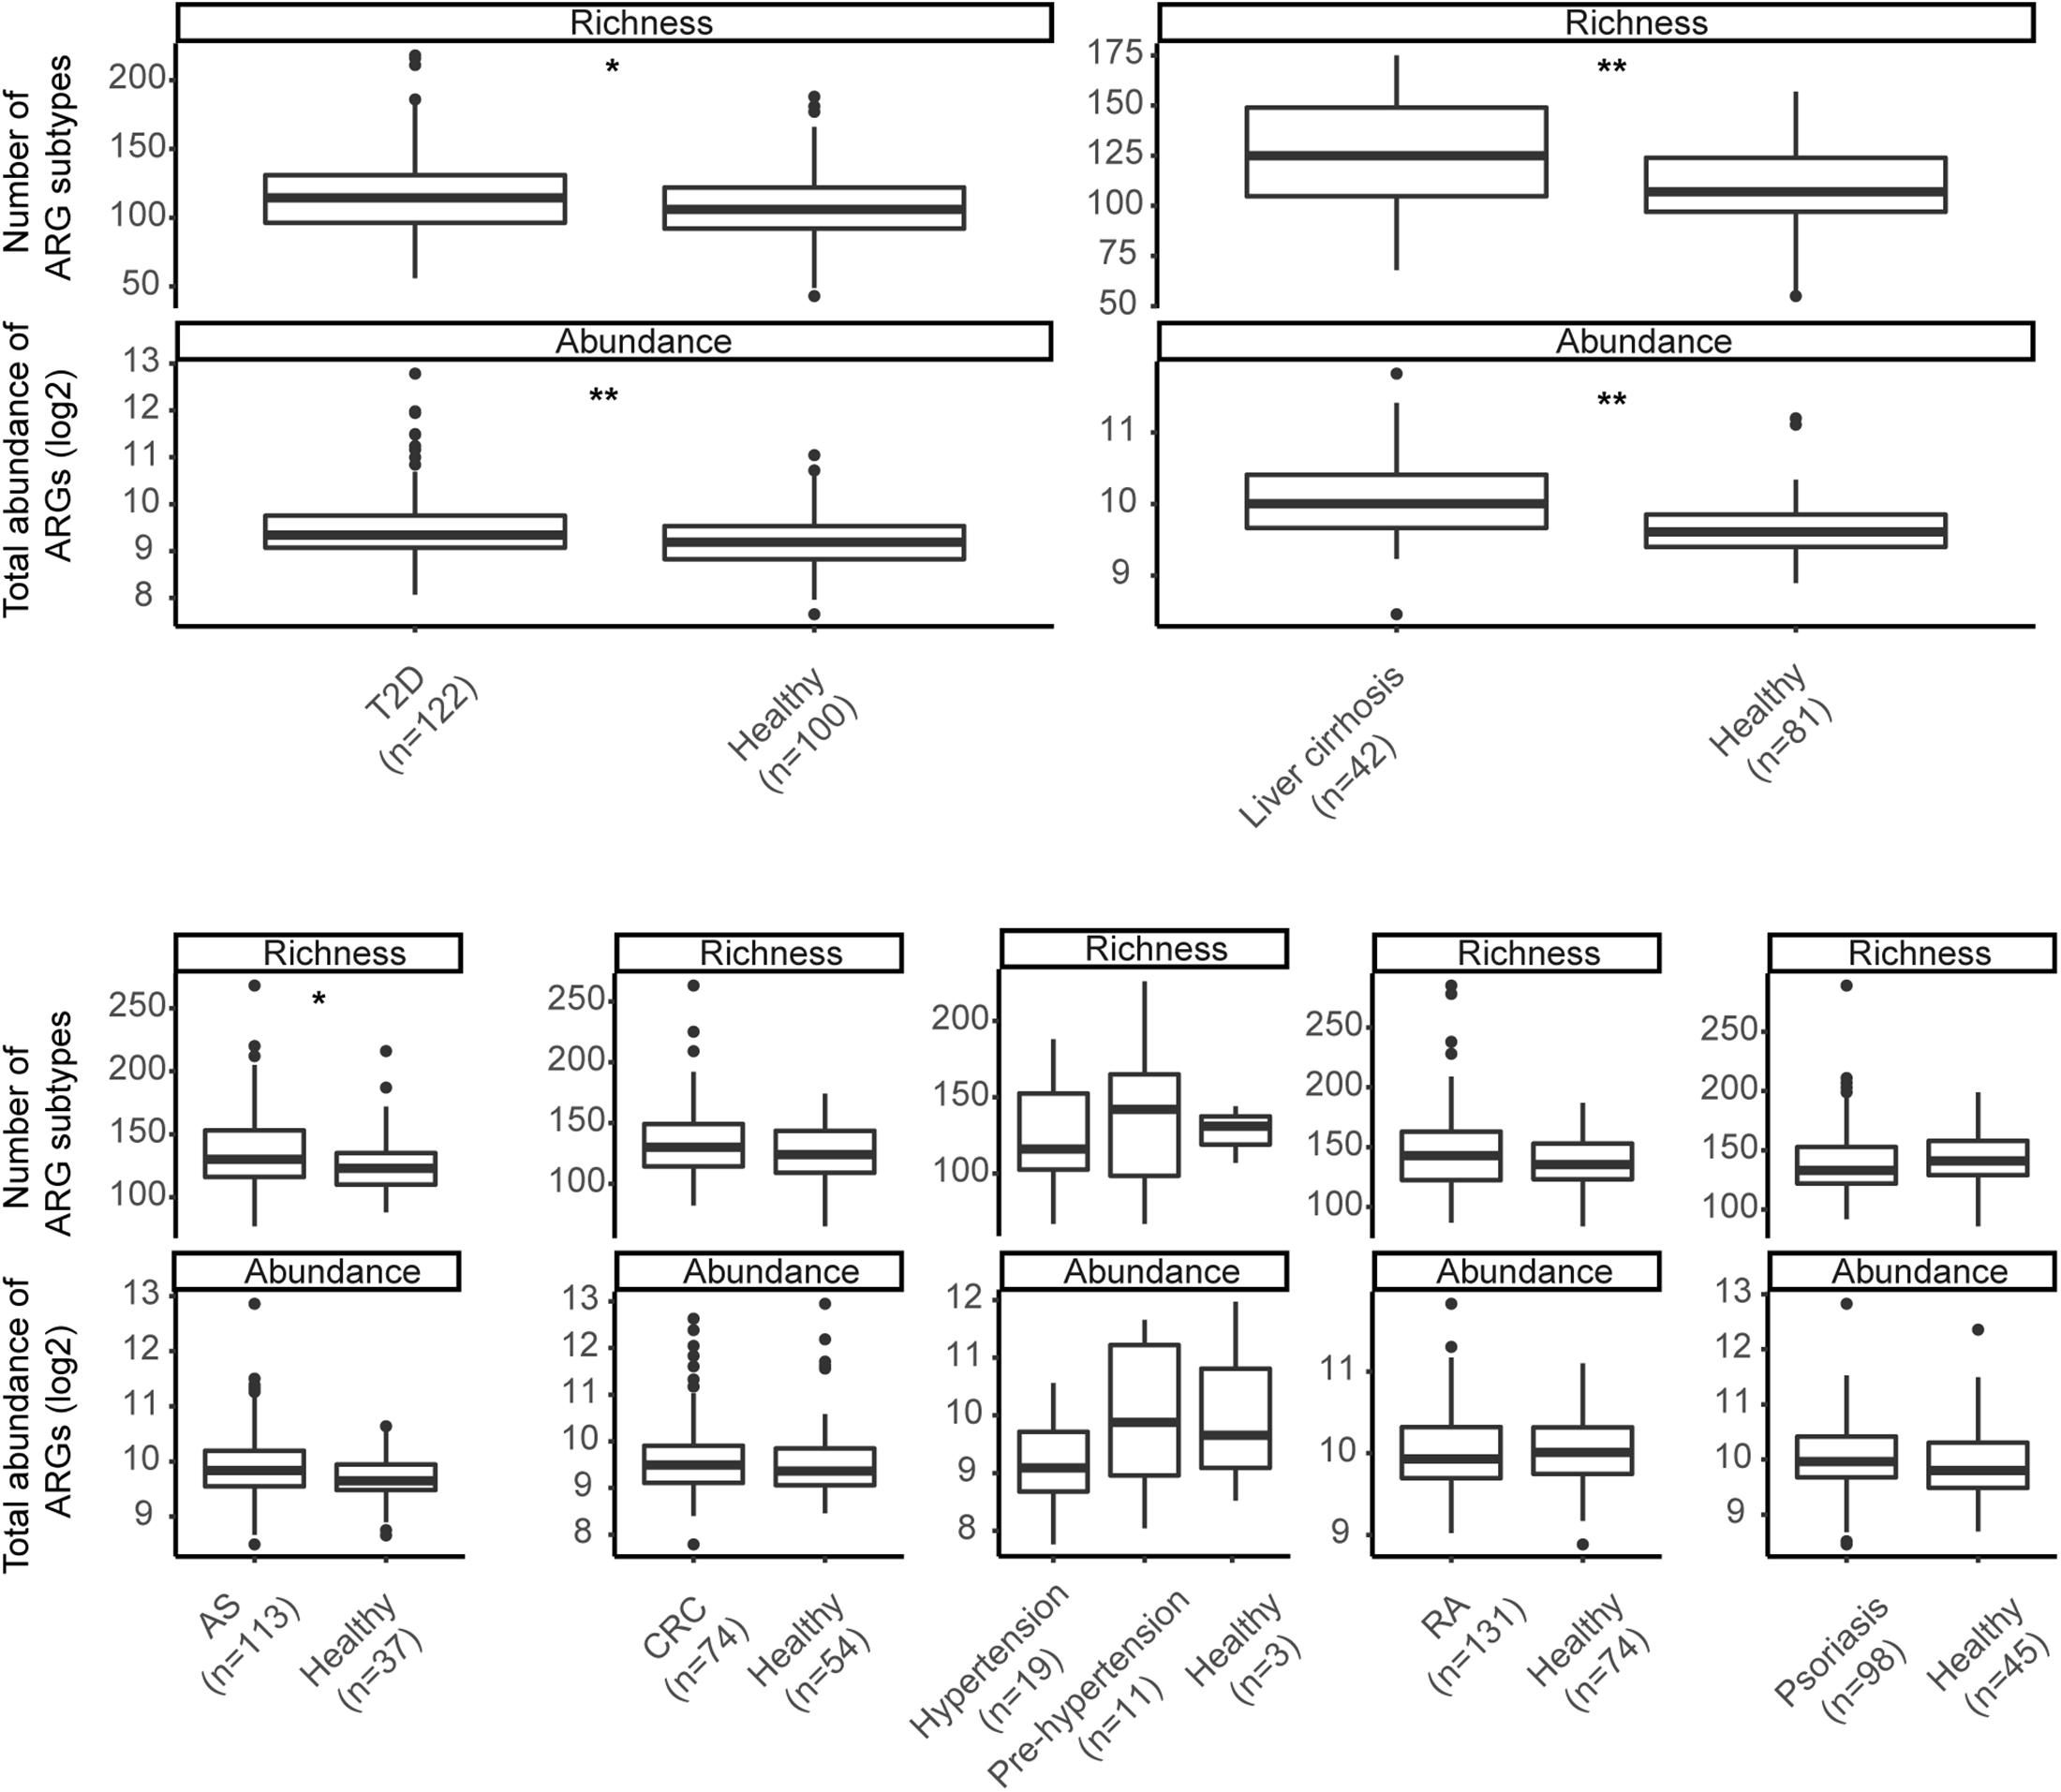
Figure 3. Richness of subtypes and total abundance of ARGs between seven diseases and corresponding controls. Asterisks indicate significant differences (Wilcoxon sum-rank test). * p-value ≤ 0.05; ** p-value ≤ 0.01.
Shared ARG Markers Between Different Diseases
We further identified the ARGs enriched in different disease groups. At the cutoff of IV > 0.3 and p-value < 0.05, 147 subtypes were found to be differently enriched between different diseases and corresponding controls (Supplementary Table S5). The T2D and liver cirrhosis group was enhanced by the most subtypes (69 and 67, respectively), while only one subtype (tetX) was enriched in the psoriasis group. We could not find any universal pattern of disease markers. Indeed, none of these ARGs were shared by more than three conditions (Supplementary Table S6). The enriched ARGs may reflect the clinical experience of patients. For example, ARGs from the sulfonamide type enhanced in the AS dataset patient group (IV = 0.795, p-value = 0.002), consistent with those patients’ exposure to sulfasalazine. A large number of multidrug subtypes was found in patients with liver cirrhosis, many of whom have had a high reported prevalence of multidrug-resistant (MDR) bacterial infection in a previous study (Piano et al., 2019). In general, these results indicated heterogeneous differential ARGs across different disease states.
Correlation Between Resistance Genes and Microbial Taxa
Apart from the selective pressure of antibiotics, microbial composition may shape the ARG profile. In support of this notion, our Procrustes analysis showed that give ARG subtypes had significant associations with particular microbial species (Figure 4A, M2 = 0.912, p-value = 0.001). More detailed resistance gene and bacterial phylogeny information was acquired using network analysis. Pairs with Spearman r > 0.5 and p-value < 0.05 were used to stand for co-occurrence patterns. A total of 74 nodes (13 species and 61 ARG subtypes) and 93 edges (subtypes-species connections) were included in the co-occurrence network (Figure 4B). The resulting figure clearly showed Escherichia coli to be a hub node with a high degree of connectedness. It co-occurred with most ARG subtypes, including 31 multidrug resistance genes (e.g., acrA, acrB, acrF, bcr, emrA, emrB), seven unclassified type genes (e.g., LuxR, cpxR, gadX), and three beta-lactam resistance genes (class C beta-lactamase, TEM_1, and TEM_117).
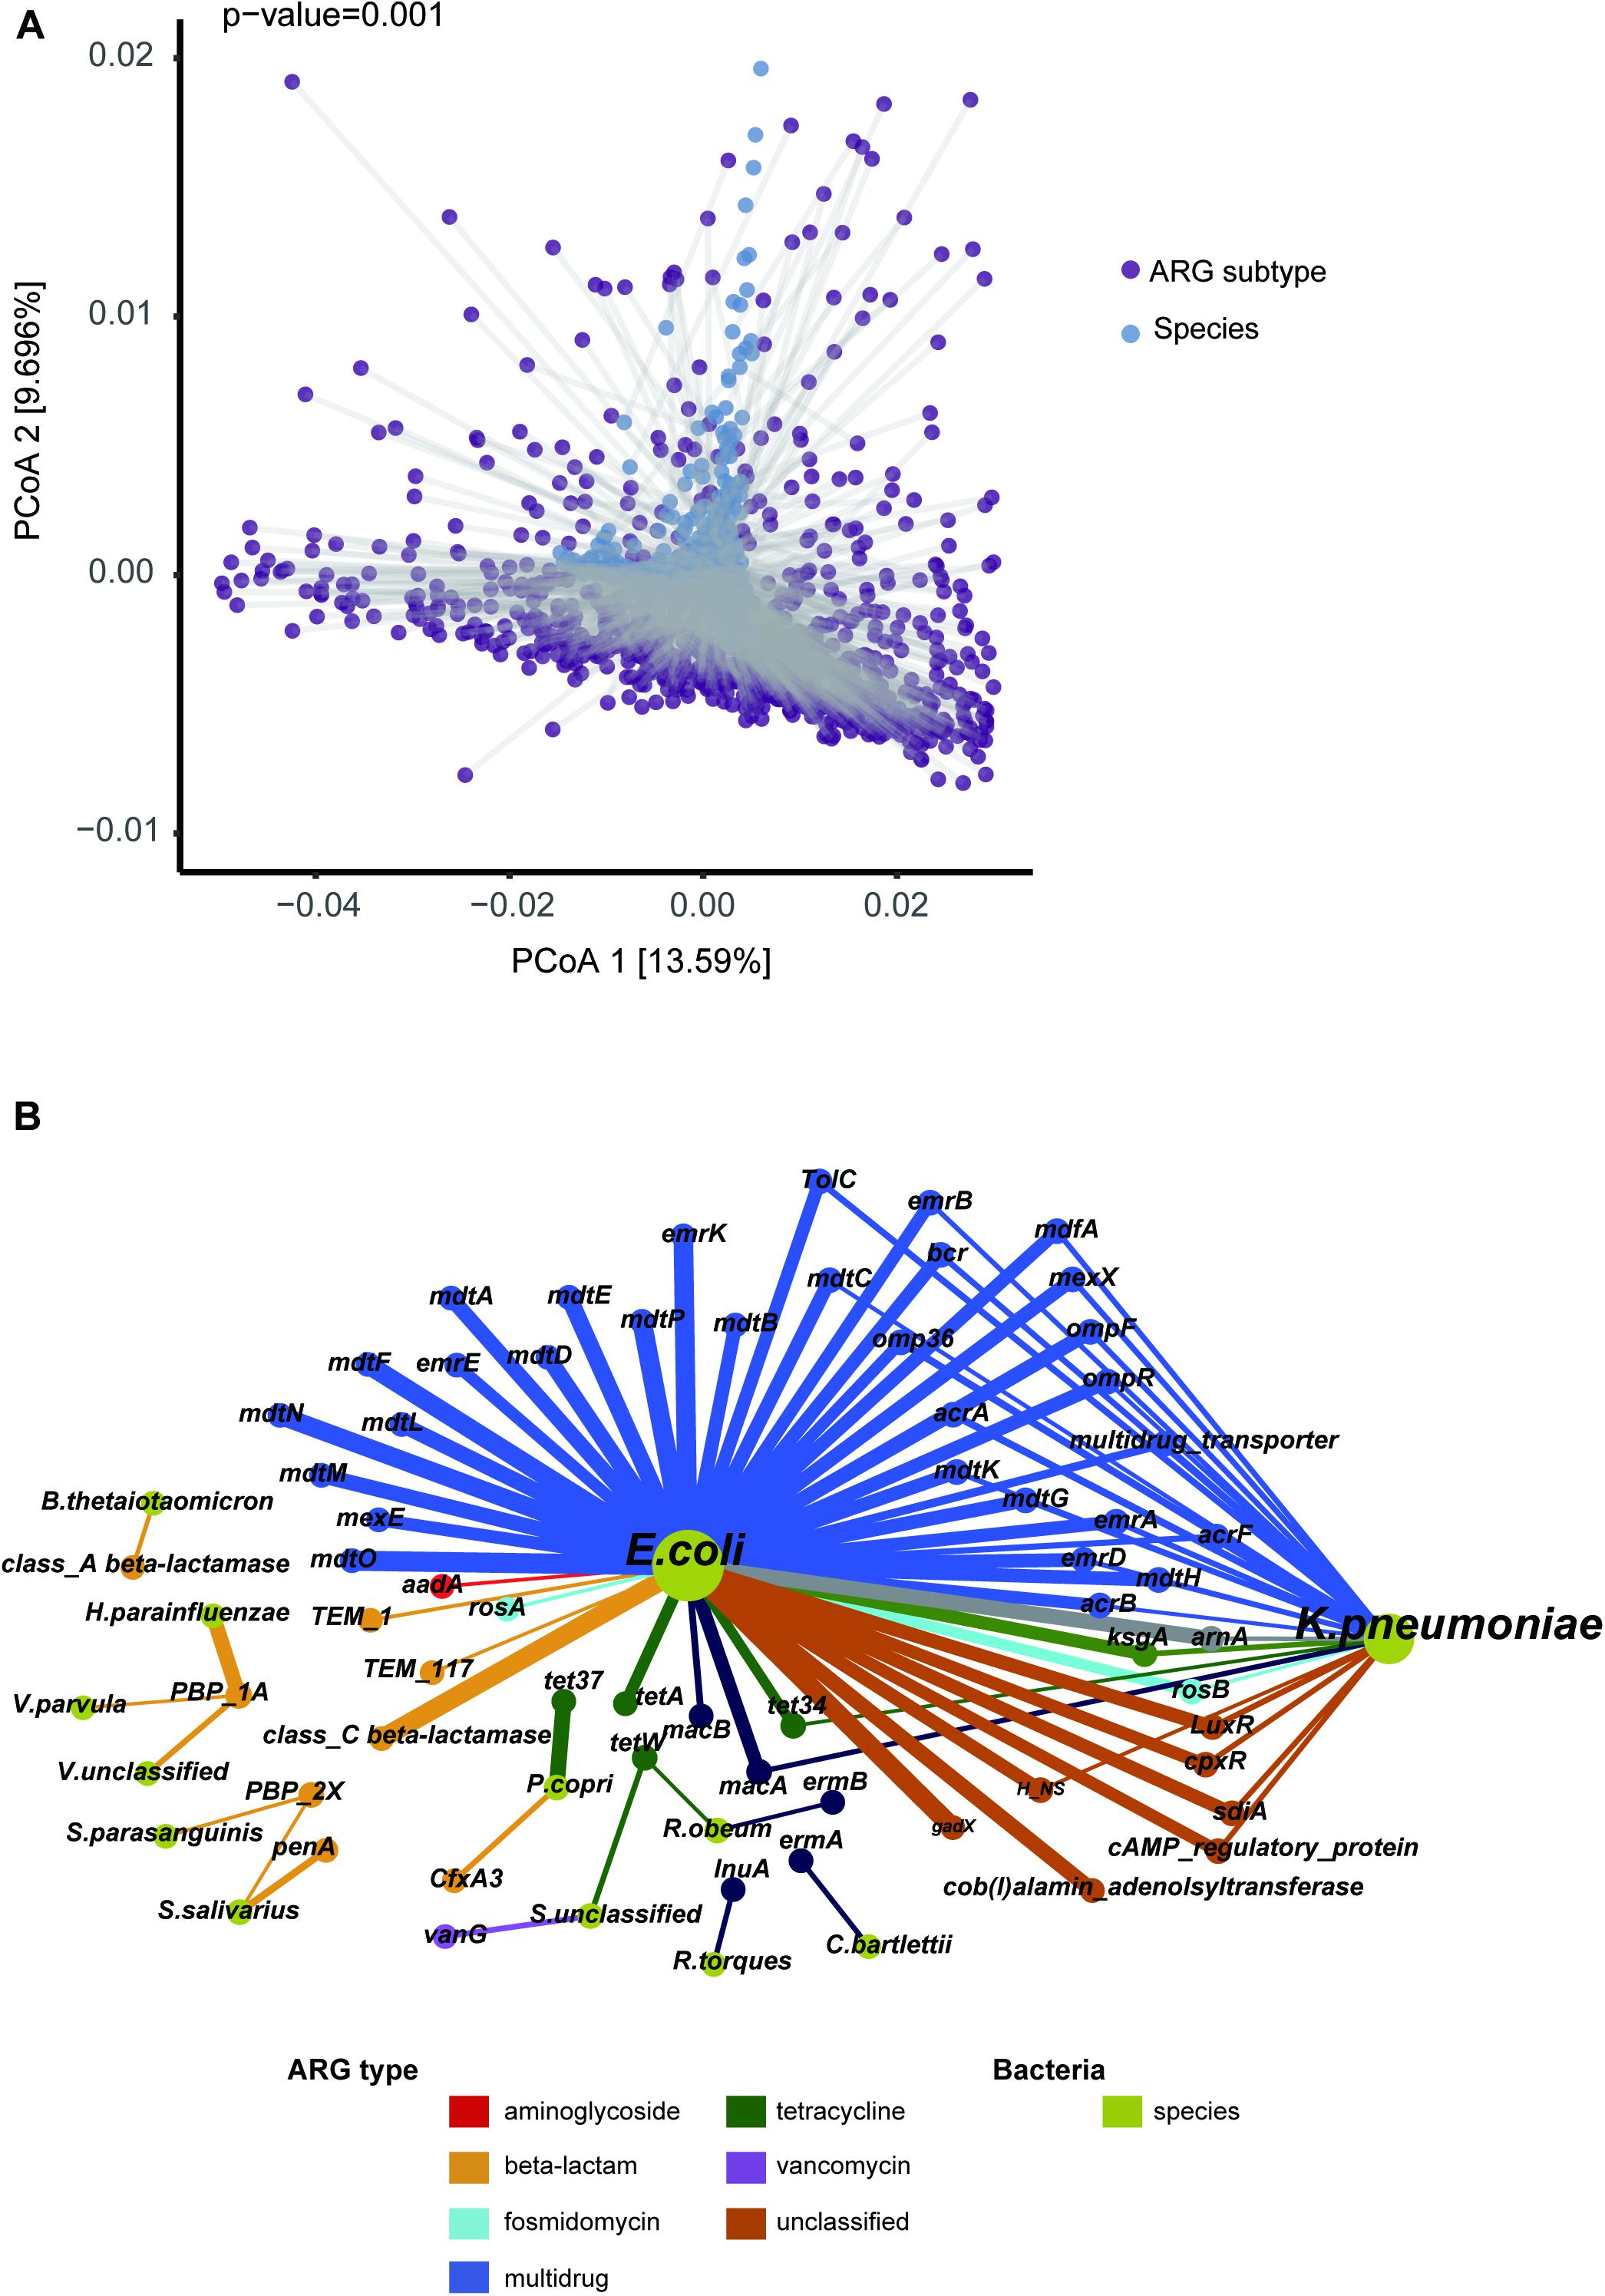
Figure 4. Correlation of ARG subtype and bacteria species. (A) Significant agreement between average species and average resistome distances by Procrustes analysis (Monte Carlo p-value = 0.001). (B) Network representing the co-occurrence patterns between microbial species and ARG subtypes. The chartreuse nodes represent bacterial species. The other nodes represent ARG subtypes, with color according to type. The node size is proportional to degree of occurrence. An edge is a strong (r > 0.5) and significant (p-value < 0.05) connection between nodes.
Relationships between ARG markers and different species, in comparison to that between disease states and controls, were noteworthy. For example, E. coli was a T2D-enriched bacteria identified by LEfSe (Supplementary Table S7) and predicted to harbor most of the T2D-enriched subtypes. Streptococcus salivarius was more abundant in a liver cirrhosis disease group and might play a key role in promoting cirrhosis with hepatic encephalopathy (Zhang et al., 2013). Our study showed this group to potentially carry beta-lactam resistance subtypes PBP-2X (Spearman r = 0.502, p-value < 0.01) and penA (Spearman r = 0.607, p-value < 0.01). We also found PBP-2X to be correlated with another cirrhosis-associated bacteria Streptococcus_parasanguinis. Another beta-lactam resistance subtype that we found, PBP-1A, was predicted to be carried by Haemophilus parainfluenzae, Veillonella parvula, and Veillonella_unclassified by our correlation analysis, all of which were enriched bacteria in patients with cirrhosis in our study.
Discussion
We reanalyzed the metagenomic sequence data of 2,037 samples, focusing on geographic and disease effects on the gut resistome. In general, we found geographic origin to be a substantial factor impacting the composition of human gut resistance genes, which agrees with most previous studies. Disease status effects on the gut resistome were heterogeneous, and further investigations may help unearth the value of ARG in disease research and clinical applications.
As expected, tetracycline, aminoglycoside, beta-lactam, MLS, vancomycin, and multidrug resistance genes were the dominant types in the human gut. Larger sample size would help to identify rare ARGs. Regardless, carbomycin, fusidic-acid, and spectinomycin resistance genes were not detected at all. These three types, coupled with puromycin, tetracenomycin_C, and fusaric-acid, were defined as rare types in our data. The unevenness in ARG abundance and prevalence that we observed may be due to: (i) The way antibiotics are used. For example, dominant antibiotics like tetracycline, aminoglycoside, beta-lactam, and MLS have been widely used in animals-based food productions and in human medical care for a very long time, while fusidic-acid and puromycin are primarily used as scientific tools, not particularly suitable for large-scale application toward medical use and food production. (ii) The limitations of the resistome database itself. Reference sequence counts of rare ARG types in SARGv2 are less than 10. This rare sequence sparsity may be contributed to low detection rates. Regardless, a well-established and up-to-date database needs to be representative of reality, and the number of resistance gene types in the database also needs to be determined by the utilization of antibiotics in the real world. Indeed, SARGv2 contains sequences not only from the two most commonly used resistance gene databases, CARD and ARDB, but also carefully selected and curated sequences from the latest protein collection of the NCBI-NR database. The extensive collection of reference sequences in SARGv2 enables less bias in quantitative and qualitative analyses of ARGs (Yin et al., 2018). Moreover, the knowledge gained from large-scale quantifications of known resistance genes can be used as a proxy for the non-characterized fraction of the resistome in a given environment (Bengtsson-Palme, 2018). Generally, our results reinforce the notion that most ARGs in the human gut are those resistant for widely used antibiotics.
Analysis of ARG distribution in the population provides an important indicator for public health policies. For example, similar patterns of resistance between countries indicate an extensive spread of resistance, and inter-country collaborative mechanisms will be urgently needed for the rational use of antibiotics (Zhang et al., 2006). The widespread ARG subtypes identified in our study, such as tetQ, tetW, CfxA2, ermF, bacA, and vanR, are consistent with previous studies (Seville et al., 2009; Hu et al., 2013; Gibson et al., 2015; Fitzpatrick and Walsh, 2016). We also found some subtypes with region-specific markers that have not been mentioned before, such as the MLS type lnuA for China, catS for Austria, aph(3′)-VII for Japan, and sul1 for Peru. These findings strengthen the view that geographic origin strongly impacts the composition of the human-associated resistome, and provide some promising indicators for surveillance programs of antibiotic resistance.
In addition to geographic variation, we were concerned about antibiotic resistance in patient groups. Previous studies and our data suggest that bacterial phylogeny could structure the antibiotic resistome (Forsberg et al., 2014). Various diseases are known to be associated with intestinal microbiota alterations, which may be reflected in the resistome. A recent example (Vich Vila et al., 2018) was paradigmatic in this respect. In the large population from 1792 participants consisting of inflammatory bowel disease (IBD), irritable bowel syndrome (IBS) and controls, changes in the microbiome composition in patients had an impact on the antibiotic resistance load, although the majority of individuals were not taking antibiotics. In our current study, total resistance abundance or richness alteration was found in most diseases, but no consistent pattern of ARGs was observed. In liver cirrhosis and T2D, some resistance gene perturbations identified were related to the disease-associated bacteria, while a similar outcome was not seen in CRC or autoimmune disorders. This heterogeneity may be attributed to disease characteristics, various treatment regimens, and/or lifestyles among groups of people. For example, a high prevalence of MDR bacterial infection is common in patients with cirrhosis (Piano et al., 2019), which is in quite good agreement with our finding of the enrichment of many multidrug resistance genes in these individuals. Furthermore, most of AS patients in our dataset experienced treatment with sulfasalazine at some point. Although the washout period between intervention and sampling was at least three months, enrichment of sulfonamides type ARGs is still observed in this group of patients. These phenomena imply that ARGs in disease can provide the following indications: (i) The host bacteria of some resistance genes are associated with the etiology of some non-infectious disease. Antibiotic exposure may make it predominant, potentially leading to disease status. In this context, ARGs may be used as indicators for prediction and antibiotic intervention in these diseases; (ii) Disease-associated microbes, identified merely based on the analysis of differences between groups, may be false positives contributed from antibiotic exposure. Patient groups are more likely to be exposed to medical environments with a variety of drugs, and a long-term effect is pronounced in their gut microbiome. This could partly explain why bacteria that are abundant in some diseases are enriched in the healthy group in other studies. In our research, Streptococcus parasanguinis and Streptococcus salivarius were associated with cirrhosis but enriched in healthy control in AS dataset. Given these bacteria’s strong association with PBP-2X and penA, further investigations are needed to validate whether they are involved in the pathological process of cirrhosis.
We acknowledge there are some limitations in the current study. First, the samples come from 12 countries, which might not be representative of all world enough, although the geographic scope of these countries covers Europe, America and Asia. Incorporating the data from more different regions, such as traditional populations in Africa, may help to gain additional insights. Second, the geographic sample distribution is non-homogeneous. In baseline of gut ARG distribution profile in healthy individuals, this may lead to biased identification of region-specific ARG markers, especially those in regions with relatively small sample size. When focusing on the unhealthy population, there are 7 disease groups and all samples are from China, which makes the findings insufficient to generalize. Further investigation with more types of diseases, together with comparison their ARG markers between different cohorts are warranted to reach a stronger and fairer conclusion. Third, we used the Spearman’s analysis to relate ARG subtype and species. The significant positive coefficient may further indicate the host-gene relationship. However, resistant genes can be transferred from one to another by mobile genetic elements (MGEs) in the real world. As a result, some genes cannot be identified merely through correlation analysis, especially those that have been widely distributed in most bacteria. More reliable information of ARG host can be obtained by the genome sequence analysis at strain level. Finally, it would be interesting to see if the degree of population resistome variation is at the same level as the other microbiome function. We will focus on the relationship between ARGs and other gene families in the future work. Nevertheless, our work provides a broad view of the human gut resistome and highlights the value of ARG analysis in disease research and clinical applications.
Data Availability Statement
The datasets presented in this study can be found in online repositories. The names of the repository/repositories and accession number(s) can be found in the article/ Supplementary Material.
Ethics Statement
Ethical review and approval was not required for the study on human participants in accordance with the local legislation and institutional requirements. Written informed consent from the participants’ legal guardian/next of kin was not required to participate in this study in accordance with the national legislation and the institutional requirements.
Author Contributions
QQ designed the project, performed the bioinformatic analyses, drafted the data curation, interpreted the results, and revised the manuscript. JW performed the bioinformatic analyses and drafted the manuscript. BR drafted and revised the manuscript. YY drafted the data curation and interpreted the results. YC and XS performed the bioinformatic analyses and drafted the data curation. LH and TD designed the project and supervised the entire investigation. All authors contributed to the article and approved the submitted version.
Funding
This project was supported by grants from the National Natural Science Foundation of China (2017, Grant No. 81704081).
Conflict of Interest
The authors declare that the research was conducted in the absence of any commercial or financial relationships that could be construed as a potential conflict of interest.
Acknowledgments
We are grateful to the providers who submitted the metagenomics-seq data to the public databases. We also thank Steven M. Thompson, from Liwen Bianji, Edanz Editing China (www.liwenbianji.cn/ac), for editing the English text of a draft of this manuscript.
Supplementary Material
The Supplementary Material for this article can be found online at: https://www.frontiersin.org/articles/10.3389/fmolb.2020.590018/full#supplementary-material
Supplementary Table 1 | Sample information.
Supplementary Table 2 | ARG type abundance in all samples.
Supplementary Table 3 | ARG subtype abundance in all samples.
Supplementary Table 4 | The 26 subtype markers of country identified by the R package Laboratory for Dynamic Synthetic Vegephenonenology (labdsv). Those IV value > 0.3 with corresponding p-values < 0.05 are listed here.
Supplementary Table 5 | The 147 different subtypes between diseases and corresponding controls.
Supplementary Table 6 | Resistance genes in disease relative to controls. Solid color is indicative of significant enrichment in the disease group (color) or control group (gray).
Supplementary Table 7 | Pairs used to build the network. Bacteria is annotated if it is identified as a different taxa by Linear discriminant analysis effect size (LEfSe).
Abbreviations
ARG, antibiotic resistance gene; AS, ankylosing spondylitis; BMI, body mass index; CRC, colorectal cancer; IBD, inflammatory bowel disease; IBS, irritable bowel syndrome; MLS, macrolide-lincosamide-streptogramin; PERMANOVA, permutational multivariate analysis of variance; RA, rheumatoid arthritis; SARG, structured antibiotic resistance genes database; T2D, type 2 diabetes.
Footnotes
References
Bastian, M., Heymann, S., and Jacomy, M. (2009). “Gephi: an open source software for exploring and manipulating networks,” in Proceedings of the Third International Conference on Weblogs and Social Media, ICWSM 2009, San Jose, CA.
Bengtsson-Palme, J. (2018). The diversity of uncharacterized antibiotic resistance genes can be predicted from known gene variants—but not always. Microbiome 6:125. doi: 10.1186/s40168-018-0508-2
Boolchandani, M., D’Souza, A. W., and Dantas, G. (2019). Sequencing-based methods and resources to study antimicrobial resistance. Nat. Rev. Genet. 20, 356–370. doi: 10.1038/s41576-019-0108-4
Cao, Y., Wu, K., Mehta, R., Drew, D. A., Song, M., Lochhead, P., et al. (2018). Long-term use of antibiotics and risk of colorectal adenoma. Gut 67, 672–678. doi: 10.1136/gutjnl-2016-313413
Feng, J., Li, B., Jiang, X., Yang, Y., Wells, G. F., Zhang, T., et al. (2018). Antibiotic resistome in a large-scale healthy human gut microbiota deciphered by metagenomic and network analyses: antibiotic resistome. Environ. Microbiol. 20, 355–368. doi: 10.1111/1462-2920.14009
Fitzpatrick, D., and Walsh, F. (2016). Antibiotic resistance genes across a wide variety of metagenomes. FEMS Microbiol. Ecol. 92:fiv168. doi: 10.1093/femsec/fiv168
Forsberg, K. J., Patel, S., Gibson, M. K., Lauber, C. L., Knight, R., Fierer, N., et al. (2014). Bacterial phylogeny structures soil resistomes across habitats. Nature 509, 612–616. doi: 10.1038/nature13377
Forslund, K., Sunagawa, S., Coelho, L. P., and Bork, P. (2014). Metagenomic insights into the human gut resistome and the forces that shape it. Bioessays 36, 316–329. doi: 10.1002/bies.201300143
Forslund, K., Sunagawa, S., Kultima, J. R., Mende, D. R., Arumugam, M., Typas, A., et al. (2013). Country-specific antibiotic use practices impact the human gut resistome. Genome Res. 23, 1163–1169. doi: 10.1101/gr.155465.113
Fu, L., Qiu, Y., Shen, L., Cui, C., Wang, S., Wang, S., et al. (2018). The delayed effects of antibiotics in type 2 diabetes, friend or foe? J. Endocrinol. 238, 137–149. doi: 10.1530/JOE-17-0709
Gibson, M. K., Forsberg, K. J., and Dantas, G. (2015). Improved annotation of antibiotic resistance determinants reveals microbial resistomes cluster by ecology. ISME J. 9, 207–216. doi: 10.1038/ismej.2014.106
Haak, B. W., Lankelma, J. M., Hugenholtz, F., Belzer, C., de Vos, W. M., and Wiersinga, W. J. (2018). Long-term impact of oral vancomycin, ciprofloxacin and metronidazole on the gut microbiota in healthy humans. J. Antimicrob. Chemother. 74, 782–786.
Hu, Y., Yang, X., Qin, J., Lu, N., Cheng, G., Wu, N., et al. (2013). Metagenome-wide analysis of antibiotic resistance genes in a large cohort of human gut microbiota. Nat. Commun. 4:2151. doi: 10.1038/ncomms3151
Klein, E. Y., Van Boeckel, T. P., Martinez, E. M., Pant, S., Gandra, S., Levin, S. A., et al. (2018). Global increase and geographic convergence in antibiotic consumption between 2000 and 2015. Proc. Natl. Acad. Sci. U.S.A. 115, E3463–E3470. doi: 10.1073/pnas.1717295115
Leinonen, R., Sugawara, H., and Shumway, M. (2011). The sequence read archive. Nucleic Acids Res. 39, D19–D21. doi: 10.1093/nar/gkq1019
Li, B., Yang, Y., Ma, L., Ju, F., Guo, F., Tiedje, J. M., et al. (2015). Metagenomic and network analysis reveal wide distribution and co-occurrence of environmental antibiotic resistance genes. ISME J. 9, 2490–2502. doi: 10.1038/ismej.2015.59
Li, L.-G., Yin, X., and Zhang, T. (2018). Tracking antibiotic resistance gene pollution from different sources using machine-learning classification. Microbiome 6:93. doi: 10.1186/s40168-018-0480-x
Lu, N., Hu, Y., Zhu, L., Yang, X., Yin, Y., Lei, F., et al. (2015). DNA microarray analysis reveals that antibiotic resistance-gene diversity in human gut microbiota is age related. Sci. Rep. 4:4302. doi: 10.1038/srep04302
Lynch, S. V., and Pedersen, O. (2016). The human intestinal microbiome in health and disease. New Engl. J. Med. 375, 2369–2379. doi: 10.1056/NEJMra1600266
Oksanen, J., Blanchet, F. G., Friendly, M., Kindt, R., Legendre, P., McGlinn, D., et al. (2019). vegan: Community Ecology Package. Available online at: https://CRAN.R-project.org/package=vegan (accessed September 1, 2019).
Pal, C., Bengtsson-Palme, J., Kristiansson, E., and Larsson, D. G. J. (2016). The structure and diversity of human, animal and environmental resistomes. Microbiome 4:54. doi: 10.1186/s40168-016-0199-5
Pehrsson, E. C., Tsukayama, P., Patel, S., Mejía-Bautista, M., Sosa-Soto, G., Navarrete, K. M., et al. (2016). Interconnected microbiomes and resistomes in low-income human habitats. Nature 533, 212–216. doi: 10.1038/nature17672
Piano, S., Singh, V., Caraceni, P., Maiwall, R., Alessandria, C., Fernandez, J., et al. (2019). Epidemiology and effects of bacterial infections in patients with cirrhosis worldwide. Gastroenterology 156, 1368–1380.e10. doi: 10.1053/j.gastro.2018.12.005
Rampelli, S., Schnorr, S. L., Consolandi, C., Turroni, S., Severgnini, M., Peano, C., et al. (2015). Metagenome sequencing of the hadza hunter-gatherer gut microbiota. Curr. Biol. 25, 1682–1693. doi: 10.1016/j.cub.2015.04.055
Roberts, D. W. (2019). labdsv: Ordination and Multivariate Analysis for Ecology. Available online at: https://CRAN.R-project.org/package=labdsv (accessed August 4, 2019).
Segata, N., Izard, J., Waldron, L., Gevers, D., Miropolsky, L., Garrett, W. S., et al. (2011). Metagenomic biomarker discovery and explanation. Genome Biol. 12:R60. doi: 10.1186/gb-2011-12-6-r60
Segata, N., Waldron, L., Ballarini, A., Narasimhan, V., Jousson, O., and Huttenhower, C. (2012). Metagenomic microbial community profiling using unique clade-specific marker genes. Nat. Methods 9, 811–814. doi: 10.1038/nmeth.2066
Seville, L. A., Patterson, A. J., Scott, K. P., Mullany, P., Quail, M. A., Parkhill, J., et al. (2009). Distribution of tetracycline and erythromycin resistance genes among human oral and fecal metagenomic DNA. Microb. Drug Resist. 15, 159–166. doi: 10.1089/mdr.2009.0916
Vich Vila, A., Imhann, F., Collij, V., Jankipersadsing, S. A., Gurry, T., Mujagic, Z., et al. (2018). Gut microbiota composition and functional changes in inflammatory bowel disease and irritable bowel syndrome. Sci. Transl. Med. 10:eaa8914. doi: 10.1126/scitranslmed.aap8914
Wypych, T. P., and Marsland, B. J. (2018). Antibiotics as instigators of microbial dysbiosis: implications for asthma and allergy. Trends Immunol. 39, 697–711. doi: 10.1016/j.it.2018.02.008
Yang, J. H., Bhargava, P., McCloskey, D., Mao, N., Palsson, B. O., and Collins, J. J. (2017). Antibiotic-induced changes to the host metabolic environment inhibit drug efficacy and alter immune function. Cell Host Microbe 22, 757–765.e3. doi: 10.1016/j.chom.2017.10.020
Yin, X., Jiang, X.-T., Chai, B., Li, L., Yang, Y., Cole, J. R., et al. (2018). ARGs-OAP v2.0 with an expanded SARG database and hidden markov models for enhancement characterization and quantification of antibiotic resistance genes in environmental metagenomes. Bioinformatics 34, 2263–2270. doi: 10.1093/bioinformatics/bty053
Zhang, J., Haines, C., Watson, A. J. M., Hart, A. R., Platt, M. J., Pardoll, D. M., et al. (2019). Oral antibiotic use and risk of colorectal cancer in the United Kingdom, 1989-2012: a matched case-control study. Gut 68, 1971–1978. doi: 10.1136/gutjnl-2019-318593
Zhang, R., Eggleston, K., Rotimi, V., and Zeckhauser, R. J. (2006). Antibiotic resistance as a global threat: evidence from China, Kuwait and the United States. Globalization Health 2:6.
Keywords: gut microbiome, antibiotics, antibiotics resistance genes, resistome, metagenomics
Citation: Qiu Q, Wang J, Yan Y, Roy B, Chen Y, Shang X, Dou T and Han L (2020) Metagenomic Analysis Reveals the Distribution of Antibiotic Resistance Genes in a Large-Scale Population of Healthy Individuals and Patients With Varied Diseases. Front. Mol. Biosci. 7:590018. doi: 10.3389/fmolb.2020.590018
Received: 31 July 2020; Accepted: 12 October 2020;
Published: 30 October 2020.
Edited by:
Xingyu Zhang, University of Michigan, United StatesReviewed by:
Ana Cláudia Coelho, University of Trás-os-Montes and Alto Douro, PortugalLenwood Scott Heath, Virginia Tech, United States
Yanfei Chen, Zhejiang University, China
Gianni Panagiotou, Leibniz Institute for Natural Product Research and Infection Biology, Germany
Copyright © 2020 Qiu, Wang, Yan, Roy, Chen, Shang, Dou and Han. This is an open-access article distributed under the terms of the Creative Commons Attribution License (CC BY). The use, distribution or reproduction in other forums is permitted, provided the original author(s) and the copyright owner(s) are credited and that the original publication in this journal is cited, in accordance with accepted academic practice. No use, distribution or reproduction is permitted which does not comply with these terms.
*Correspondence: Lijuan Han, aGFubGpAZ3p1Y20uZWR1LmNu; Tongyi Dou, ZG91dHlAZGx1dC5lZHUuY24=
†These authors have contributed equally to this work