 Dan Zhou
 Youli Chen
 Zehao Wang3†
 Lei Zhang
 Jun Song
 Tao Bai
 Xiaohua Hou
- 1Division of Gastroenterology, Union Hospital, Tongji Medical College Medical College, Huazhong University of Science and Technology, Wuhan, China
- 2State Key Laboratory for Oncogenes and Related Genes, NHC Key Laboratory of Digestive Diseases, Division of Gastroenterology and Hepatology, Shanghai Institute of Digestive Disease, Renji Hospital, School of Medicine, Shanghai Jiao Tong University, Shanghai, China
- 3School of Management, Huazhong University of Science and Technology, Wuhan, China
Background: Dysbiosis is associated with colorectal cancer (CRC) and adenomas (CRA). However, the robustness of diagnostic models based on microbial signatures in multiple cohorts remains unsatisfactory.
Materials and Methods: In this study, we used machine learning models to screen metagenomic signatures from the respective cross-cohort datasets of CRC and CRA (selected from CuratedMetagenomicData, each disease included 4 datasets). Then select a CRC and CRA data set from the CuratedMetagenomicData database and meet the requirements of having both metagenomic data and clinical data. This data set will be used to verify the inference that integrating clinical features can improve the performance of microbial disease prediction models.
Results: After repeated verification, we selected 20 metagenomic features that performed well and were stably expressed within cross-cohorts to represent the diagnostic role of bacterial communities in CRC/CRA. The performance of the selected cross-cohort metagenomic features was stable for multi-regional and multi-ethnic populations (CRC, AUC: 0.817–0.867; CRA, AUC: 0.766–0.833). After clinical feature combination, AUC of our integrated CRC diagnostic model reached 0.939 (95% CI: 0.932–0.947, NRI=30%), and that of the CRA integrated model reached 0.925 (95%CI: 0.917–0.935, NRI=18%).
Conclusion: In conclusion, the integrated model performed significantly better than single microbiome or clinical feature models in all cohorts. Integrating cross-cohort common discriminative microbial features with clinical features could help construct stable diagnostic models for early non-invasive screening for CRC and CRA.
1 Introduction
Colorectal cancer (CRC) ranks as the third most diagnosed cancer and a leading cause of death in both men and women globally (Sung et al., 2021). Colonoscopy is now considered the reference standard for the detection and prevention of CRC (Dekker and Rex, 2018). However, in clinical practice, factors such as unsatisfactory bowel preparation, invasiveness, long time and high expenses of examinations and appointments, etc., greatly limited the screening efficiency and patient adherence (Lee et al., 2012). In addition, colonoscopy is not suitable for the elderly or patients with contraindications. Therefore, a non-invasive tool is urgently needed for effective population-wide screening to optimize CRC prevention and diagnosis.
Up till today, various novel screening methods have been made available, including guaiac-based fecal occult blood tests (gFOBTs), fecal immunochemical tests (FIT), and newer non-invasive tests (e.g., blood or stool tests for DNA, RNA, and protein organisms’ markers), but their diagnostic performances and clinical value are yet unsatisfactory (Wong and Yu, 2019). As the precursor of CRC, colorectal adenomas (CRA) are particularly hard to detect using non-invasive methods (Imperiale et al., 2014). The research results of Niedermaier T et al. showed that the predictive sensitivity of FIT and DNA markers for advanced adenoma hardly exceeds 70% (Niedermaier et al., 2018).
Emerging evidence shows that CRC and CRA were accompanied by dysbiosis of the gut microbiome (Yu et al., 2017). For example, Bacteroides (e.g., Bacteroides fragilis) and a strain of Escherichia coli are closely related to colorectal carcinogenesis (Cuevas-Ramos et al., 2010; Arthur et al., 2012). Therefore, there has been emerging research focusing on the diagnostic value of gut microbiome for CRC and CRA(10).
However, several challenges still exist in establishing sound microbiome-based diagnostic models. Firstly, the composition of the intestinal flora varied among different regions and ethnic groups (Dwiyanto et al., 2021). To date, most studies are single-centered, and the integration of data from multiple populations is rare (Kim et al., 2020; Chen et al., 2022; Coker et al., 2022). Thus, common cross-cohort microbiome features remain unexplored. Secondly, due to the high dimensionality and redundancy of microbiome data generated by high-throughput sequencing methods, improving data processing pipelines for better utilization of microbiome information is crucial for model judgment, which requires multi-disciplinary proficiencies. Thirdly, it should be noted that CRA and CRC occurrence and development are affected by multiple factors. While multi-modality models integrating microbiota and serum metabolites have shown good performance (Chen et al., 2022; Gao et al., 2022), clinical and demographic data, which are accessible and have been proven as important risk factors (Song et al., 2020) have not yet been involved in integrated models for diagnosing CRA and CRC.
Machine learning (ML) algorithms are valuable candidates for fast and deep processing of high-throughput data, including metagenomic data (Cammarota et al., 2020). Additionally, these models could be trained to explore dynamic trends, such as common features across different regions and ethnics. In the field of IBD and liver disease, ML technology has been used to analyze large-scale data from different settings (e.g., demographic, laboratory and sequencing data), combine them and tap the potential for diagnostic prediction (Cammarota et al., 2020; Seyed Tabib et al., 2020; Liu et al., 2022).
Therefore, using multi-modal ML algorithms integrating demographic, clinical, and microbiome features, this study aims to screen for stable CRC and CRA-related metagenomic features in multiple cohorts, and establish robust prediction models for CRC and CRA (Figure 1).
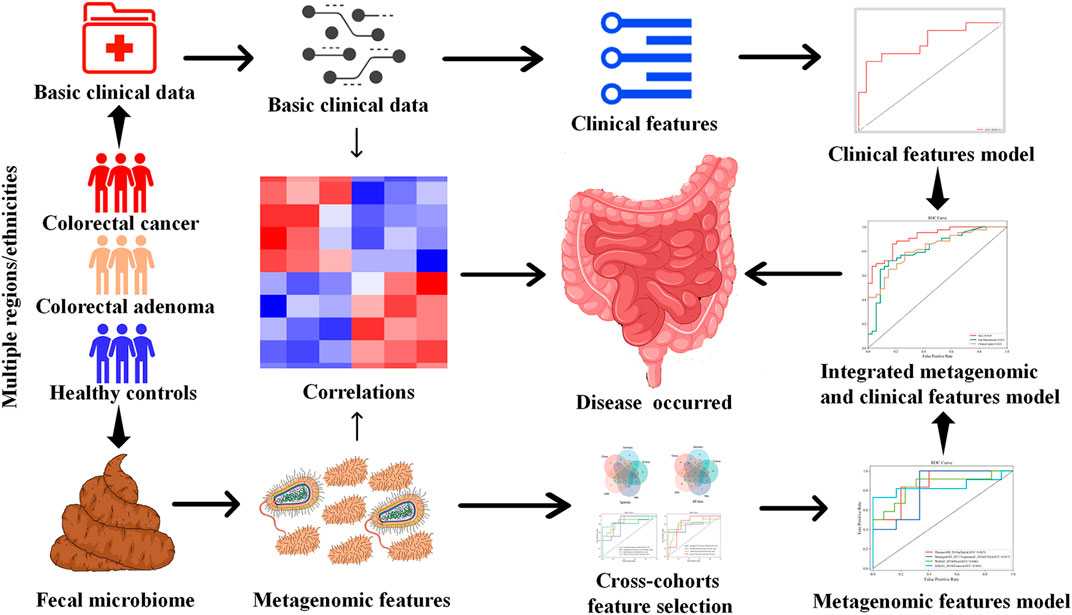
FIGURE 1. Study design.
2 Materials and methods
2.1 Study design and data preparation
Our purpose is to train a stable and reliable CRC or CRA disease diagnosis model that integrates microbial and clinical indicators, so we selected some datasets from a publicly available and standardized microbiome data sourcedatabase which name is MetagenomicData, and curated through BioConductor (Pasolli et al., 2017) that have both metagenomic and clinical data(see Table 1 for basic information on the data sets). Study subjects included stool samples from patients with colorectal cancer (CRC) or colorectal adenoma (CRA) and healthy controls (HC).
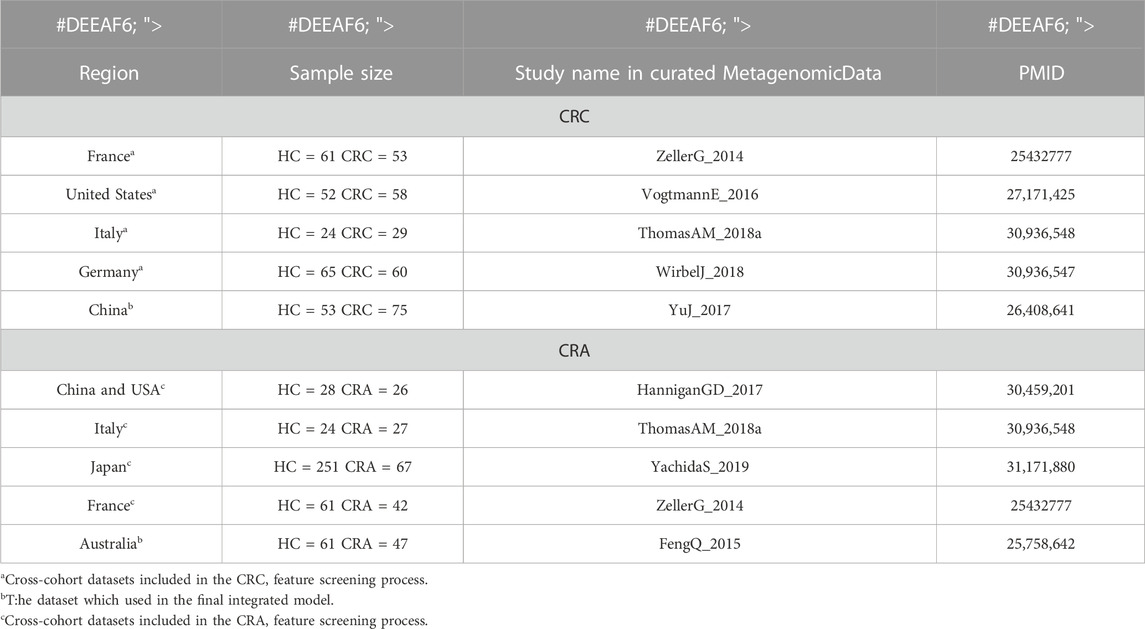
TABLE 1. Basic information of the CRC or CRA cross-cohort datasets.
We first analyzed and discussed the model methods and metagenomic data input methods in order to find the best way to maximize the value of multidimensional data. Secondly, we screened and verified multiple times in cross-cohorts data sets (Hereinafter referred to as the cross-cohorts data set, for CRC, it refers to: ZellerG_2014, VogtmannE_2016, ThomasAM_2018, WirbelJ_2018 data set; for CRA, it refers to HanniganGD_2017, ThomasAM_2018, YachidaS_2019, ZellerG_2014 data set) from different countries and races, and selected the 20 most stable and specific metagenomic features. Finally, the YuJ_2017 and FengQ_2015 datasets were used to build a diagnostic model integrating metagenomic and clinical features.
China’s YuJ_2017 (Yu et al., 2017) was selected as the final dataset for CRC, while Australia’s FengQ_2015 (Feng et al., 2015) was chosen as the final dataset for CRA. These datasets were chosen because their clinical data appear to be more relevant to the disease based on previous studies of traditional risk factors for the disease.
The YuJ_2017 dataset contains metagenomic data of 53 cases of CRC and 75 healthy subjects, and also records some of their clinical indicators: age, sexual, body mass index (BMI), triglycerides, high-density lipoprotein (HDL), low-density lipoprotein (LDL), cholesterol, creatinine, fasting glucose, Estimated glomerular filtration rate(eGFR) and alanine transaminase (ALT). Only age, triglycerides, HDL and fasting glucose were significantly different between the two groups (p = 0.012; p = 0.020; p < 0.001; p < 0.001). The FengQ_2015 data set contains metagenomic data of 47 CRA patients and 61 healthy participants, and also counts age, gender, BMI, triglycerides, HDL, LDL and co-morbid disease (type 2 diabetes mellitus, hypertension, fatty liver). However, none of the clinical indicators were significantly different between the two groups (p > 0.05). Please see Supplementary Table S1 for clinical data information of other data sets.
Microbiota features with less than 0.01% mean relative abundance and less than 10% prevalence were excluded. All clinical data included in this study are routine clinical tests and have been shown to correlate with disease in previous studies (Chapelle et al., 2020).
2.2 Selection the optimal model method
Popular ML methods, including Extreme Gradient Boosting (Xgboost), Lightweight Gradient Boosting Machine (LGB), Random Forest (RF), Logistic Regression (LR), Support Vector Machine (SVM), k-nearest neighbors (KNN) (Greener et al., 2022), were trialed for CRC/HC and CRA/HC classification. YuJ_2017 and FQ_2015 datasets were used as the CRC and CRA datasets to compare the machine learning model efficacie. Models were optimized by tuning hyperparameters and training. Hyperparameters are parameters that need to be specified or tuned by the user in order to train a model for a specific modeling problem(23) (Figure 2).
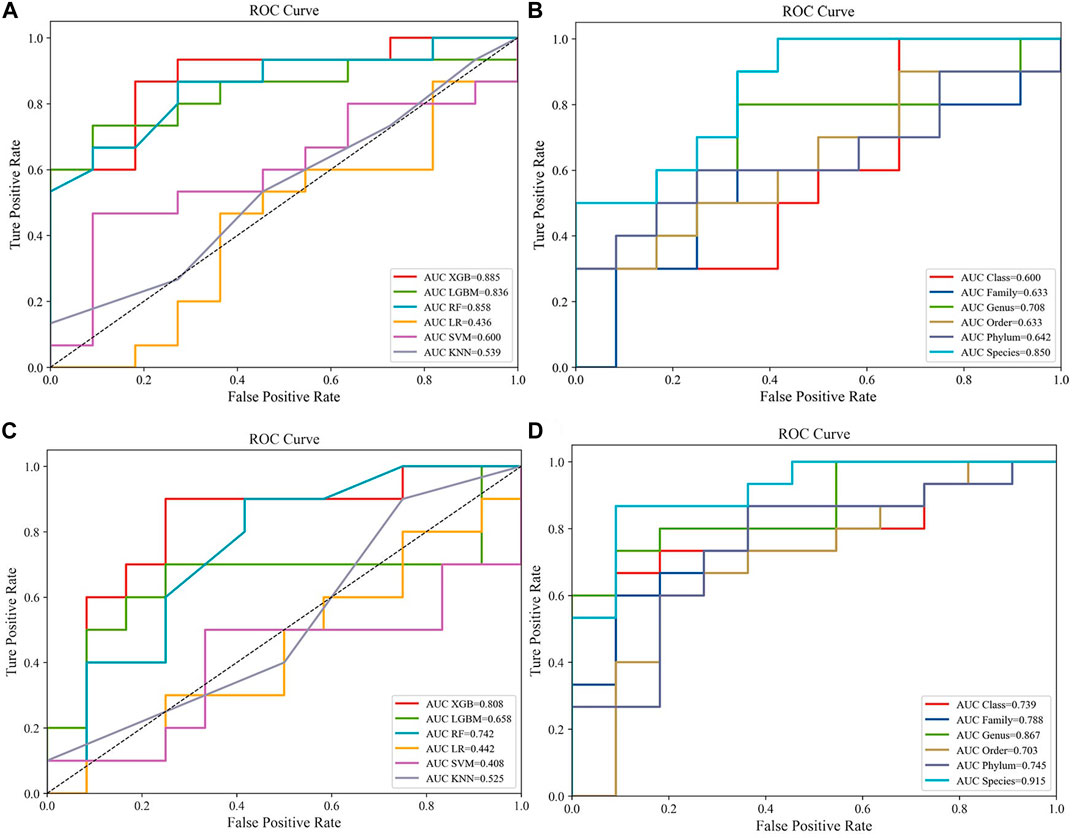
FIGURE 2. Compare the performance of different machine learning models:(A) Predictive performances of six machine learning methodologies [Extreme Gradient Boosting (Xgboost), Lightweight Gradient Boosting Machine (LGB), Random Forest (RF), Logistic Regression (LR), Support Vector Machine (SVM), k-nearest neighbors (KNN)] in the CRC dataset (YuJ_2017); (B) Predictive performances of single-level taxons (phylum, class, order, family, genus, species) in the CRC dataset (YuJ_2017); (C) Predictive performances of six machine learning methodologies [Extreme Gradient Boosting (Xgboost), Lightweight Gradient Boosting Machine (LGB), Random Forest (RF), Logistic Regression (LR), Support Vector Machine (SVM), k-nearest neighbors (KNN)] in the CRC dataset (YuJ_2017); (D) Predictive performances of single-level taxons (phylum, class, order, family, genus, species) in the CRA dataset (FQ_2015).
All models adopted the hold-out method, in which a dataset was divided into two mutually exclusive parts, one as the training set and the other as the test set (Siugzdaite et al., 2020). All models adopted the hold-out method, in which a dataset was divided into two mutually exclusive parts, one as the training set and the other as the test set (Siugzdaite et al., 2020). The ratio of samples in the training and test sets was 8:2. The ratios of cases and controls were also kept consistent in training and test sets to avoid biases introduced by the data partitioning process.
2.3 Selection of metagenomic features from cross-cohorts
Previous studies have shown that sensitivity and accuracy vary with the degree of clustering of metagenomic data when training for ML (Thomas et al., 2019). Therefore, we first input individual levels of taxonomic data (phylum, order, family, class, genus, species) into the model and selected the best-performing taxon level according to the area-under-the-curve (AUC) value of the model. After comparison, we found that it is easier to find the intersection of feature groups between different data sets by inputting all classification levels into the model for training (Figures 3, 4A,4B).
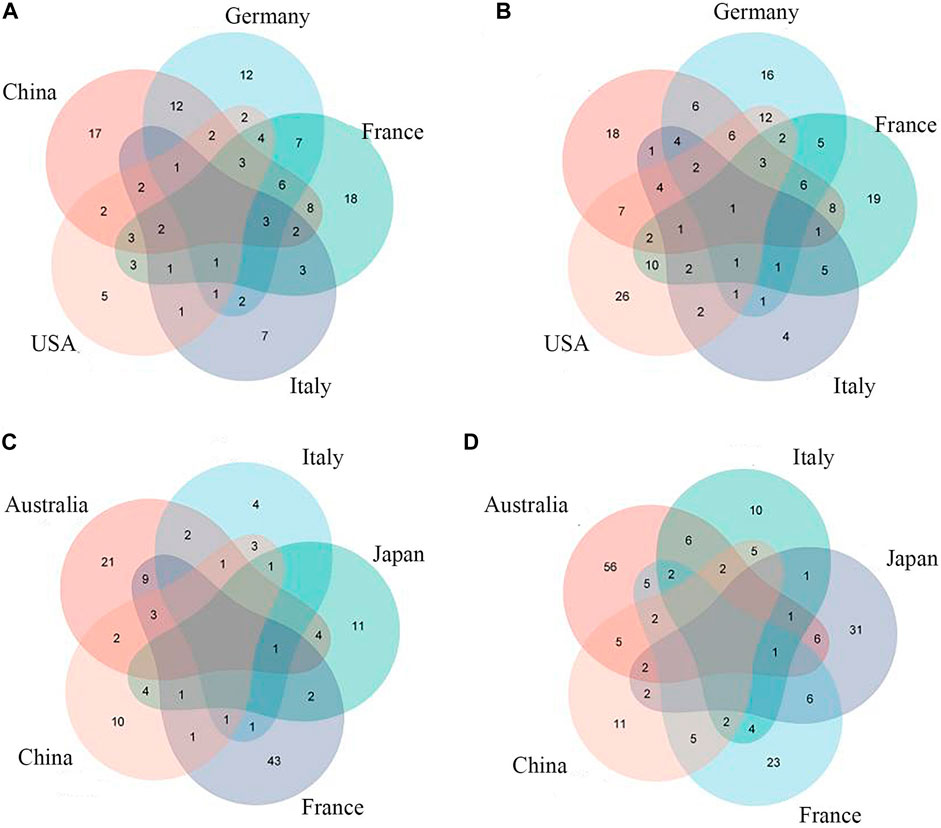
FIGURE 3. Common CRC/CRA microbial features across cohorts:(A) Species level (CRC); (B) Full taxonomic information (CRA); (C) Species level (CRA); (D) Full taxonomic information (CRA).
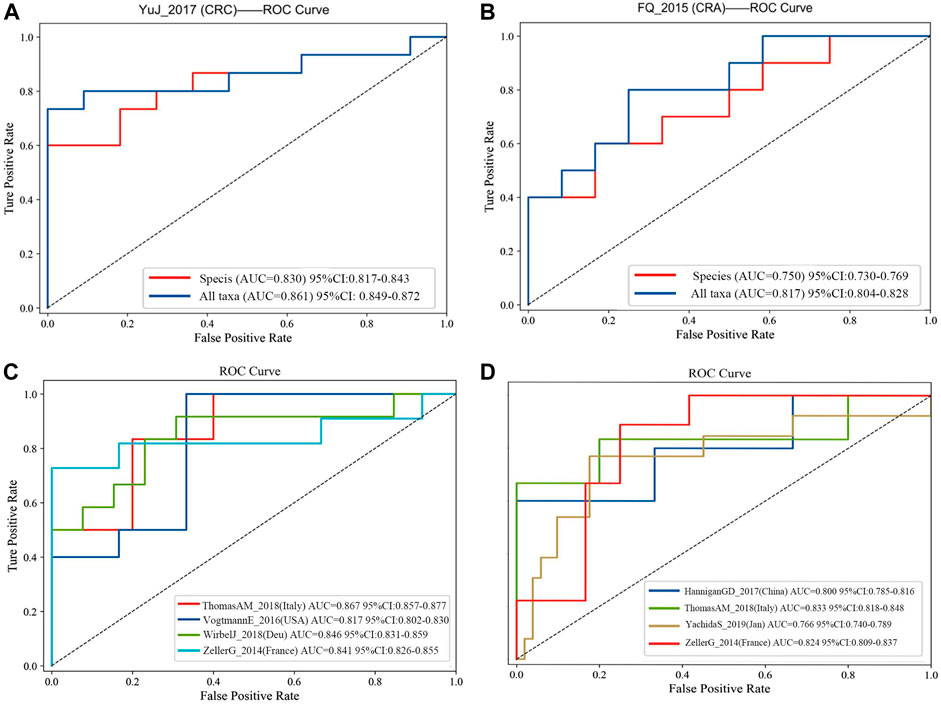
FIGURE 4. (A) Comparision of diagnostic efficacy in CRC dataset (YuJ_2017) using species-level information and full taxonomic information in the XGboost model; (B) Comparision of diagnostic efficacy in CRA dataset (FQ_2015) using species-level information and full taxonomic information in the XGboost model. Validation in multiple cohorts for diagnosis of CRC (C) and CRA (D) using all taxanomic information in XGboost model. AUC, area under curve. The dashed line represents AUC for 0.5. [CRC: ThomasAM_2018 (Italy) AUC 95% CI:0.857–0.977; VogtmannE_2016 (United States) AUC 95%CI: 0.802–0.830; WirbelJ_2018(Due) AUC 95% CI:0.831–0.859; ZellerG_2014 (France) AUC 95%CI: 0.826–0.855. CRA:HanniganGD_2017(China) AUC 95%CI:0.7850.816; ThomasAM_2018(Italy) AUC 95% CI:0.809–0.837].
To improve the diagnositic value of metagenomic features in multi-regional and multi-ethnic datasets, we performed cross-cohorts validation during feature screening, and the feature groups that performed best in cross-cohorts were retained. The process was divided into two steps.
Firstly, all datasets selected for metagenomic feature screening (CRC: ZellerG_2014, HC = 61, CRC = 53; VogtmannE_2016, HC = 52, CRC = 52; ThomasAM_2018, HC = 24, CRC = 29; WirbelJ_2018, HC = 65, CRC = 60; CRA: HanniganGD_2017, HC = 28, CRA = 26; ThomasAM_2018, HC = 24, CRA = 27; YachidaS_2019,HC = 251, CRA = 67; ZellerG_2014, HC = 61, CRA = 42) were trained with disease diagnosis models using the XGboost method, with a training set and validation set ratio of 8 to 2, and performed SHAP analysis post hoc. Secondly, based on the results of SHAP analysis, we take the intersection of the features that contribute to disease judgment in each dataset (Feature value > 0). And use the filtered intersection features to verify again in the cross-cohorts data set. After multiple intersections, selection, and verification, and combined with previous relevant research bases, we finally obtained 20 metagenomic features. Their performance is stable in four cross-cohort data sets, with an average AUC value greater than 0.8 (Figures 4C,D).
The 20 screened metagenomic features of CRC/CRA have good diagnostic results in the YuJ_2017 and FengQ_2015 data sets respectively, with AUC values of 0.855 (95%CI: 0.840–0.867) and 0.867 (95%CI: 0.857–0.878) respectively (Figure 5).
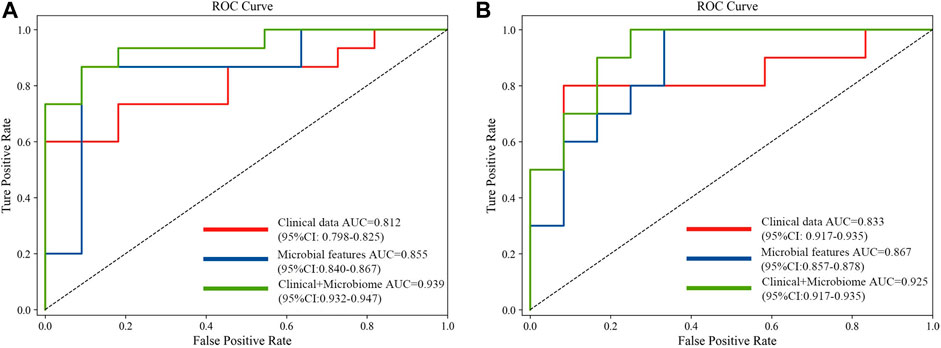
FIGURE 5. Comparison of approaches for the prediction of CRC (A) and CRA (B) using only clinical and demographical features, only microbial features, and the integrated method.
2.4 SHapley additive exPlanation (SHAP) analysis
SHAP analysis evaluates importance of a taxon using “Information gain (IG)”. That is, the ratio of each individual feature to the sum of features gets the score, and the average reduction of loss of the input features when used as a dividing attribute (the information gain of the features) (Kent, 1983; Wang et al., 2005; Gao et al., 2017; Lundberg and Lee, 2017).
IG g (Y, X) indicates the reduction of uncertainty as define below
where H(Y) denotes the entropy of dataset Y, which quantifies the uncertainty involved in predicting the value of a random variable, whereas H(Y|X) denotes the conditional entropy, which represents the uncertainty based on the known variable X. p denotes probability distribution. H(Y) and H(Y|X) are defined as follows:
In this study, we used the Python 3.8 program language, the compiler version was PyCharm Community Edition 2021.1.1 x64. Among the ML models used in this paper, the LR, KNN, SVM and RF models were built using the scikit-learn package, the model XGboost was built using the Xgboost package, and the LGB model was built using the lightgbm package.
2.5 Construction of the integrated model of clinical and metagenomic features
We input the metagenomic and clinical features with stable performance in cross-cohorts together into the Xgboost model, and used AUC values for performance evaluation. External validation of this methodology was performed across multiple cohorts.
Xgboost can accept predictions in the absence of indicators, which is more adaptable to complex situations in practical applications. However, this study still used multiple imputation to fill in clinical missing values, because it ensured that subsequent analysis such as shap would be added to facilitate observation and discussion. Models were optimized by tuning hyperparameters and training. Hyperparameters are parameters that need to be specified or tuned by the user in order to train a model for a specific modeling problem (Topçuoğlu et al., 2020). In order to evaluate the performance of the model and prevent overfitting, 10-fold cross validation was introduced when building the model. The ratio of training set to test set for all models in this study is 8:2.
2.6 Statistical analysis
Statistical analysis was performed using R Statistical Software (version 4.1.2). Count data were described by frequency and composition ratios, while continuous data were expressed as median ± IQR, Normality was gauged using Kolmogorov-Smirnov tests. Differences between groups were compared by Chi-square and Mann-Whitney U tests. Correlations between groups were assessed using Spearman correlation analysis. A p-value≤ 0.05 for two-sided test or a p-value ≤0.025 for one-sided test is considered statistically significant.
3 Results
3.1 Clinical characteristics of participants
The previous section has provided a comprehensive description of the basic clinical information of each study participant. For further details, please refer to Supplementary Table S1.
3.2 Selection the optimal model method
XGBoost outperformed other machine learning model, and was used for model construction in this study (CRC, AUC: 0·875–0·895; CRA, AUC: 0·790–0·821) (Figures 2A,C).
3.3 Selection of metagenomic features from cross-cohorts
Species-level data performed best in single-level taxonomic (CRC, AUC: 0·906–0·922; CRA, AUC: 0·839–0·862) (Figures 2B,D), while all-level taxonomic data performed even better (CRC, AUC: 0·849–0·872; CRA, AUC: 0·804–0·828) (Figures 4A,B). And as shown in Figure 3, when only species-level metagenomic data was input, the intersection of feature values between all data sets in each region is small; if all classification-level data were input into the model together, the intersection between feature values of each data set is obviously increased (p < 0.01) (Figure 3).
The final 20 metagenomic features were selected to be stable and efficient in the cross-chorts cohort: CRC, AUC: 0·817–0·867; CRA, AUC: 0·760–0·833]. CRC: ThomasAM_2018 (Italy) AUC = 0.867, 95% CI:0.857–0.977; VogtmannE_2016 (USA) AUC = 0.817, 95%CI: 0.802–0.830; WirbelJ_2018(Due) AUC = 0.846,95% CI:0.831–0.859; ZellerG_2014 (France) AUC = 0.841 95%CI: 0.826–0.855. CRA: HanniganGD_2017(China) AUC = 0.800, 95%CI:0.785–0.816; ThomasAM_2018(Italy) AUC = 0.833, 95% CI:0.809–0.837; YachidaS_2019 (Japanese) AUC = 0.766, 95%CI:0.740–0789; ZellerG_2014 (France) AUC = 0.824 95%CI: 0.809–0.837 (Figures 4C,D).
The 20 screened metagenomic features of CRC/CRA also have good diagnostic results in the YuJ_2017 and FengQ_2015 data sets respectively, with AUC values of 0.855 (95%CI: 0.840–0.867) and 0.867 (95%CI: 0.857–0.878) respectively (Figure 5).
3.4 Multi-modal diagnostic model integrating metagenomic and clinical features
The performance of the model integrating the metagenomic and clinical features was significantly better than models including only clinical or metagenomic data for both CRC (metagenomic data, AUC: 0.855, 95%CI: 0.840–0.867; clinical data, AUC: 0.812, 95%CI: 0.798–0.825; combined, AUC: 0.939, 95%CI: 0.932–0.947) and CRA (metagenomic data, AUC: 0.867, 95%CI: 0.857–0.878; clinical data, AUC: 0·833, 95%CI: 0.917–0.935; combined, AUC: 0.925, 95%CI: 0.917–0.935) (Figure 5). An net reclassification improvement (NRI) value greater than 0 means that the added feature values contribute to model judgment. For CRC (YuJ_2017), the NRI value of the model integrating clinical indicators was 30% compared with the model built using only metagenomic features. For CRA (FengQ_2015), the NRI value of the model integrating clinical indicators was 18% compared with the model built using only metagenomic features (He et al., 2022). Table 2 presents detailed model results.
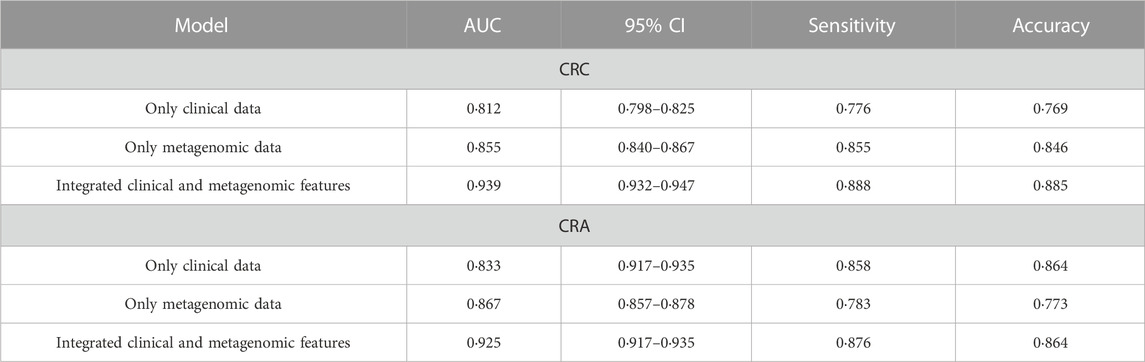
TABLE 2. Comparison of the performance of CRC/CRA single data model and integrated model.
Improvement of model performance by adding clinical features was also demonstrated in validation datasets (Supplementary Figure S1). More details are shown in Table 3.
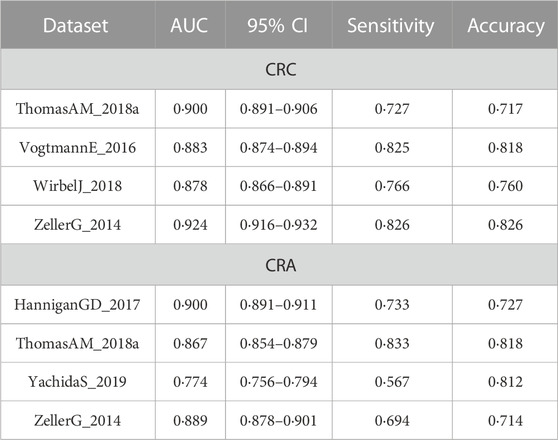
TABLE 3. Comparison of the cross-cohort performances of models constructed based on clinical data and the integrated models.
3.5 Factors underlying the prediction of CRC/CRA
Among the CRC and CRA top20 metagenomic feature groups. There is only one common metagenomic feature was identified, which is Prevotellaceae (Figure 6). We further performed separate differential analysis of functional pathways for CRC and CRA microbiome data, and the analysis showed that the differential pathways of CRC and CRA did not have any intersections (Figure 7).

FIGURE 6. Differential functional pathways in CRC vs. HC (A) and CRA vs. HC (B).
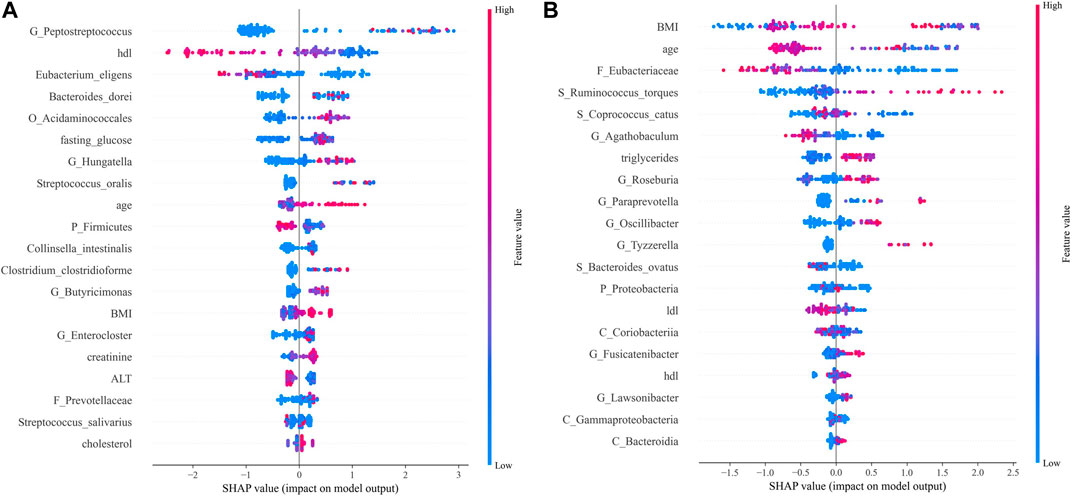
FIGURE 7. SHAP analysis results. Top 20 features of importance for prediction of CRC according to SHAP values in the integrated model (A). Top 20 features of importance for prediction of CRA according to SHAP values in the integrated model (B). Each dot in SHAP plot represents a patient, with x-axis location representing the SHAP value of the predicator. Dot color indicates the measured value of the predicator, assigned color red meant positive contribution and blue meant negative contribution. Features are ranked along the y-axis according to their contribution to model prediction.
For CRC patients, the 5 most important features were Peptostreptococcus, HDL, Eubacterium eligens, Bacteroides dorei, and Acidaminococcales; among which HDL and E. eligens negatively contributed to CRC risk (Figure 8A).
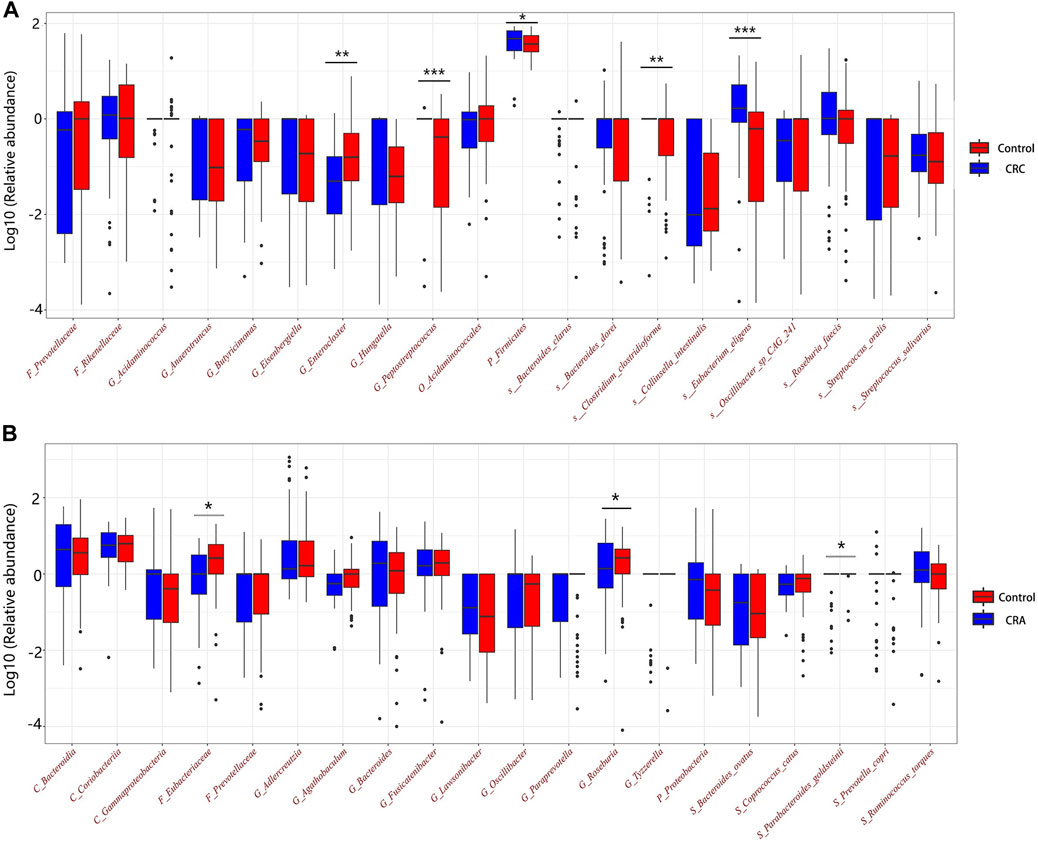
FIGURE 8. Relative abundances of the top 20 discriminative microbiota in CRC (A) and CRA (B).
However, for CRA patients, the 5 most important features were BMI, age, low-density lipoprotein (LDL), Eubacteriaceae, Ruminococcus torques, and Coprococcus catus. Age, LDL, Eubacteriacease, C. catus, Agathobaculum and Corobacteria negatively contributed to CRA risk (Figure 8B). Correlations between gut microbiota and clinical features shown in Figure 9.
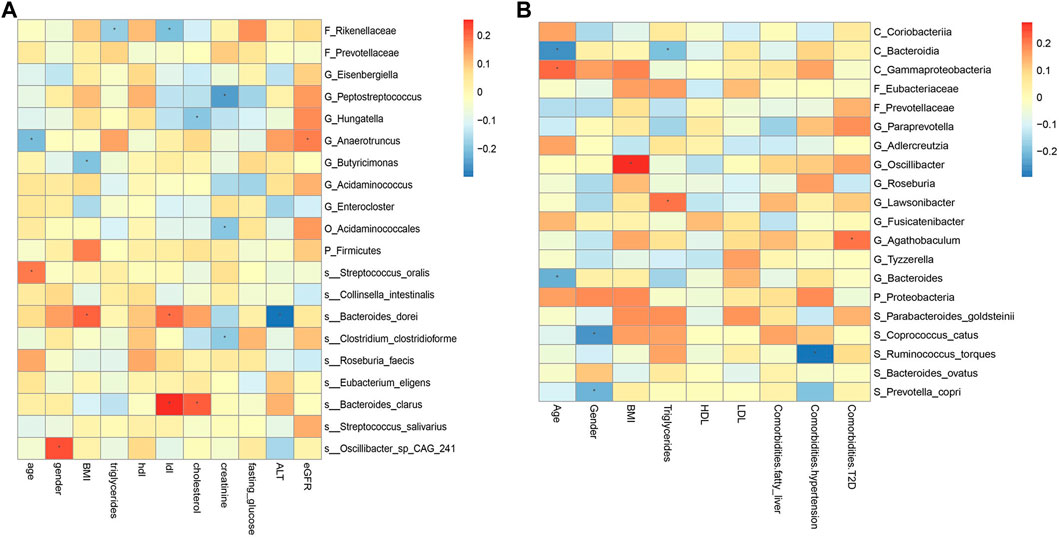
FIGURE 9. Spearman correlations between the abundances of top 20 discriminative gut microbiotaand clinical features in CRC (A) and CRA (B). BMI, Body Mass Index; HDL, High-density lipoprotein; LDL, Low-density lipoprotein; ALT, Alanine aminotransferase; eGFR, estimated glomerular filtration rate. *, statistically significant after Bonferonni correction.
4 Discussion
In this study, we used gut metagenomic and clinical features to develop diagnostic models for CRC and CRA. Our model exhibited a better performance than clinically-used tests (e.g., gFOBTs, multi-target stool DNA, FIT, Methylated septin 9 gene, etc.) (Ladabaum et al., 2020). More importantly, we included data from 6 regions, including China, Germany, Italy, USA, Japan, and France, to address existing limitations regarding varied human gut microbiota compositions across populations with different environmental and genetic backgrounds. Through data mining optimization, feature selection, multi-omics analysis and other processes, stable CRC/CRA risk prediction models with generalizability were established, which could provide valuable insights for early CRC screening.
Several breakthroughs were made in this study. Firstly, previous disease diagnosis models based on gut microbiome nearly always performed poorly in external validations (Wong and Yu, 2019; Cammarota et al., 2020). However, we innovatively found that inputting full taxon data and adding cross-cohort tests simultaneously with features screening can help keep the balance between model performance and stability. Furthermore, the ML approach, instead of the traditional statistical models, is capable of taking the microbial community as a whole and determine the association between the structure of the community and the disease state (Handelman et al., 2018; Topçuoğlu et al., 2020; Stahlschmidt et al., 2022), yielding robust results. Secondly, we demonstrated that integrating clinical features in gut microbiome-based model significanlt improved model efficacy, especially for CRA. This holds clinical significance because accessing clinical indicators is convenient and inexpensive, and common features among regions could further enhance the stability and generalizability of model predictions. Furthermore, metagenomic features reflect the microenvironment of a localized lesion (Wong and Yu, 2019), while demographic and clinical features could reflect the overall disease states. A combination of these two aspects could provide a wholistic view of disease status, which could explain the reason that our integrated model outperformed existing models based only on microbiome in terms of stability and generalizability (Thomas et al., 2019; Wong and Yu, 2019).
Up to date, the current research on microbial integration models is still in its infancy, and most of the research focuses on integrating complex and expensive big data (e.g., exfoliated cells DNA sequencing data, microbe-associated metabolites, etc.), rather than obtaining convenient and affordable routine demographic and clinical data (Coker et al., 2022; Gao et al., 2022). However, this study showed that using clinical data for integration could exhibit comparable accuracy and sensitivity compared with other data. Compared with the model integrating metagenomic and metabolomics data by Coker and colleagues (Coker et al., 2022), our models’ efficacy was comparable to theirs regarding CRC diagnosis (Coker, AUC 95%CI: 91·5% −96·8%; This study, AUC 95%CI: 93·2%-94·7%), while outperforming the existing model regarding CRA diagnosis (Coker, AUC 95%CI: 83·6%-91·6%; This study, AUC 95%CI: 91·7%-93·5%).
Additionally, our results show that FOBT and clinical indicators related to lipid metabolism (HDL, LDL, etc.) were more critical for the diagnosis of CRC, while BMI and age contributed more to the CRA model.
Prevotellaceae, generally considered as probiotic for humans, was identified as the only overlapping microbial signature for CRC and CRA, and no overlapping functional pathway was found between the 2 disease states Figure 6. This suggests that CRC and CRA are two completely different disease states with different gut microbial environment, which is consistent with Casimiro-Soriguer’s view (Casimiro-Soriguer et al., 2022). However, there were certain feature similarities. For example, 10 taxonomic features found adversely contribute to CRC risk and 9 to CRA belonged to order Clostridiales, while 5 taxonomic features contributing to CRC risk and 6 to CRA belonged to order Bacteroidales. These findings are in line with a previous study (Baxter et al., 2014) that Bacteroidales is currently considered to be tumorigenic, while Clostridiales has been shown to be associated with colonic health. Hence, we suggest that in future clinical practices, monitoring changes in the levels of these two taxa could be beneficial for disease detection.
Moreover, nearly four-fifths of the top 20 features in the SHAP summary plot were from the metagenomic data, which could mean that the gut microbiome is crucial for the prediction of localized tumors or lesions such as CRC/CRA. The overabundance of Peptostreptococcus in CRC fecal samples has been found in multiple studies, and Peptostreptococcus anaerobius could enhance pro-inflammatory responses, cholesterol synthesis and cell proliferation (Karpiński et al., 2022). Bacteroids dorei was previously identidied as a CRC-infiltrating bacteria from a novel whole genome sequencing method of CRC tissue (Guo et al., 2019). Here, we can also infer that the dynamic between anti- and pro-inflammatory factors is crucial in CRC tumorigenesis, especially low-grade inflammation associated with metabolic disorders, as HDL (Rohatgi et al., 2021) and the anti-inflammatory species E. eligens negatively predicted CRC risk (Montilla and Villamiel, 2022), while increased abundance of Acidaminococcales was found in T2DM patients (Wang et al., 2020). BMI and age were the top 2 discriminating features identified in the diagnostic model for CRA, while Eubacteriaceae, generally considered to have anti-inflammatory properties (González-Mercado et al., 2020), protected against CRA. In conclusion, both microbiome and clinical features could help diagnose CRC and CRA.
The correlation between some metagenomic features and clinical indicators is also worthy of attention, which may suggest the mechanism behind the disease. For example, the correlation analysis results of YuJ_2017 data show (Figure 9A), LDL has a significant positive correlation with both S_Bacteroides clarus and S_Bacteroides dorei (p < 0.05). This may be related to the presence of cholesterol-reactive sulfotransferase in Bacteroides bacteria (Le et al., 2022). G_Butyricimonas is considered to be a beneficial bacteria that can improve human metabolism (Lee et al., 2022) and is inversely related to BMI. However, some bacterial species whose functions are not yet known to humans are also correlated with clinical indicators. For example, gender is significantly correlated with S_Oscillibacter_sp_CAG_241 (p < 0.05). The results of this study also provide a direction for exploring bacterial species with unknown functions.
However, the main limitation of this study is that all data are from the publicly available databases, and the specificity of clinical data to CRC and CRA are dubious. Future modeling studies should adopt a prospective study design to include specific demographic and clinical risk factors to optimize prediction power. And due to the limitations of the current data, we lack time-series data to support our conclusions. In the future, we will work tirelessly to improve these issues.
In conclusion, we successfully constructed a cross-cohort and stable CRC and CRA diagnostic model integrating metagenomic and clinical features for early non-invasive screening of CRC and CRA. Compared with other CRC and CRA screening methods available, this model is more stable and generalizable. We also emphasize the importance of often overlooked demographic and clinical parameters in disease diagnosis and prediction models.
Data availability statement
The original contributions presented in the study are included in the article/Supplementary Material, further inquiries can be directed to the corresponding authors.
Ethics statement
The studies involving humans were approved by Office of Human Subjects Research at the National Institutes of Health; Ethics Committee of Azienda Ospedaliera ‘SS. Antonio e Biagio e C, Italy; Ethics Committee of European Institute of Oncology of Milan, Italy and so on(Our study included data from nine previously published articles). The studies were conducted in accordance with the local legislation and institutional requirements. Written informed consent for participation was not required from the participants or the participants’ legal guardians/next of kin in accordance with the national legislation and institutional requirements.
Author contributions
DZ: Conceptualization, Data curation, Methodology, Writing–original draft. YC: Data curation, Formal Analysis, Validation, Writing–review and editing. ZW: Conceptualization, Data curation, Methodology, Software, Supervision, Validation, Visualization, Writing–review and editing. SZ: Resources, Writing–review and editing. LZ: Conceptualization, Formal Analysis, Investigation, Project administration, Software, Writing–original draft. JS: Funding acquisition, Resources, Supervision, Visualization, Writing–review and editing. TB: Funding acquisition, Methodology, Project administration, Resources, Supervision, Writing–review and editing. XH: Funding acquisition, Investigation, Resources, Visualization, Writing–review and editing.
Funding
The author(s) declare financial support was received for the research, authorship, and/or publication of this article. This work was supported by grants from the National Natural Science Foundation of China (81974062 and 81900477), International (Regional) Cooperation and Exchange Projects (81720108006) and Hubei Provincial Science and Technology Key Research and Development Project (General Project) (2020BHB017).
Conflict of interest
The authors declare that the research was conducted in the absence of any commercial or financial relationships that could be construed as a potential conflict of interest.
Publisher’s note
All claims expressed in this article are solely those of the authors and do not necessarily represent those of their affiliated organizations, or those of the publisher, the editors and the reviewers. Any product that may be evaluated in this article, or claim that may be made by its manufacturer, is not guaranteed or endorsed by the publisher.
Supplementary material
The Supplementary Material for this article can be found online at: https://www.frontiersin.org/articles/10.3389/fmolb.2023.1298679/full#supplementary-material
References
Arthur, J. C., Perez-Chanona, E., Mühlbauer, M., Tomkovich, S., Uronis, J. M., Fan, T.-J., et al. (2012). Intestinal inflammation targets cancer-inducing activity of the microbiota. Science 338 (6103), 120–123. doi:10.1126/science.1224820
Baxter, N. T., Zackular, J. P., Chen, G. Y., and Schloss, P. D. (2014). Structure of the gut microbiome following colonization with human feces determines colonic tumor burden. Microbiome 2, 20. doi:10.1186/2049-2618-2-20
Cammarota, G., Ianiro, G., Ahern, A., Carbone, C., Temko, A., Claesson, M. J., et al. (2020). Gut microbiome, big data and machine learning to promote precision medicine for cancer. Nat. Rev. Gastroenterol. Hepatol. 17 (10), 635–648. doi:10.1038/s41575-020-0327-3
Casimiro-Soriguer, C. S., Loucera, C., Peña-Chilet, M., and Dopazo, J. (2022). Towards a metagenomics machine learning interpretable model for understanding the transition from adenoma to colorectal cancer. Sci. Rep. 12 (1), 450. doi:10.1038/s41598-021-04182-y
Chapelle, N., Martel, M., Toes-Zoutendijk, E., Barkun, A. N., and Bardou, M. (2020). Recent advances in clinical practice: colorectal cancer chemoprevention in the average-risk population. Gut 69 (12), 2244–2255. doi:10.1136/gutjnl-2020-320990
Chen, F., Dai, X., Zhou, C.-C., Li, K.-X., Zhang, Y.-J., Lou, X.-Y., et al. (2022). Integrated analysis of the faecal metagenome and serum metabolome reveals the role of gut microbiome-associated metabolites in the detection of colorectal cancer and adenoma. Gut 71 (7), 1315–1325. doi:10.1136/gutjnl-2020-323476
Coker, O. O., Liu, C., Wu, W. K. K., Wong, S. H., Jia, W., Sung, J. J. Y., et al. (2022). Altered gut metabolites and microbiota interactions are implicated in colorectal carcinogenesis and can be non-invasive diagnostic biomarkers. Microbiome 10 (1), 35. doi:10.1186/s40168-021-01208-5
Cuevas-Ramos, G., Petit, C. R., Marcq, I., Boury, M., Oswald, E., and Nougayrède, J.-P. (2010). Escherichia coli induces DNA damage in vivo and triggers genomic instability in mammalian cells. Proc. Natl. Acad. Sci. U. S. A. 107 (25), 11537–11542. doi:10.1073/pnas.1001261107
Dekker, E., and Rex, D. K. (2018). Advances in CRC prevention: screening and surveillance. Gastroenterology 154 (7), 1970–1984. doi:10.1053/j.gastro.2018.01.069
Dwiyanto, J., Ayub, Q., Lee, S. M., Foo, S. C., Chong, C. W., and Rahman, S. (2021). Geographical separation and ethnic origin influence the human gut microbial composition: a meta-analysis from a Malaysian perspective. Microb. Genom 7 (8), 000619. doi:10.1099/mgen.0.000619
Feng, Q., Liang, S., Jia, H., Stadlmayr, A., Tang, L., Lan, Z., et al. (2015). Gut microbiome development along the colorectal adenoma-carcinoma sequence. Nat. Commun. 6, 6528. doi:10.1038/ncomms7528
Gao, L., Ye, M., Lu, X., and Huang, D. (2017). Hybrid method based on information gain and support vector machine for gene selection in cancer classification. Genomics Proteomics Bioinforma. 15 (6), 389–395. doi:10.1016/j.gpb.2017.08.002
Gao, R., Wu, C., Zhu, Y., Kong, C., Zhu, Y., Gao, Y., et al. (2022). Integrated analysis of colorectal cancer reveals cross-cohort gut microbial signatures and associated serum metabolites. Gastroenterology 163 (4), 1024–1037.e9. doi:10.1053/j.gastro.2022.06.069
González-Mercado, V. J., Lim, J., Berk, L., Esele, M., Rodríguez, C. S., and Colón-Otero, G. (2020). Gut microbiota differences in Island Hispanic Puerto Ricans and mainland non-Hispanic whites during chemoradiation for rectal cancer: a pilot study. Curr. Probl. Cancer 44 (4), 100551. doi:10.1016/j.currproblcancer.2020.100551
Greener, J. G., Kandathil, S. M., Moffat, L., and Jones, D. T. (2022). A guide to machine learning for biologists. Nat. Rev. Mol. Cell Biol. 23 (1), 40–55. doi:10.1038/s41580-021-00407-0
Guo, M., Xu, E., and Ai, D. (2019). Inferring bacterial infiltration in primary colorectal tumors from host whole genome sequencing data. Front. Genet. 10, 213. doi:10.3389/fgene.2019.00213
Handelman, G. S., Kok, H. K., Chandra, R. V., Razavi, A. H., Lee, M. J., and Asadi, H. (2018). eDoctor: machine learning and the future of medicine. J. Intern Med. 284 (6), 603–619. doi:10.1111/joim.12822
He, K., Si, L., Pan, X., Sun, L., Wang, Y., Lu, J., et al. (2022). Preoperative systemic immune-inflammation index (SII) as a superior predictor of long-term survival outcome in patients with stage I-ii gastric cancer after radical surgery. Front. Oncol. 12, 829689. doi:10.3389/fonc.2022.829689
Imperiale, T. F., Ransohoff, D. F., Itzkowitz, S. H., Levin, T. R., Lavin, P., Lidgard, G. P., et al. (2014). Multitarget stool DNA testing for colorectal-cancer screening. N. Engl. J. Med. 370 (14), 1287–1297. doi:10.1056/NEJMoa1311194
Karpiński, T. M., Ożarowski, M., and Stasiewicz, M. (2022). Carcinogenic microbiota and its role in colorectal cancer development. Semin. Cancer Biol. 86 (3), 420–430. doi:10.1016/j.semcancer.2022.01.004
Kent, J. T. (1983). Information gain and a general measure of correlation. Biometrika 70, 163–173. Biometrika. doi:10.1093/biomet/70.1.163
Kim, M., Vogtmann, E., Ahlquist, D. A., Devens, M. E., Kisiel, J. B., Taylor, W. R., et al. (2020). Fecal metabolomic signatures in colorectal adenoma patients are associated with gut microbiota and early events of colorectal cancer pathogenesis. mBio 11 (1), e03186-19. doi:10.1128/mBio.03186-19
Ladabaum, U., Dominitz, J. A., Kahi, C., and Schoen, R. E. (2020). Strategies for colorectal cancer screening. Gastroenterology 158 (2), 418–432. doi:10.1053/j.gastro.2019.06.043
Le, H. H., Lee, M.-T., Besler, K. R., Comrie, J. M. C., and Johnson, E. L. (2022). Characterization of interactions of dietary cholesterol with the murine and human gut microbiome. Nat. Microbiol. 7 (9), 1390–1403. doi:10.1038/s41564-022-01195-9
Lee, H., An, J., Kim, J., Choi, D., Song, Y., Lee, C.-K., et al. (2022). A novel bacterium, butyricimonas virosa, preventing HFD-induced diabetes and metabolic disorders in mice via GLP-1 receptor. Front. Microbiol. 13, 858192. doi:10.3389/fmicb.2022.858192
Lee, T. J. W., Rutter, M. D., Blanks, R. G., Moss, S. M., Goddard, A. F., Chilton, A., et al. (2012). Colonoscopy quality measures: experience from the NHS bowel cancer screening programme. Gut 61 (7), 1050–1057. doi:10.1136/gutjnl-2011-300651
Liu, Y., Méric, G., Havulinna, A. S., Teo, S. M., Åberg, F., Ruuskanen, M., et al. (2022). Early prediction of incident liver disease using conventional risk factors and gut-microbiome-augmented gradient boosting. Cell Metab. 34 (5), 719–730.e4. doi:10.1016/j.cmet.2022.03.002
Montilla, A. M.-A. N., and Villamiel, M. (2022). Chapter 6 - a new approach of functional pectin and pectic oligosaccharides: role as antioxidant and antiinflammatory compounds, Current advances for development of functional foods modulating inflammation and oxidative stress. Academic Press. Hernández-Ledesma B M-VC, 105–120.
Niedermaier, T., Weigl, K., Hoffmeister, M., and Brenner, H. (2018). Fecal immunochemical tests in combination with blood tests for colorectal cancer and advanced adenoma detection-systematic review. United Eur. Gastroenterol. J. 6 (1), 13–21. doi:10.1177/2050640617737004
Pasolli, E., Schiffer, L., Manghi, P., Renson, A., Obenchain, V., Truong, D. T., et al. (2017). Accessible, curated metagenomic data through ExperimentHub. Nat. Methods 14 (11), 1023–1024. doi:10.1038/nmeth.4468
Rohatgi, A., Westerterp, M., von Eckardstein, A., Remaley, A., and Rye, K.-A. (2021). HDL in the 21st century: a multifunctional roadmap for future HDL research. Circulation 143 (23), 2293–2309. doi:10.1161/CIRCULATIONAHA.120.044221
Seyed Tabib, N. S., Madgwick, M., Sudhakar, P., Verstockt, B., Korcsmaros, T., and Vermeire, S. (2020). Big data in IBD: big progress for clinical practice. Gut 69 (8), 1520–1532. doi:10.1136/gutjnl-2019-320065
Siugzdaite, R., Bathelt, J., Holmes, J., and Astle, D. E. (2020). Transdiagnostic brain mapping in developmental disorders. Curr. Biol. 30 (7), 1245–1257. doi:10.1016/j.cub.2020.01.078
Song, M., Chan, A. T., and Sun, J. (2020). Influence of the gut microbiome, diet, and environment on risk of colorectal cancer. Gastroenterology 158 (2), 322–340. doi:10.1053/j.gastro.2019.06.048
Stahlschmidt, S. R., Ulfenborg, B., and Synnergren, J. (2022). Multimodal deep learning for biomedical data fusion: a review. Brief. Bioinform 23 (2), bbab569. doi:10.1093/bib/bbab569
Sung, H., Ferlay, J., Siegel, R. L., Laversanne, M., Soerjomataram, I., Jemal, A., et al. (2021). Global cancer statistics 2020: GLOBOCAN estimates of incidence and mortality worldwide for 36 cancers in 185 countries. CA Cancer J. Clin. 71 (3), 209–249. doi:10.3322/caac.21660
Thomas, A. M., Manghi, P., Asnicar, F., Pasolli, E., Armanini, F., Zolfo, M., et al. (2019). Metagenomic analysis of colorectal cancer datasets identifies cross-cohort microbial diagnostic signatures and a link with choline degradation. Nat. Med. 25 (4), 667–678. doi:10.1038/s41591-019-0405-7
Topçuoğlu, B. D., Lesniak, N. A., Ruffin, M. T., Wiens, J., and Schloss, P. D. (2020). A framework for effective application of machine learning to microbiome-based classification problems. mBio 11 (3), e00434-20. doi:10.1128/mBio.00434-20
Wang, T.-Y., Zhang, X.-Q., Chen, A.-L., Zhang, J., Lv, B.-H., Ma, M.-H., et al. (2020). A comparative study of microbial community and functions of type 2 diabetes mellitus patients with obesity and healthy people. Appl. Microbiol. Biotechnol. 104 (16), 7143–7153. doi:10.1007/s00253-020-10689-7
Wang, Y., Makedon, F. S., Ford, J. C., and Pearlman, J. (2005). HykGene: a hybrid approach for selecting marker genes for phenotype classification using microarray gene expression data. Bioinformatics 21 (8), 1530–1537. doi:10.1093/bioinformatics/bti192
Wong, S. H., and Yu, J. (2019). Gut microbiota in colorectal cancer: mechanisms of action and clinical applications. Nat. Rev. Gastroenterol. Hepatol. 16 (11), 690–704. doi:10.1038/s41575-019-0209-8
Keywords: colorectal cancer, colorectal adenoma, machine learning, gut microbiome, metagenomics
Citation: Zhou D, Chen Y, Wang Z, Zhu S, Zhang L, Song J, Bai T and Hou X (2024) Integrating clinical and cross-cohort metagenomic features: a stable and non-invasive colorectal cancer and adenoma diagnostic model. Front. Mol. Biosci. 10:1298679. doi: 10.3389/fmolb.2023.1298679
Received: 22 September 2023; Accepted: 24 November 2023;
Published: 22 January 2024.
Edited by:
Jingxin Mao, Southwest University, ChinaReviewed by:
Run Sun, Guizhou Provincial People’s Hospital, ChinaLihui Zhang, The First Affiliated Hospital of Sun Yat-sen University, China
Copyright © 2024 Zhou, Chen, Wang, Zhu, Zhang, Song, Bai and Hou. This is an open-access article distributed under the terms of the Creative Commons Attribution License (CC BY). The use, distribution or reproduction in other forums is permitted, provided the original author(s) and the copyright owner(s) are credited and that the original publication in this journal is cited, in accordance with accepted academic practice. No use, distribution or reproduction is permitted which does not comply with these terms.
*Correspondence: Xiaohua Hou, aG91eGhAaHVzdC5lZHUuY24=; Tao Bai, ZHJiYWl0YW9AMTI2LmNvbQ==
†These authors share first authorship