 Lucia Cilenti1
 Jacopo Di Gregorio1†
 Rohit Mahar2
 Fei Liu1
 Camilla T. Ambivero1
 Muthu Periasamy1
 Matthew E. Merritt3
 Antonis S. Zervos1*
- 1Burnett School of Biomedical Sciences, University of Central Florida College of Medicine, Orlando, FL, United States
- 2Department of Chemistry, Hemvati Nandan Bahuguna Garhwal University (A Central University), Srinagar Garhwal, Uttarakhand, India
- 3Department of Biochemistry and Molecular Biology, University of Florida, Gainesville, FL, United States
Obesity is a growing epidemic affecting millions of people worldwide and a major risk factor for a multitude of chronic diseases and premature mortality. Accumulating evidence suggests that mitochondria have a profound role in diet-induced obesity and the associated metabolic changes, but the molecular mechanisms linking mitochondria to obesity remain poorly understood. Our studies have identified a new function for mitochondrial MUL1 E3 ubiquitin ligase, a protein known to regulate mitochondrial dynamics and mitophagy, in the control of energy metabolism and lipogenesis. Genetic deletion of Mul1 in mice impedes mitophagy and presents a metabolic phenotype that is resistant to high-fat diet (HFD)-induced obesity and metabolic syndrome. Several metabolic and lipidomic pathways are perturbed in the liver and white adipose tissue (WAT) of Mul1(−/−) animals on HFD, including the one driven by Stearoyl-CoA Desaturase 1 (SCD1), a pivotal regulator of lipid metabolism and obesity. In addition, key enzymes crucial for lipogenesis and fatty acid oxidation such as ACC1, FASN, AMPK, and CPT1 are also modulated in the absence of MUL1. The concerted action of these enzymes, in the absence of MUL1, results in diminished fat storage and heightened fatty acid oxidation. Our findings underscore the significance of MUL1-mediated mitophagy in regulating lipogenesis and adiposity, particularly in the context of HFD. Consequently, our data advocate the potential of MUL1 as a therapeutic target for drug development in the treatment of obesity, insulin resistance, NAFLD, and cardiometabolic diseases.
1 Introduction
The primary function of mitochondrial metabolism is to provide ATP, through oxidative phosphorylation (OXPHOS) and to support the energy demand of the cells (Devin and Rigoulet, 2007; Yoboue et al., 2014). In addition, mitochondria play a major role in the biosynthesis of precursors used for macromolecules such as lipids, proteins, DNA, and RNA. These bioenergetic and biosynthetic functions of mitochondria are regulated and adjusted in response to changes in the cellular environment (Spinelli and Haigis, 2018). The regulation of mitochondrial metabolism involves numerous proteins with diverse functions as well as effective communication between mitochondria with the rest of the cell. MUL1 (also known as Mulan, MAPL, GIDE, and HADES) is one of the three mitochondrial E3 ubiquitin ligases, alongside March5 and RNF185 (Li et al., 2008; Zhang et al., 2008; Braschi et al., 2009; Jung et al., 2011; Tang et al., 2011). MUL1 is located on the outer mitochondrial membrane (OMM) and its function has been implicated in various cellular processes such as mitophagy, cell death, mitochondrial dynamics, and innate immune response (Jenkins et al., 2013; Ambivero et al., 2014; Cilenti et al., 2014; Prudent et al., 2015; Ni et al., 2017; Puri et al., 2020; Calle et al., 2022). MUL1 can perform K48- and K63-ubiquitination, as well as SUMOylation, targeting specific substrates located in the OMM or the vicinity of the mitochondria (Scorrano and Liu, 2009; Prudent et al., 2015; Doiron et al., 2017; Ni et al., 2017; Barry et al., 2018; Cilenti et al., 2020). Our previous studies, using HEK293 and HeLa cell lines, revealed a novel function of MUL1 in the regulation of mitochondrial metabolic homeostasis, where Mul1 deletion affects mitochondrial respiration and lipid metabolism (Cilenti et al., 2020; Di Gregorio et al., 2021; Cilenti et al., 2022). In our present study, we investigate the role of MUL1 in obesity and mitochondrial metabolism using mice with a whole-body inactivation of the Mul1 gene (Mul1(−/−)) (Goyon et al., 2023). Mul1(−/−) animals kept on a normal chow diet (ND) exhibit impaired mitophagy, and are slightly smaller and leaner than wildtype littermates, yet developmentally normal. Upon placement on a high-fat diet (HFD), MUL1 protein expression is induced in the liver and white adipose tissue (WAT) of wild-type Mul1(+/+) animals. The absence of MUL1 expression in Mul1(−/−) mice on HFD causes increased metabolic rate, reduced lipogenesis, and robust resistance to obesity. Using metabolomic, lipidomic, as well as transcriptomic analysis we identified metabolic pathways involved in lipogenesis, and β-oxidation that are affected by MUL1. Similar data were obtained when a human liver cell line that lacks Mul1 expression, HepG2 Mul1(−/−), was also used. HepG2 Mul1(−/−) cells have deregulated mitophagy and reduced lipid accumulation. Our studies suggest that the induction of MUL1 protein during conditions of nutritional overload is necessary, and essential for fat accumulation and the obesity that follows in mice. Inactivation of Mul1 affects the regulation of lipogenesis and mitochondrial metabolism in a process linked to increased reactive oxygen species (ROS) and dysfunctional mitophagy. These findings underscore a novel role for MUL1 ligase in the regulation of obesity and support the hypothesis that mitochondrial deregulation profoundly impacts adiposity and systemic metabolism. Overall, our studies implicate MUL1 as a promising therapeutic target for the development of interventions aimed at combating obesity and associated metabolic diseases.
2 Materials and methods
2.1 Animal studies
Male and female wild-type, Mul1(+/+) mice, as well as whole-body Mul1 deficient, Mul1(−/−) mice, were used throughout our studies. Mul1(−/−) mice have been described (Goyon et al., 2023) and were generously provided by Dr. Heidi McBride, McGill University, Montreal, Quebec Canada. Mul1(−/−) mice were obtained by breeding heterozygous Mul1(+/−) animals. All animals were maintained at 22°C ± 1°C with a 12-h light-dark cycle and given free access to food and water. For the HFD experiments mice at 8 weeks of age were divided into two groups, each group was composed of six to eight animals. The normal diet (ND) group was maintained for 16 weeks on a diet where 18% of the calories were derived from fat, whereas in the HFD 60% of calories were obtained from fat (Research Diets D12492). Animal body weight was monitored every 2 weeks during the HFD period. After 16 weeks, the animals were used for glucose and insulin tests and subsequently euthanized, liver and fat tissues were collected and used for histology, LC-MS metabolomics, global lipidomic, mRNA sequencing, and Western blot analysis. All experimental protocols were conducted in compliance with animal procedures and approved by the University of Central Florida Institutional Animal Care and Use Committee (IACUC).
2.2 Glucose and insulin tolerance test
Glucose tolerance test (GTT) and insulin tolerance test (ITT) were performed on Mul1(+/+) and Mul1(−/−) mice that were maintained for 16 weeks on HFD or ND. Animals were fasted for either 16 h (GTT) or 6 h (ITT). For the GTT test, mice were intraperitoneally (i.p.) injected with glucose in PBS at a dose of 1 g/kg body weight (BW). Blood glucose levels were measured before injection and at various time points up to 2 h using the Easy Touch glucose monitoring system. For ITT, animals were i. p. injected with insulin (Novolin R U-100 Thermo Fisher Scientific) at a dose of 1 IU/kg BW. Blood glucose was measured every 15 min for up to 2 h as described above.
2.3 Liver histology
Liver tissue obtained from Mul1(+/+) and Mul1(−/−) mice kept on an HFD for 16 weeks, was stained with hematoxylin and eosin (H&E) or Oil Red O (ORO) as previously described (Johnson et al., 2012). Briefly, liver and iWAT tissues from mice were fixed overnight in 10% neutral formalin and embedded in paraffin. Paraffin-embedded liver and iWAT tissues were cut into sections and stained with H&E for assessment of liver or fat histology. For the ORO staining, freshly frozen liver tissues were embedded in Tissue-Tek OCT in a cryostat mold. The sections were then stained with ORO to monitor the lipid accumulation (Mehlem et al., 2013).
2.4 Generation of HepG2 Mul1(−/−) cell line using CRISPR/Cas9
MUL1 was inactivated in the human liver cell line, HepG2, using CRISPR-Cas9 genome editing. Briefly, a specific Mul1 target sequence 5′–GCCGCCGTCATGGAGAGCGG–3′ in exon one was cloned in the pSpCas9(BB)-2A-Puro vector (Addgene plasmid PX459) as previously described (Ran et al., 2013; Chean et al., 2021). The resulting vectors (PX459-Mul1-target) and the empty PX459 control vector were transfected into HepG2, and transfected cells were enriched by puromycin selection. The specific clones were expanded and MUL1 protein expression was monitored by Western blot analysis. Genomic DNA was isolated from single clones and used for PCR amplification and DNA sequencing to verify the deletion of the target sequence surrounding exon one of the Mul1 gene. Several independent knockout clones, HepG2 Mul1(−/−), and wildtype HepG2 MUL1 (+/+) clones were selected for further experiments.
2.5 Confocal microscopy
Equal numbers of HepG2 Mul1(+/+) and HepG2 Mul1(−/−) cells were seeded on glass coverslips in 12-well plates. At about 80% confluency cells were treated with CCCP (10 or 20 μM) or DMSO control for 4 h. LysoTracker-Red and MitoTracker-Green were used to stain the cells to assess mitophagy, where depolarized mitochondria co-localize with autophagosomes. LysoTracker-Red probe was used to label and track acidic organelles in living cells including lysosomes and autophagosomes (Rodriguez-Enriquez et al., 2006; Rodriguez-Enriquez et al., 2009). HepG2 Mul1(+/+) and HepG2 Mul1(−/−) cells were also used to induce lipid droplet accumulation and exposed to 300 or 600 μM oleic acid (OA) conjugated to fatty acid-free bovine serum albumin (BSA), for 15 h, as previously described (Grunig et al., 2018; Eynaudi et al., 2021). Cells treated with BSA were used as controls. Cell fluorescence was imaged using a TCS SP5 II confocal laser-scanning microscope (Leica).
2.6 SDS-PAGE and western blot analysis
Mouse liver or iWAT tissues were homogenized using a Triton X-100 based lysis buffer (1% Triton X-100, 10% glycerol, 150 mM NaCl, 20 mM Tris pH 7.5, 2 mM EDTA) in the presence of protease inhibitors tablets (Thermo Fisher Scientific). Approximately 40 μg of whole tissue extract was resuspended in SDS sample buffer, boiled for 5 min and the proteins resolved by SDS-PAGE. They were then transferred onto PVDF Immobilon membranes (Millipore) using a semi-dry cell transfer blot (Bio-Rad) and placed in 4% nonfat dry milk in TBST buffer (25 mM Tris-HCl pH 8.0, 125 mM NaCl, 0.1% Tween 20) to block nonspecific binding of the membrane. The membranes were incubated with the indicated primary antibodies: MUL1, rabbit polyclonal antibodies (SIGMA), SCD1, CPT1, LC3, P62, PPARα, and PGC1α (ProteinTech), AMPK, pAMPK, ACC1, pACC1 (Cell Signaling Technology), FASN (ABclonal) β-actin, GAPDH and HSP90 (Santa Cruz Biotechnology). Secondary peroxidase-conjugated goat anti-rabbit or goat anti-mouse antibodies (Jackson ImmunoResearch) were used at 1:10,000 dilution; the membrane was then visualized by enhanced chemiluminescence (ECL) (Thermo Fisher Scientific).
2.7 Oxidative stress
H2O2 treatment, (200 or 300 μM) for 8 h, was used to induce oxidative stress. An equal number of cells (1 × 10⁵) was used in experiments to monitor superoxide and reactive oxygen species (ROS) production, using MitoSOX superoxide indicator as previously described (Kauffman et al., 2016). Briefly, cells were washed in cPBS (PBS with the addition of 0.5 mM of CaCl2, 0.5 mM MgCl2, and 0.1% Glucose). Cells were resuspended in 100 μL of cPBS containing 1 μM of MitoSOX-Red and incubated at 37°C for 30 min followed by a final wash and flow cytometric analysis (Kauffman et al., 2016; Di Gregorio et al., 2021).
2.8 Indirect calorimetry measurements
The indirect calorimetry cage system (Promethion Sable Systems International) was used to measure oxygen consumption, CO2 emission, energy expenditure, food intake, water consumption, locomotor activity, and animal weight. The software captures metabolic parameters in each cage every 5 min. Mice were weighed and then individually housed in cages for 6 days. Animals were first acclimated to the cages for 1 day before experimental data were collected for 96 h. Mice were maintained on a 12-h/12-h light/dark cycle and had free access to food and water for the duration of the experiment. Data were analyzed using CalR, a web-based analysis tool of indirect calorimetry to measure physiological energy balance (Mina et al., 2018; Corrigan et al., 2020).
2.9 LC-MS analysis of mouse liver
Liver tissue from Mul1(+/+) and Mul1(−/−) mice on HFD were subjected to the Folch extraction to separate lipids and polar metabolites. Polar metabolites were analyzed on Thermo Q-Exactive Orbitrap mass spectrometer equipped with UHPLC. Samples were analyzed in positive and negative modes using a heated electrospray ionization (HESI) source. Data were analyzed with MZmine and features were aligned for identification across samples. The metabolites were searched against the Southeastern Center for Integrated Metabolomics (SECIM) metabolite library using retention time and corresponding mass spectral data. Lipids isolated from Folch extraction procedure were also analyzed by the same instrument. Lipidomic data were analyzed using the LipidMatch software and identified lipid entities were exported in a tabular form (Koelmel et al., 2017; Cilenti et al., 2022).
2.10 Metabolomics analysis
The intensity of metabolites was normalized by the weight of the liver tissue used in the extraction of metabolites. MetaboAnalyst (https://www.metaboanalyst.ca) was utilized for metabolomics and joint metabolic pathway analysis of genes and metabolites. Fold-change normalized LC-MS data was imported into MetaboAnalyst software for statistical analysis. Joint metabolic pathway analysis was performed with uniport protein ID and HMDB ID of gene and metabolites, respectively. The fold change of genes and metabolites between the Mul1(−/−) and Mul1(+/+) HFD-liver was used to perform joint metabolic pathway analysis. The metabolomics panel of significantly different metabolites between Mul1(+/+) HFD-liver and Mul1(−/−) HFD-liver was identified via t-test in MetaboAnalyst (Chong et al., 2019).
2.11 Lipidomic analysis
The profiling of lipids was carried out using the normalized individual lipid to the liver tissue weight utilized for each sample. The top 10 most abundant lipids in each class are displayed and expressed as mean ± S.D. (n = 4). Enrichment analysis between Mul1(+/+) HFD-liver and Mul1(−/−) HFD-liver in the ranking mode by lipid ontology (LION) interface was used to search for significantly different lipids (Molenaar et al., 2019). The cut-off value of significantly up-or downregulated lipids in Mul1(−/−) HFD-liver concerning Mul1(+/+) HFD-liver (p < 0.05) was determined and the data represented as −log FDR q-values.
2.12 RNA sequencing analysis
Standard RNA-sequencing for gene profiling expression of protein-coding sequences (mRNA) was performed using liver tissues from Mul1(+/+) and Mul1(−/−) mice on HFD (n =3 per group). Approximately 100 mg of tissue was used for cDNA library construction, DNA sequencing, and data analysis (GENEWIZ Azenta Life Sciences). Using DESeq2, a comparison of gene expression between the defined groups of samples was performed. The Wald test was used to generate p-values and log2 fold changes. Genes with an adjusted p-value <0.01 (p < 0.01) and absolute log2 fold change >1 were labeled as differentially expressed genes. Significantly differentially expressed genes were clustered by their gene ontology and the enrichment of gene ontology terms was tested using Fisher exact test. Heatmaps of the top fifty, as well as genes specifically involved in fatty acid metabolism, lipid, and phospholipid biosynthesis metabolomic processes, were analyzed using RStudio. The differentially expressed genes involved in fatty acids biosynthesis and metabolism were used to generate a heatmap using the Heatmap2 software (Chen et al., 2016).
2.13 Statistical analysis
All quantitative data are expressed as mean ± S.D. of three or four independent experiments. Following Western blot analysis, the optical densities of blot bands were determined using ImageJ software. The protein/housekeeping ratio was obtained based on the densitometry data. The difference among groups was analyzed by one-tailed Student’s t-test as well as two-tailed with Welch’s correction. A value of p ≤ 0.05 was considered significant. Metabolic rate analysis was performed using CalR software and the p-value of factors was analyzed with ANOVA and GLM. For metabolomic data analysis (LC-MS metabolomic, lipidomic) as well as RNA-seq a value of p ≤ 0.05 was considered significant.
3 Results
3.1 Genetic ablation of Mul1 in mice confers resistance to HFD-induced obesity
Our recent studies, using human cell lines HEK293 and HeLa, have identified a new role for MUL1 ligase in the regulation of mitochondrial metabolism (Cilenti et al., 2020; Di Gregorio et al., 2021; Cilenti et al., 2022). In the present study, we investigated whether whole-body inactivation of Mul1 can affect the metabolism of the animals. Mul1(−/−) mice maintained on regular chow (ND) are slightly smaller, leaner (Supplementary Figure S1A), and have improved glucose tolerance and better insulin sensitivity than their wild-type Mul1(+/+) littermates (Supplementary Figure S1B p < 0.05). We monitored the effect of HFD on the lipogenesis and adiposity of Mul1(−/−) mice. Following 16 weeks of HFD, wild-type, Mul1(+/+) animals, exhibited all the symptoms of HFD-induced obesity including a significant increase in body weight (Figures 1A, B). On the contrary, Mul1(−/−) animals showed resistance to HFD-induced obesity with very little increase in body weight (Figure 1B) (p < 0.05 for the first 10 weeks or p < 0.01 from week 10–16). This effect was manifested in both male and female mice (Figures 1A, B). Glucose tolerance and insulin resistance were also monitored in both Mul1(−/−) and Mul1(+/+) animals on HFD. Figures 1C, D show that Mul1(+/+) mice exhibited glucose intolerance and insulin resistance that is typically associated with obesity (p < 0.01 GTT or p < 0.05 ITT). These conditions were not present in Mul1(−/−) animals that had improved glucose tolerance and better insulin sensitivity (Figures 1C, D). Since hepatic steatosis is a key feature of obesity, we compared liver sections from Mul1(+/+) and Mul1(−/−) animals stained with H&E. Figure 1E (top panel) shows Mul1(+/+) mice exhibit clear signs of steatosis characterized by hepatocyte ballooning and accumulation of vacuoles. This steatosis phenotype was absent in Mul1(−/−) animals. In addition, Oil Red O staining of liver tissue shows that Mul1(−/−) mice have a marked reduction in lipid accumulation compared to Mul1(+/+) animals (Figure 1E, lower panel). Mul1(−/−) mice displayed a marked reduction in all fat depots including inguinal (iWAT), subcutaneous (sWAT), and mesenteric (mWAT) tissues (Figure 1F). Moreover, there is a significant reduction in adipocyte size between the Mul1(+/+) and Mul1(−/−) mice on HFD (Figure 1G).
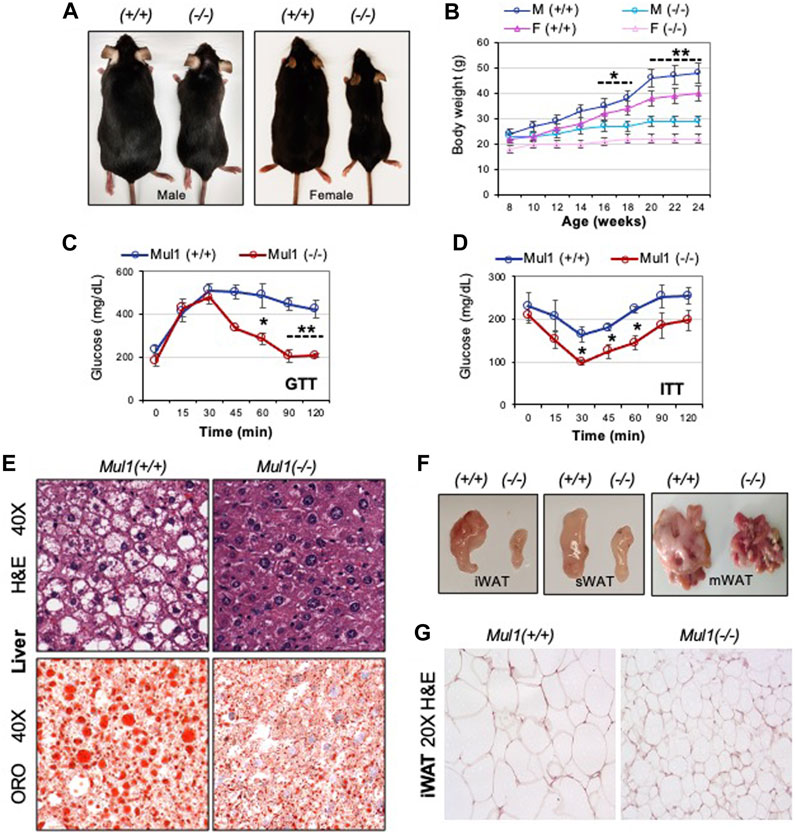
Figure 1. Mul1(−/−) mice are protected against HFD-induced obesity. (A) Representative images of Mul1(+/+) and Mul1(−/−) male and female mice on HFD to highlight the size difference between these animals. (B) Body weight of Mul1(+/+) and Mul1(−/−) mice. Male and female animals (n = 8) were monitored every 2 weeks during the HFD. (C) Glucose tolerance test (GTT) and (D) insulin tolerance test (ITT) was performed on male mice on HFD (n = 5). (E) Hematoxylin and eosin (H&E) and Oil red O (ORO) staining of HFD-liver tissues. (F) Representative images comparing the different adipose tissue depots between the Mul1(+/+) and Mul1(−/−) mice on HFD: inguinal (iWAT), subcutaneous (sWAT), and mesenteric (mWAT). (G) H&E-stained sections of HFD-iWAT from Mul1(+/+) and Mul1(−/−) animals. All data are presented as the mean of individuals in each group ±S.D. of three independent experiments, *p < 0.05 and **p < 0.01, Mul1(+/+) vs. Mul1(−/−).
3.2 Inactivation of Mul1 impairs mitophagy in HepG2 cells and mice
We created HepG2 Mul1(−/−) cells using CRISPR-Cas9 as described in Methods, and the degree of mitophagy was monitored and compared to HepG2 Mul1(+/+) control. Mitophagy was induced using CCCP followed by MitoTracker-Green and LysoTracker-Red staining. Figure 2A shows representative cell images of the colocalization of mitochondria with lysosomes. Based on the number of mito-lysosomes per cell, mitophagy is significantly reduced in HepG2 Mul1(−/−) cells (Figure 2B) (p < 0.027). In addition, the protein level of p62 and the conversion of LC3B I to LC3B II were also monitored by Western blot analysis using the CCCP mitophagy inducer or the 3-MA mitophagy inhibitor. Figures 2C, D clearly show that HepG2 Mul1(−/−) have impaired mitophagy compared to HepG2 Mul1(+/+) cells and 3-MA treatment of HepG2 Mul1(−/−) cells decreases mitophagy even further (as seen by additional p62 accumulation) (p < 0.034) and reduced LC3B II/LC3 I ratio (p < 0.05). This result suggests that, in the absence of MUL1 expression, mitophagy is significantly impaired but not eliminated. A MUL1-independent mechanism probably regulates this residual mitophagy and might be necessary for cell survival. We also investigated the state of mitophagy in the liver of Mul1(+/+) and Mul1(−/−) mice maintained on normal (ND) or high-fat diet (HFD). Figures 2E, F show that mitophagy is also impaired in the liver of Mul1(−/−) mice on ND as well as on HFD with accumulation of p62 (p < 0.0147) and reduced LC3B II/LC3 I conversion (p < 0.02). Figure 2G shows that HepG2 Mul1(−/−) cells treated with various concentrations of H2O2 accumulate higher levels of ROS than HepG2 Mul1(+/+) cells (p < 0.03).
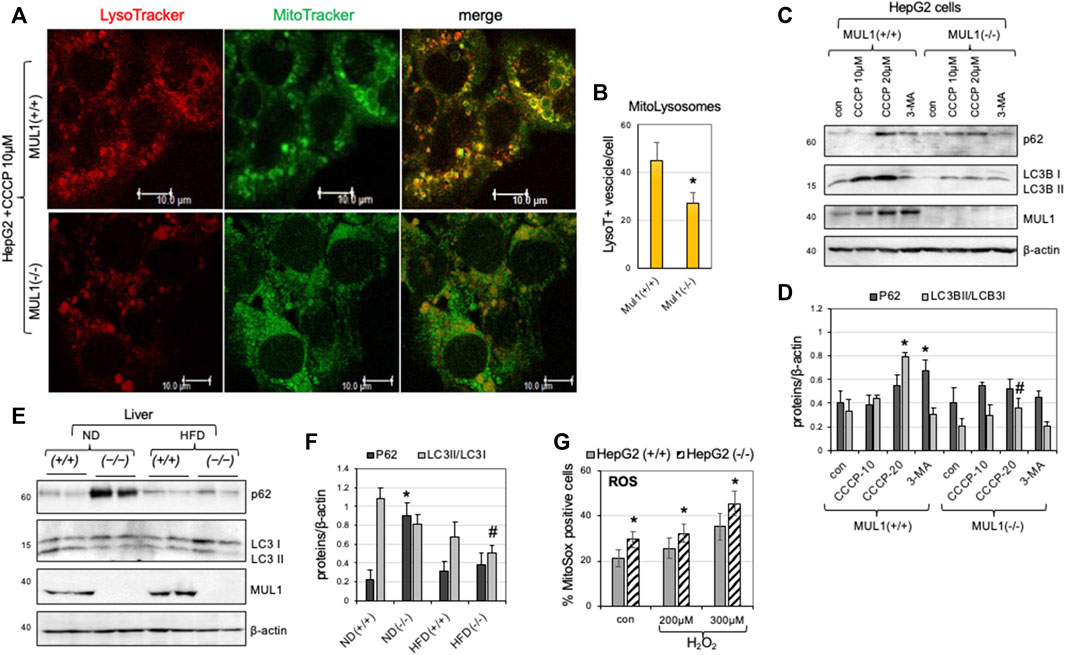
Figure 2. Impaired mitophagy in the absence of MUL1 expression. (A) Confocal images of HepG2 Mul1(+/+) and Mul1(−/−) cells treated with CCCP followed by staining with MitoTracker-Green and LysoTracker-Red. (B) Quantification of mitophagy is expressed as the number of LysoTraker positive dots that colocalize with Mito-Tracker (mito-lysosomes) *p ≤ 0.027. (C) Western blot analysis to monitor the expression of mitophagy-related proteins p62, LC3B I, and LC3B II in HepG2 Mul1(+/+) and Mul1(−/−) cells. CCCP was used as an inducer and 3-MA as an inhibitor of mitophagy. (D) Densitometric measurement of p62 and LC3B II/LC3BI ratio proteins level normalized to β-actin. *p ≤ 0.034 vs. con Mul1(+/+); #p ≤ 0.05 vs. Mul1(+/+) CCCP-20. (E) Western blot analysis of p62, LC3B I, LC3B II, and MUL1 proteins of liver extracts obtained from Mul1(+/+) and Mul1(−/−) mice maintained on ND or HFD. (F) Densitometric analysis of the P62 and LC3B II/LC3BI ratio protein level from (E) normalized to β-actin. *p ≤ 0.0147 vs. ND (+/+); #p ≤ 0.02 vs. ND (+/+). (G) The amount of ROS production (control and H2O2 treated HepG2 Mul1(+/+) and Mul1(−/−) cells) was monitored using MitoSOX and flow cytometry. *p ≤ 0.03 vs. HepG2 (+/+). All values are expressed as means ± S.D. of four independent experiments.
3.3 Mul1(−/−) mice have increased energy expenditure
To investigate the mechanism by which MUL1 regulates metabolism, we performed indirect calorimetry using Mul1(−/−) mice on ND or HFD. Mul1(−/−) mice on ND exhibited a significant increase in oxygen consumption as well as energy expenditure compared to Mul1(+/+) animals, particularly during the dark cycle (Figures 3A, B) (p < 0.05), but only a small difference in the body weight (Figure 3C). The difference in oxygen consumption and energy expenditure between the Mul1(+/+) and Mul1(−/−) mice was even more pronounced when animals were placed on HFD (Figures 3D, E) (p < 0.05). Additionally, Mul1(−/−) mice had significantly higher food consumption (Figure 3F) (p < 0.05), and activity (locomotion) (Figure 3G) (p < 0.01). Figure 3H shows the average body weight of the animals following the HFD experiment (n = 5) which highlights the significant resistance of Mul1(−/−) mice to diet-induced obesity (p < 0.001).
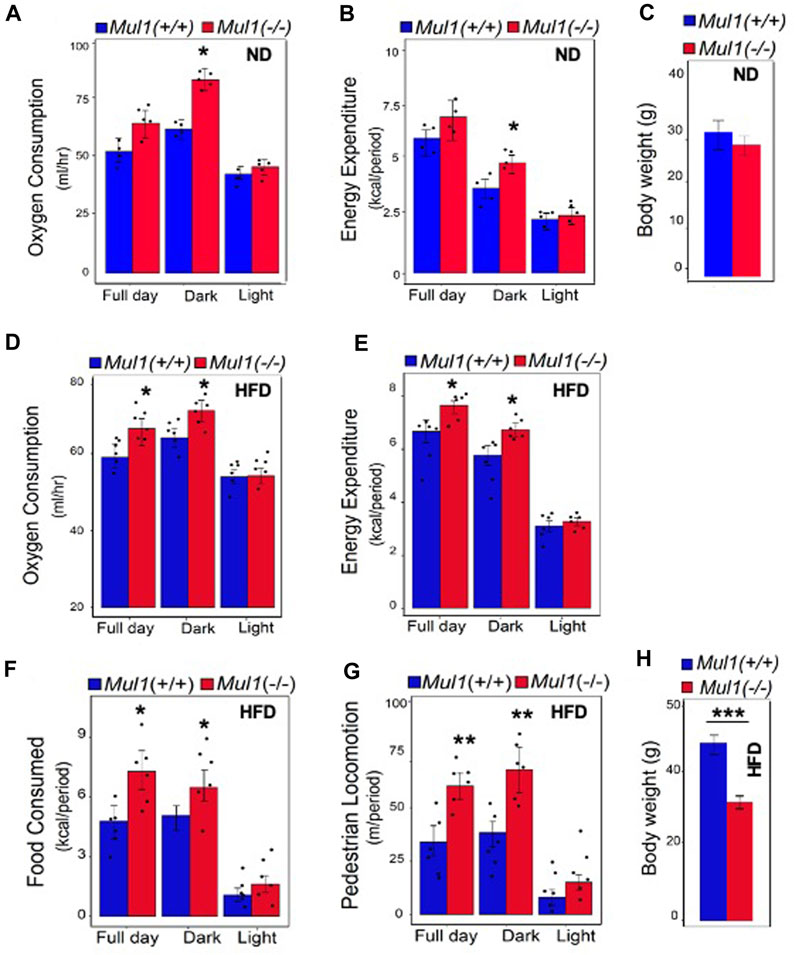
Figure 3. Mul1(−/−) mice on HFD have increased respiration and energy expenditure. Mice were individually housed in Promethion system metabolic cages at 22°C for 6 days for data collection. Animal groups (n = 5 per group) were maintained on ND or HFD as indicated, throughout the assay. Representative data were collected over 48 h (dark/light cycle). Animals maintained on ND: (A) Oxygen consumption plot bar, (B) energy expenditure plot bar, (C) body weight of Mul1(+/+) and Mul1(−/−) mice. Animals maintained on HFD: (D) Oxygen consumption plot bar, (E) energy expenditure plot bar, (F) Average food intake, (G) activity measured by pedestrian locomotion, and (H) body weight measurement corresponding to the Mul1(+/+) and Mul1(−/−) animals. Data are presented as mean value ±S.D. (n = 5 per group). Data analysis was performed using CalR software over 48 h (full day, dark, light). The p-value of factors was analyzed with ANOVA and GLM. *p < 0.05, **p < 0.01 and ***p < 0.001 vs. Mul1(+/+).
3.4 Global metabolomic analysis of Mul1(+/+) and Mul1(−/−) mouse liver on HFD
The effect of the Mul1 inactivation on the metabolic homeostasis in the liver of mice on HFD was investigated using LC-MS global metabolomics. The unsupervised principal component analysis (PCA) scores plots show clear separation in the metabolic profile between Mul1(+/+) and Mul1(−/−) HFD-liver in LC-MS positive ion mode (Figures 4A, B). The supervised partial least squares discriminant analysis (PLS-DA) model was used to predict the classes of samples and maximize the separation between groups. The PLS-DA variable importance projection (VIP) scores plot from LC-MS positive mode identified a large group of metabolites that showed differences between Mul1(+/+) and Mul1(−/−) HFD-liver (Figure 4C). The VIP scores plot identified metabolites such as acetylcitrulline, α-aminoadipate, propanoylcarnitine, adenine, D-glucosamine, cytosine, and guanidinoacetate, that were found to be significantly higher in the liver of Mul1(−/−) on HFD. In contrast, lactic acid, hippurate, 6C-sugar alcohol, and glycerol 3-phosphate were lower in Mul1(−/−) liver. Similarly, LC-MS negative mode data also showed separation in PCA and PLS-DA models (Figures 4D, E). The PLS-DA VIP scores plot showed that metabolites such as pyruvate, malate, histidine, xanthine, and tryptophan were higher in Mul1(−/−) HFD-liver than Mul1(+/+). Metabolites such as glutathione, sucrose, raffinose, and glycerol 2-phosphate were higher in Mul1(+/+) (Figure 4F). The semiquantitative readout levels demonstrate the number of significantly different metabolites that drive the PLS-DA classifications (Figures 4G, H) (p < 0.05).
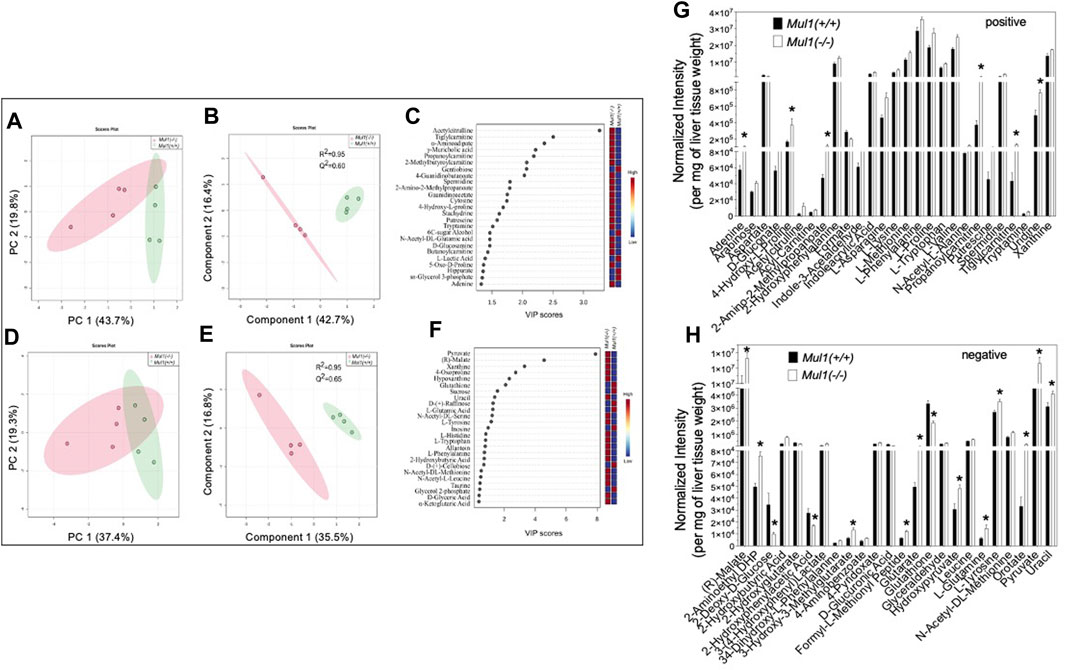
Figure 4. Metabolomic analysis of Mul1(−/−) mouse liver on HFD. (A) and (D), Score plots of principal component analysis (PCA) from LC-MS data of positive and negative ion modes, respectively. The amount of variance explained is shown in parentheses on each axis and the shaded area indicates the 95% confidence region. (B) and (E) Scores plots of partial least squares discriminant analysis (PLS-DA) from similar datasets and the amount of variance is displayed in parentheses on each axis and the shaded areas indicate the 95% confidence regions based on the data points for each group in PLS-DA models. (C) and (F). Variable importance in projection (VIP) scores plot derived from PLS-DA model (B) and (E), respectively. VIP scores plots from PLS-DA models demonstrated the differences in the level of the top 25 metabolites between Mul1(+/+) and Mul1(−/−) liver. Bar diagram demonstrating the levels of significantly different metabolites between the liver of Mul1(+/+) and Mul1(−/−) animals on HFD (n = 4 per group). (G) The metabolites shown in the plot were identified by LC-MS positive ion mode and metabolite signal intensity was normalized to per mg of liver tissue weight. (H) The metabolites shown in the plot were identified by LC-MS negative ion mode. The p-value of all significantly different metabolites is indicated *≤0.05 vs. Mul1(+/+) liver.
3.5 Liver lipidomic profiles of Mul1(+/+) and Mul1(−/−) mice on HFD
The total lipid content and profiling of lipid classes were carried out using the normalized intensities by liver weight (Figure 5A). As expected, the total lipid content and triglycerides were found to be significantly higher in the liver of Mul1(+/+) than in Mul1(−/−) mice on HFD. Total diacylglycerol, phosphatidylcholines, phosphatidylethanolamines, and ceramides were not significantly different between the two groups of animals (Figure 5A) (p > 0.05). Nine of the top 10 triglycerides by abundance were significantly different between both groups and higher in Mul1(+/+) HFD-liver (Figure 5B) (p < 0.05). DG (16:0_22:6) and DG (18:1_20:3) were significantly higher in Mul1(+/+) HFD-liver than Mul1(−/−) HFD-liver (Figure 5C). Other classes of lipids showed fewer significant differences (Figures 5D, E, F) (p < 0.05). LION term enrichment analysis of Mul1(+/+) versus Mul1(−/−) liver summarized the changes in lipid entities in Mul1(−/−) HFD liver (Figure 5G). Glycerophosphoglycerols, glycerophospholipids, and long-chain fatty acids (C22-C24) were significantly higher in Mul1(−/−) HFD liver (Figure 6C). The joint-metabolic pathway analysis also showed that glycerophospholipid metabolism is significantly altered in Mul1(−/−) HFD liver. The lipids containing neutral head groups, triglycerides, lipid storage, and glycerolipids were found to be significantly lower in Mul1(−/−) HFD liver. The lipidomic analysis indicates that MUL1 inactivation causes a massive change in lipid metabolism even with the supplementation of the HFD. Figure 5B indicates that monounsaturated and polyunsaturated fatty acyl-containing triglycerides are significantly lower in Mul1(−/−) HFD liver. Figure 5G shows that monounsaturated fatty acids, triglycerides, lipid droplets, and lipid storage as integrated pathways were downregulated in Mul1(−/−) HFD-liver including palmitoleate and oleate, products of SCD1 activity. Additionally, PCA and PLS-DA analysis as well as clustered heatmap clearly showed the separation in the overall lipid profiles between Mul1(−/−) and Mul1(+/+) HFD-liver (Supplementary Figures S2A, S2B, and S2C).
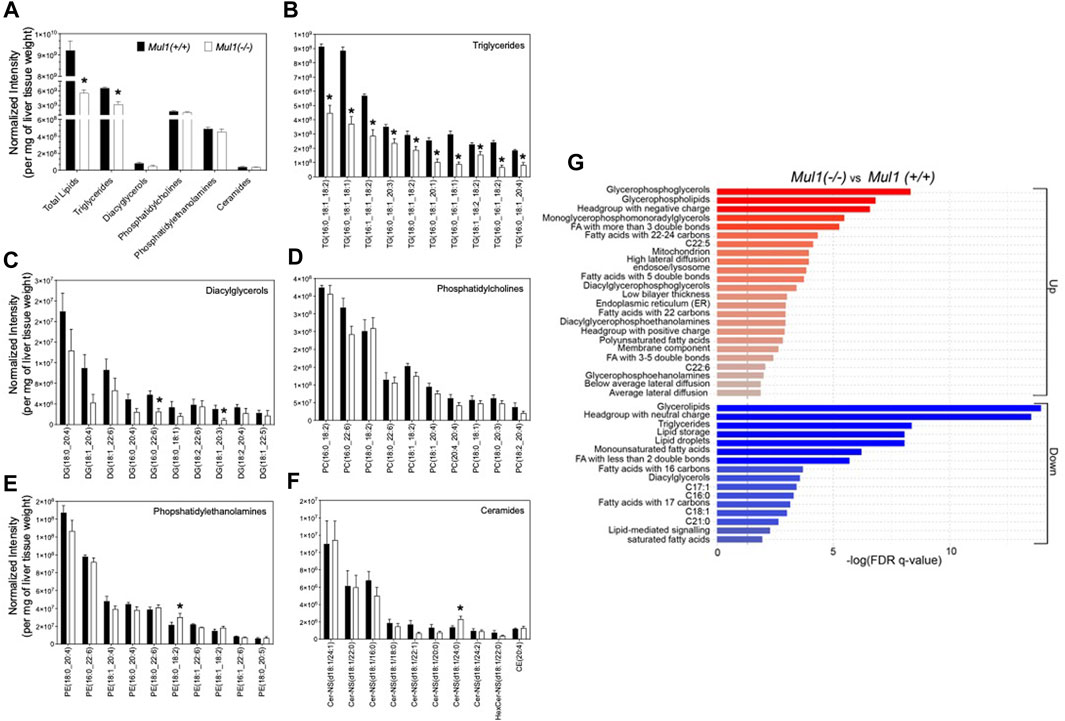
Figure 5. Lipidomic profiling of Mul1(−/−) mouse liver on HFD. (A) High-resolution LC-MS/MS-based profiling of total lipids and lipid classes (triglycerides (TGs), diacylglycerols (DGs), phosphatidylcholines (PCs), phosphatidylethanolamines (PEs) and ceramides) in Mul1(+/+) control and Mul1(−/−) mice liver. (B–F) profiling of the ten highest abundant TGs, DGs, PCs, Pes, and ceramides in Mul1(+/+) and Mul1(−/−) mice liver, providing more insights into the profiles of individual lipids. (G) Lipid Ontology (LION) and enrichment analysis of Mul1(−/−) and Mul1(+/+) liver in the “ranking mode”. The gray vertical lines indicate the cut-off value of significant enrichment: up (red bars) and down (blue bars) lipids in Mul1(−/−) mice liver (q < 0.05). All data are expressed as mean ± S.D. (n = 4 per group) and individual lipid intensity was normalized to liver tissue weight (mg). *≤0.05 vs. Mul1(+/+) liver.
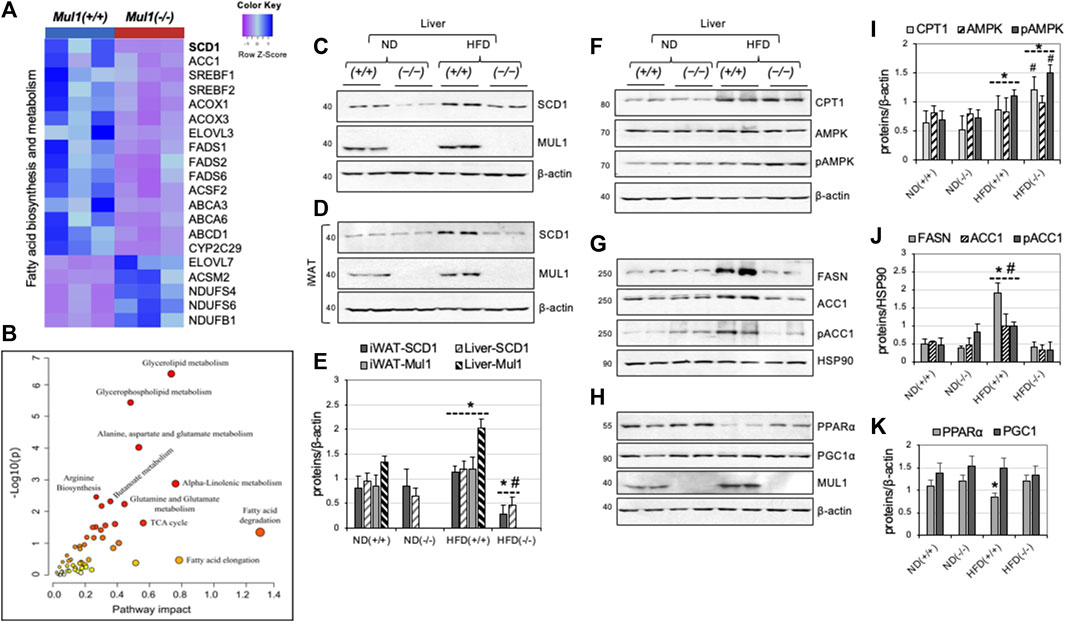
Figure 6. Differential expression of genes and proteins involved in lipogenesis and fatty acid synthesis in the liver of Mul1(−/−) mice on HFD. (A) Heatmap of the top differentially expressed genes involved in fatty acid biosynthesis and metabolism; most of the genes in this group are downregulated with only a few upregulated in Mul1(−/−) liver (p-value <0.01). (B) Joint metabolic pathway analysis, employing genes and metabolites with uniport protein ID and HMDB ID, respectively with the fold change in Mul1(+/+) and Mul1(−/−) liver. The metabolic pathways with higher impact (glycerolipid) were significantly perturbed in Mul1(−/−) liver (p-value < 0.03). (C) Western blot analysis to monitor protein expression of SCD1 and MUL1 in the liver or (D) iWAT from Mul1(+/+) and Mul1(−/−) mice kept on an ND or HFD. (E) Densitometrical analysis of SCD1 and MUL1 protein expression from (C) and (D) normalized against β-actin. *p ≤ 0.036 vs. ND (+/+); #p ≤ 0.021 vs. HFD (+/+). (F) Western blot analysis to monitor the protein expression of CPT1, AMPK, and pAMPK; (G) FASN, ACC1, and pACC1; (H) PPARα, PGC1α, and MUL1 in the same liver extract. (I) The graph shows densitometric analysis from (F). *p ≤ 0.015 vs. ND (+/+); #p ≤ 0.014 vs. HFD (+/+). (J) Densitometric analysis of FASN, ACC1, and pACC1 from (G) normalized against HSP90. *p ≤ 0.023 vs. ND (+/+); #p ≤ 0.015 vs. HFD. (K) Densitometric analysis from (H). *p ≤ 0.045 vs. ND. Results are shown as means ± S.D. of at least three independent experiments.
3.6 Differential gene and protein expression in Mul1(−/−) mouse liver on HFD
mRNA sequencing identified about 5,000 differentially regulated genes (p < 0.027) in the HFD-liver of Mul1(−/−) and Mul1(+/+) animals. The heatmap in Figure 6A highlights genes involved in fatty acid biosynthesis and metabolism that were significantly downregulated in the HFD-liver of Mul1(−/−) mice. Genes upregulated include: NADH: ubiquinone oxidoreductase subunit AB1 (NDUFAB1), NADH: ubiquinone oxidoreductase subunit S6 (NDUFS6), and NADH: ubiquinone oxidoreductase subunit S4 (NDUFS4) all three of them are subunits of Complex I of electron transport chain (ETC) (Zhang et al., 2019; Choi et al., 2022). Upregulation of these genes has been implicated in the regulation of lipid metabolism and resistance to HFD-induced obesity (Takamura et al., 2008; Jin et al., 2014; Zhang et al., 2019). Among the differentially downregulated genes, Stearoyl-CoA Desaturase 1 (SCD1) stood out as a top candidate. SCD1 controls the biosynthesis of monounsaturated fatty acids (MUFA) from their saturated fatty acid (SFA) precursors, introducing a cis-double bond at the Δ9 position to stearoyl (C18:0) and palmitoyl-CoA (C16:0). SCD1 is a key regulator in lipid metabolism; high expression of SCD1 protein correlates with obesity, diabetes, and atherosclerosis and inactivation of SCD1 supports an HFD-resistant phenotype, reduced fat accumulation and insulin sensitivity (Flowers et al., 2007; Ralston et al., 2016; Dragos et al., 2017; Piccinin et al., 2019; Weiss-Hersh et al., 2020). In addition, the Scd1(−/−) mouse phenotype closely resembles that of the Mul1(−/−) animals (Ntambi et al., 2002; Flowers et al., 2007; Dobrzyn et al., 2008; Liu et al., 2010). ACC1 is a multifunctional enzyme that is involved in fatty acid synthesis and elongation (Mao et al., 2006; Wakil and Abu-Elheiga, 2009). We performed a joint metabolic pathway analysis using Uniport protein ID and HMDB ID of genes and metabolites, respectively. The fold change of genes and metabolite levels between the Mul1(−/−) and Mul1(+/+) HFD-liver were used as an input to create an integrative metabolic pathway analysis (Figure 6B) (p < 0.03). These results indicate that glycerolipids, glycerophospholipid, fatty acid metabolism, and alanine-aspartate-glutamate metabolism, were significantly affected in Mul1(−/−) HFD-liver. We investigated if the protein level of SCD1 is regulated similarly to its mRNA in the liver and iWAT from Mul1(−/−) mice kept on HFD. Figure 6C shows a significant SCD1 downregulation in both ND and HFD in the liver of Mul1(−/−) compared to Mul1(+/+) animals. Furthermore, Mul1(+/+) mice kept on HFD show induction of SCD1 and this induction is absent in Mul1(−/−) animals under the same conditions (Figure 6C). In iWAT the expression of SCD1 protein is similar between Mul1(−/−) and Mul1(+/+) animals on ND (Figure 6D). When Mul1(+/+) animals are kept on HFD there is a pronounced induction of SCD1 which is not replicated in the Mul1(−/−) mice (Figure 6D). In addition, the expression of MUL1 is induced by HFD in both iWAT and the liver of wild-type mice (Figures 6C, D). Figure 6E is a graph representation of densitometric analysis of the proteins from 6A to 6B normalized against β-actin (p < 0.036). In addition, we monitored the expression of various enzymes, known to be involved in the regulation of lipogenesis and β-oxidation in the liver of Mul1(−/−) mice on ND or HFD. The expression of CPT1 protein increases with HFD in the liver of both Mul1(+/+) and Mul1(−/−) mice (Figure 6F). AMPK protein level is not affected by the diet or the presence of MUL1, however, phospho-AMPK (pAMPK), which represents the active form of the enzyme, is substantially higher in Mul1(−/−) mice on HFD (Figure 6F). FASN, ACC1, and its phosphorylated form (pACC1) are all strongly upregulated in Mul1(+/+) on HFD but not in Mul1(−/−) animals (Figure 6G). HSP90 protein expression was used as a loading control (Figure 6G). Furthermore, we monitored the expression of PPARα and PGC1α proteins that are known to be involved in energy homeostasis, fatty acids metabolism, and mitochondrial biogenesis (Gervois et al., 2000; Abu Shelbayeh et al., 2023). Figure 6H shows that PPARα is downregulated in the liver of Mul1(+/+) on HFD and this regulation is absent in Mul1(−/−) mice; there is no detectable difference in the expression of PGC1α and MUL1 expression is significantly induced by HFD. Figures 6I, 6J, and 6K are graphs representing densitometric analysis of the proteins from 6F, 6G, and 6H normalized against β-actin or HSP90 (p ≤ 0.015, p ≤ 0.023, and p ≤ 0.045 respectively).
3.7 Inactivation of MUL1 reduces accumulation of lipid droplets in HepG2 Mul1(−/−) cells treated with oleic acid (OA)
HepG2 Mul1(−/−) and HepG2 Mul1(+/+) cells were either treated with 0.3 mM of oleic acid (OA) or buffer alone (control) followed by staining with both mitoTracker-red and BODIPY 493/503 and observed with confocal microscopy. Figure 7A shows that control (untreated) HepG2 Mul1(−/−) cells have less lipid droplet accumulation as seen by reduced BODIPY staining when compared to HepG2 Mul1(+/+) cells. When cells were treated with OA there was a significant accumulation of lipid droplets in HepG2 Mul1(+/+) but in Mul1(−/−) cells was significantly reduced (Figure 7B). We also monitored the expression of key enzymes, SCD1, CPT1, AMPK, pAMPK, PGC1α, and ACC1. Figure 7C show that all these proteins in HepG2 Mul1(−/−) cells treated with OA exhibit a similar regulation pattern to that observed in the liver of Mul1(−/−) animals on HFD. Densitometric analysis is shown in graphs 7D and 7E representing protein expression from 6C normalized against housekeeping proteins (p ≤ 0.047).
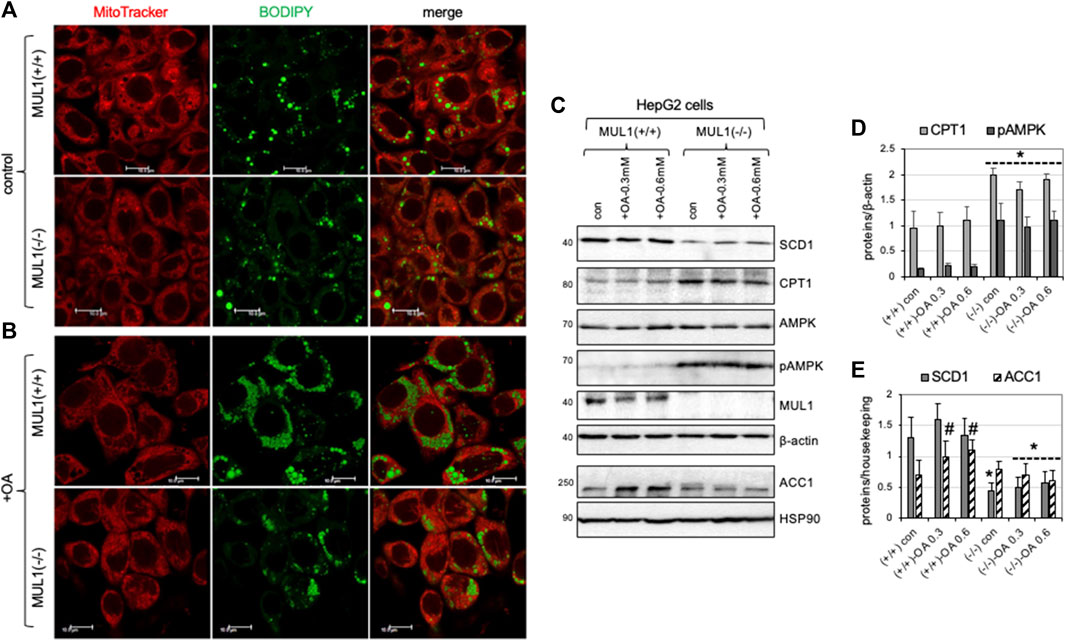
Figure 7. HepG2 Mul1(−/−) cells have reduced lipid droplet accumulation following oleic acid (OA) treatment. (A) Representative confocal images of HepG2 Mul1 (−/−) and HepG2 Mul1 (+/+) control or (B) treated cells with OA and stained with BODIPY-green and MitoTracker-Red for lipid droplet and mitochondria visualization. (C) Western blot analysis of SCD1, CPT1, AMPK, pAMPK, MUL1, and ACC1, in HepG2 Mul1 (−/−) and HepG2 Mul1 (+/+) cells with or without OA. Densitometric analysis of protein expression (D) CPT1 and pAMPK, and (E) SCD1 and ACC1 normalized against β-actin or HSP90. Data are presented as means ± S.D. of three independent experiments. *p ≤ 0.032 vs. Mul1 (+/+) cells; #p ≤ 0.047 vs. Mul1 (+/+) con.
4 Discussion
MUL1 is a unique E3 ubiquitin ligase due to its exclusive localization in the outer mitochondrial membrane and its ability to modify specific substrates through SUMOylation, as well as K63- or K48-ubiquitination (Braschi et al., 2009; Prudent et al., 2015; Kim et al., 2017; Ni et al., 2017; Kim et al., 2018). It has a large intermembrane domain (IMD) that can act as a sensor of various conditions in the mitochondria and modulate its ligase activity against various substrates (Li et al., 2008; Zhang et al., 2008). The IMD of MUL1 is also the target of mitochondrial Omi/HtrA2 protease which is involved in protein quality control and can regulate MUL1 protein levels during mitochondrial stress (Faccio et al., 2000; Cilenti et al., 2014). Our previous studies as well as work by other investigators have established the main function of MUL1 as a regulator of mitochondrial dynamics and mitophagy (Cilenti et al., 2014; Puri et al., 2020; Calle et al., 2022). In the absence of Omi/HtrA2 protease, there is an accumulation of MUL1 protein and enhanced mitophagy (Ambivero et al., 2014; Cilenti et al., 2014). Our recent studies, using cell lines lacking MUL1 expression, identified a new function of MUL1 in the regulation of metabolism (Cilenti et al., 2022). In the present study, we used mice with whole-body Mul1 inactivation, to investigate the function of this ubiquitin ligase in mitophagy and the regulation of lipid metabolism and obesity. Mul1(−/−) animals show dysregulated mitophagy with an accumulation of p62, reduced conversion of LC3 II, and increased levels of ROS. Furthermore, Mul1(−/−) mice exhibit altered metabolism, characterized by increased energy expenditure and oxygen consumption. When subjected to HFD these mice display resistance to HFD-induced obesity, along with associated conditions such as liver steatosis, insulin insensitivity, and glucose intolerance. Metabolomic and lipidomic analyses reveal significant changes in lipid metabolism resulting from Mul1 inactivation during HFD. Monounsaturated and polyunsaturated fatty acids, triglycerides, lipid droplets, and lipid storage, as integrated pathways, were downregulated in Mul1(−/−) HFD-liver. Furthermore, mRNA sequencing identified several clusters of genes involved in fatty acid oxidation and lipogenesis to be differentially expressed. One of the top genes, whose mRNA expression was significantly downregulated in the absence of MUL1, was SCD1. SCD1 protein is located in the endoplasmic reticulum (ER) where it catalyzes the biosynthesis of monounsaturated fatty acids (MUFA) from palmitate and stearate, their saturated fatty acids (SFA) precursors (Ntambi et al., 2002; Liu et al., 2013; Piccinin et al., 2019). A plethora of previous studies have established SCD1 as a key regulator in lipid metabolism; high expression of SCD1 protein correlates with obesity, diabetes, and atherosclerosis, while inactivation of the Scd1 gene supports an HFD-resistant phenotype, reduced fat accumulation, and insulin sensitivity (Ntambi et al., 2002; Flowers et al., 2007; Dobrzyn et al., 2008; Liu et al., 2010). In Mul1(−/−) mice the SCD1 protein expression in adipose tissue and liver is markedly downregulated particularly during HFD conditions. In addition, mice with Scd1 inactivation have a phenotype that closely resembles the one of Mul1(−/−) animals (Flowers et al., 2007; AM et al., 2017). Since, Mul1(−/−) animals have increased β-oxidation and reduced lipogenesis, we monitored the expression of other key enzymes involved in these processes. We found that MUL1 deficiency activates AMPK by increasing its phosphorylation (pAMPK), which in turn drives a cascade of reactions involved in cellular energy homeostasis. pAMPK promotes the expression and accumulation of its downstream target CPT1, which is in the OMM, and facilitates the import of fatty acids to drive β-oxidation (Dobrzyn et al., 2004). Furthermore, activation of pAMPK in the liver of Mul1(−/−) mice leads to the downregulation ACC1 and FASN, enzymes involved in fatty acid synthesis. Figure 8 is a schematic diagram of the proposed pathway that is affected in the absence of MUL1, and the various proteins involved. The deregulation of these proteins during conditions of HFD in Mul1(−/−) mice supports a lean phenotype, robust resistance to HFD-induced obesity and metabolic syndrome. It is interesting to note that the absence of MUL1 function does not affect the expression of all these proteins in the liver of animals fed a ND, but it has a dramatic effect in reducing their expression or induction that coincides with HFD. Our data also suggest that MUL1 overexpression is associated with HFD and is involved in lipogenesis, fatty acid synthesis, and obesity. There are several other proteins regulated in the liver of Mul1(−/−) mice on HFD, that could potentially play additional roles in the metabolic phenotype of the Mul1(−/−) animals. Our mRNA sequencing identified a group of genes whose expression is upregulated in the absence of Mul1. These genes represent subunits of Complex I of the electron transport chain (ETC.). Complex I have additional roles in ROS formation and lipid metabolism (Vazquez et al., 2015; Kuznetsov et al., 2022). Among the upregulated Complex I subunits were NDUFAB1, NDUFS6, and NDUFS4. Previous studies have shown that overexpression of either of these genes can regulate lipogenesis and provide resistance to HFD-induced obesity (Zhang et al., 2019; Adjobo-Hermans et al., 2020; Choi et al., 2022). The biological function of MUL1 in mitochondrial dynamics and more specifically in mitophagy has been often compared with that of Parkin. Both MUL1 and Parkin are E3 ubiquitin ligases, MUL1 is mito-resident whereas Parkin is mito-recruited (Ambivero et al., 2014; Yun et al., 2014; Puri et al., 2019). Several reports have shown, that depending on the context, MUL1 can work in parallel or synergy, independent or opposite, to Parkin’s function in the mitophagy pathway (Yun et al., 2014; Rojansky et al., 2016; Puri et al., 2019; Igarashi et al., 2020). It is becoming apparent that mitochondrial dysfunction is involved in obesity, and we expect key regulators of mitochondrial dynamics and mitophagy, such as MUL1 and Parkin, to be implicated in the process. Our study reveals that the functional similarities observed between MUL1 and Parkin function in mitophagy extend to their roles in regulating adiposity. Previous research has demonstrated that inactivation of Parkin in the adipose tissue can mitigate HFD-induced obesity and aged-related adiposity in mice (Cui et al., 2018; Moore et al., 2022). Our findings show that the absence of Mul1 promotes a lean phenotype through a mechanism distinct from that of Parkin and does not involve the activation of PGC1α. Furthermore, in HFD studies, the impact of Parkin deletion was evident only in male animals (Moore et al., 2022) whereas the deletion of Mul1 resulted in a robust lean phenotype in both male and female mice. These observations support the idea that Mul1 and Parkin have district non-overlapping functions in regulating lipogenesis and mitochondrial metabolism in the context of diet overload.
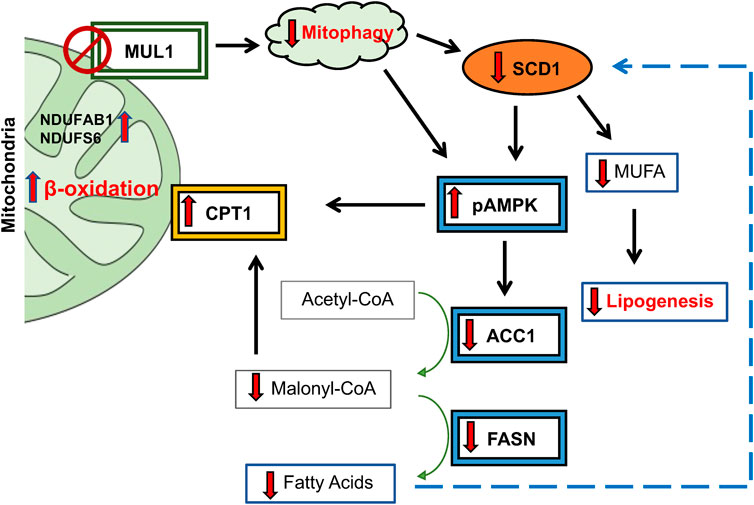
Figure 8. Schematic diagram of proposed lipogenic pathway regulated by MUL1 during conditions of HFD. MUL1 inactivation in mice impairs mitophagy and affects lipogenesis, fatty acid synthesis, and energy expenditure (β-oxidation) during dietary overload. Mul1(−/−) mice on HFD have decreased expression of SCD1 and activation of phosphorylated-AMPK (pAMPK) which in turn downregulates the protein level of ACC1 and FASN enzymes. Additionally, pAMPK1 increases the expression of CPT1 in the OMM that is involved in the transport of fatty acids into the mitochondria for β-oxidation. CPT1 expression increased and is further regulated by the downregulation of malonyl-CoA. Low levels of malonyl-CoA and reduction in FASN protein invariably inhibit the synthesis of fatty acids. In addition, the downregulation of SCD1 decreases the production of monounsaturated fatty acids (MUFA) and reduces lipogenesis. Furthermore, increased expression of NDUFAB1 and NDUFS6 promotes the activity of complex I of ETC., and enhances mitochondrial metabolism.
In conclusion, this study establishes MUL1 as a key player in the regulation of lipogenesis and fatty acid oxidation, particularly during conditions of HFD. It proposes MUL1 as a promising target for the development of chemical inhibitors or therapeutic siRNAs to combat obesity and associated metabolic diseases.
Data availability statement
The mRNA sequence data presented in this study are deposited in the GEO repository, accession number GSE263865. The metabolomics data presented in this study are deposited at the National Metabolomics Data Repository (NMDR) and can be accessed via this link: http://dev.metabolomicsworkbench.org:22222/data/DRCCMetadata.php?Mode=Study&StudyID=ST003175&Access=FkjD8817.
Ethics statement
The animal study was approved by the University of Central Florida/IACUC. The study was conducted in accordance with the local legislation and institutional requirements.
Author contributions
LC: Conceptualization, Data curation, Formal Analysis, Funding acquisition, Investigation, Methodology, Project administration, Resources, Software, Supervision, Validation, Visualization, Writing–original draft. JDG: Formal Analysis, Investigation, Methodology, Software, Writing–review and editing. RM: Formal Analysis, Investigation, Methodology, Writing–review and editing. FL: Formal Analysis, Methodology, Writing–review and editing. CTA: Conceptualization, Formal Analysis, Writing–review and editing. MP: Project administration, Supervision, Visualization, Writing–review and editing. MM: Investigation, Project administration, Writing–review and editing. ASZ: Conceptualization, Data curation, Formal Analysis, Funding acquisition, Investigation, Methodology, Project administration, Resources, Software, Supervision, Validation, Visualization, Writing–original draft, Writing–review and editing.
Funding
The author(s) declare financial support was received for the research, authorship, and/or publication of this article. Funding for this work was provided by the Burnett School of Biomedical Science and the UCF College of Medicine to ASZ. MEM acknowledges the support of NIH R01-DK132254. JDG was supported by Fondazione Umberto Veronesi (Italy).
Acknowledgments
We thank Danny Skaf and Thomas Andl for their comments and critical reading of the manuscript. We are grateful to Edilu Becerra for her expert assistance with animal procedures.
Conflict of interest
The authors declare that the research was conducted in the absence of any commercial or financial relationships that could be construed as a potential conflict of interest.
The author(s) declared that they were an editorial board member of Frontiers, at the time of submission. This had no impact on the peer review process and the final decision.
Publisher’s note
All claims expressed in this article are solely those of the authors and do not necessarily represent those of their affiliated organizations, or those of the publisher, the editors and the reviewers. Any product that may be evaluated in this article, or claim that may be made by its manufacturer, is not guaranteed or endorsed by the publisher.
Supplementary material
The Supplementary Material for this article can be found online at: https://www.frontiersin.org/articles/10.3389/fmolb.2024.1397565/full#supplementary-material
References
Abu Shelbayeh, O., Arroum, T., Morris, S., and Busch, K. B. (2023). PGC-1α is a master regulator of mitochondrial lifecycle and ROS stress response. Antioxidants (Basel) 12, 1075. doi:10.3390/antiox12051075
Adjobo-Hermans, M. J. W., De Haas, R., Willems, P., Wojtala, A., Van Emst-De Vries, S. E., Wagenaars, J. A., et al. (2020). NDUFS4 deletion triggers loss of NDUFA12 in Ndufs4(-/-) mice and Leigh syndrome patients: a stabilizing role for NDUFAF2. Biochim. Biophys. Acta Bioenerg. 1861, 148213. doi:10.1016/j.bbabio.2020.148213
Am, A. L., Syed, D. N., and Ntambi, J. M. (2017). Insights into stearoyl-CoA desaturase-1 regulation of systemic metabolism. Trends Endocrinol. Metab. 28, 831–842. doi:10.1016/j.tem.2017.10.003
Ambivero, C. T., Cilenti, L., Main, S., and Zervos, A. S. (2014). Mulan E3 ubiquitin ligase interacts with multiple E2 conjugating enzymes and participates in mitophagy by recruiting GABARAP. Cell Signal 26, 2921–2929. doi:10.1016/j.cellsig.2014.09.004
Barry, R., John, S. W., Liccardi, G., Tenev, T., Jaco, I., Chen, C. H., et al. (2018). SUMO-mediated regulation of NLRP3 modulates inflammasome activity. Nat. Commun. 9, 3001. doi:10.1038/s41467-018-05321-2
Braschi, E., Zunino, R., and Mcbride, H. M. (2009). MAPL is a new mitochondrial SUMO E3 ligase that regulates mitochondrial fission. EMBO Rep. 10, 748–754. doi:10.1038/embor.2009.86
Calle, X., Garrido-Moreno, V., Lopez-Gallardo, E., Norambuena-Soto, I., Martinez, D., Penaloza-Otarola, A., et al. (2022). Mitochondrial E3 ubiquitin ligase 1 (MUL1) as a novel therapeutic target for diseases associated with mitochondrial dysfunction. IUBMB Life 74, 850–865. doi:10.1002/iub.2657
Chean, J., Chen, C. J., Gugiu, G., Wong, P., Cha, S., Li, H., et al. (2021). Human CEACAM1-LF regulates lipid storage in HepG2 cells via fatty acid transporter CD36. J. Biol. Chem. 297, 101311. doi:10.1016/j.jbc.2021.101311
Chen, Y., Lun, A. T., and Smyth, G. K. (2016). From reads to genes to pathways: differential expression analysis of RNA-Seq experiments using Rsubread and the edgeR quasi-likelihood pipeline. F1000Res 5, 1438. doi:10.12688/f1000research.8987.2
Choi, K. M., Ryan, K. K., and Yoon, J. C. (2022). Adipose mitochondrial complex I deficiency modulates inflammation and glucose homeostasis in a sex-dependent manner. Endocrinology 163, bqac018. doi:10.1210/endocr/bqac018
Chong, J., Wishart, D. S., and Xia, J. (2019). Using MetaboAnalyst 4.0 for comprehensive and integrative metabolomics data analysis. Curr. Protoc. Bioinforma. 68, e86. doi:10.1002/cpbi.86
Cilenti, L., Ambivero, C. T., Ward, N., Alnemri, E. S., Germain, D., and Zervos, A. S. (2014). Inactivation of Omi/HtrA2 protease leads to the deregulation of mitochondrial Mulan E3 ubiquitin ligase and increased mitophagy. Biochim. Biophys. Acta 1843, 1295–1307. doi:10.1016/j.bbamcr.2014.03.027
Cilenti, L., Di Gregorio, J., Ambivero, C. T., Andl, T., Liao, R., and Zervos, A. S. (2020). Mitochondrial MUL1 E3 ubiquitin ligase regulates Hypoxia Inducible Factor (HIF-1α) and metabolic reprogramming by modulating the UBXN7 cofactor protein. Sci. Rep. 10, 1609. doi:10.1038/s41598-020-58484-8
Cilenti, L., Mahar, R., Di Gregorio, J., Ambivero, C. T., Merritt, M. E., and Zervos, A. S. (2022). Regulation of metabolism by mitochondrial MUL1 E3 ubiquitin ligase. Front. Cell Dev. Biol. 10, 904728. doi:10.3389/fcell.2022.904728
Corrigan, J. K., Ramachandran, D., He, Y., Palmer, C. J., Jurczak, M. J., Chen, R., et al. (2020). A big-data approach to understanding metabolic rate and response to obesity in laboratory mice. Elife 9, e53560. doi:10.7554/eLife.53560
Cui, C., Chen, S., Qiao, J., Qing, L., Wang, L., He, T., et al. (2018). PINK1-Parkin alleviates metabolic stress induced by obesity in adipose tissue and in 3T3-L1 preadipocytes. Biochem. Biophys. Res. Commun. 498, 445–452. doi:10.1016/j.bbrc.2018.02.199
Devin, A., and Rigoulet, M. (2007). Mechanisms of mitochondrial response to variations in energy demand in eukaryotic cells. Am. J. Physiol. Cell Physiol. 292, C52–C58. doi:10.1152/ajpcell.00208.2006
Di Gregorio, J., Cilenti, L., Ambivero, C. T., Andl, T., Liao, R., and Zervos, A. S. (2021). UBXN7 cofactor of CRL3KEAP1 and CRL2VHL ubiquitin ligase complexes mediates reciprocal regulation of NRF2 and HIF-1α proteins. Biochim. Biophys. Acta Mol. Cell Res. 1868, 118963. doi:10.1016/j.bbamcr.2021.118963
Dobrzyn, P., Dobrzyn, A., Miyazaki, M., Cohen, P., Asilmaz, E., Hardie, D. G., et al. (2004). Stearoyl-CoA desaturase 1 deficiency increases fatty acid oxidation by activating AMP-activated protein kinase in liver. Proc. Natl. Acad. Sci. U. S. A. 101, 6409–6414. doi:10.1073/pnas.0401627101
Dobrzyn, P., Sampath, H., Dobrzyn, A., Miyazaki, M., and Ntambi, J. M. (2008). Loss of stearoyl-CoA desaturase 1 inhibits fatty acid oxidation and increases glucose utilization in the heart. Am. J. Physiol. Endocrinol. Metab. 294, E357–E364. doi:10.1152/ajpendo.00471.2007
Doiron, K., Goyon, V., Coyaud, E., Rajapakse, S., Raught, B., and Mcbride, H. M. (2017). The dynamic interacting landscape of MAPL reveals essential functions for SUMOylation in innate immunity. Sci. Rep. 7, 107. doi:10.1038/s41598-017-00151-6
Dragos, S. M., Bergeron, K. F., Desmarais, F., Suitor, K., Wright, D. C., Mounier, C., et al. (2017). Reduced SCD1 activity alters markers of fatty acid reesterification, glyceroneogenesis, and lipolysis in murine white adipose tissue and 3T3-L1 adipocytes. Am. J. Physiol. Cell Physiol. 313, C295–C304. doi:10.1152/ajpcell.00097.2017
Eynaudi, A., Diaz-Castro, F., Borquez, J. C., Bravo-Sagua, R., Parra, V., and Troncoso, R. (2021). Differential effects of oleic and palmitic acids on lipid droplet-mitochondria interaction in the hepatic cell line HepG2. Front. Nutr. 8, 775382. doi:10.3389/fnut.2021.775382
Faccio, L., Fusco, C., Chen, A., Martinotti, S., Bonventre, J. V., and Zervos, A. S. (2000). Characterization of a novel human serine protease that has extensive homology to bacterial heat shock endoprotease HtrA and is regulated by kidney ischemia. J. Biol. Chem. 275, 2581–2588. doi:10.1074/jbc.275.4.2581
Flowers, J. B., Rabaglia, M. E., Schueler, K. L., Flowers, M. T., Lan, H., Keller, M. P., et al. (2007). Loss of stearoyl-CoA desaturase-1 improves insulin sensitivity in lean mice but worsens diabetes in leptin-deficient obese mice. Diabetes 56, 1228–1239. doi:10.2337/db06-1142
Gervois, P., Torra, I. P., Fruchart, J. C., and Staels, B. (2000). Regulation of lipid and lipoprotein metabolism by PPAR activators. Clin. Chem. Lab. Med. 38, 3–11. doi:10.1515/CCLM.2000.002
Goyon, V., Besse-Patin, A., Zunino, R., Ignatenko, O., Nguyen, M., Coyaud, E., et al. (2023). MAPL loss dysregulates bile and liver metabolism in mice. EMBO Rep. 24, e57972. doi:10.15252/embr.202357972
Grunig, D., Duthaler, U., and Krahenbuhl, S. (2018). Effect of toxicants on fatty acid metabolism in HepG2 cells. Front. Pharmacol. 9, 257. doi:10.3389/fphar.2018.00257
Igarashi, R., Yamashita, S. I., Yamashita, T., Inoue, K., Fukuda, T., Fukuchi, T., et al. (2020). Gemcitabine induces Parkin-independent mitophagy through mitochondrial-resident E3 ligase MUL1-mediated stabilization of PINK1. Sci. Rep. 10, 1465. doi:10.1038/s41598-020-58315-w
Jenkins, K., Khoo, J. J., Sadler, A., Piganis, R., Wang, D., Borg, N. A., et al. (2013). Mitochondrially localised MUL1 is a novel modulator of antiviral signaling. Immunol. Cell Biol. 91, 321–330. doi:10.1038/icb.2013.7
Jin, Z., Wei, W., Yang, M., Du, Y., and Wan, Y. (2014). Mitochondrial complex I activity suppresses inflammation and enhances bone resorption by shifting macrophage-osteoclast polarization. Cell Metab. 20, 483–498. doi:10.1016/j.cmet.2014.07.011
Johnson, D. H., Narayan, S., Wilson, D. L., and Flask, C. A. (2012). Body composition analysis of obesity and hepatic steatosis in mice by relaxation compensated fat fraction (RCFF) MRI. J. Magn. Reson Imaging 35, 837–843. doi:10.1002/jmri.23508
Jung, J. H., Bae, S., Lee, J. Y., Woo, S. R., Cha, H. J., Yoon, Y., et al. (2011). E3 ubiquitin ligase Hades negatively regulates the exonuclear function of p53. Cell death Differ. 18, 1865–1875. doi:10.1038/cdd.2011.57
Kauffman, M. E., Kauffman, M. K., Traore, K., Zhu, H., Trush, M. A., Jia, Z., et al. (2016). MitoSOX-based flow cytometry for detecting mitochondrial ROS. React. Oxyg. Species (Apex) 2, 361–370. doi:10.20455/ros.2016.865
Kim, S. Y., Kim, H. J., Byeon, H. K., Kim, D. H., and Kim, C. H. (2017). FOXO3 induces ubiquitylation of AKT through MUL1 regulation. Oncotarget 8, 110474–110489. doi:10.18632/oncotarget.22793
Kim, S. Y., Kim, H. J., Kim, H. J., Kim, D. H., Han, J. H., Byeon, H. K., et al. (2018). HSPA5 negatively regulates lysosomal activity through ubiquitination of MUL1 in head and neck cancer. Autophagy 14, 385–403. doi:10.1080/15548627.2017.1414126
Koelmel, J. P., Kroeger, N. M., Ulmer, C. Z., Bowden, J. A., Patterson, R. E., Cochran, J. A., et al. (2017). LipidMatch: an automated workflow for rule-based lipid identification using untargeted high-resolution tandem mass spectrometry data. BMC Bioinforma. 18, 331. doi:10.1186/s12859-017-1744-3
Kuznetsov, A. V., Margreiter, R., Ausserlechner, M. J., and Hagenbuchner, J. (2022). The complex interplay between mitochondria, ROS and entire cellular metabolism. Antioxidants (Basel) 11, 1995. doi:10.3390/antiox11101995
Li, W., Bengtson, M. H., Ulbrich, A., Matsuda, A., Reddy, V. A., Orth, A., et al. (2008). Genome-wide and functional annotation of human E3 ubiquitin ligases identifies MULAN, a mitochondrial E3 that regulates the organelle's dynamics and signaling. PloS one 3, e1487. doi:10.1371/journal.pone.0001487
Liu, J., Cinar, R., Xiong, K., Godlewski, G., Jourdan, T., Lin, Y., et al. (2013). Monounsaturated fatty acids generated via stearoyl CoA desaturase-1 are endogenous inhibitors of fatty acid amide hydrolase. Proc. Natl. Acad. Sci. U. S. A. 110, 18832–18837. doi:10.1073/pnas.1309469110
Liu, X., Miyazaki, M., Flowers, M. T., Sampath, H., Zhao, M., Chu, K., et al. (2010). Loss of Stearoyl-CoA desaturase-1 attenuates adipocyte inflammation: effects of adipocyte-derived oleate. Arterioscler. Thromb. Vasc. Biol. 30, 31–38. doi:10.1161/ATVBAHA.109.195636
Mao, J., Demayo, F. J., Li, H., Abu-Elheiga, L., Gu, Z., Shaikenov, T. E., et al. (2006). Liver-specific deletion of acetyl-CoA carboxylase 1 reduces hepatic triglyceride accumulation without affecting glucose homeostasis. Proc. Natl. Acad. Sci. U. S. A. 103, 8552–8557. doi:10.1073/pnas.0603115103
Mehlem, A., Hagberg, C. E., Muhl, L., Eriksson, U., and Falkevall, A. (2013). Imaging of neutral lipids by oil red O for analyzing the metabolic status in health and disease. Nat. Protoc. 8, 1149–1154. doi:10.1038/nprot.2013.055
Mina, A. I., Leclair, R. A., Leclair, K. B., Cohen, D. E., Lantier, L., and Banks, A. S. (2018). CalR: a web-based analysis tool for indirect calorimetry experiments. Cell Metab. 28, 656–666. doi:10.1016/j.cmet.2018.06.019
Molenaar, M. R., Jeucken, A., Wassenaar, T. A., Van De Lest, C. H. A., Brouwers, J. F., and Helms, J. B. (2019). LION/web: a web-based ontology enrichment tool for lipidomic data analysis. Gigascience 8, giz061. doi:10.1093/gigascience/giz061
Moore, T. M., Cheng, L., Wolf, D. M., Ngo, J., Segawa, M., Zhu, X., et al. (2022). Parkin regulates adiposity by coordinating mitophagy with mitochondrial biogenesis in white adipocytes. Nat. Commun. 13, 6661. doi:10.1038/s41467-022-34468-2
Ni, G., Konno, H., and Barber, G. N. (2017). Ubiquitination of STING at lysine 224 controls IRF3 activation. Sci. Immunol. 2, eaah7119. doi:10.1126/sciimmunol.aah7119
Ntambi, J. M., Miyazaki, M., Stoehr, J. P., Lan, H., Kendziorski, C. M., Yandell, B. S., et al. (2002). Loss of stearoyl-CoA desaturase-1 function protects mice against adiposity. Proc. Natl. Acad. Sci. U. S. A. 99, 11482–11486. doi:10.1073/pnas.132384699
Piccinin, E., Cariello, M., De Santis, S., Ducheix, S., Sabba, C., Ntambi, J. M., et al. (2019). Role of oleic acid in the gut-liver Axis: from diet to the regulation of its synthesis via stearoyl-CoA desaturase 1 (SCD1). Nutrients 11, 2283. doi:10.3390/nu11102283
Prudent, J., Zunino, R., Sugiura, A., Mattie, S., Shore, G. C., and Mcbride, H. M. (2015). MAPL SUMOylation of Drp1 stabilizes an ER/mitochondrial platform required for cell death. Mol. Cell 59, 941–955. doi:10.1016/j.molcel.2015.08.001
Puri, R., Cheng, X. T., Lin, M. Y., Huang, N., and Sheng, Z. H. (2019). Mul1 restrains Parkin-mediated mitophagy in mature neurons by maintaining ER-mitochondrial contacts. Nat. Commun. 10, 3645. doi:10.1038/s41467-019-11636-5
Puri, R., Cheng, X. T., Lin, M. Y., Huang, N., and Sheng, Z. H. (2020). Defending stressed mitochondria: uncovering the role of MUL1 in suppressing neuronal mitophagy. Autophagy 16, 176–178. doi:10.1080/15548627.2019.1687216
Ralston, J. C., Metherel, A. H., Stark, K. D., and Mutch, D. M. (2016). SCD1 mediates the influence of exogenous saturated and monounsaturated fatty acids in adipocytes: effects on cellular stress, inflammatory markers and fatty acid elongation. J. Nutr. Biochem. 27, 241–248. doi:10.1016/j.jnutbio.2015.09.011
Ran, F. A., Hsu, P. D., Wright, J., Agarwala, V., Scott, D. A., and Zhang, F. (2013). Genome engineering using the CRISPR-Cas9 system. Nat. Protoc. 8, 2281–2308. doi:10.1038/nprot.2013.143
Rodriguez-Enriquez, S., Kai, Y., Maldonado, E., Currin, R. T., and Lemasters, J. J. (2009). Roles of mitophagy and the mitochondrial permeability transition in remodeling of cultured rat hepatocytes. Autophagy 5, 1099–1106. doi:10.4161/auto.5.8.9825
Rodriguez-Enriquez, S., Kim, I., Currin, R. T., and Lemasters, J. J. (2006). Tracker dyes to probe mitochondrial autophagy (mitophagy) in rat hepatocytes. Autophagy 2, 39–46. doi:10.4161/auto.2229
Rojansky, R., Cha, M. Y., and Chan, D. C. (2016). Elimination of paternal mitochondria in mouse embryos occurs through autophagic degradation dependent on PARKIN and MUL1. Elife 5, e17896. doi:10.7554/eLife.17896
Scorrano, L., and Liu, D. (2009). The SUMO arena goes mitochondrial with MAPL. EMBO Rep. 10, 694–696. doi:10.1038/embor.2009.141
Spinelli, J. B., and Haigis, M. C. (2018). The multifaceted contributions of mitochondria to cellular metabolism. Nat. Cell Biol. 20, 745–754. doi:10.1038/s41556-018-0124-1
Takamura, T., Misu, H., Matsuzawa-Nagata, N., Sakurai, M., Ota, T., Shimizu, A., et al. (2008). Obesity upregulates genes involved in oxidative phosphorylation in livers of diabetic patients. Obes. (Silver Spring) 16, 2601–2609. doi:10.1038/oby.2008.419
Tang, F., Wang, B., Li, N., Wu, Y., Jia, J., Suo, T., et al. (2011). RNF185, a novel mitochondrial ubiquitin E3 ligase, regulates autophagy through interaction with BNIP1. PloS one 6, e24367. doi:10.1371/journal.pone.0024367
Vazquez, E. J., Berthiaume, J. M., Kamath, V., Achike, O., Buchanan, E., Montano, M. M., et al. (2015). Mitochondrial complex I defect and increased fatty acid oxidation enhance protein lysine acetylation in the diabetic heart. Cardiovasc Res. 107, 453–465. doi:10.1093/cvr/cvv183
Wakil, S. J., and Abu-Elheiga, L. A. (2009). Fatty acid metabolism: target for metabolic syndrome. J. Lipid Res. 50 (Suppl. l), S138–S143. doi:10.1194/jlr.R800079-JLR200
Weiss-Hersh, K., Garcia, A. L., Marosvolgyi, T., Szklenar, M., Decsi, T., and Ruhl, R. (2020). Saturated and monounsaturated fatty acids in membranes are determined by the gene expression of their metabolizing enzymes SCD1 and ELOVL6 regulated by the intake of dietary fat. Eur. J. Nutr. 59, 2759–2769. doi:10.1007/s00394-019-02121-2
Yoboue, E. D., Mougeolle, A., Kaiser, L., Averet, N., Rigoulet, M., and Devin, A. (2014). The role of mitochondrial biogenesis and ROS in the control of energy supply in proliferating cells. Biochim. Biophys. Acta 1837, 1093–1098. doi:10.1016/j.bbabio.2014.02.023
Yun, J., Puri, R., Yang, H., Lizzio, M. A., Wu, C., Sheng, Z. H., et al. (2014). MUL1 acts in parallel to the PINK1/parkin pathway in regulating mitofusin and compensates for loss of PINK1/parkin. Elife 3, e01958. doi:10.7554/eLife.01958
Zhang, B., Huang, J., Li, H. L., Liu, T., Wang, Y. Y., Waterman, P., et al. (2008). GIDE is a mitochondrial E3 ubiquitin ligase that induces apoptosis and slows growth. Cell Res. 18, 900–910. doi:10.1038/cr.2008.75
Keywords: MUL1, SCD1, lipogenesis, obesity, mitophagy
Citation: Cilenti L, Di Gregorio J, Mahar R, Liu F, Ambivero CT, Periasamy M, Merritt ME and Zervos AS (2024) Inactivation of mitochondrial MUL1 E3 ubiquitin ligase deregulates mitophagy and prevents diet-induced obesity in mice. Front. Mol. Biosci. 11:1397565. doi: 10.3389/fmolb.2024.1397565
Received: 07 March 2024; Accepted: 05 April 2024;
Published: 25 April 2024.
Edited by:
Marie-Pierre Golinelli, UPR2301 Institut de Chimie des Substances Naturelles (ICSN CNRS), FranceReviewed by:
Virginia Actis Dato, University of California San Diego, United StatesJoris Mallard, Institut de Cancérologie Strasbourg Europe, France
Copyright © 2024 Cilenti, Di Gregorio, Mahar, Liu, Ambivero, Periasamy, Merritt and Zervos. This is an open-access article distributed under the terms of the Creative Commons Attribution License (CC BY). The use, distribution or reproduction in other forums is permitted, provided the original author(s) and the copyright owner(s) are credited and that the original publication in this journal is cited, in accordance with accepted academic practice. No use, distribution or reproduction is permitted which does not comply with these terms.
*Correspondence: Antonis S. Zervos, YW50b25pcy56ZXJ2b3NAdWNmLmVkdQ==
†Present address: Jacopo Di Gregorio, Department of Biotechnological and Applied Clinical Sciences, University of L'Aquila, L'Aquila, Italy