 Lian Duan
 Mahshad Hashemi
 Alioune Ngom
 Luis Rueda
- School of Computer Science, University of Windsor, Windsor, ON, Canada
Graph Neural Networks (GNNs) have emerged as powerful tools for analyzing structured data, particularly in domains where relationships and interactions between entities are key. By leveraging the inherent graph structure in datasets, GNNs excel in capturing complex dependencies and patterns that traditional neural networks might miss. This advantage is especially pronounced in the field of computational biology, where the intricate connections between biological entities play a crucial role. In this context, Our work explores the application of GNNs to single-cell RNA sequencing (scRNA-seq) data, a domain characterized by complex and heterogeneous relationships. By extracting ligand-receptor (L-R) associations from LIANA and constructing Cell-Cell association networks with varying edge homophily ratios, based on L-R information, we enhance the biological relevance and accuracy of depicting cellular communication pathways. While standard GNN models like Graph Convolutional Networks (GCN), GraphSAGE, Graph Attention Networks (GAT), and MixHop often assume homophily (similar nodes are more likely to be connected), this assumption does not always hold in biological networks. To address this, we explore advanced graph neural network methods, such as
1 Introduction
In the rapidly evolving field of computational biology, the integration of Graph Neural Networks (GNNs) with single-cell RNA sequencing (scRNA-seq) data heralds a significant leap forward. scRNA-seq, known for its unparalleled ability to illuminate cellular distinctions and tissue compositions, faces considerable computational hurdles due to its intrinsic complexity and heterogeneity. Traditional GNN architectures like Graph Convolutional Networks (GCN) introduced by Kipf and Welling (Kipf and Welling, 2016), Graph Attention Networks (GAT) (Veličković et al., 2018), GraphSAGE developed by Hamilton et al. (Ying et al., 2017), and MixHop, introduced by Abu-El-Haija et al. (Abu-El-Haija et al., 2019), have demonstrated their utility across various domains by harnessing network structural information and individual node characteristics. However, these models predominantly assume homophily—the tendency for similar nodes to be more closely connected—an assumption that does not always hold in the diverse and intricate biological networks characterized by both homophilic and heterophilic relationships. The foundational GCN model, as proposed by (Kipf and Welling, 2016), excels under the homophily assumption, where like nodes are more likely to be connected. Yet, this premise may falter in the realm of biological networks, where interactions frequently occur between dissimilar entities, underscoring the necessity for models adept at managing heterophily. Addressing this gap, Hamilton et al. (Ying et al., 2017) extended GCNs with GraphSAGE, introducing an inductive learning framework that enhances adaptability to dynamic or evolving networks, a critical feature for biological systems where new cellular states or types continually emerge. Recent advancements have led to the development of more specialized GNNs to navigate the nuanced landscape of biological data.
This study systematically applies and juxtaposes these models across a spectrum of scRNA-seq datasets, utilizing biologically informed interaction graphs constructed with LIANA (LIgand-receptor ANalysis frAmework) (Türei et al., 2022). LIANA (Türei et al., 2022) provides a framework for inferring Cell-Cell Communication (CCC) pathways by identifying ligand-receptor (L-R) interactions based on scRNA-seq data. By integrating multiple established methods, LIANA (Türei et al., 2022) generates a cell-cell adjacency graph where nodes represent individual cells, and edges signify potential communication pathways based on L-R signaling. This approach allows us to construct interaction networks that more accurately reflect the underlying biology, setting the stage for a meaningful application of advanced GNNs. Through this endeavor, we aspire to illuminate the strengths and limitations inherent in each model within the context of computational biology, thereby furnishing valuable insights into their practical applicability and steering future research directions in the field. This exhaustive analysis stands to make a substantial contribution to our understanding of cellular functionalities and interactions, leveraging the sophisticated methodologies of advanced GNNs alongside interaction networks inferred through LIANA (Türei et al., 2022).
1.1 Homophily and heterophily
Homophily and heterophily are concepts in network theory and graph analysis that describe the trends of edges in a graph to connect nodes with similar or dissimilar attributes, respectively. Formally, consider an undirected graph
Edge homophily quantifies the propensity of edges to connect nodes that share similar attributes or labels. Mathematically, homophily can be measured using the homophily ratio
In Equation 1,
Both homophily and heterophily are intrinsic properties of the edges in a graph, as they directly relate to the nature of connections between node pairs. These concepts are critical in various graph-based machine learning tasks, such as node classification, link prediction, and community detection. We visualized graphs to illustrate homophily using Gephi (Bastian and Gephi, 2009) shown in Figure 1. In the context of GNN, the degree of homophily or heterophily influences the effectiveness of message-passing mechanisms. For instance, in heterophilic graphs, aggregating features from diverse neighbors may necessitate more sophisticated aggregation functions or attention mechanisms to capture the dissimilarity effectively.
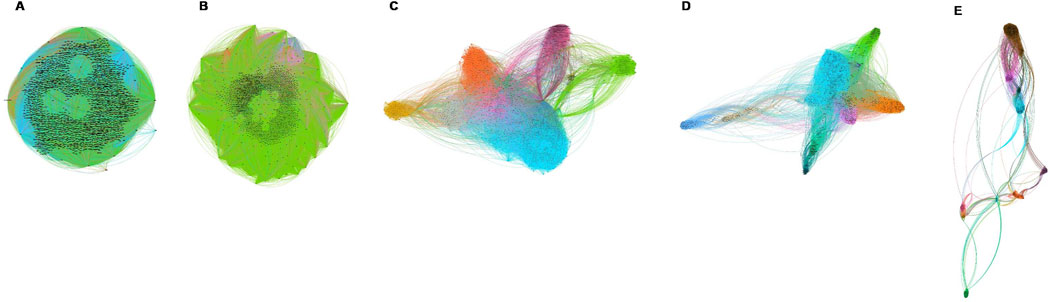
Figure 1. Visualization of the constructed graphs with five
1.2 Heterophily-aware methods
Heterophily-aware methods are specialized algorithms within the domain of graph-based machine learning that are explicitly designed to effectively handle graphs exhibiting heterophily. Unlike traditional GNNs that aggregate information primarily from neighboring nodes
Several advanced heterophily-aware methods have been proposed to enhance GNN performance on heterophilic graphs.
1.2.1 H2GCN
Ego- and Neighbor-Embedding Separation: This design keeps a node’s embedding distinct from its neighbors’ embeddings, avoiding oversmoothing in heterophily. Formally, for each node
where
Higher-Order Neighborhoods: To capture both local and global graph structures,
where
Combination of Intermediate Representations:
where
Finally, the classification stage uses the final embedding for prediction:
where
1.2.2 GBK-GNN
GBK-GNN (Du et al., 2022) introduces a sophisticated mechanism that combines gating and bi-kernel approaches to effectively model both homophilic and heterophilic relationships within a graph. The model incorporates two main innovations: bi-kernel feature transformation and a kernel selection gate mechanism.
The bi-kernel transformation uses two distinct kernels: one for modeling homophily
where
and
The overall loss function combines the standard classification loss
where
2 Materials and methods
2.1 Datasets
The scRNA-seq data used in this study are publicly available on Gene Expression Omnibus (GEO) with accession number of GSE84133. This dataset includes six subsets of pancreatic islets sampled from four human donors and two mice strains. The sequencing method invoked in the dataset is inDrop, a droplet-based scRNA-seq that is capable of determining the transcriptomes of over 12,000 individual pancreatic cells (Baron et al., 2016). Table 1 shows the details of dataset such as the accession number, the type of tissue sample, the number of cells, the number of genes, and the number of assigned cell types for analysis. Each dataset underwent a rigorous preprocessing pipeline, including gene filtering, normalization, and feature selection. Specifically, we retained the top 2,000 highly variable genes (HVGs) from the original count matrices to capture the most biologically informative features while reducing noise and computational complexity. The selection of 2,000 HVGs ensures that downstream models receive input features that reflect key transcriptomic variations across cells while avoiding redundancy from low-expression genes. Additionally, preprocessing steps such as removing genes expressed in fewer than 20 cells and normalizing count distributions were applied to maintain data integrity. These decisions were guided by best practices in single-cell analysis to maximize signal while ensuring computational feasibility.
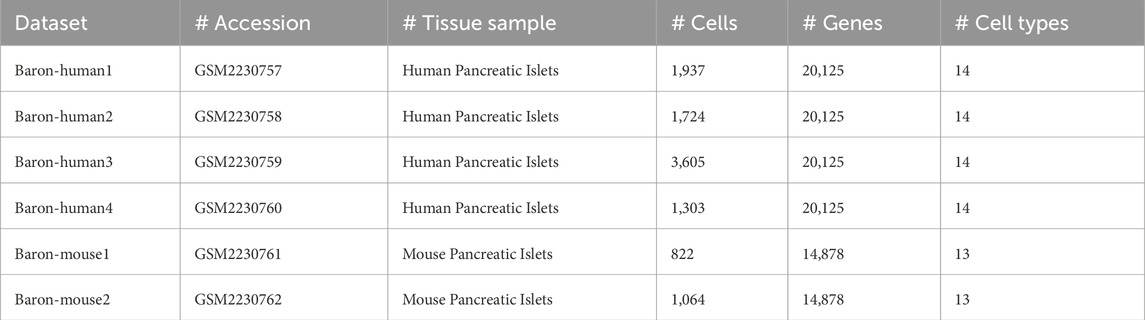
Table 1. Statistics for the datasets used in this work.
2.2 Proposed method
Given a high-dimensional count matrix from the scRNA-seq dataset, we aim to predict cell types and compare the prediction performance of GNNs when input graphs have various levels of edge homophily ratio. The homophily ratio (
where
We proposed a pipeline that consists of three main steps: 1) Data preprocessing (Figure 2), 2) Graph construction (Figure 2), and 3) Model training (Figure 2). Data preprocessing is a critical technique of organizing and cleaning raw data to make the data suitable for downstream application and model training. After data is processed, adjacency matrices are calculated along with
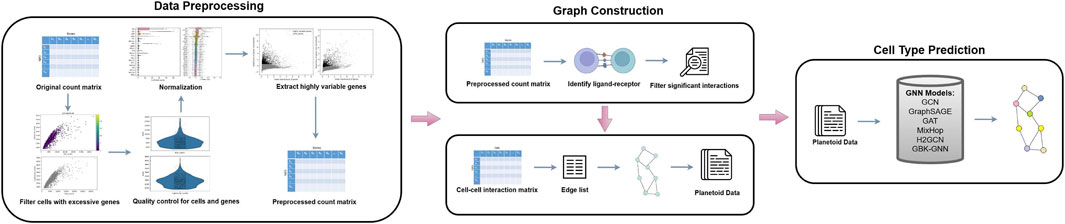
Figure 2. A pipeline for cell type prediction using GNNs. The process begins with data preprocessing, where the original count matrix is normalized, quality control is performed on cells and genes, and highly variable genes are extracted to produce a preprocessed count matrix. Next, graph construction identifies L-R interactions, filters significant interactions, and generates a CCC matrix, which is converted into a graph structure with an edge list formatted as Planetoid data. Finally, various GNN models (e.g., GCN, GraphSAGE, GAT, MixHop,
2.3 Data preprocessing
Before delving into the analysis of scRNA-seq data, preprocessing the data to mitigate the impact of noise present in the samples is a crucial step. In this regard, we adhered to a standard preprocessing pipeline commonly employed in scRNA-seq data analysis. This comprehensive step encompasses quality control, normalization, and feature selection as illustrated in the initial stage of the pipeline represented in Figure 2. We utilized Scanpy (AngererWolf and SCANPY, 2018), a specialized toolkit designed for the analysis of scRNA-seq data. Scanpy (AngererWolf and SCANPY, 2018) offers a comprehensive suite of functionalities, including data preprocessing, visualization, clustering, differential expression analysis, and the simulation of gene regulatory networks. In contrast, other platforms such as Seurat (Farrell et al., 2015; Hoffman et al., 2018; Stuart et al., 2019; Hao et al., 2021; Hao et al., 2023), R-based Bioconductor (Huber et al., 2015), and Cell Ranger (Zheng et al., 2017) struggle to handle extremely large datasets, particularly those exceeding one million cells. Scanpy (AngererWolf and SCANPY, 2018) effectively overcomes these scalability challenges while maintaining the capability to perform similar analytical tasks. Additionally, it provides a user-friendly interface that integrates seamlessly with advanced machine learning libraries.
The evaluation of data quality in scRNA-seq analysis involves two main components: cell quality control and gene quality control. Common criteria for assessing cell and gene quality include the proportion of counts attributed to mitochondrial reads, the number of total counts per cell, and the number of expressed genes per cell. The analysis of these criteria involves examining their distributions to identify outlier peaks, which can be effectively managed through thresholding. These outlier data points are often associated with various issues such as dying cells, cells with compromised membranes, or doublets. For example, cells characterized by a low number of total counts, a limited number of detected genes, and a high fraction of mitochondrial counts may suggest cells where cytoplasmic mRNA has leaked through a broken membrane, with only conserved mRNA remaining in the mitochondria. By observing the scatter plot of mitochondrial reads percentage in Baron-human, we removed the cells whose mitochondrial reads are greater than 5%. Conversely, cells with unexpectedly high total counts and a large number of detected genes may indicate doublets. As a standard practice, high total-count thresholds are commonly applied to filter out potential doublets and other undesirable outliers. In the dataset Baron-human1, we filtered out 31 cells that have more than 14,000 counts and kept 1,922 cells. As for genes, we filtered out 7,950 genes that were detected in less than 20 cells and kept 12,175 genes.
Normalization aims to standardize the raw count data to remove sampling effects by bringing it to a common scale without altering values or losing information. More specifically, a number of mRNA molecules in the cells cannot be fully captured, resulting in a variation in the total counts detected among cells. We used Counts Per Million (CPM) derived from bulk expression analysis, which utilizes a normalization method that adjusts count data by applying a size factor
Even after removing genes with a low number of counts during the QC step, the dimension of feature space in a scRNA-seq dataset is still beyond 12,000. To mitigate data noise and enhance data visualization, we utilized feature selection to diminish the dataset’s dimensionality. During this phase, the dataset undergoes filtering to retain only informative genes that represent the variability of the data. Therefore, Highly Variable Genes (HVGs) are frequently employed for this purpose. We extracted the 2,000 most variable genes for downstream analysis. The feature matrix
2.4 Graph Construction
To construct graphs, LIANA (Türei et al., 2022) is used to infer L-R interactions between cells, leveraging cell-type information from the metadata. It integrates multiple methods (such as CellPhoneDB (Vento-TormoEfremova et al., 2020), NATMI (Ramilowski et al., 2015; Denisenko et al., 2020), and others) to provide a robust analysis of CCC based on transcriptomics data. We designed a workflow that uses LIANA (Türei et al., 2022) to load gene expression data and metadata, convert them into Seurat (Hoffman et al., 2018; Hao et al., 2021; Hao et al., 2023; Farrell et al., 2015; Stuart et al., 2019) objects, and infer L-R interactions. Table 2 and Figure 3 present key metrics that evaluate the strength, specificity, and statistical significance of each interaction, including rankings and scores from multiple analytical tools.
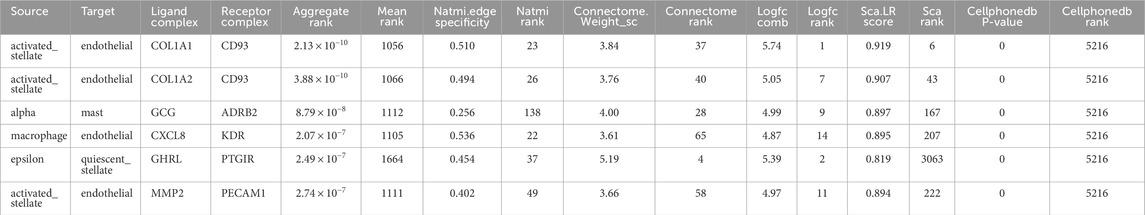
Table 2. Summary of significant L-R interactions identified by LIANA.
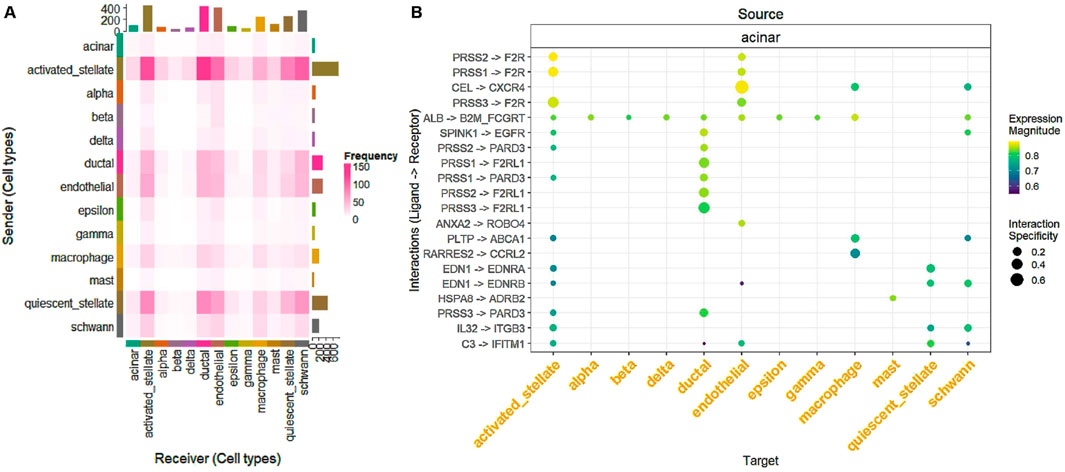
Figure 3. (A) Heatmap showing the frequency of L-R interactions between sender (rows) and receiver (columns) cell types. Each cell represents the interaction frequency, with darker shades of pink indicating higher interaction frequencies. This analysis highlights the communication dynamics among various cell types, such as acinar, activated stellate, and endothelial cells. (B) Dot plot illustrating specific L-R interactions for each source cell type (rows) and their target cell types (columns). The size of the dots represents the specificity of the interaction, while the color indicates the expression magnitude, providing a detailed overview of prominent L-R pairs and their interaction patterns.
The algorithm begins by extracting a set of unique L-R pairs, denoted as
The algorithm then iteratively processes each L-R pair
To construct the weighted interaction matrix
To ensure the connectivity of the inferred cell communication network, the algorithm performs a refinement step to examine each node
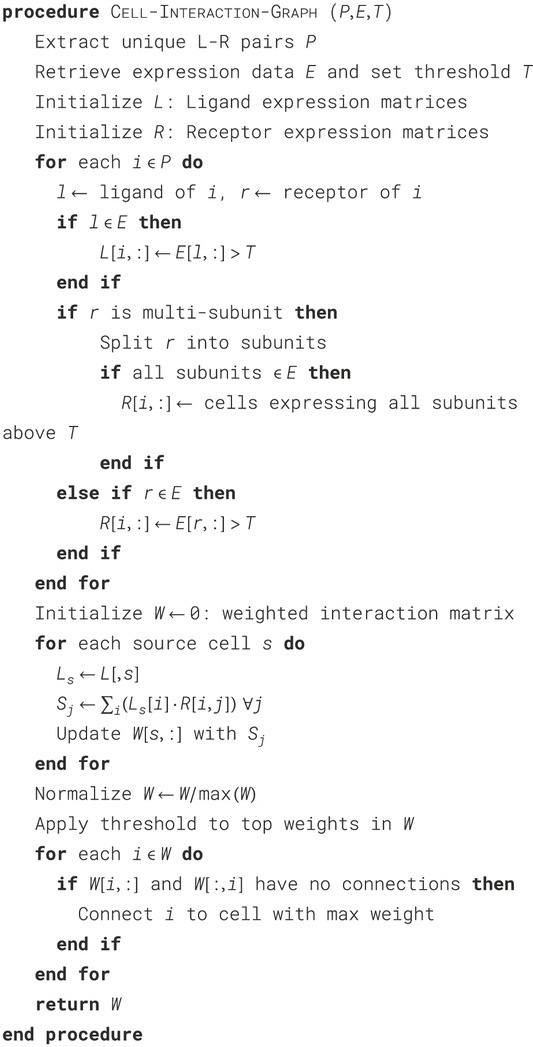
Algorithm 1. CCC Network Construction.
2.5.1 Train-test splitting strategy
We followed the widely used “Planetoid” split protocol, selecting 140 training cells (10 per class) while reserving 1,000 cells for testing. This approach aligns with prior transductive GNN benchmarks and reflects real-world single-cell scenarios, where labeled annotations are scarce. The test set size was chosen to ensure statistical robustness while maintaining a consistent evaluation protocol across datasets. In addition to the Planetoid-style split (140 training cells), we conducted experiments using an 80/20 train-test split, where 80% of the available cells were used for training and 20% for testing. This comparison allowed us to evaluate the impact of training set size on model performance and assess the adaptability of heterophily-aware GNNs to different training regimes. Extended results using an 80/20 split are available in Supplementary Table S2.
2.5.2 Hyperparameter selection
To ensure optimal model performance, we performed hyperparameter tuning for all models. We utilized grid search and empirical tuning to determine the best learning rate, dropout rate, weight decay, and architecture-specific parameters. Supplementary Table S1 in the supplementary materials provides a summary of the hyperparameters used for each model. For instance, we found that GBK-GNN performed best with a learning rate of 0.001, while MixHop required a higher dropout rate (0.7) to prevent overfitting. Additionally, deeper architectures such as
2.5.3 Multiple seed experiments and reproducibility
To ensure the robustness and stability of our findings, we evaluated model performance across multiple random initializations by running each experiment with 30 different random seeds (see Supplementary Tables S3–S10). This approach allows us to assess the stability of our conclusions and provides insight into how heterophily-aware Graph Neural Networks (GNNs) perform in diverse biological settings. Boxplots illustrating accuracy distributions across different seeds were generated, as shown in Figure 4.
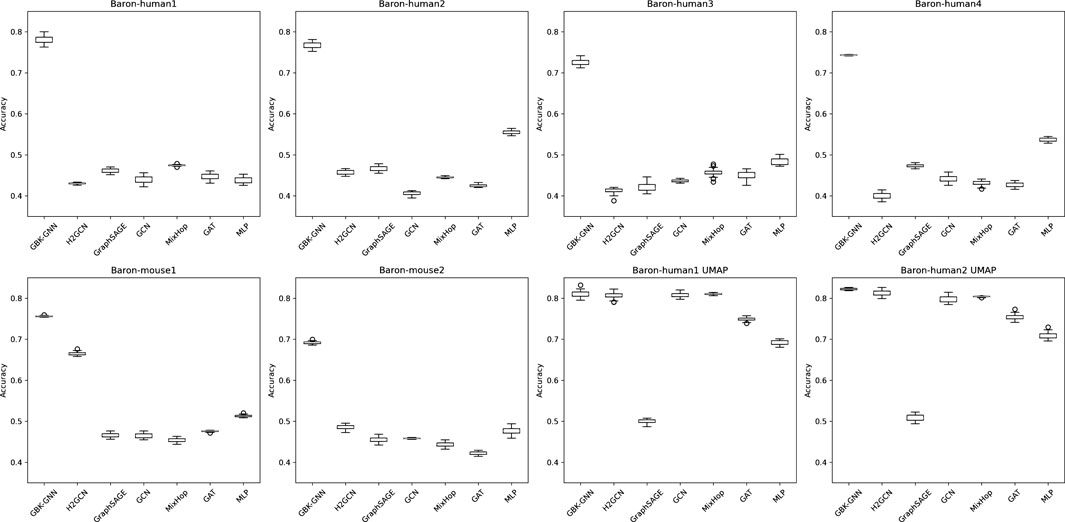
Figure 4. Boxplots illustrating the accuracy distribution of different graph neural network (GNN) models across 30 random seed runs for multiple datasets. Each subplot corresponds to a different dataset, and within each plot, the boxplots represent the performance variability of different models. The x-axis denotes the evaluated models, while the y-axis represents classification accuracy. Wider interquartile ranges and the presence of outliers indicate models with higher sensitivity to seed initialization. Models demonstrating tight boxplots exhibit greater stability across different training runs. These results highlight the importance of evaluating performance over multiple seeds to ensure the reproducibility and robustness of conclusions.
3 Results
3.1 Impact of random seed variability
To ensure that performance comparisons are not biased by a specific train-test partition, we trained each model across 30 different random seeds. Figure 4 presents boxplots illustrating accuracy distributions, confirming that heterophily-aware models consistently outperform baseline GNNs with minimal variance across different random initializations. These results emphasize the importance of evaluating models under diverse sampling conditions to assess their true robustness.
3.2 Effectiveness of heterophily-aware models
Table 4 summarizes the classification accuracy across datasets with different homophily ratios
We evaluated the computational efficiency of GNN models by comparing training time per epoch, inference time, and memory usage (Table 3). GCN and MLP were the most efficient, requiring minimal computational resources, making them ideal for large-scale applications with hardware constraints. In contrast, GBK-GNN and
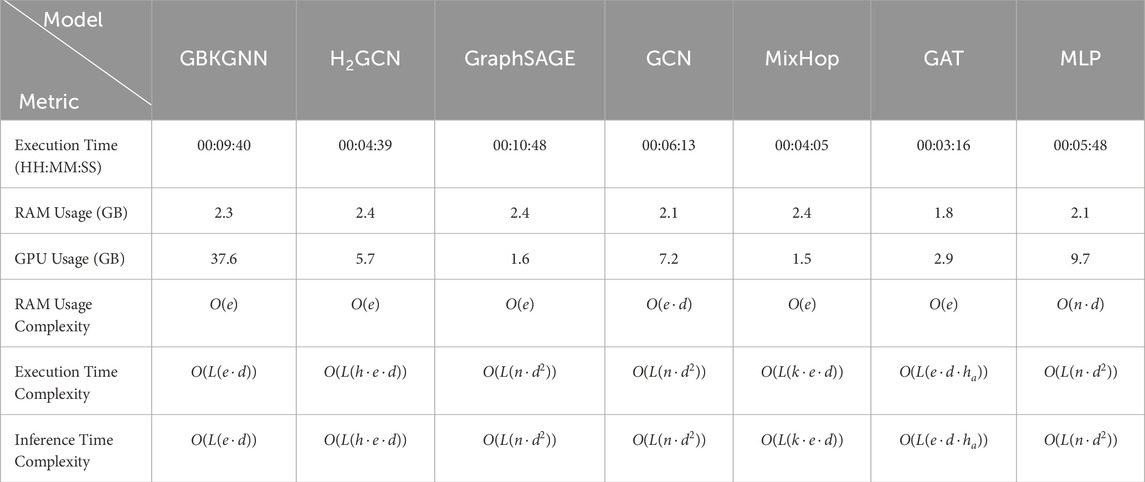
Table 3. Computational efficiency of each GNN model on the Baron-human one dataset for 2000 epochs. The complexity is expressed in Big O notation, where
The comparison of GNN models and MLP performance across various datasets, as presented in Table 4, highlights key insights into the adaptability of heterophily-aware methods for real-world datasets with high heterophily (low

Table 4. Accuracy comparison of models across various scRNA-seq datasets. Best model per dataset highlighted in gray.
4 Discussion
4.1 Heterophily-aware methods
Additionally, the sparse graph structure in smaller datasets such as Baron-mouse2
4.2 Performance comparison with homophily-assuming methods
In summary, GBK-GNN consistently outperforms traditional homophily-assuming GNNs and
4.3 Biological assessment
Computational methods such as LIANA (Türei et al., 2022) predict cell-cell connections by identifying L-R interactions, but these predictions need to be biologically verified to ensure their reliability and relevance. CellCall (Zhang et al., 2021) is an advanced computational tool designed to illuminate and validate intercellular communications within scRNA-seq datasets. By integrating gene expression profiles with known L-R interactions, CellCall (Zhang et al., 2021) systematically infers and assesses the significance of CCC pathways, thereby providing valuable insights into the complex biological interactions that underpin various physiological and pathological processes. The workflow commences with the preparation of expression data and corresponding metadata extracted from a Seurat (Farrell et al., 2015; Hoffman et al., 2018; Stuart et al., 2019; Hao et al., 2021; Hao et al., 2023) object, a widely adopted framework for single-cell analysis. This data is subsequently encapsulated within a CellCall (Zhang et al., 2021) object, which serves as the foundation for further analyses.
The core functionality of CellCall (Zhang et al., 2021) involves the profiling of intercellular communications through the TransCommuProfile function, which applies statistical thresholds to identify significant L-R interactions based on correlation and p-value criteria. Following this, the method employs hypergeometric testing to determine the enrichment of specific signaling pathways within the identified interactions, thereby highlighting biologically relevant communication routes.
To validate the inferred cell-cell pairs, CellCall (Zhang et al., 2021) cross-references the significant signaling pathways with an adjacency matrix of direct cell interactions, quantifying the overlap and thereby assessing the reliability of the predicted communications. This comprehensive approach not only identifies potential CCC but also substantiates them through statistical validation, ensuring that the findings are both robust and biologically meaningful. We selected the Baron-human1 dataset as an example, and 72% of the cell-cell connections in the adjacency matrix are part of the significant signaling pathways. The visualized results are in Figure 5. To further validate the biological significance of our predicted cell-cell interactions, we mapped a subset of ligand-receptor pairs onto Reactome pathways, illustrating their involvement in well-characterized signaling cascades. Supplementary Figure S3 highlights key interactions, including the SEMA4D-CD72 pair, which plays a role in B cell receptor (BCR) signaling. SEMA4D, a membrane-bound semaphorin expressed on T cells, binds to CD72 on B cells, modulating B cell activation and costimulatory signaling. The highlighted edges in Supplementary Figure S3 illustrate this interaction within the broader immune signaling network. Additionally, we filtered and ranked ligand-receptor pairs using NicheNet, prioritizing interactions with high signaling relevance. Supplementary Figure S1 presents a bar plot summarizing the signaling weights of key ligand-receptor pairs, where higher values indicate stronger biological significance. This ranking provides a quantitative assessment of interaction strength, helping identify the most functionally relevant connections. Finally, we visualized the ligand-receptor interaction network in Supplementary Figure S2, where nodes represent ligands and receptors, and edge width reflects signaling strength. This network analysis provides an integrated view of cell-cell communication pathways, emphasizing key interactions with strong biological relevance. These findings reinforce the applicability of heterophily-aware GNNs in modeling complex biological interactions and suggest their potential for broader transcriptomic studies. While this study focuses on pancreatic islet datasets, our methodology is broadly applicable to other single-cell transcriptomic datasets, including immune cells, brain tissue, and tumor microenvironments, where cell-cell communication plays a crucial role. Future work will assess the robustness of heterophily-aware GNNs across diverse biological contexts. Additionally, we constructed graphs based solely on ligand-receptor interactions, which provide a biologically meaningful foundation; however, integrating other interaction patterns, such as transcription factor-target gene relationships and metabolic dependencies, could further enhance predictive performance. Expanding graph construction strategies and testing the models on more diverse datasets will strengthen the applicability and biological relevance of our approach.
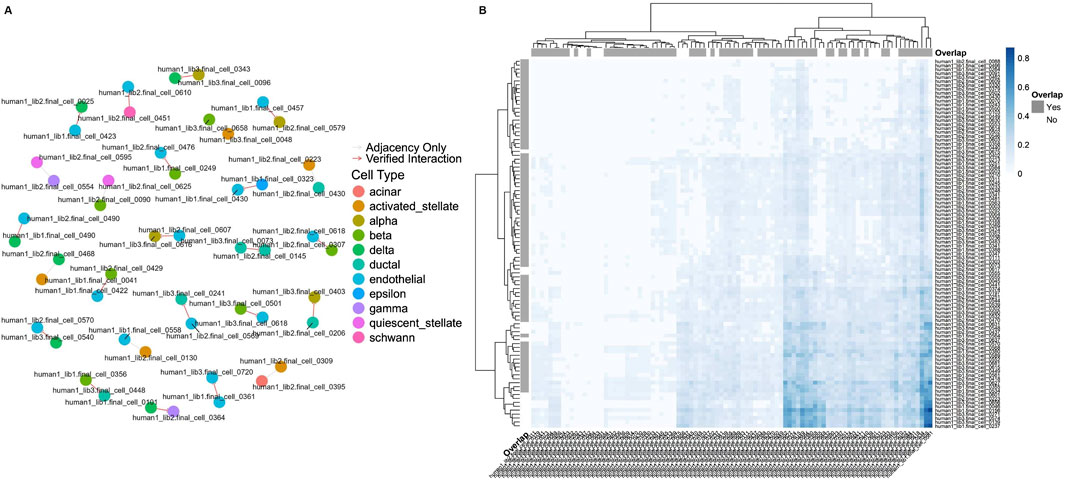
Figure 5. (A) Network graph illustrating cell-cell interactions as derived from the CellCall pipeline. Nodes represent individual cells, color-coded by their assigned cell type, and edges indicate interactions. Verified L-R interactions are shown in red, while gray edges represent adjacency-only connections. The graph highlights the overlap between adjacency-based cell relationships and those validated through significant signaling pathways. (B) Hierarchical clustering heatmap illustrating the connection scores between cells as inferred by LIANA. Rows and columns represent individual cells, with color intensity indicating the strength of the connection, where darker blue shades correspond to higher connection scores. Overlap annotations (“Yes” or “No”) indicate whether the connections were verified by CellCall.
5 Conclusion
This study underscores the transformative potential of heterophily-aware GNNs in the analysis of scRNA-seq data within computational biology. Traditional GNN models operate under the homophily assumption—where nodes with similar characteristics are more likely to be interconnected. However, our investigation reveals that biological networks often exhibit high heterophily, where dissimilar nodes frequently interact, challenging the efficacy of these conventional models.
To address this complexity, we employed LIANA (Türei et al., 2022) to construct biologically informed interaction graphs based on L-R pairs. LIANA (Türei et al., 2022) integrates multiple established methods to infer cell-cell communication pathways, generating adjacency matrices that more accurately reflect the underlying biological interactions. This robust graph construction facilitated the application of advanced GNN models such as GBK-GNN (Du et al., 2022) and
The experimental results demonstrate that heterophily-aware models, particularly GBK-GNN, significantly outperform traditional GNNs and even non-graph-based models like MLP across various scRNA-seq datasets. GBK-GNN’s dual-kernel mechanism and dynamic gating system enable it to effectively differentiate and integrate both homophilic and heterophilic connections, leading to superior predictive performance. In contrast, models like
Further validating our findings, biological assessment using CellCall (Zhang et al., 2021) confirmed the reliability of the inferred cell-cell communication pathways. CellCall’s integration of L-R interactions with transcription factor activities revealed that a substantial proportion of predicted interactions align with known biological mechanisms, reinforcing the biological relevance of our graph constructions and GNN predictions. This validation highlights the capability of heterophily-aware GNNs to not only excel in computational performance but also provide meaningful biological insights, thereby bridging the gap between machine learning and biomedical research.
In conclusion, our study not only reaffirms the critical role of GNNs in analyzing structured biological data but also emphasizes the necessity of integrating domain-specific frameworks like LIANA (Türei et al., 2022) and CellCall (Zhang et al., 2021) to enhance biological interpretability. As biological datasets continue to grow in complexity and scale, adopting models that account for the inherent heterogeneity of biological interactions will be essential. By incorporating statistical reproducibility analyses and leveraging biologically informed graphs, our study strengthens the role of heterophily-aware GNNs in computational biology. Future work will explore extending these methods to larger-scale datasets and real-time single-cell analyses.
Data availability statement
The datasets presented in this study can be found in online repositories. The names of the repository/repositories and accession number(s) can be found in the article/Supplementary Material.
Ethics statement
Ethical approval was not required for the study involving humans in accordance with the local legislation and institutional requirements. Written informed consent to participate in this study was not required from the participants or the participants’ legal guardians/next of kin in accordance with the national legislation and the institutional requirements.
Author contributions
LD: Writing – original draft, Writing – review and editing. MH: Writing – original draft, Writing – review and editing. AN: Writing – original draft, Writing – review and editing. LR: Writing – original draft, Writing – review and editing.
Funding
The author(s) declare that financial support was received for the research and/or publication of this article. This research was supported by the Natural Sciences and Engineering Research Council of Canada (NSERC) and the School of Computer Science, University of Windsor.
Conflict of interest
The authors declare that the research was conducted in the absence of any commercial or financial relationships that could be construed as a potential conflict of interest.
Generative AI statement
The author(s) declare that Generative AI was used in the creation of this manuscript. Generative AI was used to assist in drafting and refining text, ensuring clarity, precision, and alignment with submission requirements. No AI-generated content was used for data analysis, interpretation, or generation of results. The final manuscript has been reviewed and approved by all authors to ensure accuracy and integrity.
Publisher’s note
All claims expressed in this article are solely those of the authors and do not necessarily represent those of their affiliated organizations, or those of the publisher, the editors and the reviewers. Any product that may be evaluated in this article, or claim that may be made by its manufacturer, is not guaranteed or endorsed by the publisher.
Supplementary material
The Supplementary Material for this article can be found online at: https://www.frontiersin.org/articles/10.3389/fmolb.2025.1547231/full#supplementary-material
References
Abu-El-Haija, S., Perozzi, B., Kapoor, A., Alipourfard, N., Lerman, K., Harutyunyan, H., et al. (2019). “Higher-order graph convolutional architectures via sparsified neighborhood mixing,” in Proceedings of the 36th international conference on machine learning, 2481–2490.
AngererWolf, P. T. F., and Scanpy, F. (2018). SCANPY: large-scale single-cell gene expression data analysis. Genome Biol. 19 (1), 15. doi:10.1186/s13059-017-1382-0
Baron, M., Veres, A., Wolock, S., Faust, A., Gaujoux, R., Vetere, A., et al. (2016). A single-cell transcriptomic map of the human and mouse pancreas reveals inter- and intra-cell population structure. Cell Syst. 3(4), 346–360. doi:10.1016/j.cels.2016.08.011
Bastian, H. S. J. M., and Gephi, M. (2009). “An open source software for exploring and manipulating networks,” in Proceedings of the third international AAAI conference on weblogs and social media (San Jose, California, USA: AAAI Press), 361–362.
Cohen, W. W., Salakhutdinov, R., and Yang, Z. (2016). “Revisiting semi-supervised learning with graph embeddings,” in Proceedings of the 33rd international Conference on machine learning, ICML’16 (New York, NY, USA: JMLR.org), 40–48.
Denisenko, E., Ong, H. T., Ramilowski, J. A., and Forrest, A. R. R. (2020). Predicting cell-to-cell communication networks using NATMI. Nat. Commun. 11 (1), 5011. doi:10.1038/s41467-020-18873-z
Du, L., Shi, X., Fu, Q., Ma, X., Liu, H., Han, S., et al. (2022). “Gbk-gnn: Gated bi-kernel graph neural networks for modeling both homophily and heterophily,” in Proceedings of the ACM Web Conference 2022 (New York, NY, United States: Association forComputing Machinery), 1550–1558. doi:10.1145/3485447.3512201
Farrell, J. A., Gennert, D., Schier, A. F., Regev, A., and Satija, R. (2015). Spatial reconstruction of single-cell gene expression data. Nat. Biotechnol. 33 (5), 495–502. doi:10.1038/nbt.3192
Hao, Y., Hao, S., Andersen-Nissen, E., Mauck III, W. M., ZhengHao, S. Y., Butler, A., et al. (2021). Integrated analysis of multimodal single-cell data. Cell 184, 3573–3587.e29. doi:10.1016/j.cell.2021.04.048
Hao, Y., Stuart, T., Kowalski, M. H., Choudhary, S., Hoffman, P. Y., Hartman, A., et al. (2023). Dictionary learning for integrative, multimodal and scalable single-cell analysis. Nat. Biotechnol. 42, 293–304. doi:10.1038/s41587-023-01767-y
Hoffman, P., Smibert, P., Papalexi, E.-S. R., and Butler, A. (2018). Integrating single-cell transcriptomic data across different conditions, technologies, and species. Nat. Biotechnol. 36 (5), 411–420. doi:10.1038/nbt.4096
Huber, W., Carey, V. J., Gentleman, R., Anders, S., Welling, M., Carvalho, B. S., et al. (2015). Orchestrating high-throughput genomic analysis with bioconductor. Natu. Method. 12 (2), 115–122.
Kipf, T. N., and Welling, M. (2016). “Semi-supervised classification with graph convolutional networks,” in International Conference on Learning Representations. doi:10.48550/arXiv.1609.02907
McInnes, M., Healy, J., Saul, N., and Großberger, L. (2018). Umap: Uniform manifold approximation and projection for dimension reduction. J. Open. Sou. Soft. 3 (29), 861
Ramilowski, J. A., Goldberg, T., Harshbarger, J., Kloppmann, E., Lizio, M., Satagopam, V. P., et al. (2015). A draft network of ligand-receptor-mediated multicellular signalling in human. Nat. Commun. 6, 7866. doi:10.1038/ncomms8866
Stuart, T., Butler, A., Hoffman, P., Hafemeister, C., Papalexi, E., Mauck III, W. M., et al. (2019). Comprehensive integration of single-cell data. Cell 177 (1), 1888–1902. doi:10.1016/j.cell.2019.05.031
Theis, F. J., and Luecken, M. D. (2019). Current best practices in single-cell rna-seq analysis: a tutorial. Mol. Syst. Biol. 15 (6), e8746. doi:10.15252/msb.20188746
Türei, D., Garrido-Rodriguez, M., others Dimitrov, D., Burmedi, P. L., Nagai, J. S., Boys, C., et al. (2022). Comparison of methods and resources for cell-cell communication inference from single-cell rna-seq data. Nat. Commun. 13 (1), 3224. doi:10.1038/s41467-022-30755-0
Veličković, P., Cucurull, G., Casanova, A., Romero, A., Lio, P., Bengio, Y., et al. (2018). “Graph attention networks,” in International conference on learning representations, 1–11.
Vento-TormoEfremova, R.-T. S.V.-T. R., Cellphonedb, M., and Vento-Tormo, R. (2020). CellPhoneDB: inferring cell-cell communication from combined expression of multi-subunit ligand-receptor complexes. Nat. Protoc. 15 (5), 1484–1506. doi:10.1038/s41596-020-0292-x
Ying, R., Leskovec, J., and Hamilton, W. L. (2017). “Inductive representation learning on large graphs,” in Advances in neural information processing systems, 1024–1034.
Zhang, Y., Liu, T., Hu, X., Wang, M., Wang, J., Zou, B., et al. (2021). CellCall: integrating paired ligand-receptor and transcription factor activities for cell-cell communication. Nucleic Acids Res. 49 (15), 8520–8534. doi:10.1093/nar/gkab638
Zheng, G. X. Y., Terry, J. M., Belgrader, P., Ryvkin, P., Bent, Z. W., Wilson, R., et al. (2017). Massively parallel digital transcriptional profiling of single cells. Nat. Commun. 8, 14049. doi:10.1038/ncomms14049
Zhu, J., Yan, Y., Zhao, L., Heimann, M., Akoglu, L., Koutra, D., et al. (2020). “Beyond homophily in graph neural networks: current limitations and effective designs,” in Proceedings of the 34th international conference on neural information processing systems (Red Hook, NY, United States: Curran Associates Inc).
Keywords: graph neural networks, single-cell RNA sequencing, cell-cell communication, heterophily, homophily, cell type prediction
Citation: Duan L, Hashemi M, Ngom A and Rueda L (2025) Ligand-receptor dynamics in heterophily-aware graph neural networks for enhanced cell type prediction from single-cell RNA-seq data. Front. Mol. Biosci. 12:1547231. doi: 10.3389/fmolb.2025.1547231
Received: 18 December 2024; Accepted: 07 April 2025;
Published: 12 May 2025.
Edited by:
Junha Shin, University of Wisconsin-Madison, United StatesReviewed by:
Guanjue Xiang, Dana–Farber Cancer Institute, United StatesRajarshi P. Ghosh, Howard Hughes Medical Institute (HHMI), United States
Copyright © 2025 Duan, Hashemi, Ngom and Rueda. This is an open-access article distributed under the terms of the Creative Commons Attribution License (CC BY). The use, distribution or reproduction in other forums is permitted, provided the original author(s) and the copyright owner(s) are credited and that the original publication in this journal is cited, in accordance with accepted academic practice. No use, distribution or reproduction is permitted which does not comply with these terms.
*Correspondence: Luis Rueda, bHJ1ZWRhQHV3aW5kc29yLmNh
†ORCID: Luis Rueda, orcid.org/0000-0001-7988-2058