 Viktor Rudel
 Pascal Kienast
 Georg Vinogradov1
- 1Department High Performance Cutting, Fraunhofer Institute for Production Technology IPT, Aachen, Germany
- 2Laboratory for Machine Tools and Production Engineering (WZL) of RWTH Aachen University, Aachen, Germany
In this publication, the application of an implemented Digital Twin (DT) framework is presented by orchestration of CAM-integrated and containerized technology models carrying out FEM-coupled simulations for the finishing process of a simplified blade integrated disk (blisk) demonstrator. As a case study, the continuous acquisition, processing and usage of virtual process planning and simulation data as well as real machine and sensor data along the value chain is presented. The use case demonstrates the successful application of the underlying DT framework implementation for the prediction of the continuously changing dynamic behavior of the workpiece and according stable spindle speeds in the process planning phase as well as their validation in the actual manufacturing phase.
1 Introduction
Current commercial computer-aided manufacturing (CAM) systems are usually operated as desktop applications on the basis of local single-user licenses. Correspondingly, CAM-integrated software packages developed for process simulations are limited to the computational power of the local working hardware. As a consequence, CAM users and simulation experts suffer from extensive calculation times, iterative simulation loops and a lack of efficient evaluation tools in process planning of complex parts such as blisks. This paper presents the orchestration of CAM-integrated and containerized technology models for various complex process planning simulation tasks in milling. The implemented digital twin framework enables to execute computer-aided design, manufacturing and engineering (CAD/CAM/CAE) kernels on various virtual machines including the toolpath calculation, material removal, tool-workpiece engagement, cutting force, finite element method (FEM) or process stability simulations. Throughout the scalable and flexible interconnection of various technology models and simulation stages the process designer is able to outsource the computing efforts from the personnel computer (PC) to the cloud infrastructure. Thus, the application of the DT framework enables to reduce the computational time drastically by a horizontal and vertical integration of the CAx system with the digital thread.
For the illustration of the implemented digital twin framework, a mode shape analysis of a simplified blade geometry is conducted to validate the simulated workpiece dynamics with acquired process data in milling trials. Therefore, the previously introduced coupled technology models are used for virtual manufacturing simulations by extracting in-process workpieces (IPWs) for selected cutter locations (CLs) and automatically determining the dynamic properties of each IPW individually through FE modal analyses. This procedure is capable of considering the continuously varying dynamic behavior of the workpiece due to changes in workpiece stiffness and mass, caused by the material removal and the position-dependent force excitation by the milling tool. Thus, this simulation use case represents a typical, computationally intensive simulation application in blisk milling. The virtual representation of the dynamic process behavior is subsequently compared with machine internal and external signals of the real blade finishing processes.
2 State of the art
2.1 Digital twin frameworks
The concept of a DT (Bergs et al., 2021) enables the generation of a virtual representation of a physical manufacturing object throughout design, engineering, operation and service stages of a product (Tao et al., 2018; Liu M. et al., 2021; Zhu et al., 2021). DTs can be used to monitor manufacturing applications, analyze collected data and predict future behavior and performance of machining processes (Ladj et al., 2021). The implementation of a DT framework architecture, such as proposed in (ISO 23247-2, 2022), is necessary to guarantee manufacturers a decision-making virtual platform across an organization (Shao and Helu, 2020). Therefore, a well implemented DT framework should fulfill requirements regarding standardization, multidirectional communication, scalability, flexibility, modularity, traceability, real-time capability, and security (Boschert et al., 2016). The consistent usage of a standardized DT framework can help manufacturers to generate and manage common data and model collections, e.g., acquired process data from a machine tool consisting of position signals, motor drive currents or spindle speed (Hänel et al., 2020; Hänel et al., 2021).
2.2 Internet of things platforms and microservice architecture
One of the prevailing issues in today’s Industrial Internet of Things (IIoT) applications is the interoperability of heterogeneous hardware and software elements in the manufacturing environment and the limited computing resources of edge devices (Muralidharan et al., 2020). To overcome this challenge and guarantee a continuous data communication between single instances within a DT framework, software developers use docker-container-based microservices to test, deploy and update IoT applications at large scale (Docker, 2022). The main asset of a containerized application is to bundle up all relevant libraries and dependencies in one single package, whereas microservice architecture is implemented as a modular and single purpose application for lightweight data management and efficient communication (Steindl and Kastner, 2021). The open-source platform Kubernetes (Kubernetes, 2022) emerged as an essential enabler for the dynamic orchestration of containerized applications, e.g., status monitoring or automated load balancing of services, which enhances the reliability and computational performance of large-scale applications.
2.3 Process design optimization in blisk manufacturing based on technology models
Multi-axis milling of thin-walled aerospace parts, such as blisks, which are typically made of hard-to-cut Ti-/Ni-alloys, represents one of the most challenging tasks in turbomachinery manufacturing. Due to high aspect ratio of the blade geometry resulting in low workpiece rigidity, various effects such as deflection and chatter can occur during the machining process and can greatly affect the quality and efficiency of the blisks. Those unfavorable process conditions are difficult to predict accurately due to time-varying dynamic characteristics caused by material removal and constantly changing tool-workpiece engagement conditions (Liu D. et al., 2021). However, process design optimizations are mainly executed in a CAD/CAM-system due to the geometrical complexity of blisks and the applied multi-axis machining operations. At the ramp-up stage, process designers often modify the toolpath based on random parametric variations of the generated CAM operations due to the lack of convergence and interaction between the physical manufacturing process and virtual data (Mohring et al., 2016; Ganser et al., 2021a). To eliminate trial and error approaches, predictive technology models can be integrated into process planning systems. They are used to describe fundamental process variables, such as cutting forces, stresses, strains and temperature and predict industry relevant outcomes such as tool-life, surface roughness, accuracy or surface integrity based on analytical, numerical, empirical or AI-based modeling methods (Arrazola et al., 2013).
2.4 Finite element method-coupled process simulations of blisk milling operations
FEM represents a computationally intensive simulation technique for modeling mechanical and thermal effects during machining such as the calculation of dominant frequencies of thin-walled workpieces based on process specific boundary conditions (Budak et al., 2012; Scippa et al., 2014; Wang et al., 2019). Thin-walled workpieces are usually characterized by natural frequencies in the range of less than 8,000 Hz (Scippa et al., 2014). Therefore, in most cases it is sufficient to analyze the first and second eigenmode to describe the dynamic behavior of the component (Scippa et al., 2014). The calculation of resonant vibrations of tool and workpiece and their frequency response functions (FRFs) for each position of the toolpath is essential to describe vibrations occurring during the cutting process (Biermann et al., 2010; Bachrathy et al., 2020; Wang et al., 2020). In terms of improving the dynamic vibration behavior in milling of thin-walled workpieces, the adaptive control of the spindle speed is one key approach to prevent resonance of both tool and workpiece and tracking their relative displacement (Scippa et al., 2014). Within novel FEM-based and CAM-integrated simulation approaches, it is possible to take into account systematically the continuously changing workpiece modal behavior related to the material removal (Maslo et al., 2020; Maslo, 2022). This allows a position-oriented evaluation of the workpiece FRF, which can be subsequently coupled with simulated or experimentally evaluated FRFs measured at the tooltip.
3 Implementation of a digital twin framework
The first introduction of “dPart” implemented as a cross-system solution for data-consistent digital twinning in the machining domain can be found in (Ganser et al., 2021b). dPart combines the implementation of the ISO 23247 (ISO 23247-2, 2022) reference architecture with the big data lambda architecture (Marz and Warren, 2015). Figure 1 shows the standardized architecture of the dPart framework consisting of four main domains and one orchestration layer. A detailed explanation of the block functionalities of each domain can be read in the aforementioned publication. In accordance with the process design use case introduced in, the basic structure of dPart has been further developed.
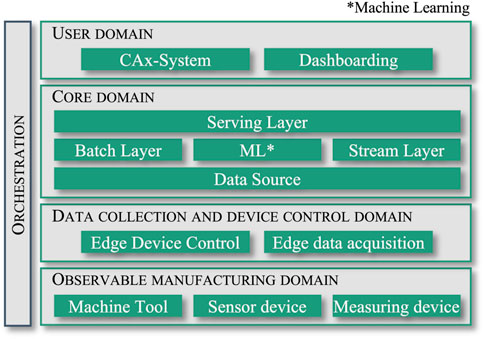
FIGURE 1. dPart’s standardized architecture.
In a possible process design task, a user is interested in the dynamic process simulation of the programmed blisk finishing processes. For the batchwise generation and analysis of the process-specific data, the dPart framework can be applied. In Section 3.1, all relevant microservices of the modular framework are introduced, which are required to run FEM-coupled process simulation tasks within the developed IIoT infrastructure. Section 3.2 provides a detailed overview of which variables, parameters and methods are used to model the dynamic behavior of milling processes for thin-walled workpieces.
3.1 Cloud computing within the implemented industrial internet of things infrastructure
Figure 2 shows a partially detailed view of the dPart framework, especially representing user and core domain and the orchestration layer. Thereby, the job manager and the message broker are allocated at the orchestration layer. They are responsible for linking the individual elements of the user and core domain. Figure 2 illustrates in particular, how simulation and optimization requests are generated from the CAD/CAM-system (ModuleWorks, 2022; Robert McNeel and Associates, 2022) and executed in subsequent steps by containerized microservices in an on-premise cloud solution of the Fraunhofer-Gesellschaft (2022). The CAM user first defines an optimization request through a React-based (Meta Platforms and Inc., 2022) user interface and forwards all relevant input information to the Job Manager via REST API using Django (Christie, 2022) webserver. The corresponding input data of the optimization request is translated to a json file. The optimization request includes in the case of FEM-coupled process simulations information about the toolpath, selected cutter locations (CLs), tool and workpiece geometry, boundary conditions, material properties, and simulation parameter settings. After the Job Manager receives the input data, the json file is stored in a central PostgreSQL (The PostgreSQL Global Development Group, 2022) database.
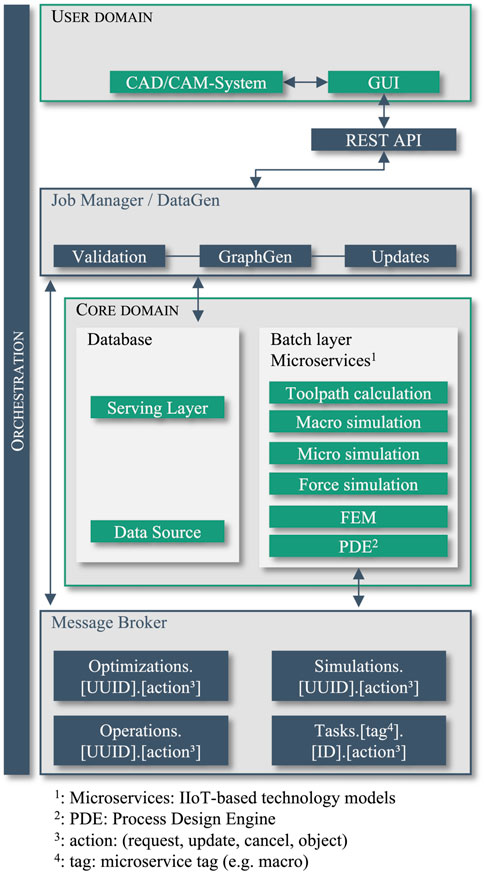
FIGURE 2. Cloud infrastructure for technology-based CAM-planning.
A json file can contain a single parameterized CAM operation (task) or a sequence of operations (tasks) described by a Directed Acyclic Graph (DAG). The DAG contains information about all dependencies (predecessors, successors) as well as the execution order of the respective operations. A task is uniquely described by a hash value which is generated by applying a hash function to a task object. The hash value is used to find duplicates in the database, since identically parameterized tasks always map the same hash value. Tasks for which simulation results are not yet available are sorted by execution order and stored in a Celery (Celery, 2022) task queue.
A RabbitMQ (VMware I, 2022) message broker receives incoming simulation tasks and forwards it to a Kubernetes (2022) cluster hosted on multiple virtual machines. The Kubernetes cluster is responsible for the coordination and management of multiple simulation workers assigned to the virtual machines. The simulation workers are responsible for the execution of the actual simulations. A simulation worker consists of several dockerized (Docker, 2022) simulation modules such as toolpath calculation, macroscopic engagement simulation (calculation of radial and axial engagement angles between tool and workpiece), microscopic engagement simulation (calculation of uncut chip geometry), cutting force simulation or FEM and can be used very flexibly for the various simulation requirements due to its modular structure. A task is executed by one simulation worker at a time while continuously providing status updates about the simulation progress. Incoming simulation updates (simulation progress, results, errors) are communicated back to the Job Manager. After simulation completion, all results are stored in database and are available to the user for integration into the CAM-System or a browser-based dashboard.
3.2 Computer-aided manufacturing-integrated and containerized finite element method simulations in the process design stage
A methodology for automated FE modal analysis with the objective to simulate the changing workpiece dynamics in different geometrical states of the IPW was proposed in Maslo et al. (2020). This developed simulation methodology for the thin-walled plate was then transferred to a 5-axis milling process of a blisk (Maslo, 2022). A coupling between CAM environment and ANSYS into the dPart cloud system enables the automatization of position-oriented dynamic simulations including continuously changing properties of each IPW individually. The workflow of the FEM-coupled process simulations (see Figure 3) with the objective to determine the workpiece dynamics for each feed per tooth (fz) is subdivided into four main stages:
1. Selection of characteristic CL based on the programmed tool path,
2. Generation of the IPW for each CL by material removal simulation,
3. Calculation of blade dynamics at each CL through coupled FE modal analysis,
4. Interpolation of blade dynamics from CL points to fz-step points
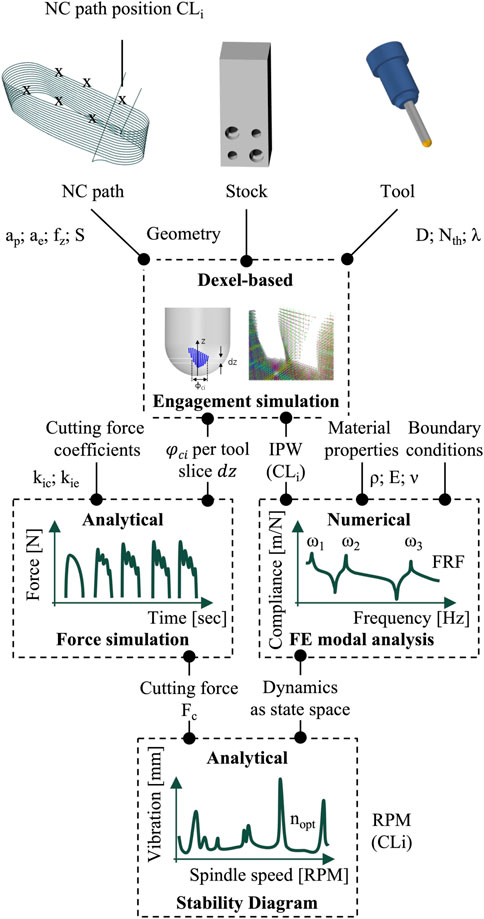
FIGURE 3. FEM simulation workflow.
After the user defines all the inputs and submits the simulation request, the actual automation and parallelization of the computational effort can take place in the cloud. Figure 3 shows a detailed sequence of involved inputs, methods, and variables to calculate the virtual representation of the dynamic process behavior. First, the user programs the toolpath for the milling process. Fundamental inputs for the dexel-based simulations are: (a) NC path containing all relevant cutting parameters (axial stepover ap; radial stepover ae; feed per tooth fz; Spindle Speed S); (b) stock geometry of the workpiece, (c) tool geometry (such as diameter D, number of teeth Nth, helix angle λ). Moreover, the CAM user needs to select discrete CLs, for which the FE modal analysis should be performed in the following steps. Simulation of all CLs of the toolpath is not realistic in terms of calculation time and computationally intensity since a single tool path consists of several thousand points. For each single selected CL, the computational effort accumulates, e.g., through IPW conversion from dexel to solid, attachment of the geometry to ANSYS mechanical, meshing process, execution of modal analysis etc.
Subsequently, a dexel-based engagement simulation is executed to calculate the engagement angles between tool and workpiece on the one hand, and to extract CL-dependent IPWs (CLi) on the other hand. Moreover, the user needs to define material properties, e.g., density ρ; Young’s Modulus E; Poisson’s ratio ν and boundary conditions, e.g., constrains or friction, in order to run FE modal analysis with ANSYS and obtain CL-dependent FRFs. Additionally, specific cutting force coefficients need to be defined in order to execute a dual-mechanistic cutting force simulation (Altintas et al., 2014) and obtain the process-related cutting force Fc. With the knowledge of the position-dependent cutting force and FRFs, stability diagrams can be generated enabling the selection of suitable spindle speeds to avoid vibrations during the milling process (Maslo et al., 2020; Maslo, 2022).
4 Simulation and experimental setup
To demonstrate the application of the implemented DT framework and the workflow of FEM-coupled process simulations, Section 4.1 initially introduces a simplified blisk demonstrator in the shape of a single blade geometry. Section 4.2 presents the systematic selection of CLs in the CAM system and the generation of corresponding IPWs according to the first two steps of the proposed FEM workflow (see Section 3.2). Subsequently, Section 4.3 deals with the automated FE Modal Analysis integrated into dPart´s cloud system and applied for the chosen blade demonstrator. The results of the FE modal analysis were interpolated in Section 4.4. In Section 4.5, the experimental setup of the milling experiments is described together with the sensor setup used to monitor the finishing processes of blade milling.
4.1 Single blisk blade demonstrator and process setup
The demonstrator workpiece (raw part: see Figure 4A; final part: see Figure 4E) is a thin-walled blade made of Ti-6Al-4V. The nominal geometry of the blade has a profile height of 60 mm and chord length of 45 mm. The high aspect ratio, the ratio of the span to the chord length (Nasa, 2022), of 1.3 increases the probability of occurring vibrations during the milling process. The blade thickness varies from a minimal thickness of 0.7 mm to a maximum thickness of 2.9 mm. The transition from the blade is defined by a constant fillet radius of 8 mm. The milling strategy consists of a multi-stage process including: 1) roughing processes, with the aim of cutting the material with a high removal rate, 2) semi-finishing processes to provide a homogenous material offset in order to create constant conditions for the subsequent finishing processes, and 3) finishing processes to produce the required geometrical accuracy. Usually, the blades are evenly divided along the profile height into multiple blocks (see Figures 4B–D). The advantage of the multiple block strategy is that the short free oscillation lengths during the finishing processes result in a higher blade stiffness compared to a one block strategy. The primary reason for the selection of the multiple block strategy is to reduce the deflection and vibration influences on the workpiece side during the milling process. In this case, the demonstrator blade is equally divided into three blocks, consequently each spans a height of 20 mm. In the following, the analysis is focused on the finishing operations.
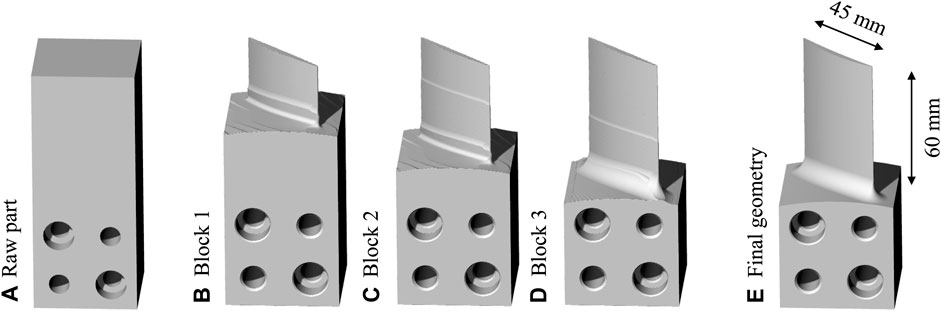
FIGURE 4. Demonstrator geometry and machining block strategy. (A) Raw part. (B) Block 1. (C) Block 2. (D) Block 3. (E) Final geometry.
Determining a suitable and constant spindle speed is a challenging process design task (Munoa et al., 2016; Altintas et al., 2020). For this reason, the demonstration of the simulation procedure (see Section 3.2) is demonstrated below that aims to determine the blade dynamics at discrete CLs by means of FEM-coupled process simulations. In the presented use-case, a total of 150 CLs were selected for the finishing operations.
4.2 Systematic cutter location selection and automated in-process workpiece generation (step 1 + step 2)
Based on the programmed toolpath, CLs were selected in a grid formation on suction and pressure side of the blade by surface parametrization through vector-valued functions (u and v parameters). Through three main settings the structured selection of cutter locations was ensured: 1) number of vertical curves, 2) number of horizontal curves as well as an 3) offset to the blade edges. Here, five vertical and five horizontal curves formed the equidistant grid on suction and pressure side of the blade and an offset of 2 mm to the blade edges was defined. For each grid point, the nearest surface contact point of the programmed toolpath was calculated. Finally, the coordinates of the surface contact points were exported in a structured form along with other information, e.g., tool data or surface normal vectors of the tool contact points. Figure 5 illustrates the introduced procedure for all three finishing operations starting with the programmed toolpath (see Figure 5A), followed by the creation of equidistantly distributed grid points on the blade’s surfaces (see Figure 5B) and ending with 150 selected CLs in total (see Figure 5C). Each ten CLs form a cutter location layer (CLL), whereas CLL 1 and CLL 11 are exemplary illustrated in Figure 5D.
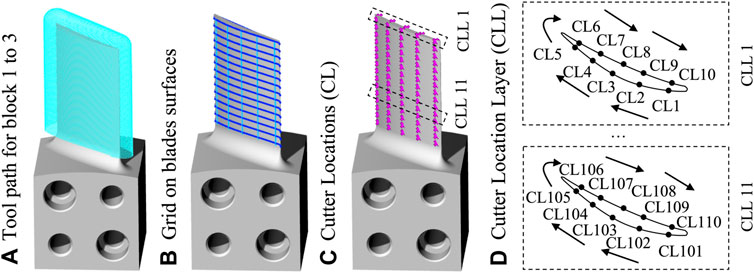
FIGURE 5. Procedure for selection of cutter locations used for subsequent FE modal analysis. (A) Toolpath for block 1 to 3, (B) Grid on blade surfaces, (C) Cutter Locations (CLs), (D) Cutter Location Layer (CLL).
4.3 Automated FE modal analysis integrated into dPart cloud system (Step 3)
In the FE modal simulation, the material properties for Ti-6Al-4V were defined with Young’s modulus of 118.95 GPa and density of 4435.5 kg/m3. Maslo conducted a mesh analysis with decreasing tetrahedral mesh sizes and concluded that an element size of 0.8 mm provides an optimal numerical convergence for the chosen thin-walled plate demonstrator (Maslo et al., 2020). The element size of 0.8 mm was also used here to mesh the IPWs. A damping factor of 0.2% was defined and the numerical calculation of eigenmodes was set up to 12,000 Hz. The boundary conditions, e.g., clamping constraints, were defined in accordance with the machine setup.
A detailed overview for the ANSYS Mechanical application is shown in Figure 6. For instance, the contact area of workpiece with adapter block, clamping screw, and dowel pins were set as fix support (see Figure 6A). Subsequently, the surface-based representation of the IPW was automatically converted into a solid geometry and the corresponding CL was assigned to the closest node. The geometry was meshed with tetrahedral elements (see Figure 6B) and the eigenvalue problem solved by the FE modal analysis (see Figure 6C).
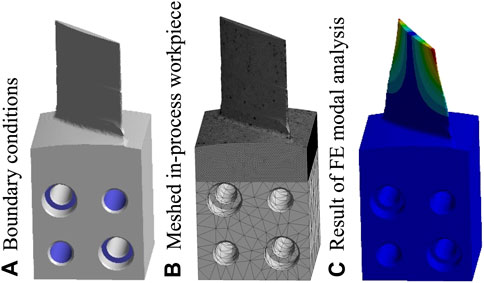
FIGURE 6. Setup of FEM simulation in ANSYS, e.g., meshed IPW of CL62 assigned to block 2. (A) Boundary conditions, (B) Meshed in-process workpiece, (C) Result of FE modal analysis.
Finally, the results of the blade dynamics at the corresponding CL in form of a state-space-model were exported from ANSYS and stored in the database of the DT framework. These steps were repeated for each CL, respectively each IPW.
4.4 Interpolation (Step 4)
The results generated through the coupled ANSYS simulation were transferred into a reduced Linear Parameter-Varying (LPV) model, an extended state-space representation, which describes the position-dependent workpiece dynamics (Maslo et al., 2020; Maslo, 2022). To finally receive the dynamic information based on fz-step point cloud density, an interpolation of the workpiece dynamics between the CLs was performed. The corresponding procedure is illustrated in Figure 7, using the dynamic compliance assigned to the second eigenmode of block 2, starting at 3,276 Hz for CL 51 and ending at 2,970 Hz for CL 100, as an example (see Figure 7A). Two linear interpolations of the grid-based LPV model in vertical (see Figure 7B) and horizontal (see Figure 7C) direction were subsequently applied block-wise to the magnitude values of the 50 selected CLs. The data set with the calculated blade dynamics was mapped via a closest-point-algorithm to the fz-step points of the toolpath, which represents the reference point cloud density of the remaining process simulations performed within dPart.
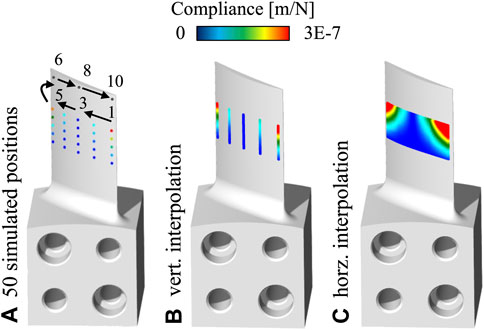
FIGURE 7. FE results in form of the torsional mode for block 2 in CAM environment. (A) 50 simulated positions, (B) vertical interpolation, (C) horizontal interpolation.
In Figure 8 the resulting magnitudes of the dynamic compliance related to the first three eigenmodes of block 1 to 3 are visualized in the CAM environment. The first two mode shapes (bending and torsion mode) (Figures 8A,B) show a repetitive pattern for block 1 and 2, and a drastically decrease of dynamic compliance for the third block. At the beginning of a machining block, the blade usually has a lower stiffness since the distance to surrounding solid material, which is at the bottom of the block, is the longest. Eigenmode 3 has smaller magnitudes compared to the first two modes. Moreover, the first block has only two dominant modes. This is why the position-oriented visualization shows up as dark blue color as can be observed in Figure 8C.
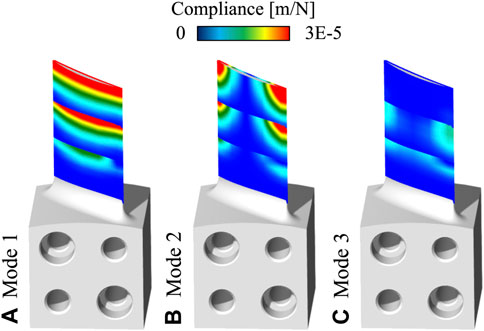
FIGURE 8. Interpolation on fz-steps of the magnitudes for mode shapes 1 to 3 of block 1 to 3. (A) Mode 1, (B) Mode 2, (C) Mode 3.
With a constant process excitation, for example by machining with a constant spindle speed, the scenario can occur that the tooth passing frequency (TPF) suddenly hits the decreasing natural frequency of the workpiece resulting in an unstable process (Klocke, 2018). In Figure 9, it can be observed how the eigenfrequencies change in relation to the specific CL. In general, the stiffness-reducing effect of material removal is much stronger than the mass reduction, which means that as machining progresses from block 1 to 3, the eigenfrequencies of a thin-walled workpiece usually decrease (Klocke, 2018). A similar behavior can also be observed within one single block. As the machining process continues, the eigenfrequency decreases. An example is represented by block 2: the eigenfrequency of mode 1 starts with 1,590 Hz (CL 51) and continuously decreases to 1,460 Hz (CL 100). Block 1 represents an exception for the described change of the eigenfrequencies of mode 1 and 2. Here, an initial increase of the eigenfrequencies can be observed (CLs 1–30) before it returns to a continuous decrease (CL31–CL 50).
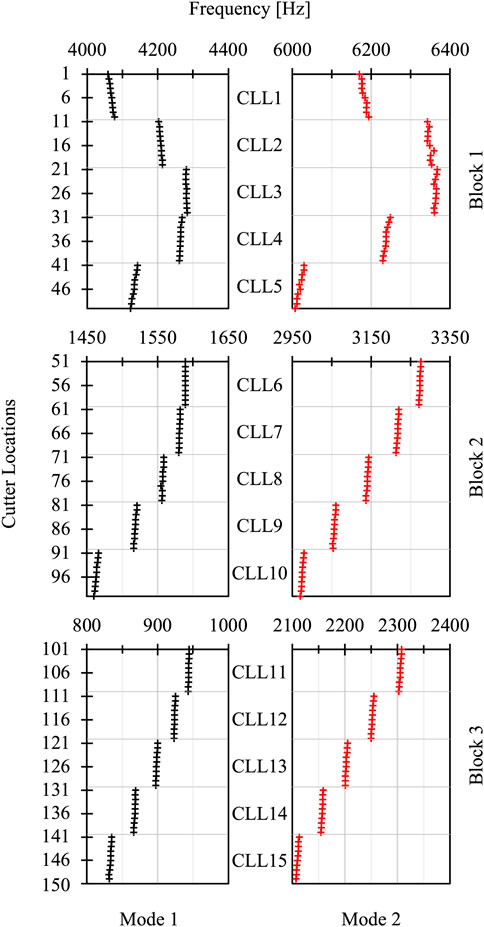
FIGURE 9. CL specific change of eigenfrequencies for modes 1 and 2 of block 1 to 3.
4.5 Machine and sensor setup
The 5-axis milling of the blade demonstrator was conducted on a GF Mikron HPM 800U HD vertical machining center (see Figure 10). The stock material was positioned with two dowel pins and clamped with two M8 cylinder head screws on an adapter block with a torque of 20 Nm. The multi-stage milling process was divided into roughing, pre-finishing, finishing, hub and fillet processes. Every operation was executed with another type of milling tool, whereas for all tools the same tool holder system was used: Rego-Fix HSK-A 63/PG 25 × 100 H with a collet holder. A ball end mill with a diameter of 12 mm and four teeth and a helix angle of 30° (Walter Prototype MC413-12.0A4XD-WJ30TF) was used for the finishing operations. The cantilever length of the finishing tool was increased specifically to 105 mm to represent a state-of-the-art blisk milling process with a high tool compliance as required for high-aspect ratio blade geometries. The axial depth of cut was set to ap = 0.4 mm, the radial depth of cut, respectively the blade material offset was set to ae = 0.2 mm and the feed per tooth was fz = 0.06 mm.
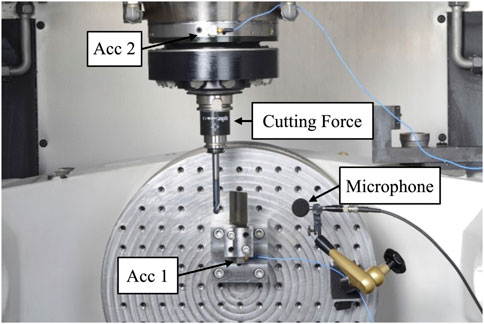
FIGURE 10. Blade demonstrator clamped on milling machine with used sensory.
Extensive process data acquisition took place as part of the investigation applying elements from the data acquisition and device control domain of dPart (Ganser et al., 2021b). Machine-internal signals, such as the position data of the linear and rotational axes, as well as the load signals of all drives were recorded by the edge data acquisition at a frequency of approximately 250 Hz. In addition, important metadata such as workpiece identification, NC-program structure and tool parameters was saved. Moreover, the acquisition system is supplemented by the integration of signals from external sensory. Two triaxial acceleration sensors with a measurement range of ±50 g were used to monitor the vibrations on the workpiece and tool side during machining. Acceleration sensor 1 (PCB 356A15) was mounted by a screw connection at the bottom of the blade demonstrator. Acceleration sensor 2 (Kistler 8764B050BB) was attached on the flat surface of the spindle ring. Inside the internal machine room, a microphone from Roga Instruments (RG-50) measured the sound pressure induced by the milling process. Additionally, a spike sensor (Greiff, 2022) was used during the finishing operations. The spike is a wireless intelligent tool holder system that is able to measure bending, torsion, and axial moments by integrated sensory.
5 Results
Within Section 5, the results of the FE modal analysis (see Section 4.4) are compared with the acquired process data and experimental results (see Section 4.5). The structure of this section is as follows: In Section 5.1 the FRFs of the FE simulation and experimental modal analysis (EMA) are compared. In Section 5.2 the achieved surface finish geometry of the demonstrator blade is discussed in detail. Finally, the short time fourier transform (STFT) analysis of the acquired acceleration sensor (Acc 1) is presented putting surface quality, simulation data and process data in context (Section 5.3).
5.1 Validation of FE results by comparing the frequency response functions obtained from experimental modal analysis
An experimental modal analysis was conducted before the individual finishing operations with the objective to determine the modal parameters of the blade IPWs for all modes in the frequency range of 200–12,000 Hz. The modal parameters were calculated by system identification, respectively curve fitting of EMA results, and used to formulate mathematical dynamic models (state-space model) for the IPWs. The measurements were performed with a laser vibrometer (Polytec OFV-5000) and an impulse hammer (PCB 08A17). Figure 11A shows the experimental setup, whereas Figure 11B shows the result of the system identification for blade modes 1 to 3 representing the FRF for the IPW before blade finishing of the second block. 1,592, 3,278, and 7,470 Hz can be identified as the first three eigenfrequencies. The corresponding magnitudes are: 2 E-4 m/N (mode 1); 6.26·E-5 m/N (mode 2), and 7.14·E-6 m/N (mode 3). The damping ratio ζ for the first two eigenmodes is 0.05% and for mode 3 it is 0.27%.
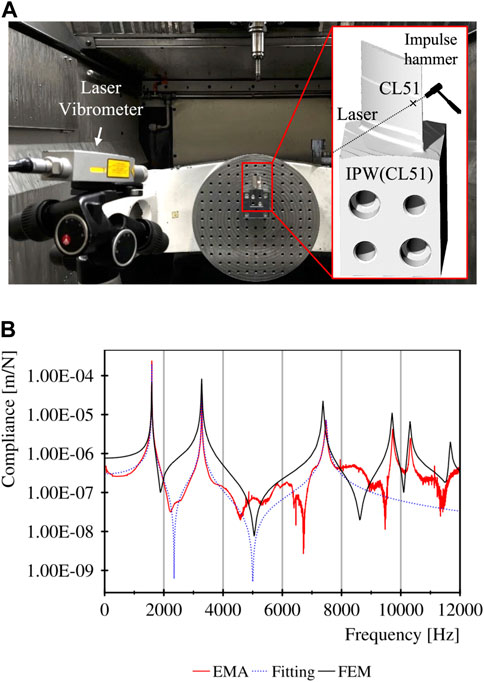
FIGURE 11. (A) EMA Setup, (B) FRF before finishing block 2 obtained from EMA (red); state-space model by system identification (blue); FE modal analysis for CL51 (black).
As introduced in Section 4.3, FE modal analyses were conducted for a total of 150 in-process workpieces. Figure 11B shows the comparison between the simulated FRF of CL 51 and the corresponding EMA represented by geometric condition of the block before the finishing operation of block 2. The eigenfrequencies determined by FE modal analysis are 1,590, 3,275, and 7,371 Hz, which is equal to a relative deviation of 0.13%, 0.09%, and 1.33% from the EMA results. By comparing the FRF curves from EMA and FEM simulations, it can be observed that especially the damping ratios, but also the magnitudes, do not show good accordance (see Figure 11B). In this context, the definition of only one single value for the damping ratio in ANSYS Mechanical, which then was applied to all modes, can be mentioned as a possible root cause. Another reason for the deviation could be, that the resultant FRF generated in the simulation environment was calculated based on the three directional (X, Y, and Z direction) state space model exported from ANSYS, but the resultant FRF generated in the experimental environment considered the normal direction of the blade surface.
5.2 Achieved blade surface quality
Figure 12A shows significant surface irregularities (labeled with A to F) occurring on the suction surface due to instable dynamic process conditions during the finishing processes of the blade. It can be observed that, apart from area D and F, the vibrations occurred at the beginning of each machining block. Figure 12B represents the result of a surface comparison between the nominal and actual geometry, which was carried out using the software GOM Inspect. The optical measurement of the blade was performed with a Zeiss COMET 8M system. The result in Figure 12B indicates profile deviations of up to + 50 μm outside the areas of A to F. It can be assumed that a superposition of quasi-static deflections of the tool and workpiece cause these geometrical form errors, which lead to a lower chip thickness during the milling process and result in a geometrically oversized blade profile. Therefore, almost all profile deviations are in the positive range. The effect of tool wear can be neglected since the three finishing operations remove a total chip volume of 1,060 mm³, resulting in a flank wear land width of VBmax = 35 μm. In areas A, B, C, E, and F on the other hand, the positive deviations are lower with quantified errors of approx. +25 µm each. Area D shows the lowest deviations of approx. up to +5 μm, although the largest vibration marks can be observed visually according to Figure 12A. Thus, the data show that dynamic unstable process conditions with high vibration amplitudes (areas inside A to F) caused a relative movement between tool and workpiece, so that more material was removed compared to the surrounding surfaces (areas outside A to F). In addition, Figure 12 shows the spindle speeds, respectively according TPFs, used for each machining block: 474 Hz (block 1); 445 Hz (block 2); 608 Hz (block 3).
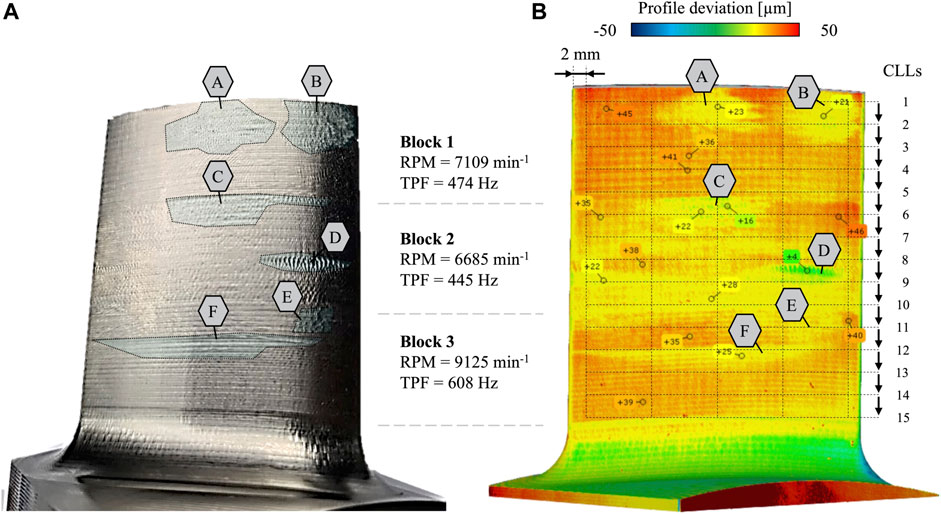
FIGURE 12. (A) Image capture of the machined blade, (B) surface comparison of the nominal and actual geometry.
5.3 Comparison between achieved surface quality and acquired process data
In the following Section 5.3, a root cause analysis was conducted based on the simulation and process data to explain why the instable process conditions (areas A to F) occurred. Therefore, the acquired sensor signal of Acc 1 (see Figure 10) is investigated. The objective was to identify dominant vibration frequencies of the acceleration signal, which can be assigned to tool and workpiece dynamics or process-related frequencies. Therefore, the vibration signal was processed by application of a STFT, which enables a time- and frequency-dependent data analysis with resolutions of 0.02 s (time domain), respectively 50 Hz (frequency domain).
In the following section, a position-dependent evaluation of the STFT is discussed for the TPF (see Figure 13A), mode 1 (see Figure 13B) and mode 2 (see Figure 13C) for all 3 finishing processes. In the case of the mode’s visualization, the simulated eigenfrequency values for the 150 simulated CLs (see Figure 9) were assigned to acquired tool tip positions based on a closest point algorithm. Subsequently, the spectrogram matrix was read out partially based on the assigned frequencies per tool tip position and colorized according to the amplitude. This method of process data analysis shows a high level of correlation between the achieved surface quality (see Figure 12) and the position-dependent evaluation of the STFT (see Figure 13). According to the comparison, the vibrations marks in A to F were caused by the following dominant frequencies: TPF (A); mode 2 (B); mode 1 (C); mode 2 (D); mode 2 (E); mode 1 (F).
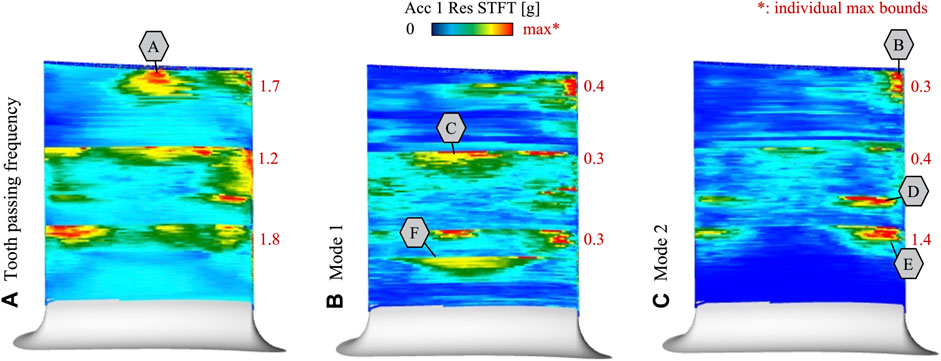
FIGURE 13. Process data for TPF and mode shapes 1 and 2 (following simulated eigenfrequencies). (A) Tooth passing frequency, (B) Mode 1, (C) Mode 2.
Figure 14 shows the spectrogram of all three finishing blocks containing time, frequency, and magnitude (logarithmic scale) information from the acceleration signal. The corresponding simulated natural frequencies of mode 1 and 2 (see Figure 9) are indicated as black curves. The simulated frequencies were assigned to each individual timestamp through a closest point algorithm between the planned and acquired CL positions. Through the traced course of mode 1 and 2, the relative location of both modes to the TPFs (narrow dashed lines) can be analyzed. The eigenfrequency for mode 1 starts at 4,068 Hz, decreases during machining, and ends at 831 Hz. Mode 2 has an eigenfrequency of 6,185 Hz at the beginning of block 1, decreases as well, and has a value of 2,107 Hz as the finishing operation of block 3 ends. It can be observed that the TPFs of 474, 445, and 608 Hz and their respective harmonic values have high amplitudes throughout the entire process time. In addition, the following cause-effect relationships can be derived between the identified surface irregularities from A to F (see Figures 12, 13) and the spectrogram:
• (A): Within the time interval from 0 to 90 s, the first eight harmonics (frequency spectrum of 0–3,792 Hz) of TPF1 = 474 Hz indicate particularly high amplitudes. The amplitudes decrease after the time of 90 s. This corresponds with the observation that only the upper area of block 1 shows surface irregularities.
• (B): For the first 40 s of block 1, the curve of the second eigenmode is almost congruent with the dashed curve of the 13th harmonic (6,162 Hz). This may have caused the torsional vibration of the blade in area (B).
• (C): Mode 1 is in the middle between the third (1,335 Hz) and fourth (1,780 Hz) harmonic TPF2 at the beginning of block 2. It may have caused the amplitudes from both harmonic frequencies to overlap and result in the excitation of the bending mode.
• (D): Shortly after 340 s, the seventh harmonic TPF (3,120 Hz) intersects the second eigenfrequency of the IPW. This may have caused the torsional vibration of the blade in area (D).
• (E): Mode 2 is close to the fourth harmonic TPF3 (2,432 Hz) at the beginning of block 3. The high amplitudes in the range between 2,400 Hz and 3,000 Hz indicate a torsional vibration of the blade in area E.
• (F): Mode 1 is close to the second harmonic TPF (1,216 Hz) throughout the finishing process of block 3. This indicates that the bending mode caused vibrations in area F.
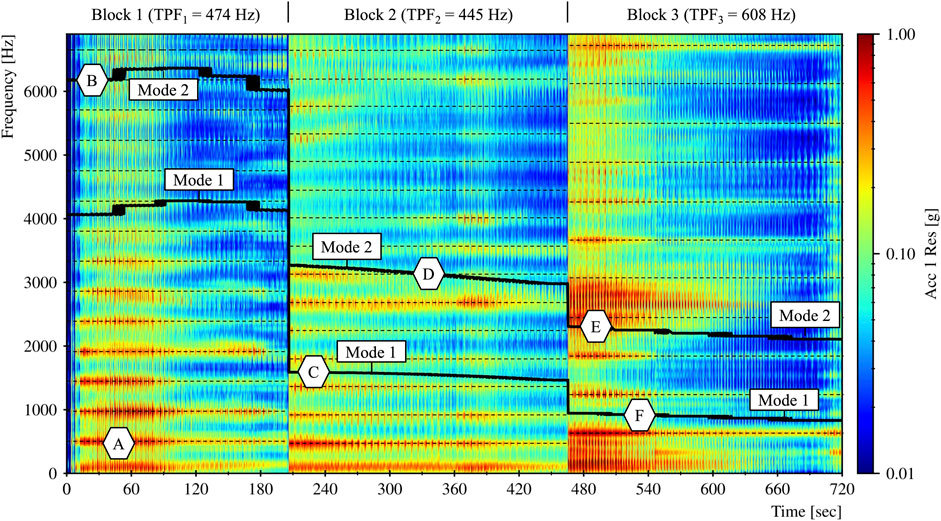
FIGURE 14. Spectrogram of the finishing operations from block 1 to 3 with changing eigenfrequency related to mode 1 and 2.
6 Conclusion and outlook
The presented DT framework supports to generate, interconnect, analyze, optimize and document manufacturing-relevant data through the application of various process-relevant models. Contrary to other DT frameworks (see Section 2.1), the special feature of the proposed framework is that all involved components are implemented in an on-premise cloud infrastructure. This enables the creation of a complete and data-consistent digital twin along the entire value-added chain of planning, production and quality assurance and reduces interface problems within the machining domain. Technology models, such as the material removal simulation, cutting force simulation and the FE analysis are implemented in a microservice architecture within the DT framework for modular and single purpose data processing applications in the process planning stage.
In this paper, it was possible to systematically predict the continuously changing workpiece modal behavior related to the material removal by the application of the proposed FEM-coupled process simulation. Based on the FRF comparison between FEM simulation and EMA it can be stated that a precise prediction (evaluated relative deviation of max. 2%) of the workpiece eigenfrequencies could be made during the process planning stage. However, the analysis also showed that there is potential for optimization in the simulation of the damping ratios and amplitudes of the simulated FRF. In addition, data analysis methods were presented to provide a data-based explanation for the occurrence of vibration-induced chatter marks on the blade surface considering the harmonic excitation of the milling engagement. The combination of simulated eigenfrequencies and acquired vibrations signals, subsequently processed by applying STFT, could provide a data-based evidence why vibration fields A to F occurred (see Section 5.3).
As future work, a continuous further development of the presented FEM-coupled process simulations will take place. Major focus will be to overcome the mismatch between the FRF curves of simulation and reality (illustrated in Figure 11B). Exemplary, activities are currently ongoing to improve the prediction of dynamics by post-processing the FE results, such as assigning individual damping ratio to each eigenmode. Furthermore, focus will be on the substitution of conventional FEM method by novel approaches such as Finite Cell Method (FCM) or machine learning applications. The data processing methods presented within this paper are intended to be applied to the following overall optimization objectives in the milling of thin-walled workpieces: 1) suppression of vibrations occurring in the process through process-parallel adaptation of the spindle speed; 2) development of a toolpath compensation method for the reduction of quasi-static workpiece deflections by considering the position-dependent change of the workpiece stiffness.
Data availability statement
The original contributions presented in the study are included in the article/supplementary material, further inquiries can be directed to the corresponding authors.
Author contributions
All authors listed have made a substantial, direct, and intellectual contribution to the work and approved it for publication.
Funding
The development of the orchestration layer within the developed digital twin framework was funded by the federal ministry of education and research (BMBF) in the research project »CAM 2030« (02J19B080). The data-based analysis of the workpiece dynamics was funded by the BMBF within the Eurostars (Eureka) program »dynaTWIN« (E! 115498).
Acknowledgments
Furthermore, we acknowledge the support of ModuleWorks and Carl Zeiss GOM Metrology GmbH.
Conflict of interest
The authors declare that the research was conducted in the absence of any commercial or financial relationships that could be construed as a potential conflict of interest.
Publisher’s note
All claims expressed in this article are solely those of the authors and do not necessarily represent those of their affiliated organizations, or those of the publisher, the editors and the reviewers. Any product that may be evaluated in this article, or claim that may be made by its manufacturer, is not guaranteed or endorsed by the publisher.
References
Altintas, Y., Kersting, P., Biermann, D., Budak, E., Denkena, B., and Lazoglu, I. (2014). Virtual process systems for part machining operations. CIRP Ann. 63, 585–605. doi:10.1016/j.cirp.2014.05.007
Altintas, Y., Stepan, G., Budak, E., Schmitz, T., and Kilic, Z. M. (2020). Chatter stability of machining operations. J. Manuf. Sci. Eng. 142, 70. doi:10.1115/1.4047391
Arrazola, P. J., Özel, T., Umbrello, D., Davies, M., and Jawahir, I. S. (2013). Recent advances in modelling of metal machining processes. CIRP Ann. 62, 695–718. doi:10.1016/j.cirp.2013.05.006
Bachrathy, D., Kiss, A. K., Kossa, A., Berezvai, S., Hajdu, D., and Stepan, G. (2020). In-process monitoring of changing dynamics of a thin-walled component during milling operation by ball shooter excitation. J. Manuf. Mater. Process. 4, 78. doi:10.3390/jmmp4030078
Bergs, T., Gierlings, S., Auerbach, T., Klink, A., Schraknepper, D., and Augspurger, T. (2021). The concept of digital twin and digital shadow in manufacturing. Procedia CIRP 101, 81–84. doi:10.1016/j.procir.2021.02.010
Biermann, D., Kersting, P., and Surmann, T. (2010). A general approach to simulating workpiece vibrations during five-axis milling of turbine blades. CIRP Ann. 59, 125–128. doi:10.1016/j.cirp.2010.03.057
Boschert, S., and Rosen, R. (2016). “Digital twin—the simulation aspect,” in Mechatronic futures. Editors P. Hehenberger, and D. Bradley (Cham: Springer International Publishing), 59–74. doi:10.1007/978-3-319-32156-1_5
Budak, E., Tunç, L., Alan, S., and Özgüven, H. N. (2012). Prediction of workpiece dynamics and its effects on chatter stability in milling. CIRP Ann. 61, 339–342. doi:10.1016/j.cirp.2012.03.144
Celery (2022). Celery - distributed task queue — Celery 5.2.7 documentation. Available at: https://docs.celeryq.dev/en/stable/ (Accessed Jul 13, 2022).
Christie, T. (2022). Home - Django REST framework. Available at: https://www.django-rest-framework.org/ (Accessed Jul 13, 2022).
Docker (2022). Home - docker. Available at: https://www.docker.com/ (Accessed Jul 11, 2022).
Fraunhofer-Gesellschaft (2022). Fraunhofer Edge Cloud für die Steuerung der Produktion. Available at: https://www.fraunhofer.de/de/presse/presseinformationen/2022/mai-2022/fraunhofer-edge-cloud-fuer-die-steuerung-der-produktion.html (Accessed Jul 13, 2022).
Ganser, P., Landwehr, M., Schiller, S., Vahl, C., Mayer, S., and Bergs, T. (2021a). “Knowledge-based adaptation of product and process design in blisk manufacturing,” in ASME Turbo Expo 2021: Turbomachinery Technical Conference and Exposition (Aachen: American Society of Mechanical Engineers (ASME)). doi:10.1115/GT2021-59562
Ganser, P., Venek, T., Rudel, V., and Bergs, T. (2021b). DPART – a digital twin framework for the machining domain. MM Sci. J. 2021, 5134–5141. doi:10.17973/MMSJ.2021_11_2021168
Greiff, S. (2022). Zerspankraftmessung mit spike – kräfte direkt am Werkzeug messen. Available at: https://www.pro-micron.de/spike/ (Accessed Jul 15, 2022).
Hänel, A., Schnellhardt, T., Wenkler, E., Nestler, A., Brosius, A., Corinth, C., et al. (2020). The development of a digital twin for machining processes for the application in aerospace industry. Procedia CIRP 93, 1399–1404. doi:10.1016/j.procir.2020.04.017
Hänel, A., Seidel, A., Frieß, U., Teicher, U., Wiemer, H., Wang, D., et al. (2021). Digital twins for high-tech machining applications—a model-based analytics-ready approach. JMMP 5, 80. doi:10.3390/jmmp5030080
ISO 23247-2 (2022). Automation systems and integration - digital twin framework for manufacturing - Part 2: Reference architecture.
Kubernetes (2022). Production-grade container orchestration. Available at: https://kubernetes.io/ (Accessed Jul 11, 2022).
Ladj, A., Wang, Z., Meski, O., Belkadi, F., Ritou, M., and Da Cunha, C. (2021). A knowledge-based Digital Shadow for machining industry in a Digital Twin perspective. J. Manuf. Syst. 58, 168–179. doi:10.1016/j.jmsy.2020.07.018
Liu, D., Luo, M., Urbikain Pelayo, G., Trejo, D. O., and Zhang, D. (2021). Position-oriented process monitoring in milling of thin-walled parts. J. Manuf. Syst. 60, 360–372. doi:10.1016/j.jmsy.2021.06.010
Liu, M., Fang, S., Dong, H., and Xu, C. (2021). Review of digital twin about concepts, technologies, and industrial applications. J. Manuf. Syst. 58, 346–361. doi:10.1016/j.jmsy.2020.06.017
Marz, N., and Warren, J. (2015). Big data: Principles and best practices of scalable real-time data systems. Shelter Island, NY: Manning.
Maslo, S., Menezes, B., Kienast, P., Ganser, P., and Bergs, T. (2020). Improving dynamic process stability in milling of thin-walled workpieces by optimization of spindle speed based on a linear parameter-varying model. Procedia CIRP 93, 850–855. doi:10.1016/j.procir.2020.03.092
Maslo, S. (2022). Simulation of the dynamic vibration behaviour and spindle speed optimization during the milling process of turbomachinery components. 1st ed. Aachen: Apprimus Verlag.
Meta Platforms, Inc. (2022). Meta Platforms, Inc. React – a JavaScript library for building user interfaces. Available at: https://reactjs.org/. (Accessed 13 Jul 2022).
ModuleWorks (2022). ModuleWorks | market leading CAD/CAM component technology. Available at: https://www.moduleworks.com/de/(Accessed Jul 13, 2022).
Mohring, H. C., Wiederkehr, P., Leopold, M., Nguyen, L. T., Hense, R., and Siebrecht, T. (2016). Simulation aided design of intelligent machine tool components. J. Mach. Eng. 16.
Munoa, J., Beudaert, X., Dombovari, Z., Altintas, Y., Budak, E., Brecher, C., et al. (2016). Chatter suppression techniques in metal cutting. CIRP Ann. 65, 785–808. doi:10.1016/j.cirp.2016.06.004
Muralidharan, S., Yoo, B., and Ko, H. (2020). “Designing a semantic digital twin model for IoT,” in 2020 IEEE International Conference on Consumer Electronics (ICCE) (Las Vegas, NV, USA: IEEE), 1–4. doi:10.1109/ICCE46568.2020.9043088
Nasa (2022). Geometry definitions. Available at: https://www.grc.nasa.gov/www/k-12/airplane/geom.html (Accessed Aug 16, 2022).
Robert McNeel, Associates (2022). Rhinoceros 3D. Available at: https://www.rhino3d.com/(Accessed Jul 13, 2022).
Scippa, A., Grossi, N., and Campatelli, G. (2014). FEM based cutting velocity selection for thin walled Part Machining. Procedia CIRP 14, 287–292. doi:10.1016/j.procir.2014.03.023
Shao, G., and Helu, M. (2020). Framework for a digital twin in manufacturing: Scope and requirements. Manuf. Lett. 24, 105–107. doi:10.1016/j.mfglet.2020.04.004
Steindl, G., and Kastner, W. (2021). Semantic microservice framework for digital twins. Appl. Sci. 11, 5633. doi:10.3390/app11125633
Tao, F., Cheng, J., Qi, Q., Zhang, M., Zhang, H., and Sui, F. (2018). Digital twin-driven product design, manufacturing and service with big data. Int. J. Adv. Manuf. Technol. 94, 3563–3576. doi:10.1007/s00170-017-0233-1
The PostgreSQL Global Development Group (2022). PostgreSQL. Available at: https://www.postgresql.org/ (Accessed Jul 13, 2022).
VMware I (2022). Messaging that just works — RabbitMQ. Available at: https://www.rabbitmq.com/ (Accessed Jul 13, 2022).
Wang, D., Ren, J., Tian, W., Shi, K., and Zhang, B. (2019). Predicting the dynamics of thin-walled parts with curved surfaces in milling based on FEM and Taylor series. Int. J. Adv. Manuf. Technol. 103, 927–942. doi:10.1007/s00170-019-03585-6
Wang, X., Song, Q., and Liu, Z. (2020). Position-dependent stability prediction for multi-Axis milling of the thin-walled component with a curved surface. Appl. Sci. 10, 8779. doi:10.3390/app10248779
Keywords: digital twin framework, 5-axis milling, CAM-based process simulation, cloud computing, FEM, process stability, in-process workpiece
Citation: Rudel V, Kienast P, Vinogradov G, Ganser P and Bergs T (2022) Cloud-based process design in a digital twin framework with integrated and coupled technology models for blisk milling. Front. Manuf. Technol. 2:1021029. doi: 10.3389/fmtec.2022.1021029
Received: 16 August 2022; Accepted: 28 September 2022;
Published: 19 December 2022.
Edited by:
Erhan Budak, Sabancı University, TurkeyReviewed by:
Nikolaos Tapoglou, International Hellenic University, GreeceChun Zhao, Beijing Information Science and Technology University, China
Copyright © 2022 Rudel, Kienast, Vinogradov, Ganser and Bergs. This is an open-access article distributed under the terms of the Creative Commons Attribution License (CC BY). The use, distribution or reproduction in other forums is permitted, provided the original author(s) and the copyright owner(s) are credited and that the original publication in this journal is cited, in accordance with accepted academic practice. No use, distribution or reproduction is permitted which does not comply with these terms.
*Correspondence: Viktor Rudel, dmlrdG9yLnJ1ZGVsQGlwdC5mcmF1bmhvZmVyLmRl; Pascal Kienast, cGFzY2FsLmtpZW5hc3RAaXB0LmZyYXVuaG9mZXIuZGU=