 Tommaso Lisini Baldi
 Sara Marullo1
 Nicole D’Aurizio
- 1Department of Information Engineering and Mathematics, University of Siena, Siena, Italy
- 2Istituto Italiano di Tecnologia, Genova, Italy
Material characterization and discrimination is of interest for multiple applications, ranging from mechanical engineering to medical and industrial sectors. Despite the need for automated systems, the majority of the existing approaches necessitate expensive and bulky hardware that cannot be used outside ad-hoc laboratories. In this work, we propose a novel technique for discriminating between different materials and detecting intra-material variations using active stimulation through vibration and machine learning techniques. A voice-coil actuator and a tri-axial accelerometer are used for generating and sampling mechanical vibration propagated through the materials. Results of the present analysis confirm the effectiveness of the proposed approach. Processing a mechanical vibration signal that propagates through a material by means of a neural network is a viable means for material classification. This holds not only for distinguishing materials having gross differences, but also for detecting whether a material underwent some slight changes in its structure. In addition, mechanical vibrations at 500 Hz demonstrated an ability to provide a compact and meaningful representation of the data, sufficient to categorize 8 different materials, and to distinguish reference materials from other defective materials, with an average accuracy greater than 90%.
1 Introduction
Reliable material characterization and discrimination is a key control process for guaranteeing production quality in many industrial sectors. Automated systems are required to classify raw materials on different quality levels, and to potentially discriminate the desired raw material from other unwanted defective materials. This is usually done by devising a model that captures relevant material properties, or the way the material behaves when an external stimulus is applied. As a consequence, if the model is sufficiently accurate, the defective material is expected to differ from the reference sample.
Several methods have been developed for discriminating and classifying materials in a non-destructive manner. Non-destructive testing methods deal with the identification and characterization of material samples without modifying the component inspected, whether they show inner or external visibility. Examples include ultrasonic (Peng et al., 2012; Su et al., 2014), thermographic (Kroeger, 2014), infrared imaging (Vavilov et al., 2015), visual (Bossi and Giurgiutiu, 2015), acoustic (Sarasini and Santulli, 2014), and electromagnetic (Yang et al., 2013) techniques. Among all these possibilities, the one that is closer to the approach proposed in this work is the exploitation of acoustic pulses (Nyffenegger et al., 2004). In a similar way, ultrasounds are used in the nondestructive evaluation and classification of different materials. Since echoes from high frequency (from 5 up to 10 MHz) sound waves vary with subsurface flaws and layers, classification techniques are applied to distinguish materials and identify imperfections. On the one hand, advantages of ultrasonic testing include speed of scan, good resolution and flaw detecting capabilities, on the other hand, scattering, absorption and object geometry are three parameters that affect the attenuation. Additional not negligible drawbacks are the thermal and mechanical effects due to the high frequency of the signal. Furthermore, such type of investigation is not practical for on-site in-service inspections since it requires special equipments with accurate calibrations (Memmolo, 2018).
All the mentioned approaches are usually extremely expensive, require highly sophisticated instrumenta- tion setups, and must be performed under experts’ supervision. Moreover, they are often time-consuming and require an intense data post processing. Hence, these limitations make these methods not suitable for routine laboratory experiments and small-scale industries.
The possibility of distinguishing between different materials is fundamental also in medicine. Indeed, automated systems for skin characterization and discrimination are of interest for dermatological diseases detection. Skin diseases are the most frequent diseases worldwide, highly complex and expensive to diagnose, and strongly subjected to doctor’s experience and interpretation (Vijayalakshmi, 2019). Therefore, the introduction of automated methods in medical analysis has great potential in reducing human-based errors (Kopec et al., 2003). In this context, the majority of the proposed solutions is based on artificial intelligence techniques applied to images (Attallah and Sharkas, 2021; Goceri, 2021), thus relying on visual properties of the skin. However, detecting changes in mechanical properties of the skin is also relevant for understanding skin pathophysiology, and support diagnosis and early treatment of diseases (Li et al., 2012).
With this work, we propose a proof-of-concept system for discriminating between different materials and detecting intra-material variations using active stimulation through vibration and machine learning techniques. The use of vibration-based techniques is a consolidated method in material analysis, especially for structural health monitoring and damage detection (Montalvao et al., 2006). An exploratory study, that demonstrated the feasibility of the proposed approach, was presented in (Al-Bkree, 2018). The author performed a simple vibration test to classify different types of materials. In the work we are proposing, low-frequency vibrations are applied directly on the material, in such a way aforementioned problems related to the ultrasounds can be overcome. Moreover, the approach here presented is based on a system setup which is thought to be easily adopted for possible implementation outside the laboratory.
The rest of the paper is organized as follows. In Section 2.1 and Section 2.2 we describe the system setup and the selected materials. In Section 2.3 the data acquisition and preprocessing. In Section 3, we illustrate and discuss the approaches followed for materials discrimination and defects detection. In Section 4, conclusions and possible subjects of future research are outlined.
2 The system
The core idea of this paper is to discriminate between different materials and to detect intra-material variations by exploiting the way the mechanical vibrations propagate through materials. To this aim, we developed a system to be mounted on the target surface which is capable of generating and sensing vibrations. Nine samples were selected to validate the proposed approach.
2.1 Hardware
Preliminary tests were conducted in order to identify the best pair of acting and sensing technology. Accelerometer and polyvinylidene fluoride film sensors, and voice coil and piezoelectric actuators were tested to identify the combination giving the highest performance. The evaluation was done considering the range of selected frequencies (i.e., from 100 to 500 Hz), the duration of the stimulation, the required signal amplitude, and the easiness of positioning the hardware on the objects to be investigated. As a final result, we selected an accelerometer (ADXL335 Analog Devices, United States) as sensing element, and a voice coil actuator (Bone Conduction Transducer Adafruit, NY, United States) drived by an audio amplifier (LP 2020A+ Lepai, CN) for generating the vibration. The voice coil has an operational frequency range of 70–19000 Hz, while the accelerometer has a sensing range from 0.5 to 1600 Hz for the x- and y- axis, and from 0.5 to 550 Hz for the z-axis. A multifunction DAQ device (E2000 MicroDAQ, PL) is in charge of both generating sinusoidal waveforms for driving the voice coil, and reading the accelerometer values along the three axes, with a sampling rate of 100 kHz. The audio amplifier transforms the output of the DAQ board into a suitable signal for the voice coil.
A weight of 100 g is positioned over the voice coil to increase the amplitude of the vibration transmitted to the material, and limit possible noise due to surface mounting misalignment, which especially affects coupling with soft materials. The system is configured to generate sinusoidal waveforms with an amplitude ranging from 1.4 to 8.3 g. Considering the setup used within this work, we assessed that the generated vibration amplitude linearly depends on the vibration frequency. The frequency-amplitude relationship was estimated in a preparatory phase in which voice coil vibration amplitudes were recorded and interpolated from 100 to 500 Hz, with a step frequency of 10 Hz. Each fixed-frequency vibration lasted 5 s. The resulting relationship between amplitude and frequency (f) can be described with a negligible error (R2 = 0.996) as:
being a = 0.017 g Hz−1 and b = −0.172 g.
2.2 Materials
Nine different materials were considered for the purpose of this work. In Table 1 a brief description of each material is reported alongside the name and the correspondent ID used in this paper for the sake of brevity. With the aim of providing a fair experimental evaluation, we selected both soft and hard materials. More in detail, Material-1 and Material-2 are wooden board with different dimensions and densities. Material-3 is a laminated board consisting of 2 layers of cork (1 mm thick) with a 10 mm polystyrene layer in between. Three materials (4, 5, and 6) are polyehtylene foams with different stiffness. Material-7 is a film of heatshrink polyolefin, whereas Materials-8 and Materials-9 are silicone cylinders. They are casted using the same material, have the same shape, and are visually identical. The only difference is that the second one embeds eight M4 stainless steel nuts.
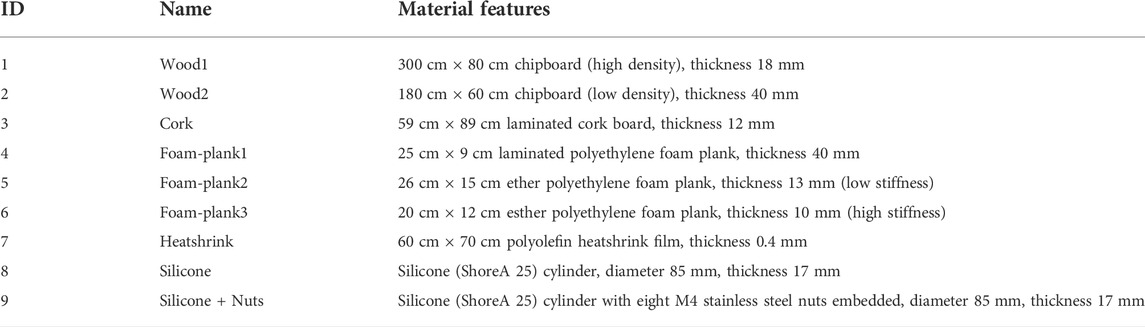
TABLE 1. The 8 different materials (ID 1–8) and the defected one (ID 9) considered for the purpose of this work.
The rationale behind the choice of this sample of materials is to have a dataset suitable for testing the capability of the approach in distinguishing between both similar and different materials. Indeed, hard (1, 2, 3) and soft (4, 5, 6) materials are similar to each other in terms of mechanical characteristics, but theydiffer notably from the ones belonging to the other group. Material-7 presents intermediate characteristics between a soft and a hard material. In addition, the inclusion of the two silicone cylinders (8 and 9) aimed at Single-Sided Amplitude Spectrum of x(t) assessing the feasibility in discerning materials having slight changes in relation to each other. In particular, in the case of silicones we simulate the case of having a defected material with non-visibile imperfections.
2.3 Data acquisition and preprocessing
To ensure acquisition repeatability and carry out a fair comparison between materials, we designed the following acquisition protocol.
In each acquisition session, the actuator and the sensor are positioned at fixed distance, i.e., 3 cm along the y-axis of the accelerometer, as visible in Figure 1. Such a distance is measured with a calliper to ensure uniformity, and both voice coil and accelerometer are attached to the surface by means of double sided adhesive tape. As demonstrated in (Miller et al., 2018), adhesive coupling does not affect the vibration propagation in the considered range of frequencies. The y-axis of the accelerometer is placed parallel to the line passing through sensor and actuator centres, with the positive direction pointing away from the actuator, the x-axis is perpendicular to the object surface, with the positive direction pointing upwards, and the z-axis completes the right-handed coordinate system. It is worth to notice that the exploitation of a tri-axial accelerometer allows to capture not only how the signal propagates along the direction of main solicitation, but also how it propagates on the orthogonal plane, along the radial and the tangential directions (y- and x- axis, respectively).
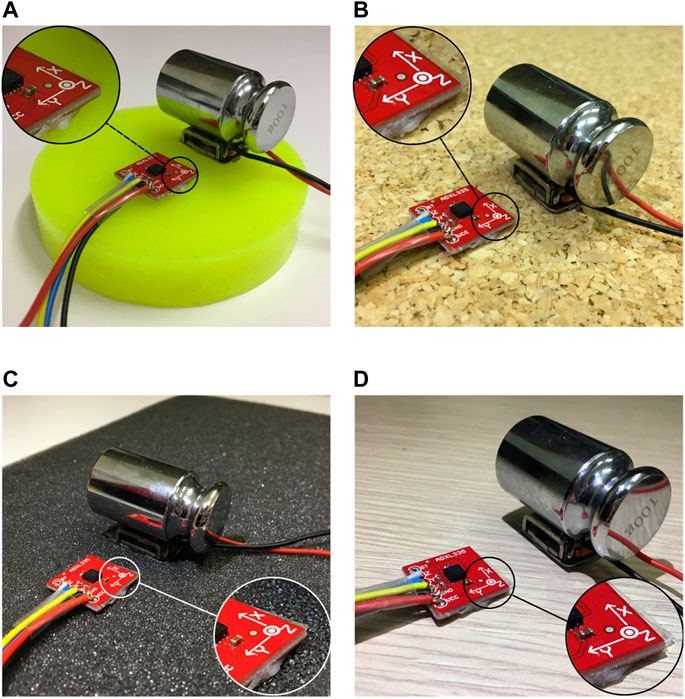
FIGURE 1. The sensing and acting part of the system placed on four different materials. In (A) the system is analysing a silicone cylinder, in (B) a cork board, in (C) a foam plank, whereas in (D) a wooden board. The voice coil is loaded with a 100 g weight. The accelerometer is placed at 3 cm far from the voice coil, along the accelerometer y-axis.
Before the material stimulation, the accelerometer is sampled for 5 s for calibration purposes. Then, the material is stimulated with sinusoidal vibrations of frequency in the range from 100 to 500 Hz, with a step of 50 Hz. Each signal lasts 5 s, with a pause of 1 s in between. The entire set of fixed-frequency signals is repeated 5 times.
For the dataset collection, each material was sampled in 6 acquisition sessions. At the beginning of each session, some slight changes were introduced in the arrangement of accelerometer and voice coil, meaning that they were located in different positions on the material, while their relative distance was kept constant. Moreover, a variation of maximum 8° of the relative orientation of the sensing and actuation parts was allowed. In other words, we intentionally introduced some small uncertainties on the components location, in order to reduce the bias due to the hardware placement, and achieve a more robust representation of the way the signal propagates.
During the mechanical stimulation, materials response was collected for each fixed-frequency signal.
A Fourier analysis of the signal propagated through the material in each direction (along x-, y-, and z- axis) was performed, and the spectrum of the signal was retrieved via Fast Fourier Transform (FFT). As it can be seen in Figure 2, spectrums were characterized by a peak at the generated frequency (fundamental harmonic) followed by higher harmonics. In this work, after a preliminary visual inspection of the spectra, we considered the amplitude of the first 4 harmonics to be descriptive of the material response. For the purposes of this work, we analysed 9 materials (see Section 2.2). Hence, overall we collected 2430 fixed-frequency signals (9 materials sampled in 6 sessions, each session consisting of 9 frequencies conditions repeated 5 times). From each acquisition, we extracted 4 samples per frequency per axis of the signal spectrum (i.e., the amplitude of the principal peak plus the amplitude of three higher harmonics). Finally, samples were joined such that each row of the dataset contained the information regarding a single repetition of the entire set of fixed-frequency signals, that is amplitudes of the four considered harmonics along the three axes generated by the 9 fixed-frequency signals. In this way, collected data are represented by a matrix X ∈ R270×108 containing the implicit signatures of the materials. To properly classify the tuples, a categorical label (i.e., the material ID) was attached to each dataset row.
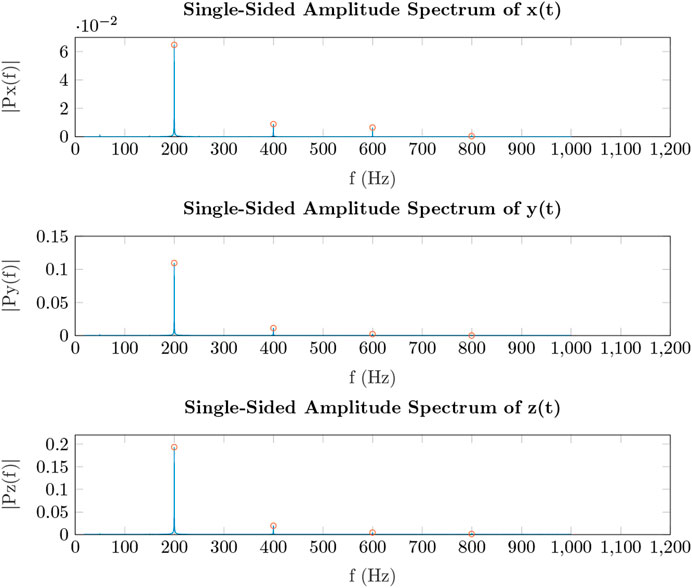
FIGURE 2. Representative amplitude spectrum of the signal propagated through the Material-4 along x-, y-, and z- axis, and related to a vibration of 200 Hz.
3 Material discrimination
Preliminary investigations were conducted to identify the most suitable learning approach. The focus was put on SVMs, naive-Bayes classifiers, k-NNs and MLPs. Extensive grid-search was performed for the selection of the hyperparameters.
SVMs and naive-Bayes led to remarkably unsatisfying performance (less than 40%). MLPs with more than one hidden layer achieved performance comparable with MLP with only one hidden layer at the cost of a high number of hidden neurons (in the range 60–90), otherwise they performed worse. By accounting for the Occam’s razor principle, also known as the “principle of parsimony”, we focused the efforts on MLPs with one hidden layer and kNNs, that were the most promising approaches.
The investigation carried out in this section had a two-fold aim: i) investigate whether processing a mechanical vibration signal that propagates in a material is a viable means for material classification, and ii) find the most compact and efficient representation of such signals for such a aim. In addition, the challenge we want to address in this work is not only to distinguish materials having gross differences (problem P1), but also to detect whether a material underwent some slight changes in its structure. Such changes can be related to some material flaws (problem P2, e.g., materials incorporating small pieces of other materials). To tackle the two different challenging problems, we exploited two different subsets of the dataset described in Section 2.3:
i) Dataset1 is aimed at providing insights on P1. It is composed of eight different materials. More in detail, we included in this dataset all the materials described in Table 1 except for Material-9 (Silicone + Nuts). It contains all the recorded acquisitions for the eight materials, for a total of 240 samples.
ii) Dataset2 is used for addressing P2. It consists of 80 samples. It is composed of all the 30 Material-8 tuples, 26 tuples of Material-9 (randomly sorted among the 30 available), and 24 tuples randomly sorted among all the other materials.
The rationale behind Dataset2 is that we were interested in performing a correct detection of the target material (Silicone in this case) by discriminating such a material from a similar material (i.e., Silicone + Nuts) without a specific focus on the particular defect affecting the material (i.e., the Nuts). This is the reason why in Dataset2 we exploited also non-silicone materials. By keeping in mind future applications, this approach can be related to the verification of conditions of healthy skins, and at the same time to the detection of conditions which are different from the desired one and needs further and more specificinvestigation for a better characterization.
Due to their nature and to the problem to be addressed, Dataset1 led to a multi-class classification problem, while Dataset2 to a binary classification problem.
The amplitude of non-fundamental harmonics rapidly decreases as the harmonic order grows. To let all the interested harmonics play a non-negligible role in the material representation, data were normalized (zero-mean, unit-variance). This way, although the information on the intra-material signal absorption is lost, the relation between the amplitudes belonging to different materials is kept (under the same harmonics).
Concerning the signal processing, as a first step we investigated if the representations of the different materials provided in terms of the amplitudes of the first 4 harmonics generated by the 9 fixed-frequency signals along the x-, y- and z- axis generate a geometry-based partition of the features space. If this would be the case, simple geometric heuristics could have been devised for category discrimination. Hence, a clustering approach based on distance metrics was pursued. Moreover, to avoid the “curse of dimensionality” that would cause a collapse of all the data points in almost a single point (Gori, 2017), we performed Principal Component Analysis to achieve dimensionality reduction. For each dataset, we exploited for further processing the first j components of the transformed data that could explain at least 90% of the variance among the original data. In the following, for the sake of brevity, we will refer to the exploitation of such a dimensionality reduction with the expression ‘A1’. Then, k-means clustering was performed, with k equal to the number of classes describing the problem at hand. Since the k-means approach is potentially highly sensitive to the initialization of the centroids, the i-th centroid was initialized with the prototypical element belonging to the class i. With the expression ‘prototypical element’, we refer to an element that belongs virtually to a given class and represents the most that class, being computed by averaging the patterns belonging to that class. Results, reported in Figure 3, show that we are able to correctly classify Material-1, Material-3, Material-4, Material-5, and Material-8, while the other identifications result poor (Material-6, Material-7), or completely wrong (Material-2). From what has been argued so far, although the PCA allowed to retrieve a compact, meaningful representation of the data, the data we process transformed with PCA do not lie in well-separated regions of the feature space. Hence, a classification of materials relying on similarity measures based on geometric distances would not provide sufficiently reliable results.
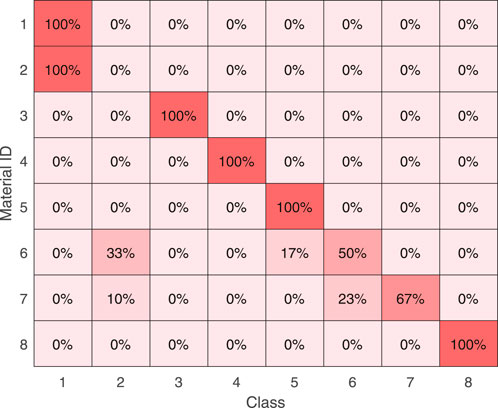
FIGURE 3. The confusion matrix reporting the percentage of material clusterization using the k-means approach. Ten PCs are used to explain at least the 90% of the variance among the original data.
Thus, we implemented two Machine Learning-based approaches, i.e., the k-Nearest Neighbours (kNN) and the Multi-Layer Perceptron (MLP).
Also in these cases we exploited the dimensionality reduction previously investigated. Hence, the input fed into such algorithms consisted in the above mentioned first j components explaining at least the 90% of the variance among the data for each learning problem at hand (P1, P2).
Firstly, the strategy was to exploit a k-Nearest Neighbours approach to achieve material classification (P1) and to have insights on possible past processes applied to the material and leaving permanent marks (P2). kNN is a supervised algorithm that assigns a class to a pattern by means of majority voting conducted on the k-nearest neighbours of the pattern at hand, i.e., the pattern is assigned to the most common class among its k-nearest neighbours. We used the L2-norm as distance metrics. The parameter k was considered to be an hyperparameter, and assumed integer odd values in the range [1, 15]. To select the value of k allowing the highest classification performance, we followed a k-fold cross-validation approach, where each block consisted of 5 datapoints. Results are reported in Table 3, while the average confusion matrices for P1 and P2 are reported in Figure 5A and Figure 6A, respectively.
To investigate if a better result could be obtained with a more complex Machine-Learning approach, we exploited a Multi-Layer Perceptron with one hidden layer. The categorical (balanced and non-balanced) cross-entropy was set as loss function, while sigmoid and softmax were selected as activation functions of the hidden and the output layers, respectively. Accuracy was chosen as metric to evaluate the neural network performance, k-fold cross-validation was implemented as previously done for the kNN, and Adam optimizer was exploited. Grid search for the hyperparameters reported in Table 2 was performed. Then, we selected as best solution for each learning problem the neural network achieving the highest accuracy. Results are reported in Table 3 The confusion matrices detailing the neural network classification performance for P1 and P2 are depicted in Figure 5D and Figure 6D, respectively. It can be noticed that, concerning P1 (materials classification), the performance achieved by the kNN and by the MLP are the same, suggesting that no more knowledge can be extracted from the acquired data. Moreover, it can be noticed that 6 materials are perfectly classified, while the remaining 2 are classified with an accuracy greater than 80%.
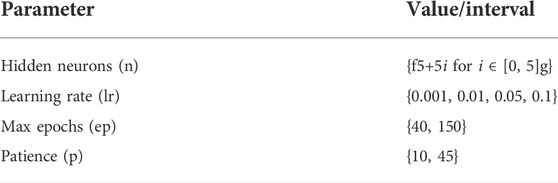
TABLE 2. Hyperparameters table.
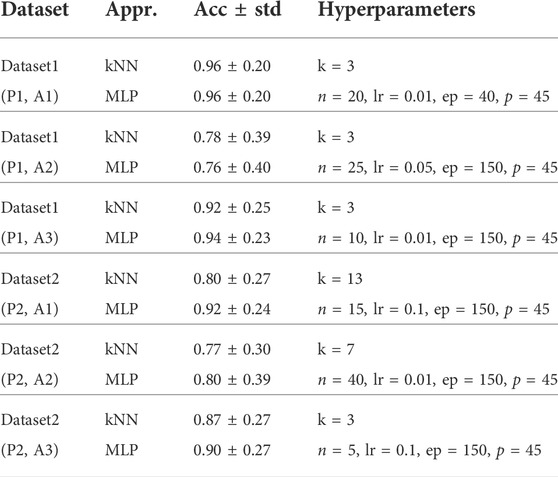
TABLE 3. Results for material classification (P1) and material identification (P2) using MLPs and kNNs. A1, A2, and A3 refer to different approaches for dimensionality reduction of the original feature space. Average accuracy and standard deviation are reported, as well as the hyperparameters of the selected models.
Concerning P2, the kNN and the MLP achieve the same accuracy in the detection of the Silicone material. However, the solution with MLP is preferable, because it has higher accuracy in the detection of the Non-silicone class, as revealed also by the average accuracy (92% vs. 80%). From such results, we can affirm that the Principal Component Analysis allowed us to retrieve a compact, meaningful representation of the data. However, it must be highlighted that it comes from the exploitation of the signal propagation along 3 spatial axes, and accounts for the 9 different vibrations applied to the material. Nonetheless, generally speaking, making materials undergo multiple vibratory stimuli can be not recommended, due to the risk of damaging the object. Moreover, the less is the number of components to be tested, the faster is the data collection and processing procedure. For the aforementioned purposes, we investigated whether a more compact data representation could be obtained.
With the aim of having a subset of variables with a lower dimensionality, but still representative, we adopted the following selection of the original directions. We computed the PCA on the original non-normalized data and we extracted the first PC, which has dimension 108 × 1 and explains about the 76% of the variance among the original directions. Each component of the first PC represents the cosine of the angle between a given original direction and the direction expressed by the first PC itself. As a direct consequence, the closer is the PC component to one, the higher is the proportion of the variance that the associated original direction represents.
This investigation suggested to exploit only the 6 original features describing the amplitude of the fundamental harmonic generated by the vibrations with frequency in the range 250–500 Hz along the z-axis. In the following, for the sake of brevity, we will refer to the exploitation of such a dimensionality reduction with the expression “A2”. The vector composed by the selected components had norm of about 0.95, hence, the remaining components carried little information and can be neglect as a first approximation. The fact that the features related to the amplitude of the first harmonics play a remarkable role is coherent with the fact that the z-axis is the direction of main solicitation. Then, we approached problems P1 and P2 by exploiting kNN and MLP on such data (with the same approach to the learning process previously described). Results are shown in Table 3, while Figure 5B reports results for P1 exploiting the kNN, and in Figure 5E are the results obtained with the MLP approach. Similarly, Figure 6B and Figure 6E depict outcomes for P2 using kNN and MLP strategy, respectively.
Concerning P1, the main difference between the kNN and MLP performance is that the kNN achieves an accuracy ≤50% for Material-7, while the MLP shows an accuracy greater than the 50% for each material, although it is less precise than the kNN in all the classifications. Concerning P2, although the average accuracy is higher for the MLP, the kNN solution is preferable, because it has higher accuracy in the detection of the Silicone class (73% vs. 50%). We further inspected such an unsatisfying result, by retrieving and comparing means and standard deviations of the data related to such features. A graphical representation of data belonging to Dataset1 is shown in Figure 4. As it can be noticed, data related to different materials are significantly overlapped, by making the classification really arduous to achieve. Similar results were achieved for P2. So we strive to find a still compact but more effective representation of the materials. By accounting for the fact that the amplitude of the provided solicitation is proportional to the signal frequency (see Eq. 1), and that the propagation of the signal through the material causes a decrement in the signal amplitude (due to energy dissipation), we decided to further process data related to the solicitation at 500 Hz. More specifically, we decided to account for all the components of the signal propagated along the three spatial directions, and for all the first four harmonics. We will refer to this approach with the expression “A3”. MLPs and kNNs were used to deal with this formulation of the P1 and P2 learning problems (adopting the previously described pipeline for the implementation of the learning process). Results are reported in Table 3, and more details on the confusion matrices are shown in Figures 5C–F and in Figures 6C–F for P1 and P2, respectively. Concerning P1, it can be noticed that the MLP achieves a classification accuracy higher than the kNN for Material-6 and Material-7, while slightly lowering the performance on Material-4. Concerning P2, the solution with MLP has higher detection rate of the Silicone class than what is achieved by the kNN, with slightly lower accuracy in the other class. Hence, the MLP solution has to be preferred also in this case.
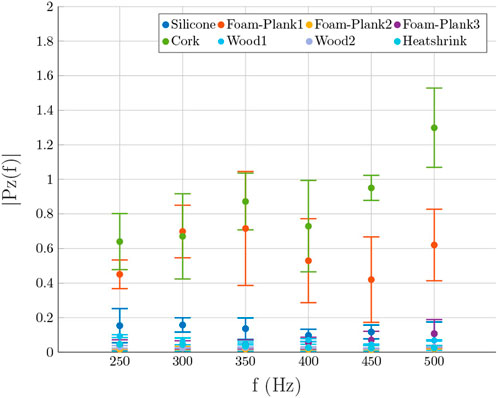
FIGURE 4. Mean and standard deviations of the amplitudes of the first harmonics along the z-axis for the considered materials.
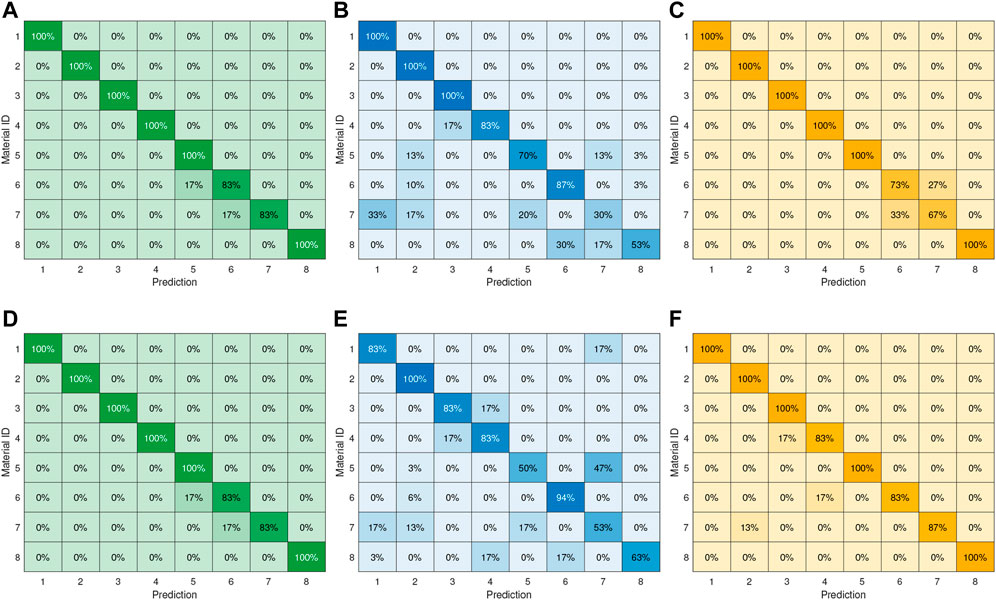
FIGURE 5. The confusion matrices reporting the percentage of correct prediction using the kNN algorithm (upper panel) and the MLP (lower panel) for solving P1. In (A) and (D), ten PCs are used to explain at least the 90% of the variance among the original data. In (B) and (E), data are represented by six original features describing the amplitude of the fundamental harmonic generated by the vibrations with frequency in the range 250–500 Hz along the z-axis. In (C) and (F), only the original components related to the vibration at 500 Hz (i.e., peaks of the first four harmonics along the three spatial directions) are considered for data description.
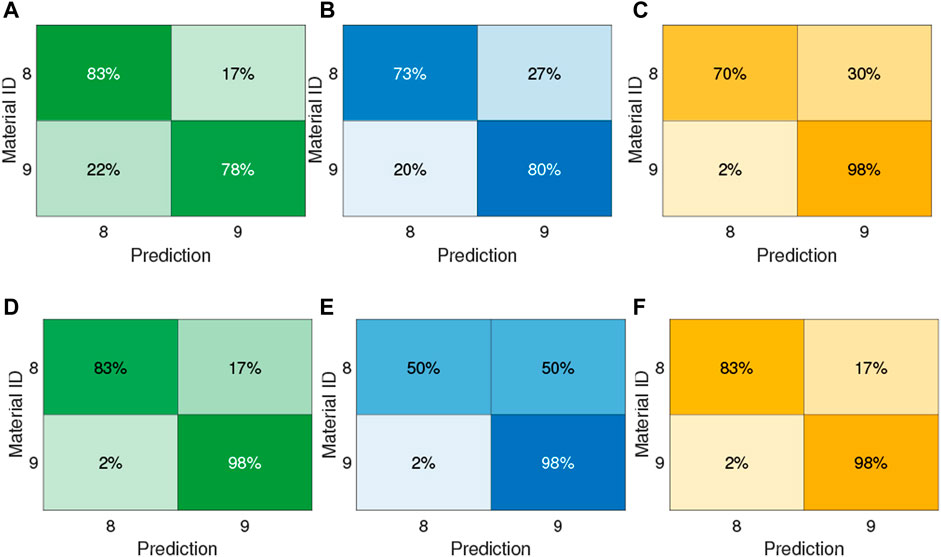
FIGURE 6. The confusion matrices reporting the percentage of correct prediction using the kNN algorithm (upper panel) and the MLP (lower panel) for solving P2. In (A) and (D), ten PCs are used to explain at least the 90% of the variance among the original data. In (B) and (E), data are represented by six original features describing the amplitude of the fundamental harmonic generated by the vibrations with frequency in the range 250–500 Hz along the z-axis. In (C) and (F), only the original components related to the vibration at 500 Hz (i.e., peaks of the first four harmonics along the three spatial directions) are considered for data description.
If we compare the performance in A2 and A3, results highlight that, although the exploitation of the Principal Component Analysis led us to discard the signal components orthogonal to the direction of the main solicitation (x- and y- components of the propagated signal), they are game changer. As previously shown, indeed, data related to the direction of main solicitation are not sufficiently separable. In A3, instead, we show that the apparently little contributions provided by the x, y components of the propagated signal significantly enhance the discriminative power of the Machine Learning-based algorithms.
4 Conclusion and future work
In this work, we presented a novel method for discriminating different materials by exploiting active stimulation with vibrations. Together with the methodology, we provided a system setup which is thought to be easily adopted outside the laboratory and can be further extended in multiple contexts.
Three different procedures have been examined and compared, i.e., one relying on a clustering-based algorithm, and two implementing Machine Learning-based techniques. Mechanical vibrations with different frequencies have been utilised for the purpose of classification, however, active stimulation with sinusoidal signals having a frequency of 500 Hz demonstrated to provide a compact and meaningful representation of the data, sufficient to categorize 8 different materials, and to distinguish reference materials from other defective materials, with an average accuracy greater than 0.90.
Results of the present analysis confirmed the feasibility of the proposed approach, which can have two main applications: classification of different materials and identification of the material state, i.e., identification of whether a material is intact or underwent some slight changes in its structure. Current limitations of the method arises from having considered only flat materials in the study. Further analysis will be done to assess the effect of the object shape on the validity of our approach.
To conclude, this work paves the way for using active material stimulation through vibration and Machine Learning techniques in multiple real-world applications that require material characterization and discrimination.
Data availability statement
The raw data supporting the conclusions of this article will be made available by the authors, without undue reservation.
Author contributions
TL and DP were project coordinators, they contributed to the conception and design of the study. ND and TL worked on the experimental setup and ran the experiments. SM and DP proposed the algorithms and supervised the experiments. TL, SM, and ND were principal investigators and wrote the manuscript. All authors contributed to manuscript revision, read, and approved the submitted version.
Funding
This work was supported by Progetto Prin 2017 “TIGHT: Tactile InteGration for Humans and arTificial systems”, prot. 2017SB48FP.
Conflict of interest
The authors declare that the research was conducted in the absence of any commercial or financial relationships that could be construed as a potential conflict of interest.
Publisher’s note
All claims expressed in this article are solely those of the authors and do not necessarily represent those of their affiliated organizations, or those of the publisher, the editors and the reviewers. Any product that may be evaluated in this article, or claim that may be made by its manufacturer, is not guaranteed or endorsed by the publisher.
References
Al-Bkree, M. (2018). Material classification based on vibration analysis. Műszaki Tudományos Közlemények 9, 23–26. doi:10.33894/mtk-2018.09.01
Attallah, O., and Sharkas, M. (2021). Intelligent dermatologist tool for classifying multiple skin cancer subtypes by incorporating manifold radiomics features categories. Contrast Media and Mol. Imaging 2021, 1–14. doi:10.1155/2021/7192016
Bossi, R., and Giurgiutiu, V. (2015). Nondestructive testing of damage in aerospace composites. Polym. Compos. Aerosp. Industry, 413–448.
Goceri, E. (2021). Deep learning based classification of facial dermatological disorders. Comput. Biol. Med. 128, 104118. doi:10.1016/j.compbiomed.2020.104118
Kopec, D., Kabir, M., Reinharth, D., Rothschild, O., and Castiglione, J. (2003). Human errors in medical practice: Systematic classification and reduction with automated information systems. J. Med. Syst. 27, 297–313. doi:10.1023/a:1023796918654
Kroeger, T. (2014). Thermographic inspection of composites. Reinf. Plast. 58, 42–43. doi:10.1016/s0034-3617(14)70183-3
Li, C., Guan, G., Reif, R., Huang, Z., and Wang, R. K. (2012). Determining elastic properties of skin by measuring surface waves from an impulse mechanical stimulus using phase-sensitive optical coherence tomography. J. R. Soc. Interface 9, 831–841. doi:10.1098/rsif.2011.0583
Memmolo, V. (2018). Structural health monitoring of complex structures based on propagation and scattering of guided ultrasonic waves in composite media. Naples, Italy: University of Naples “Federico II”.
Miller, A., Sburlati, D., and Duschlbauer, D. (2018). Accelerometer mounting–comparison of stud and magnetic mounting methods. Proc. Acoust. 7.
Montalvao, D., Maia, N. M. M., and Ribeiro, A. M. R. (2006). A review of vibration-based structural health monitoring with special emphasis on composite materials. Shock Vib. Dig. 38, 295–324. doi:10.1177/0583102406065898
Nyffenegger, P. A., Hinich, M. J., Ritter, D., and Hansen, S. (2004). Material discrimination using bispectral signatures. J. Acoust. Soc. Am. 116, 1518–1523. doi:10.1121/1.1780169
Peng, W., Zhang, Y., Qiu, B., and Xue, H. (2012). A brief review of the application and problems in ultrasonic fatigue testing. Aasri Procedia 2, 127–133. doi:10.1016/j.aasri.2012.09.024
Sarasini, F., and Santulli, C. (2014). Non-destructive testing (ndt) of natural fibre composites: Acoustic emission technique, Nat. Fibre Compos., 273–302. doi:10.1533/9780857099228.3.273
Su, Z., Zhou, C., Hong, M., Cheng, L., Wang, Q., Qing, X., et al. (2014). Acousto-ultrasonics-based fatigue damage characteri- zation: Linear versus nonlinear signal features. Mech. Syst. Signal Process. 45, 225–239. doi:10.1016/j.ymssp.2013.10.017
Vavilov, V., Budadin, O., and Kulkov, A. (2015). Infrared thermographic evaluation of large composite grid parts subjected to axial loading. Polym. Test. 41, 55–62. doi:10.1016/j.polymertesting.2014.10.010
Vijayalakshmi, M. (2019). Melanoma skin cancer detection using image processing and machine learning. Int. J. Trend Sci. Res. Dev. (IJTSRD) 3, 780–784. doi:10.31142/ijtsrd23936
Keywords: vibration, discrimination, haptic (vibration), haptic sensing technology, industry—4.0
Citation: Lisini Baldi T, Marullo S, D’Aurizio N and Prattichizzo D (2022) Discriminating different materials by means of vibrations. Front. Manuf. Technol. 2:939755. doi: 10.3389/fmtec.2022.939755
Received: 09 May 2022; Accepted: 05 July 2022;
Published: 11 August 2022.
Edited by:
Aleksandar Vakanski, University of Idaho, United StatesReviewed by:
Sita Ram Sharma, Chitkara University, IndiaBoyu Zhang, University of Idaho, United States
Copyright © 2022 Lisini Baldi, Marullo, D’Aurizio and Prattichizzo. This is an open-access article distributed under the terms of the Creative Commons Attribution License (CC BY). The use, distribution or reproduction in other forums is permitted, provided the original author(s) and the copyright owner(s) are credited and that the original publication in this journal is cited, in accordance with accepted academic practice. No use, distribution or reproduction is permitted which does not comply with these terms.
*Correspondence: Tommaso Lisini Baldi, dG9tbWFzby5saXNpbmlAdW5pc2kuaXQ=