 Masakazu Aruga
 So Ito
- Department of Intelligent Robotics, Faculty of Engineering, Toyama Prefectural University, Imizu, Japan
The inner diameter measurement of the micro-hole was performed by a tactile microprobing system using a method of the local surface interaction force detection. The inner diameter of the micro-hole was calculated by the least square method based on the probing coordinates obtained by a custom-made micro-coordinate measuring machine. The dispersion of the probing coordinates was investigated by changing the probe approaching direction with respect to the normal direction of the inner side of the micro-hole. During the probing inside the micro-hole, it was confirmed that the dispersion of the probing coordinates increased when the disagreement between the probe approaching direction and the normal direction of the micro-hole at the measured point became large. The influence of the dispersion of the probing coordinates was evaluated through the uncertainty analysis of the inner diameter measurement. It was revealed that the uncertainty of the inner diameter measurement could be improved when limiting the disagreement between the probe approaching direction and the normal direction of the micro-hole to within ±pi/4 rad.
1 Introduction
Small holes with inner diameters of less than 0.5 mm, which are often called micro-holes (Masuzawa, et al., 1993), are widely used as inkjet printer nozzles, internal combustion engine fuel injector spray holes, and pinholes in optical systems, and in three-dimensional electronic circuit packaging wiring (Wilson, 1995; Kao and Shih, 2007; Sato, et al., 2020). The fabrication of micro-holes on the surface of a workpiece to control the hydrophobicity (Cai, et al., 2018) and tribological properties (Song, et al., 2018) of the surface have also been studied. Therefore, micro-hole fabrication is an important technique in manufacturing. Various fabrication methods, such as miniaturized machine tools (Aziz, et al., 2012; Li, et al., 2021), electrical discharge machining (EDM) (Tong, et al., 2013) and electrochemical discharge machining (ECDM) (Saranya and Sankar, 2018; Arab, et al., 2019), have been proposed to realize micro-holes with fine inner diameters and high form accuracy. Laser processing machining, which includes laser drilling, is also widely used to form micro-holes with high aspect ratios, and can be used to form micro-holes in various materials such as glass (Sato, et al., 2020), metals (Sato, et al., 2020), alloys (Gupta, et al., 2016; Marimuthu et al., 2019), silicon carbide (Krüger, et al., 2007), and glass epoxy. Furthermore, the machining time in the laser drilling is generally shorter than that in machining or EDM/ECDM, and many micro-holes can be fabricated in a short time without tool wear. However, the inner diameters of the micro-holes fabricated by laser drilling are often ununiform along the depth direction, and the micro-holes often have a tapered or barrel cross-sectional shape (Krüger, et al., 2007; Gupta, et al., 2016; Marimuthu et al., 2019). Consequently, the inner diameters of the micro-holes do not necessarily coincide with the opening diameters at the surface. The inner diameter measurement of micro-holes has been performed by scanning electron microscopy (SEM) observation of split micro-hole specimens. This is a destructive inspection, and the sample preparation is time-consuming. In addition, it is difficult to calculate geometrical tolerances, such as the straightness of the micro-holes, from measurements of the inner diameters through SEM observations. Optical method represented by MLP-3 (Mitaka Kohki Co., Ltd.) can measure the inside of the hole non-destructively, however, there is a trade-off between increased measurable depth and resolution.
Coordinate measuring machines (CMMs) that employ tactile probing system provide a practical means of measuring complex dimensions, including the inner diameter and depths of micro-holes (Weckenmann, et al., 2004; Claverley and Leach, 2015). In recent years, CMMs using microprobes incorporating probe tip balls with diameters of less than 1 mm have been developed (Weckenmann, et al., 2006; Weckenmann and Schuler, 2011; Thalmann, et al., 2016). Because the position of the inner wall can be directly determined by inserting the tip ball of the microprobe inside the micro-hole, the inner diameter and form of the micro-hole can be measured non-destructively (Murakami, et al., 2014; Elfurjani, et al., 2016). In CMMs that uses tactile probing systems, the deformation of the measured point or probe tip ball due to the measurement force of the tactile probe causes measurement errors (Weckenmann, et al., 2004; Weckenmann and Schuler, 2011). Therefore, probing systems with vibrating micro-styli have been developed to reduce the measurement force (Claverley and Leach, 2010; Bos, 2011). The probing systems with the vibrating micro-styli detect the change in the vibration state of the micro-styli due to the intermittent contact of the probe tip or the interaction force, and the vibration changes are used as a trigger signal for probing. In the authors’ previous works, probing was performed by using a vibrating micro-stylus to detect the local surface interaction force near the surface of the measured workpieces (Ito, et al., 2016a; Ito et al., 2016b; Chen, et al., 2016). The stylus vibration along the main axis of the stylus shaft in the microprobing system was employed to detect the local surface interaction force in all directions around the main axis (Ito, et al., 2020). However, in probing on a cylindrical pin gauge, the dispersion of the probing coordinates increased as the disagreement between the probe approaching direction and the normal direction of the measured object became larger. As the similar studies, the precision measurements of the vertical side walls of the microstructures have been performed using the microprobing systems (Li, et al., 2018; Metz, et al., 2019; Dai, et al., 2020). In these studies, the probing was performed on the vertical flat planes, therefore, probing repeatability due to difference of the probe approaching directions was not focused.
In this study, the inner diameter measurement of the micro-hole was conducted by using a microprobing system with a method of local surface interaction force detection. A micro-stylus with a tip ball of less than 50 μm in diameter was fabricated from a capillary glass tube for probing inside the micro-hole with a diameter of less than 80 μm. The probing characteristic derived from the disagreement between the probe approaching direction and normal direction of the micro-hole was evaluated as the repeatability of the probing coordinates. The inner diameter of the micro-hole was calculated by applying the least squares method to the probing coordinates. The influence of the probing repeatability on the inner diameter measurement due to the difference in probe approaching direction was estimated as measurement uncertainty.
2 Experimental method
2.1 Microprobing system
The tip of the microprobe was formed into a spherical shape owing to maintain a uniform shape in all direction inside the micro-hole. A micro-stylus with an aspherical tip was fabricated from a glass capillary tube. After the glass capillary tube was sharpened through a thermal pulling process, the sharpened edge of the glass tube was melted using a platinum heater in a microforge (MF2, NARISHIGE). The edge of the melted glass tube formed into a sphere spontaneously because of surface tension. Figure 1A shows a microphotograph of the spherical micro-stylus tip fabricated from a glass capillary tube. The diameter of the stylus tip ball was measured by an optical microscope (NH-3S, Mitaka Kohki) with lateral resolution of 0.1 μm. The diameter of the probe tip ball,
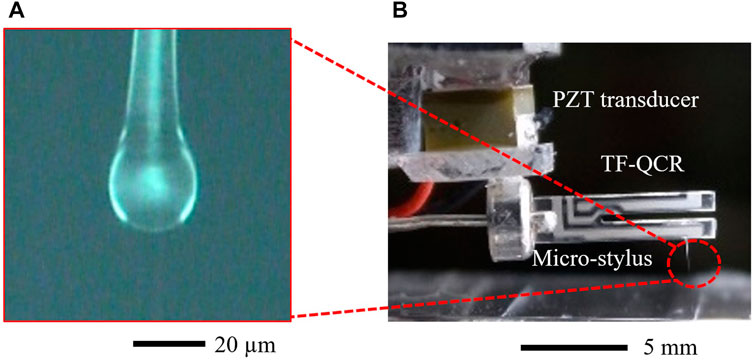
FIGURE 1. Photograph of microprobe used in this study. (A) Microphotograph of a spherical tip of a micro-stylus. (B) Probe vibration sensor made of tuning fork quartz crystal resonator (TF-QCR).
When the tip of the vibrating microprobe is coming close to the surface of the workpiece, the resonance frequency of the microprobe vibration is changed due to the local surface interaction force. The local surface interaction force is roughly divided into repulsive force and attractive force. The local repulsive force is mainly caused by contact or intermittent contact between the tip of the vibrating microprobe and the surface of the workpiece (Goj, et al., 2014). The local attractive force is derived from various non-contact interaction such as van deer Waals force, electrostatic force, and adhesion force of the surface thin water layer. When the local repulsive force acts the tip of the microprobe, the resonance frequency of the microprobe vibration is increased. On the other hand, the resonance frequency of the microprobe is decreased when the local attractive force is applied to the tip of the vibrating microprobe. In this study, the absolute value of the resonance frequency shift amount of the microprobe vibration is detected and utilized as a trigger signal for the probing. Figure 2 shows the configuration of the prototype microprobing system. The vibration signal from the TF-QCR is converted and amplified by a custom made current-to-voltage conversion circuit (I-V converter). The resonance frequency of the microprobe vibration fres is maintained by a self-excitation phase shifter circuit in a commercially available oscillation controller (OC4/RC4, Nanonis). The oscillation controller is designed for frequency modulation (FM) detection in dynamic-mode atomic force microscopes (AFMs) and maintains constant frequency and constant amplitude of the microprobe vibration by closed-loop control. The shift amount of the resonance frequency of the microprobe vibration due to the local surface interaction force, Δf, is detected by a phase-locked loop (PLL) circuit in the oscillation controller, which outputs as DC voltage signal that corresponds to the amount of frequency shift. The DC signal, which is called the Δf signal, is fed into an analog-to-digital (A/D) converter (USB-6003, National Instruments) connected to a personal computer (PC) as the trigger signal for probing. Probing was performed by moving the workpiece surface so that the surface approaches the tip of the microprobe to avoid noise caused by mechanical vibration during the movement of the probe (Weckenmann, et al., 2006).
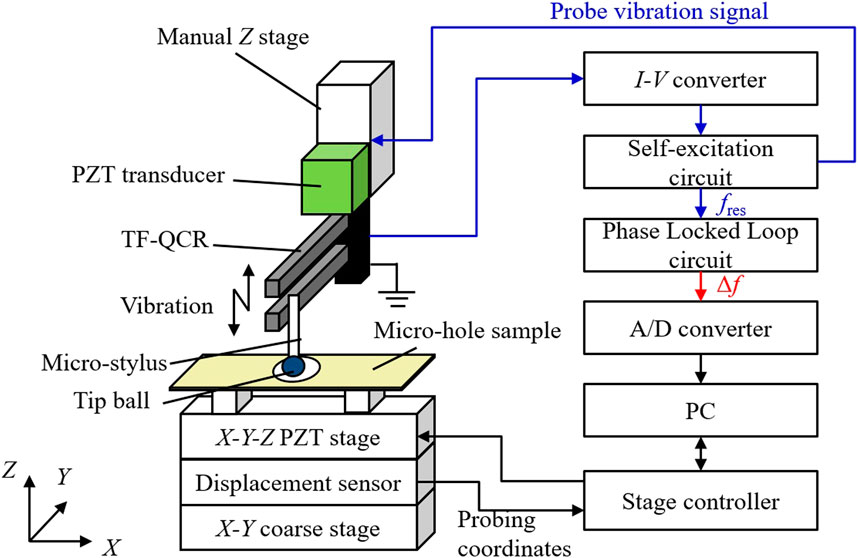
FIGURE 2. Configuration of microprobing system.
The measured workpiece was placed on the sample holder, which was a height of 25 mm, and mounted on a moving table of the PZT-driven X-Y-Z fine positioning stage (SFS-H60XYZ, SIGMAKOKI). The displacement of the stage table was measured by the built-in capacitive-type displacement sensors, and the position of the moving table was maintained by closed-loop control. The displacement sensors were installed 30 mm below the top of the stage table. The stroke and resolution of the fine positioning stage were 85 μm and 10 nm in each direction. The stage displacement when Δf became larger than a certain threshold value was employed as the probing coordinate. To align the micro-holes on the measured workpiece and the tip of the microprobe, the fine positioning stage was mounted on the moving table of a XY coarse positioning stage (SGSP-20-35, SIGMAKOKI) driven by stepper motors. The stroke and resolution of the coarse positioning stages were 35 mm and 2 μm, respectively. The micro-hole and the tip ball of the microprobe were aligned using the coarse positioning stage and two optical microscopes which were used to observe from the X and Y directions, simultaneously. Figure 3 shows microphotographs of micro-holes. In this study, a sample of blind micro-hole laser-processed on a copper/glass-epoxy/copper substrate was used. The nominal diameter of the micro-hole aperture was 80 μm, the axial depth of the micro-hole was 55 µm.
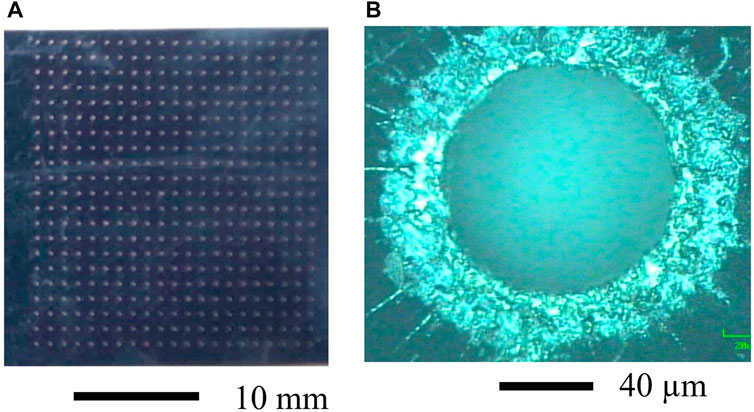
FIGURE 3. Microphotographs of micro-holes. (A) Micro-hole array on the substrate surface (B) Microphotograph of a micro-hole.
2.2 Calculation of micro-hole diameter from probing coordinates
To calculate the inner diameter of the micro-hole based on the acquired probing coordinates, the least squares method was introduced. Although the X-Y-Z PZT stage of the microprobing system could move along the X, Y, and Z-axes, the Z coordinate of the positioning stage was held constant during the probing inside the micro-hole. Therefore, the radius,
In the least square method,
where n is the number of probing coordinates, and A, B, and C are defined as follows:
The center coordinate,
where,
3 Experimental results and discussion
3.1 Measurement procedure
In the microprobing system used in this study, probing was performed by moving the micro-hole sample using the fine positioning stage. Therefore, the position of the microprobe was stationary during the actual measurement. However, for simplicity, the procedure is explained here using the relative motion of the microprobe tip. The movement of the micro-hole sample in the −X direction by the fine positioning stage corresponds to the relative movement of the microprobe in the +X direction, which is henceforth referred to as probing in the +X direction.
There are two methods for measuring the inner diameter of a hole using a tactile probing system. One is to bring the probe tip closer along the normal direction from the center of the hole. This method has been widely employed for commercially available macroscopic CMMs. However, it requires pre-measurement to calculate the center position of the hole. Therefore, the same hole must be measured at least twice, so it is time-consuming way. Another method is to move the probe in the XY direction along the moving axis of the fine positioning stages. Since this method can start to measure from any position inside the hole, the inner diameter can be calculated by one set of measurement. However, the probe approach direction does not always coincide with the normal direction of the micro-hole. The influence of disagreement between the probe approaching direction and normal direction of the micro-hole on the repeatability of probing was investigated. Figure 4 shows a schematic diagram of the trajectory of the probe tip in the micro-hole during the probing in the case of +X direction. To determine the surface position inside the micro-hole, the microprobe was moved in +X direction in steps of 10 nm per second. The microprobe coordinates in the Y and Z directions were kept constant via closed-loop control during probing in the +X direction. When the absolute value of the frequency shift Δf of the probe vibration exceeded a given threshold, the probe position is recorded as the probing coordinates. Probing was repeated five times at the same Y position. Then, the microprobe was then moved 5 μm in the +Y direction, and the probing in the +X direction was repeated in a similar manner. Probing in the −Y direction was conducted in the same condition. As mentioned in Section 2.2, the center of the approximated circle of probing coordinates can be calculated by the least square method. Figure 5 shows a schematic of disagreement between the probe approach direction and normal direction of the micro-hole. The disagreement was defined as the angle, between the probe approach direction and the normal direction of the micro-hole.
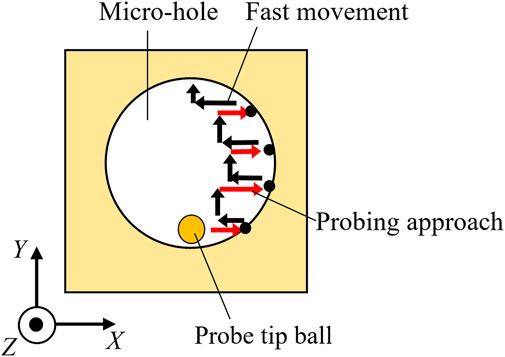
FIGURE 4. Trajectory of the probe tip in the micro-hole during the probing in +X-direction.
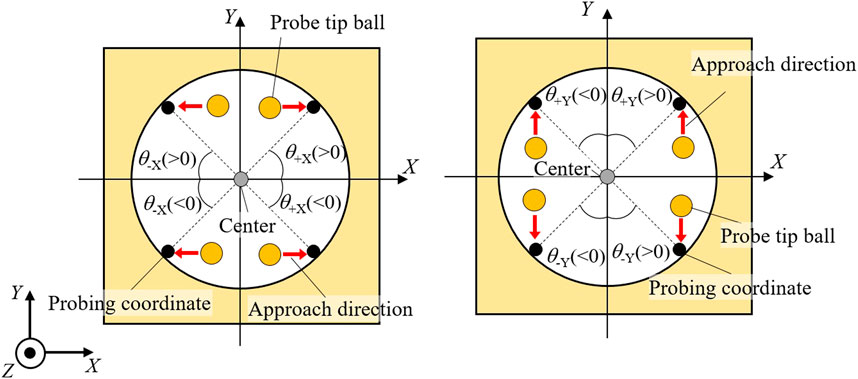
FIGURE 5. Schematic of disagreement of normal direction.
3.2 Probing repeatability and calculation of inner diameter
The probing inside the micro-hole was conducted at the depth of 30 μm from the surface of the substrate. The resonance frequency of the microprobe vibration was 32.331 kHz, and the threshold of Δf for the probing was set to 0.38 Hz. Blue plots in Figure 6 indicate the average values of probing coordinates repeated five times at the same location obtained by moving the probe tip closer to the inner wall of the micro-hole from the ±X directions. The error bars in Figure 6 show the maximum and minimum probing coordinates along the X direction. After probing in the +X direction, probing in the −X direction was immediately conducted on the opposite inner wall of the micro-hole. Since only the fine positioning stage was moved during the probing inside the micro-hole, the probing coordinates were calculated from the displacement of the fine positioning stages. The gray line and plot shown in Figure 6 are the approximated circle and center coordinate of the probing coordinates calculated by the least square method. The diameter of the approximated circle was calculated to be 48.2 μm, therefore, inner diameter of the micro-hole was evaluated to be 87.3 μm. The dashed lines in Figure 6 shows the minimum circumscribed circle and the maximum inscribed circle calculated from the average value of the X-directional coordinates at each probing position. The difference in radius between the minimum circumscribed circle and the maximum inscribed circle is evaluated to be 2.51 μm. Although the radius difference between the minimum circumscribed circle and the maximum inscribed circle is varies depending on the sphericity of the tip ball of the microprobe and the roundness of the micro-hole, it is also affected by the repeatability of the probing coordinates. Consequently, it is expected that the radius difference will decrease with the improvement of the probing repeatability. Figure 7 shows the relationship between the disagreement in
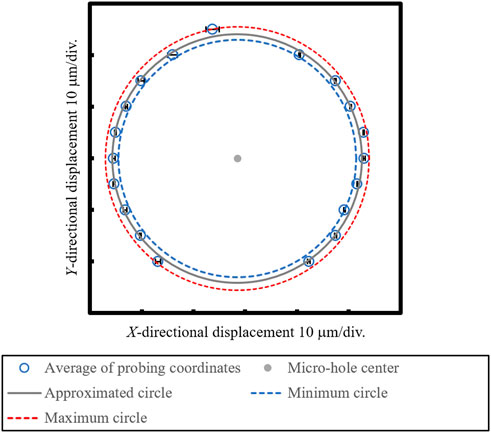
FIGURE 6. Probing coordinates inside the micro-hole in the X-direction.
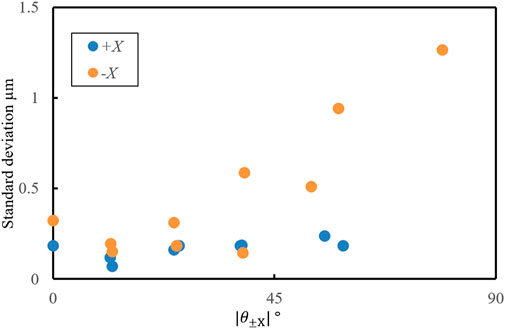
FIGURE 7. Relationship between the disagreement
Blue plots in Figure 8 shows the averaged probing coordinates repeated five times at the same location obtained by moving the probe tip closer to the inner wall of the same micro-hole from the ±Y directions. The error bars in Figure 8 show the maximum and minimum probing coordinates along the Y direction. The gray line and plot shown in Figure 8 indicate the approximated circle and center coordinate of the probing coordinates calculated by the least square method. The diameter of the approximated circle was calculated to be 49.4 μm, therefore, inner diameter of the micro-hole was evaluated to be 88.5 μm. The dashed lines in Figure 8 shows the minimum circumscribed circle and the maximum inscribed circle calculated from the average value of the Y-directional coordinates at each probing position. The difference in radius between the minimum circumscribed circle and the maximum inscribed circle is evaluated to be 2.35 μm. Figure 9 shows the relationship between the disagreement
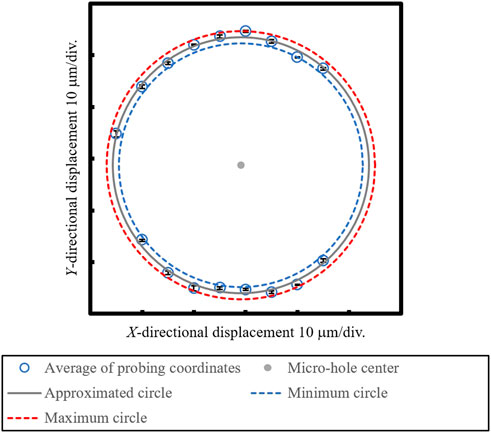
FIGURE 8. Probing coordinates inside the micro-hole in the Y-direction.
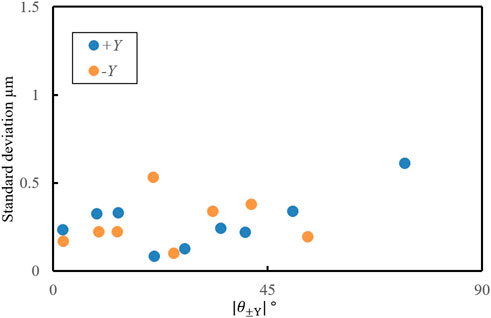
FIGURE 9. Relationship between the disagreement
In order to perform probing in all directions around the Z-axis in the micro-hole,
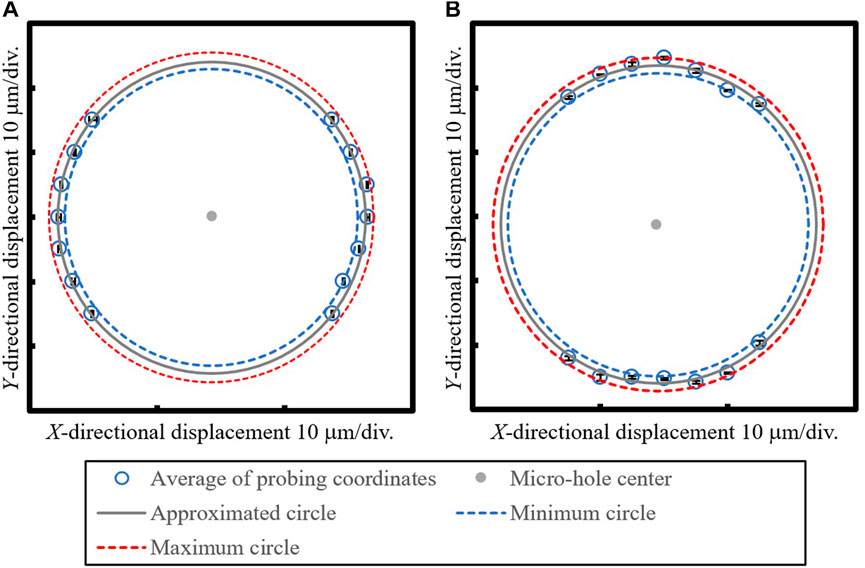
FIGURE 10. Probing coordinates inside the micro-hole in the X and Y-direction within range satisfying
3.3 Uncertainty analysis of inner diameter measurement
To evaluate the accuracy of the measurement of the micro-hole inner diameter,
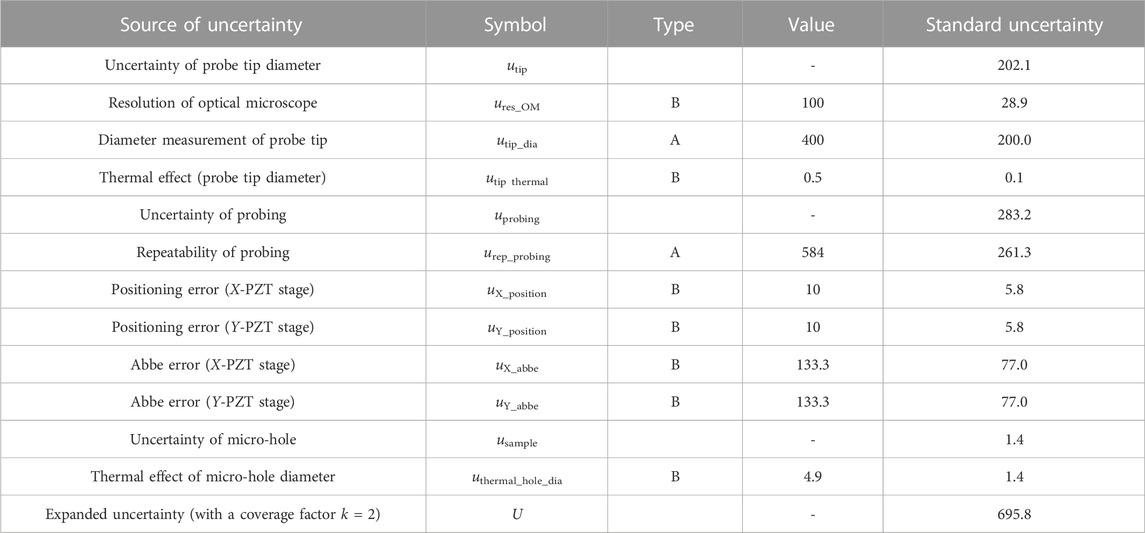
TABLE 1. Uncertainty budget (unit: nm).
Since “
The inner diameter of micro-hole varies with room temperature. Thermal expansion coefficient of the glass epoxy resin with micro-holes is 1.4 × 10⁻⁵/K. According to the room temperature stability during the measurement, the standard uncertainty of the inner diameter of the micro-hole is calculated to be 1.4 nm. All the type B uncertainty sources were assumed to have a rectangular probability distribution with a coverage factor of
4 Conclusion
The inner diameter of a micro-hole was measured by a microprobing system using a method of local surface interaction force detection. The probing was performed inside a micro-hole, and the inner diameter of the micro-hole was calculated by applying the least squares method for a circle to the probing coordinates and probe tip diameter. Consequently, the measurement of inner diameter of the micro-hole was achieved non-destructively. Although the probing coordinates at the interior of the micro-hole could be detected with sub-micrometric repeatability, deterioration of the probing repeatability due to the disagreement between the probe approaching direction and normal direction of the micro-hole was verified. It was possible to reduce the influence of the dispersion of the probing coordinates by limiting the disagreement of the probe approaching direction with respect to the normal direction of the micro-hole. This method will be applicable to other inner shapes, however, the measurable shapes and dimensions, especially the measurable depth, is limited by the effective length of the microprobe stylus. Therefore, elongation of the micro stylus will expand the applicability of this method. The expanded uncertainty in the inner diameter measurement of the micro-hole was estimated to be 695.8 nm (k = 2), and one of the main sources of uncertainty was the repeatability of the probing. The other source of uncertainty was the measurement of the probe tip ball diameter, so the precision measurement and calibration of the probe tip diameter will become a future issue. In addition, three-dimensional measurements of micro-holes will be needed to investigate the effect of probing repeatability due to the bottom of the blind hole.
Data availability statement
The original contributions presented in the study are included in the article/Supplementary material, further inquiries can be directed to the corresponding author.
Author contributions
MA worked on data analysis of experimental results and writing the manuscript. SI worked on planning the research, conducting the experiments and writing the manuscript. DK worked on the development and experimentation of experimental equipment. KM advised on the development of the experimental equipment. KK calculated the measurement uncertainty.
Funding
This research was supported by the Japan Society for the Promotion of Science (JSPS) KAKENHI grant number (20K04195).
Acknowledgments
The micro-hole sample used in this research was prepared with the cooperation of the Mitsubishi Electric Corporation. The authors would like to thank Mr. Takanori Miyazaki, Mr. Kenji Ito, and Mr. Yukitoshi Kudo for their involvement in sample preparation.
Conflict of interest
The authors declare that the research was conducted in the absence of any commercial or financial relationships that could be construed as a potential conflict of interest.
Publisher’s note
All claims expressed in this article are solely those of the authors and do not necessarily represent those of their affiliated organizations, or those of the publisher, the editors and the reviewers. Any product that may be evaluated in this article, or claim that may be made by its manufacturer, is not guaranteed or endorsed by the publisher.
References
Arab, J., Kannojia, H. K., and Dixit, P. (2019). Effect of tool electrode roughness on the geometric characteristics of through-holes formed by ECDM. Precision Engineering 60, 437–447. doi:10.1016/j.precisioneng.2019.09.008
Aziz, M., Ohnishi, O., and Onikura, H. (2012). Novel micro deep drilling using micro long flat drill with ultrasonic vibration. Precision Engineering 36, 168–174. doi:10.1016/j.precisioneng.2011.07.010
Bos, E. J. C. (2011). Aspects of tactile probing on the micro scale. Precision Engineering 35, 228–240. doi:10.1016/j.precisioneng.2010.09.010
Cai, Y., Chang, W., Luo, X., Sousa, A. M. L., Lau, K. H. A., and Qin, Y. (2018). Superhydrophobic structures on 316L stainless steel surfaces machined by nanosecond pulsed laser. Precision Engineering 52, 266–275. doi:10.1016/j.precisioneng.2018.01.004
Chen, Y. L., Ito, S., Kikuchi, H., Kobayashi, R., Shimizu, Y., and Gao, W. (2016). On-line qualification of a micro probing system for precision length measurement of micro-features on precision parts. Measurement Science and Technology 27, 074008. doi:10.1088/0957-0233/27/7/074008
Claverley, J. D., and Leach, R. K. (2015). A review of the existing performance verification infrastructure for micro-CMMs. Precision Engineering 39, 1–15. doi:10.1016/j.precisioneng.2014.06.006
Claverley, J. D., and Leach, R. K. (2010). A vibrating micro-scale CMM probe for measuring high aspect ratio structures. Microsystem Technologies 16, 1507–1512. doi:10.1007/s00542-009-0967-2
Dai, G., Xu, L., and Hahm, K. (2020). Accurate tip characterization in critical dimension atomic force microscopy. Measurement Science and Technology 31, 074011. doi:10.1088/1361-6501/ab7fd2
Elfurjani, S., Ko, J., and Jun, M. B. G., (2016). Micro-scale hole profile measurement using rotating wire probe and acoustic emission contact detection. Measurement 89, 215–222. doi:10.1016/j.measurement.2016.04.023
Goj, B., Dressler, L., and Hoffmann, M. (2014). Semi-contact measurements of three-dimensional surfaces utilizing a resonant uniaxial microprobe. Measurement Science and Technology 25, 064012. doi:10.1088/0957-0233/25/6/064012
Gupta, U., Nath, A. K., and Bandyopadhyay, P. P. (2016). Laser micro-hole drilling in thermal barrier coated nickel based superalloy. IOP Conf. Ser. Mater. Sci. Eng. 149, 012076. doi:10.1088/1757-899x/149/1/012076
Ito, S., Chen, Y. L., Shimizu, Y., Kikuchi, H., Gao, W., Takahashi, K., et al. (2016a). Uncertainty analysis of slot die coater gap width measurement by using a shear mode micro-probing system. Precision Engineering 43, 525–529. doi:10.1016/j.precisioneng.2015.09.016
Ito, S., Kikuchi, H., Chen, Y., Shimizu, Y., Gao, W., Takahashi, K., et al. (2016b). A micro-coordinate measurement machine (CMM) for large-scale dimensional measurement of micro-Slits. Applied Science 6 (5), 156. doi:10.3390/app6050156
Ito, S., Shima, Y., Kato, D., Matsumoto, K., and Kamiya, K. (2020). Development of a microprobing system for side wall detection based on local surface interaction force detection. International Journal of Automation Technology 14 (1), 91–98. doi:10.20965/ijat.2020.p0091
JCGM 100 (2008). in Evaluation of Measurement Data—Guide to the Expression of Uncertainty in Measurement (GUM) (Paris, France: Bureau International des Poids et Mesures).
Kao, C. C., and Shih, A. J. (2007). Form measurements of micro-holes. Measurement Science and Technology 18, 3603–3611. doi:10.1088/0957-0233/18/11/045
Krüger, O., Schöne, G., Wernicke, T., John, W., Würfl, J., and Tränkle, G. (2007). UV laser drilling of SiC for semiconductor device fabrication. Journal of Physics: Conference Series 59, 740–744. doi:10.1088/1742-6596/59/1/158
Li, R., Wang, P., Li, D., Fan, K., Liu, F., Chen, L., et al. (2018). Precision manufacturing of patterned beryllium bronze leaf springs via chemical etching. Applied Sciences 8, 1476. doi:10.3390/app8091476
Li, S., Wang, L., Li, G., Zhang, S., Wu, S., Qiao, J., et al. (2021). Small hole drilling of Ti–6Al–4V using ultrasonic-assisted plasma electric oxidation grinding. Precision Engineering 67, 189–198. doi:10.1016/j.precisioneng.2020.09.020
Marimuthu, S., Antar, J. M., and Dunleavey, J. (2019). Characteristics of micro-hole formation during fibre laser drilling of aerospace superalloy. Precis. Eng. 55, 339–348. doi:10.1016/j.precisioneng.2018.10.002
Masuzawa, T., Hamasaki, Y., and Fujino, M. (1993). Vibroscanning method for nondestructive measurement of small holes. CIRP Annals - Manufacturing Technology 42 (1), 589–592. doi:10.1016/s0007-8506(07)62516-5
Metz, D., Jantzen, S., Wessel, D., Mies, G., Lüdenbach, J., Stein, M., et al. (2019). Integration of an isotropic microprobe and a microenvironment into a conventional CMM. Measurement Science and Technology 30, 115007. doi:10.1088/1361-6501/ab2fda
Murakami, H., Katsuki, A., Sajima, T., and Suematsu, T. (2014). Study of a vibrating fiber probing system for 3-D micro-structures: Performance improvement. Measurement Science and Technology 25, 094010. doi:10.1088/0957-0233/25/9/094010
Saranya, S., and Sankar, A. R. (2018). Fabrication of precise micro-holes on quartz substrates with improved aspect ratio using a constant velocity-feed drilling technique of an ECDM process. Journal of Micromechanics and Microengineering 28, 125009. doi:10.1088/1361-6439/aae8f5
Sato, S., Hidai, H., Matsusaka, S., Chiba, A., and Morita, N. (2020). Drilling, bonding, and forming conductive path in the hole by laser percussion drilling. Precision Engineering 61, 147–151. doi:10.1016/j.precisioneng.2019.10.007
Song, W., Wang, S., Lu, Y., and Xia, Z. (2018). Tribological performance of microhole-textured carbide tool filled with CaF2. Materials 11 (9), 1643. doi:10.3390/ma11091643
Thalmann, R., Meli, F., and Küng, A. (2016). State of the art of tactile micro coordinate metrology. Applied Science 6 (5), 150. doi:10.3390/app6050150
Tong, H., Li, Y., Zhang, L., and Li, B. (2013). Mechanism design and process control of micro EDM for drilling spray holes of diesel injector nozzles. Precision Engineering 37, 213–221. doi:10.1016/j.precisioneng.2012.09.004
Weckenmann, A., Estler, T., Peggs, G., and McMurtry, D. (2004). Probing systems in dimensional metrology. CIRP Annals - Manufacturing Technology 53 (2), 657–684. doi:10.1016/s0007-8506(07)60034-1
Weckenmann, A., Peggs, G., and Hoffmann, J. (2006). Probing systems for dimensional micro- and nano-metrology. Measurement Science and Technology 17, 504–509. doi:10.1088/0957-0233/17/3/s08
Weckenmann, A., and Schuler, A. (2011). Application of modern high resolution tactile sensors for micro-objects. International Journal of Precision Technology 2 (2/3), 266–288. doi:10.1504/ijptech.2011.039463
Keywords: microprobe, CMM, inner diameter, laser processing machining, surface interaction force
Citation: Aruga M, Ito S, Kato D, Matsumoto K and Kamiya K (2023) Investigation of probing repeatability inside a micro-hole by changing probe approach direction for a local surface interaction force detection type microprobe. Front. Manuf. Technol. 3:1104742. doi: 10.3389/fmtec.2023.1104742
Received: 22 November 2022; Accepted: 02 January 2023;
Published: 02 February 2023.
Edited by:
Sangkee Min, University of Wisconsin-Madison, United StatesReviewed by:
Mariusz Deja, Gdansk University of Technology, PolandSajan Kapil, Indian Institute of Technology Guwahati, India
Copyright © 2023 Aruga, Ito, Kato, Matsumoto and Kamiya. This is an open-access article distributed under the terms of the Creative Commons Attribution License (CC BY). The use, distribution or reproduction in other forums is permitted, provided the original author(s) and the copyright owner(s) are credited and that the original publication in this journal is cited, in accordance with accepted academic practice. No use, distribution or reproduction is permitted which does not comply with these terms.
*Correspondence: So Ito, c28uaXRvQHB1LXRveWFtYS5hYy5qcA==