 S. Leroch1
 P. G. Grützmacher
 S. J. Eder
- 1AC2T research GmbH, Wiener Neustadt, Austria
- 2Institute of Engineering Design and Product Development, Vienna, Austria
- 3Tyrolit—Schleifmittelwerke Swarovski K.G, Schwaz, Austria
An efficient optimization of surface finishing processes can save high amounts of energy and resources. Because of the large occurring deformations, grinding processes are notoriously difficult to model using standard (mesh-based) micro-scale modeling techniques. In this work, we use the meshless material point method to study the influence of abrasive shape, orientation, rake angle, and infeed depth on the grinding result. We discuss the chip morphology, the surface topography, cutting versus plowing mode, the material removal rate, and the chip temperature. A generalization of our model from a straightforward single-abrasive approach to a multiple-abrasive simulation with pseudo-periodical boundary conditions greatly increases the degree of realism and lays the foundation for comparison with real finishing processes. We finally compare our results for multiple abrasives to those obtained for a scaled-down molecular dynamics system and discuss similarities and differences.
1 Introduction
Machining processes like grinding are part of most manufacturing processes to produce the surface finish of a work piece (Wang et al., 2021). The final surface roughness does not only affect the appearance of a work piece, but also its performance in terms of longevity, friction, thermal conductivity, etc., (Patel et al., 2018). To balance the efficiency of the grinding process with the surface quality, a compromise has to be made between the material removal rate and the final surface roughness (Stephenson et al., 2001; Gopal and Rao, 2003). Higher material removal rates, resulting for example from higher grinding speeds, usually deteriorate the surface quality (Wang et al., 2022), while high surface quality is usually achieved by using small pressures and low material removal rates. If the grinding parameters are carefully chosen, roughness values in the range of 0.3 nm with an accuracy of 10 nm of geometrical features can be achieved in ultra-precision processes, thus making any subsequent polishing processes unnecessary (Wegener et al., 2017). Additionally, the requirements regarding tolerances of the processed work pieces may be high, resulting in the need for high-precision grinding processes. This precision is all the more important as work pieces that are to be ground have already been heavily processed in earlier steps, making the unintentional production of scrap during grinding extremely expensive (Wegener et al., 2017).
Grinding is an extremely complicated process, which is affected by a number of parameters, such as the material of the abrasives and the work piece as well as their microstructure, the pressure, the temperature, the geometry and orientation of the abrasives, as well as the cutting speed and other machine parameters (Gopal and Rao, 2003; Eder et al., 2022; Wang et al., 2022). Often the correct operation of the grinding process can be determined by the existence and the shape of the formed chips (Rasim et al., 2015; Karasawa et al., 2019). The formed chip solves two major process goals: it removes material and it removes heat out of the grinding process and away from the work piece (Kopac and Krajnik, 2006). The removal of heat is another very important process factor to be achieved in any precision grinding operation, as high heat intake can modify and damage the work piece or alter its properties. Therefore, ideal chip formation is mandatory for an ideal grinding process. As such, apart from machining parameters, the shape of the chips is strongly influenced by the material parameters as well as the geometry and orientation of the abrasives. Continuous strings of work piece material might be formed, small drizzle, or even no chips at all if the parameters of the grinding process are improperly selected (Eder et al., 2022).
As the grinding tool is subjected to wear during the process, the geometry of the abrasives changes throughout the process, which can have a substantial effect on both efficiency and surface quality (De Pellegrin and Stachowiak, 2004; Wei et al., 2022). Therefore, the tool has to be reconditioned to recover the optimum abrasive geometry and thus its cutting ability. The time until reconditioning is necessary, depends on the initial abrasive geometry and the grinding parameters (Wegener et al., 2017). A grinding process characterized by insufficient chip formation typically results in low efficiency, work piece damage by excess heat and low surface quality (Sato et al., 2020). Due to the complexity of the tool-work-piece interaction during the grinding process, a detailed understanding of the individual parameters and their mutual interdependence is required to optimize the process. This need of optimization and research of grinding parameters is reflected by the fact that setting up a new grinding process often requires several test runs before it can produce the proper results. Many operations that run with high cost or high risk work pieces are therefore often only slowly improved or run without any improvement for many years. A famous example is the grinding of turbine blades for jet engines (Wilk and Tota, 2008). These processes often run over 10-20 years without significant improvement due to the high risks and costs involved with part and process re-certifications. Another notable example is the cost-intensive trend towards reducing noise generation in modern gearboxes for electric propulsion solutions by optimizing gear surfaces (Krajnik et al., 2021).
As experimental studies on the subject are time consuming and laborious, computer simulations can be applied to aid the optimization of grinding processes. Especially the introduction of new work piece materials involves cost-intensive trials and slows down development. Progress in high-performance computing has made it possible to simulate the processes that occur during cutting and grinding, such as material removal, chip formation, microstructural evolution, and surface topography development (Eder et al., 2017b; Markopoulos et al., 2020). In this context, particularly molecular dynamics (MD) simulations are a powerful tool to monitor the microstructure of the ground material, which might be subjected to considerable changes close to the grinding interface during sliding, e.g., grain size changes and specific grain orientations (Grützmacher et al., 2020). These microstructural changes in near-surface zones greatly affect the material properties and can influence the efficiency of the grinding process as well as the durability of either tool or work piece. Furthermore, it was demonstrated that MD studies can qualitatively reproduce experimental data in terms of the obtained surface topographies (Eder et al., 2022).
At larger scale, particle simulation methods can be used that can handle large deformations without the need to constantly re-mesh the model, e.g., the material point method (MPM) (Eder et al., 2021). Such mesoscale methods can be directly compared to the real process at the expense of in-depth crystallographic information (Sridhar et al., 2022). The MPM is a meshfree continuum method with explicit time integration, designed especially to study dynamic processes observed in cutting, scratching or during impacts. MPM was developed by Sulsky (Sulsky et al., 1994) in the 1990s as a successor of the Particle-In-Cell (PIC) method. The aim was to apply the highly robust PIC methodology for fluid flow problems, also to solid bodies. MPM was further developed by many authors (Bardenhagen and Kober, 2004; Wallstedt and Guilkey, 2007) and successfully applied to a variety of solid body problems with very large deformations and fracture. Common to all MPM schemes is the use of Lagrangian particles, i.e., the discretization of the material into deformable, non-overlapping particles, and the use of so called kernel functions. To make the MPM numerically robust an auxiliary regular background grid however, is also employed to compute strains and stresses. The current MPM model based on the so called generalized interpolated material point (GIMP) (Bardenhagen and Kober, 2004) method is described in more detail in (Leroch et al., 2018). The clear advantage of MPM over time explicit FEM methods (Woldman et al., 2017) lies in its meshless nature. Since the particles are discrete and interact only via their kernels, the method does not need additional separation formulations to allow for fracture. The GIMP method has been used before to simulate cutting and scratching of metals in good agreement with experiment by Leroch et al. (2018), Varga et al. (2019), Varga et al. (2021). Moreover, in a recent publication, MPM has been applied to grinding processes to investigate the effect of different abrasive orientations, where it was found that there is no material removal at all but pure plowing when a cubic abrasive is oriented with an edge pointing in grinding direction, while the largest chip is formed when the cube is sliding on one of its faces (Eder et al., 2021). Similarly, MPM was used to investigate single asperity sliding and a transition from plowing to cutting was observed when changing the orientation of the elliptical asperity (Mishra et al., 2020; Mishra et al., 2021).
In continuation to our previous work (Eder et al., 2021) in the current publication we made a systematic study of the influence of abrasive shape (sharp or blunt), orientation, and rake angle on the grinding process of steel. From these simulations, properties like chip morphology, material removal rate, or surface roughness can be deduced and compared to each other to judge the quality of the abrasive process. In Eder et al. 2021 it was shown that the material removal rate scales in the same way in the microscopic (MD) and mesoscopic (MPM) system. By emulating the MD grinding simulation at a scale 1000 times larger along each dimensions using MPM we intend to ascertain whether the previous findings hold. If no structural information of the material is required, this would facilitate the adjustment of the grinding tool or even process for a given material, because in comparison to MD simulations, many different setups can be tested in reasonable time.
The paper is organized as follows: In the first section, the introduction is given together with the motivation. In the second section, the computational setups for MPM and MD are described, including a description of how the simulations are evaluated. In section 3 the results are discussed, with separate subsections for the single-abrasive and multi-abrasive modeling approaches, and conclusions are drawn in section 4.
2 Computational details
2.1 Material point method (MPM)
In a similar way as in FEM, the conservation equations are solved along with a material model that describes—In a simplified way—The mechanical behavior of the system. The material model is decomposed into isotropic and deviatoric contributions, corresponding to volumetric and shear deformations. The relationship between density ρ and pressure p is given by the equation of state, while the relation between a tensorial shear deformation ϵd and the stress deviation tensor σd is given by the material strength model. The decomposition is additive, i.e.,
where I is the diagonal unit tensor. The equation of state is assumed to be a linear relation between deformation gradient J and pressure,
with K being the bulk modulus of the metal.
For the plastic yield strength we use the purely empirical Johnson-Cook (JC) model (Johnson and Cook, 1985), which is numerically robust and therefore widely used for thermal-elastic-plastic modeling.
All the simulations were carried out with the open-source code LAMMPS (Plimpton, 1995), applying the MPM user package (available on request from its developer Georg Ganzenmüller (Leroch et al., 2018)). Table 1, 2.
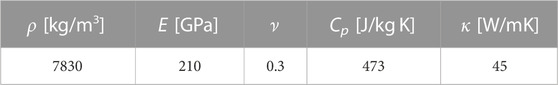
TABLE 1. Material parameters for AISI 4340 steel taken from (Leroch et al., 2018) ρ is the reference bulk density, E Young’s modulus, ν the Poisson ratio, Cp the specific heat capacity at room temperature, κ the heat conductivity.

TABLE 2. Johnson-Cook parameters for AISI 4340 steel (Afazov et al., 2010). Here,
For the single-abrasive simulations intended for a discussion of chip morphology and material removal rate, steel work pieces of sizes 30 × 200 × 30 μm in x, y, z (for edge and flat while for ship the x dimension was expanded correspondingly to up to 56 μm) were created, with a particle resolution R of 0.5 μm and a cell width parameter for the auxiliary grid equal to R. For the simulations aimed at reproducing the nanoscale MD simulations with three abrasives, a steel work piece of size 180 × 210 × 40 μm in x, y and z was created with a particle resolution R of 0.7 μm to reduce numerical load.
The abrasives were assumed to be rigid and divided into two groups, namely into sharp abrasives with the shape of parallelepipeds (resembling a rhombic prism with 60°-angles, resulting from the trigonal crystal lattice of the Al2O3/corundum) and blunt (or worn) ones of ellipsoidal shape. All abrasives were created using COMSOL Ref. (COMSOL, 1986). The main axes of the parallelepipeds and ellipsoids are 45 and 26 μm, respectively, with a thickness of 10 μm, the same proportions as the corresponding nano-sized abrasives in Ref. (Eder et al., 2022).
Finally the abrasives are placed with different orientation on the surface of the steel work piece. In general, we distinguish between the so-called edge, flat, and ship orientations. In the edge orientation the top surface points in grinding direction, in the flat orientation the side face, and in the ship orientation the abrasive is sliding on its top surface. In addition, the edge and flat configurations have 3, 4 different rake angles with respect to the work piece surface ([–60°], −30°, 0°, +30°) as illustrated in Figure 1, while the ship configuration has three different rotation angles around the surface normal (0°, 60°, and 90°). For the sake of comparability between sharp and blunt abrasives in this work, we define the rake angle as the angle between the long main axis of the abrasive and the work piece surface normal.

FIGURE 1. System and workflow overview. Top left: a real macroscopic grinding system. Top right: abstraction of the real system to an MPM model of single-abrasive grinding. Exemplary sketches of the varied parameters: Abrasive shape, orientation, configuration, and infeed depth. Bottom left: Extension of the single-abrasive approach to a pseudo-periodic multi-abrasive system. Bottom right: Comparison and qualitative validation with a scaled-down polycrystalline molecular dynamics version of a multi-abrasive system. All 3D-visualizations were produced using OVITO (Stukowski and Albe, 2010).
A scratch is performed at a velocity of 80 m/s while constraining the lowest layer of the work piece. The initial temperature was set to room temperature. Coulombic friction was neglected because, in order to parameterize the material model in a meaningful way, the JC parameters would have to be re-adjusted, together with the Coulomb friction (Kugalur Palanisamy et al., 2022). Simply selecting a seemingly convenient value for the Coulombic friction is therefore not recommended. If one does not know the exact (and full) set of material and interfacial parameters, it is safer to neglect the Coulomb friction altogether. According to Ref. (Miavaghi and Kangarlou, 2017), the value of the coefficient would be small anyway because of the high occurring normal loads. The scratches were carried out applying three infeed depths of 5, 8, and 12 μm. For the multi-abrasive simulations, an additional velocity component of 9 m/s normal to the main grinding direction was applied in order to correspond to the kinematics of the MD simulations in Ref. (Eder et al., 2022).
To best reproduce these existing MD results with three abrasives under periodic boundary conditions, a trick had to be applied, since periodic boundary conditions were not fully implemented in the MPM code. Thus, so-called “pseudo-periodic” boundary conditions were applied. As unit cell, we used an area of 85 μm × 85 μm, multiplying the size of the corresponding MD system by a factor of 1000 along each linear dimension. This cell was placed in the center of a larger simulation box, laterally measuring 180 μm × 210 μm to allow the existence of copies of the three original abrasives in a neighboring unit cell on one hand, and so that the original abrasives can move outside of the unit cell while grinding on the other hand. Therefore, 5 abrasives were used in total to represent possible ghost instances of the three main abrasives. This guarantees that an area of 85 μm × 85 μm is ground at least twice in the course of the entire grinding simulation to obtain a comparably smooth surface like in MD at the end of the process. The simulation proceeds in six separate runs: In all runs the abrasives (originals and copies) scratch a distance of 85 μm in the main grinding direction at an infeed depth of 5 μm. At the end of each run, the abrasives are moved back along the main grinding direction, while they are shifted by 9.6 μm along the transverse direction to correspond exactly to the kinematics imposed in the MD simulations (Eder et al., 2022).
To avoid influences from the repeated indentations at the beginning of every scratch as well as artifacts caused by the substrate boundaries, only an area of 85 μm × 85 μm near the center of the work piece surface is used to evaluate the roughness and the volume of removed matter. In addition, at the end of every pass of the abrasives, the formed chips are removed from the surface to avoid that they interact with the abrasives of the subsequent scratch. This is done by removing all particles with velocities greater or equal to 40 m/s from the last valid data output of the surface at the end of the pass. The main problem with the lack of true periodic boundary conditions is that the information about the stresses in the work piece from the preceding grinding passes is lost. However, for our purposes of studying chip formation and topography development, this should not constitute a serious problem.
2.2 Large-scale molecular dynamics
The MD simulations were also carried out using the open source software LAMMPS (Plimpton, 1995). The work piece with a bimodal grain size distribution was constructed in Dream.3D (Groeber and Jackson, 2014) as detailed further in (Eder et al., 2021). Both grain sizes were chosen to be equiaxed, with mean grain diameters of 28.3 and 14.2 nm, respectively. The initial 3D-periodic system of 85 × 85 × 85 nm3 then holds approximately 200 grains that are randomly oriented. As a simple model for a mild steel, we introduced a cementite (Fe3C) phase populating the smaller grains, while the larger grains are filled with a bcc lattice (a = 2.86 Å) to represent ferrite. We used a three-body Tersoff potential for interactions within the work piece, with the parameters taken from (Henriksson and Nordlund, 2009). The Dream.3D microstructure was imported into Matlab using a self-written conversion routine, where all grains were filled with the appropriate lattices oriented in the directions determined by Dream.3D, and then the free work piece surface was introduced at z = 40 nm, yielding a work piece consisting of almost 25 million atoms. After energy minimization and heat treatment by heating up to 1100 K, followed by a cooling cycle down to 300 K, the grain boundaries were assumed to be in thermodynamic equilibrium.
The abrasives representing the grinding tool consist of alumina (α-Al2 O 3). Parallelepipeds with a Gaussian size distribution were prepared and placed with random rake angles above the work piece surface, following a protocol that is described for generic abrasives in Ref. (Eder et al., 2017a). The work piece was fitted with three abrasives with a mean diameter of 45 nm, yielding an areal coverage fraction of 22%, which agrees well with typical bearing area fractions of freshly dressed industrial grinding tools (20%–30%) and also reflects a realistic ratio between the sizes of the abrasive grains and the grains in the work piece microstructure. As a computational simplification, and in line with the MPM model, the grinding tool is assumed to be completely rigid. It interacts with the work piece via a Lennard-Jones potential, with σ = 2.203 Å, ɛ = 0.095 eV, and a cutoff radius of 10 Å.
To cover the two extremes of sharp and blunt abrasives, we constructed systems where the alumina abrasives cleft along crystallographic planes are replaced with ellipsoids of identical axis dimensions. This sacrifices crystallographically well-defined abrasive surfaces, but it allows us to study the effect of a more conformal contact during grinding, with a higher fraction of plowing rather than cutting, thus mimicking worn abrasives.
During the grinding simulations, periodic boundary conditions were applied in both lateral directions. The infeed depth of the abrasives into the work piece in −z direction was kept at 5 nm for straightforward comparison with the MPM simulation results. Simultaneously, the abrasives were moved at constant speed of vx = 80 m/s and vy = 9 m/s over the work piece, cutting chips of various lengths and shapes. The velocity component in transverse direction was introduced to prevent the abrasives from immediately grinding in their own grind marks upon re-entering the periodic simulation box from the −x direction, but rather meet up with the same portions of the work piece after approximately 10 passes. The time step was set to 2 fs, and a Langevin thermostat with a coupling time of 3.5 ps was applied to the entire work piece in transverse direction to keep the temperature of the substrate at the desired value while reproducing a realistic heat conductivity of ferrous work pieces (Eder et al., 2017c). The lowest 3 Å of the work piece were kept rigid to avoid torque on the work piece during grinding.
2.3 Evaluation of the simulations
The automatic identification of chips is the basis for correctly calculating material removal as well as obtaining the time-resolved surface topography (Eder et al., 2016). Chip formation during grinding is a cumulative process, therefore if a particle is once considered part of the chip it remains part of it even if its advection velocity should ever drop below this threshold velocity (Eder et al., 2021). As the indentation portion of the individual simulations take up a considerable percentage of the total simulation time, the snapshots were evaluated back-to-front, end evaluation was halted once the abrasive coordinate in grinding direction no longer changes. For every particle, the type (work piece or abrasive), position, velocity, and temperature are read. The total velocity is calculated from its Cartesian components, and any particle with a velocity exceeding half the grinding velocity of the abrasive is considered to be part of the chip, equivalent to Ref. (Eder et al., 2014b). A comprehensive account of the iterative approach to obtaining the optimum threshold velocity of 40 m/s is given in Ref. (Eder et al., 2021). Then, the number of particles comprising the chip as well as their temperature distribution is evaluated. Multiplying the number of chip particles with the per-particle volume yields the chip volume, which may be evaluated as a function of grinding distance, so that its slope gives us the material removal rate (MRR) as removed material volume per unit grinding distance. The topography of the work piece without the chip is then analyzed by superimposing a quadratic lateral mesh with a size slightly above the nominal MPM particle distance to reduce aliasing artifacts, as previously done in (Leroch et al., 2022). Within each mesh element, the z-coordinate of the highest MPM particle plus its particle radius constitutes the surface of that element, allowing the production of topographic maps, the calculation of roughness parameters such as Sq, which is equivalent to the root-mean-square (RMS) value of the topographic heights, as well as the evaluation of median grinding groove cross-sections equivalent to what is common practice in scratch testing. Note that the aspect of dislocation formation and development, which is without doubt important in a comprehensive appraisal of plastic deformation and grinding/cutting, is omitted in this work, since this was already discussed previously based on a large parametric study of MD simulations (Eder et al., 2022).
The larger systems used for simulating multi-abrasive grinding were in principle evaluated equivalent to the single-abrasive grinding systems as described above. These systems were simulated in 6 separate passes of the abrasives in a pseudo-periodic fashion, after each of which the chips that were identified at the end of the run were deleted. The evaluation was therefore also broken down into the separate runs, taking care that any overlapping data between subsequent runs was deleted in the merging process. As some of the MPM jobs may have sometimes terminated prematurely, most likely due to numerical instabilities (discussed in the next section), the 85 μm × 85 μm reference area for the topography evaluation was shifted by up to 15 μm in x-direction and 27.5 μm in y-direction from the center of the entire system to coincide with that portion that was most completely machined. Note that due to the pseudo-periodic nature of the system, this does not constitute an act of “cherry-picking”, but merely mitigates artifacts arising from said prematurely terminated simulations. While the topography evaluation was performed equivalent to the single-scratch MPM simulations as well as the MD simulations, the removed matter depth could not be calculated from the accumulated chip volumes, but had to be estimated by comparing the current topography with the initial one.
3 Results and discussion
3.1 Single-abrasive grinding
Figures 2, 3 give an overview of the chip morphologies produced by sharp and blunt abrasive types at various rake angles and orientations. Steps of 30° were chosen for the rake angles to limit the amount of results and focus on significant changes that can be observed. While the rake angle was adjusted, the orientation of the grain remained the same in Figure 2, but orientation adjustments will be discussed at the example of the representative configurations shown in Figure 3. The infeed depth in the figures is kept constant at 8 μm, but results are generally comparable to those at the other simulated infeed depths of 5 and 12 μm. A comprehensive overview of all calculated results can be found in the supplementary section (Figs. S1–S3).
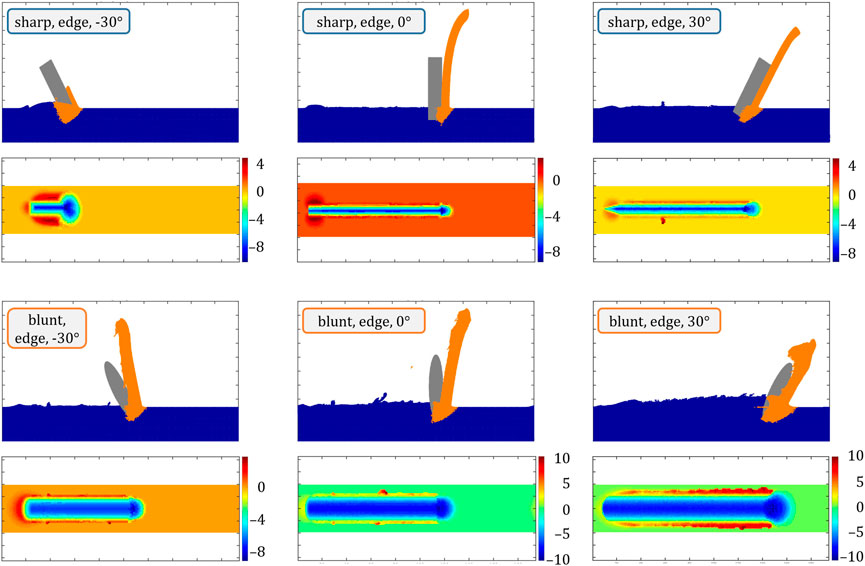
FIGURE 2. Rake angle and abrasive shape dependence of chip formation and morphology as well as work piece topography at 8 μm infeed depth. The color bars of the topographic maps are in μm.
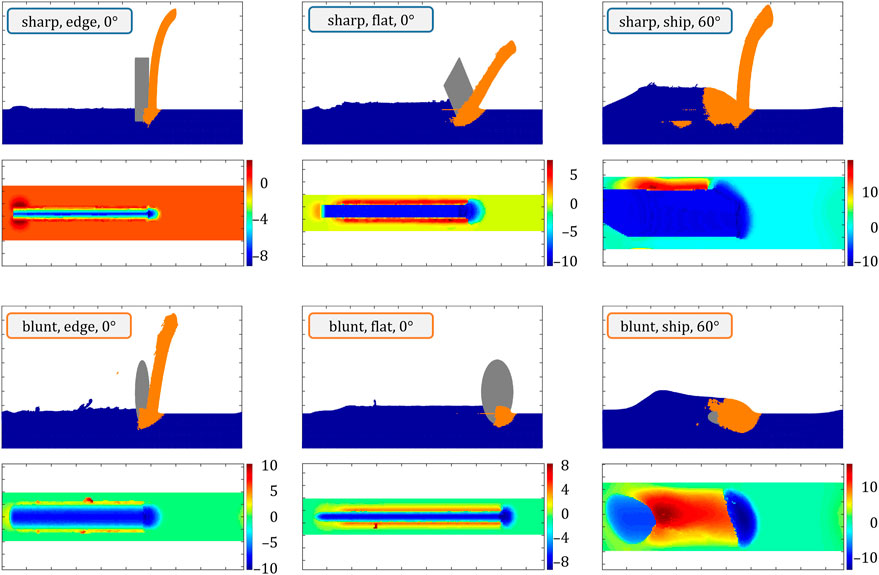
FIGURE 3. Abrasive orientation and shape dependence of chip formation and morphology as well as work piece topography at 8 μm infeed depth. The colorbars of the topographic maps are in μm.
Figure 2 includes two series of changing rake angles varied from −30° to +30° for sharp abrasives in the top row and blunt abrasives in the bottom row. Each set consists of a side view with the angled abrasive displayed in gray, the material identified as a chip in orange, and the remaining work piece material in blue. This differentiation between removed and remaining material is important for the discussion of the surface quality (i.e., surface roughness) later on. The second set of information is a topographic view from above to show the different height levels of the remaining work piece after a single pass of the abrasive over the surface. The color range includes plowed material at the sides of the scratch, but the actual chip (shown in orange color in the side view) is not considered in the height maps. The sharp rhombohedral and blunt abrasives are run across the work piece surface with their edge side towards the viewer. As the sharp abrasive slides over the surface with one of its tips, this produces a thin v-shaped scratch and also limits the amount of plowed material towards the sides, while the blunt abrasive produces a u-shaped scratch with more material being moved and plowed in general. As can be seen, the total material removed from the work piece surface is different for sharp and blunt abrasives, which can be correlated to the greater contact area between blunt abrasives and work piece (Eder et al., 2014a). In contrast to other configurations, all systems in the edge orientation successfully cut the work piece and therefore produce a chip, but the ratio between plowed and chipped material varies. It is worth mentioning that the blunt particles work well in the edge orientation, where they produce chips, but fail to do so in all other orientations and the chip quality varies considerably.
The sharp abrasive produces a thin long chip for all simulated rake angles. The first panel only shows a shorter path length because the formation of the thin chip led to numerical instabilities in the simulation for rake angles −30°. This kind of behavior is observed whenever the uncut chip thickness is such that the chip consists of only one layer of particles. In an attempt to minimize the likelihood of such instabilities, we increased the number of particles per cell to add stability, which unfortunately did not help much; the MPM code aborts with a “gridweights error”. In general, at this point, it must be accepted that sharp edges and extremely thin chips are generally prone to numerical problems. It can still be observed that more material is plowed to the sides than with rake angles of 0° or +30°. This is due to the fact that the geometry of the sharp abrasive produces a v-shaped face that will indent the material at a 60°-angle and push material down, before the actual 30°-face of the grain can lift material up and cut it properly, thereby reducing the efficiency of the cut and lowering the ratio between lifted and squeezed material. A similar behavior can be observed for a rake angle of +30°, but with a better cut to squeezed ratio, due to the smaller down facing contact angle of 30°. These observations already show the importance of different abrasive shapes, but also show some implications on the importance of depth of cut, which can be compared in the Supplementary Figures S1, S2. Rake angles of 0° and +30° therefore produce the best chips for the sharp abrasive, with the −30°-angle being less ideal. In this context, the “best chips” remove as much heat from the work zone as possible and require the least force to be created. They are characterized by being comparably long and expanding directly away from the grinding zone.
The blunt abrasive on the contrary performs best at a rake angle of −30° (bottom left), where it produces less plowed material than the two other rake angles, even though the amount of chipped material is comparably high (see material removal rate readings in Figure 5) and will probably lead to higher grinding forces. In contrast to the −30° sharp abrasive, the blunt version lacks a defined intruding face that would increase the amount of squeezed material. This will not necessarily lead to a sharper cut, but the convex face will distribute the material in a less-focused way, allowing more of it to protrude upwards and eventually increase the chip thickness. The blunt face will also move material to the sides more randomly, therefore producing little outcrops and protrusions that lost contact with the main chip and thereby remained on the work piece surface. This is true for all three rake angle variations of the blunt abrasive and increases drastically towards positive angles. It culminates in the blunt +30° angle variant, which progressively plows more material aside and ultimately reduces the chance of a proper chip being produced, thereby risking a heat increase in the work piece as less and less material is actually removed. With rake angle 0°, both abrasive variants would actually produce a valid grinding result independent of the abrasive’s geometry.
In Figure 3, the rake angle remains at a constant 0°, but the orientation of the abrasive is rotated around a vertical axis by 90° from a side edge configuration to a flat standing one. In addition, a third orientation was chosen by first changing the rake angle of the edge orientation to 90° (full horizontal) and then changing the orientation by 60° to have the sides parallel to the abrasive motion. This lying-down configuration will be referred to as “ship” henceforth. Although the latter simulation features material flowing over and across the abrasive body, which would be limited in a real scenario, this particular variation can be interpreted as an extremely blunt abrasive or a process with different in- and through-feed characteristics, and the results that are shown correspond well to experimental grinding data (which will be listed in the discussion of the following figures). The ship configuration is also interesting from a user perspective, as specially shaped abrasives are currently very popular in the market and range from bars with various cross sections to triangular shapes, and even fully three-dimensional shape variations.
In comparison to the variation of rake angles in Figure 2, the results here differ more significantly between sharp and blunt abrasives. The flat orientation of the sharp abrasive produces a wider rectangular scratch without changing the fundamental character of the formed chip, but with an overall increased volume of moved and plowed material, lowering the general quality of cut in comparison to the edge orientation. In addition, similar to the −30° sharp abrasive, more material is plowed to the sides compared to the edge configuration, which again is induced by the squeezing of material instead of lifting it. The blunt abrasive in flat orientation still produces a u-shaped scratch, like in edge orientation, but with a lot less material being moved forward and much more material being plowed to the sides. Similar results have been obtained by Mishra et al. (2020), who studied the influence of ellipsoidal abrasive orientation with MPM. They found that increasing the contact area in sliding direction resulted in higher resistance to plastic flow and more material piled up in front of the abrasive, while rotating the abrasive in the sliding plane decreases the pile-up height in front of the abrasive due to the ease of plastic flow and more material is piled up at the sides. The blunt abrasive only forms a proper chip for one of the three shown orientations, namely the edge orientation where the surface with the smallest curvature points in grinding direction. This is true for all investigated infeed depths. The ship orientation obviously moves much more material than all other variants, but the sharp abrasive still produces a wide and long chip, while the blunt abrasive only manages to plow material to all sides and basically “tunnels” through the work piece. This “tunneling effect” obviously changes with abrasive orientation, which can be observed in more detail in the Supplementary Figure S3. The main reason why the sharp ship configuration still manages to produce a proper chip is the flat face of the abrasive edge intruding into the material, but the topographic map shows the same maximum 10 μm pile-up of material that the blunt ship produces, therefore neither of the two configurations exhibit any particularly promising performance. Still, as data in the following Figures 4, 5 will show, the sharp ship configuration can occasionally produce acceptable grinding results, while it should generally be avoided.

FIGURE 4. Median grinding forces for sharp (left) and blunt (right) abrasives (3 abrasive grain orientations; edge, flat, and ship). Symbol colors denote abrasive orientations, and symbol shapes the rake angle. Within each category of infeed depth, the individual rake angles are also staggered from left to right in ascending order.
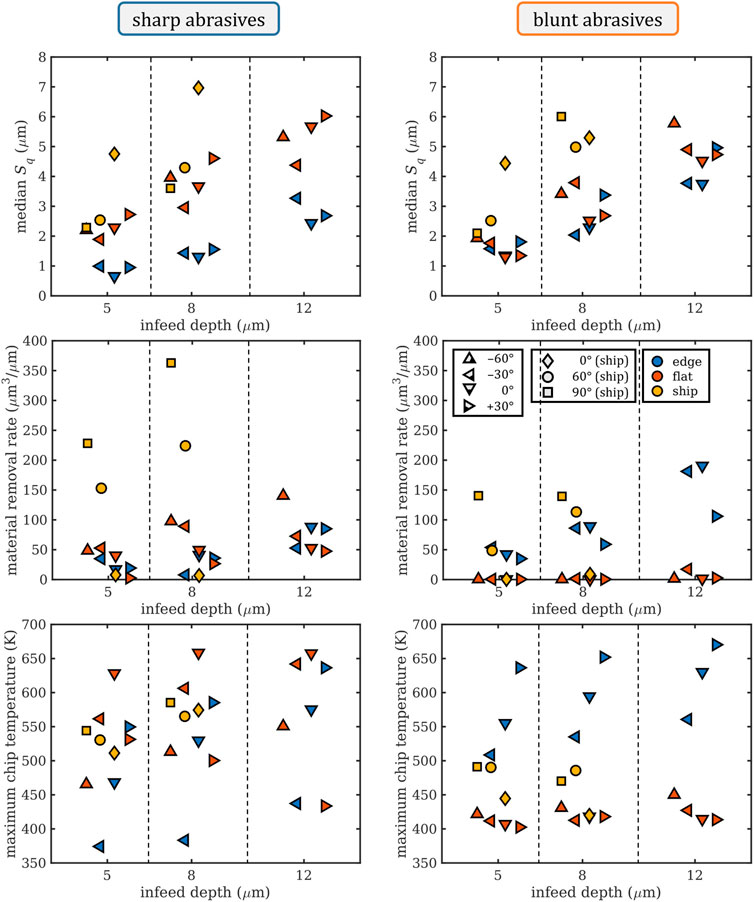
FIGURE 5. Median RMS roughness Sq (top), material removal rate (center), and maximum chip temperature (bottom) for sharp (left) and blunt (right) abrasives (3 abrasive grain orientations; edge, flat, and ship). Symbol colors denote abrasive orientations, and symbol shapes the rake angle. Within each category of infeed depth, the individual rake angles are also staggered from left to right in ascending order. As the grinding velocity was kept at a constant 80 m/s, multiplying the values of the material removal rate by a factor of 80 gives the MRR in units of μm3/μs.
Figure 4 shows the median normal and median grinding forces for all sharp and blunt abrasives with angles −30°, 0°, and +30° for the previously discussed orientations edge and flat, as well as the ship orientation with additional rotations. In addition, a −60°-rotation variant is added for all flat abrasives, as such an angle is likely to occur for bonded abrasives and has the potential of high material removal. The data is shown for all three simulated infeed depths of 5, 8, and 12 μm. Normal and grinding forces are important to qualify the feasibility of a grinding operation, limited mostly by the machine power and process parameters. They can also hint at an expected quality outcome, especially if the process is already known, such as work piece damage or an inefficient grinding process. In real life applications, cutting forces are easy to calculate, but they can vary drastically between applications and work piece materials. There is a general way to calculate the occurring grinding forces and the grinding energy, and the results obtained from our calculations are plausible and in line with Ref. (Klocke, 2018).
To start with, some general trends can be observed, including all grinding forces increasing with increasing infeed depth. Also the general behavior concerning the influence of orientation or rake angle does not change for different infeed depths, which allows for a discussion focusing more on other aspects. Grinding forces are generally increased for all ship variants, but show significant differences between edge and flat variants. Lastly, the average forces do not vary strongly between sharp and blunt abrasives. This is surprising at first, but will be explained later in the context of material removal rate calculations.
Breaking it down, the edge orientations show a clearly favorable rake angle of either 0° (sharp) or −30° (blunt), especially for blunt abrasives. The sharp/edge abrasives feature the lowest grinding forces for the 0° rake angle as well as elevated grinding forces for the −30° and +30° angles. The blunt/edge abrasives produce a much larger difference in grinding forces, with the average grinding forces being ∼2–3 times higher than those measured for the sharp abrasives. Considering the much wider scratch channel observed in Figure 2, this difference could be expected. The blunt/edge variant exhibits the lowest forces for a rake angle of −30°, where the forces are comparable to the ones found for sharp abrasives. However, for blunt abrasives there is a pronounced influence on the rake angle. The highest forces were found for the angle of +30°, which was again suspected by previous observations, due to the high amount of squeezed and plowed material.
Surprising at first, the flat orientation shows higher median grinding forces for the sharp abrasives compared to the blunt abrasives. As was already discussed previously, the blunt/flat variant barely produces any chips and obviously plows through the work piece with minimal resistance. This also shows in the differences between the involved rake angles for the blunt/flat variant, which are basically all identical. This can be attributed to the elliptical circumference and the edge radius featuring little variation in actually resulting cutting angles. In contrast, the sharp/flat abrasives show high differences in grinding forces based on their individual rake angles. The −60° angle produces the lowest grinding forces for sharp/flat abrasives and grinding forces increase linearly with higher rake angle. The rake angle dependence of the sharp/flat variant is consistently linear independent of infeed depth with a small exception for 12 μm infeed depth and +30° rake angle. This inconsistency is a result of the abrasive indenting so far that it presents a new cutting edge near the surface, which results in the formation of a chip where before material was only plowed and squeezed. Comparing these results to the topographies shown in Supplementary Figures S1, S2 reveals, that the grinding forces correlate well with the amount of squeezed and plowed material, which increases with increasing rake angle and corresponds to a transition from cutting to plowing/squeezing.
Lastly, the ship configuration features the highest grinding forces of all abrasives. The grinding forces of the 0° variant are at least comparable to the grinding forces of the other orientations, but the 60° and 90° variants and their overall average grinding forces are about 50%–100% higher. The grinding forces are about 4 times higher than an efficient edge or flat abrasive would produce. An overview of all six variants is shown in supplementary Supplementary Figure S3. Since much more material is moved in this orientation, a comparison of other factors is needed to finally judge the efficiency of the ship configuration, which is shown in Figure 5.
Figure 5 follows the same data representation format as Figure 4, but displays surface quality, material removal rate, and maximum chip temperature. These data clusters represent three of the most important key indicators for grinding processes: surface quality, productivity, and work piece integrity.
Starting with surface roughness, the median Sq is highly dependent on the infeed depth, ranging from below 1to 7 μm. The range of results varies more for sharp abrasives than blunt ones, with sharp edge orientations showing the best results and ship configuration being the worst, demonstrating generally the highest roughness values for both sharp and blunt. For the sharp abrasives, the roughness is higher by a factor of two for flat variants compared to the edge variants, while once the abrasives turn blunt the difference between the two orientations virtually disappears, settling to a value line in between the sharp flat and edge orientations. The ship configuration shows higher roughness with lower rotation angles as this enhances the “tunneling” of the abrasives through the work piece, which results in high material pile-ups next to the scratch. In terms of rake angles the sharp/flat variant demonstrates, in accordance to the trend of the grinding forces, a linear dependence on roughness, with higher rake angles leading to more plowing and, therefore, higher roughness. An exception to this is the higher roughness for a rake angle of −60°, which might be induced by the material pile-ups formed during the initial indenting of the abrasive. The sharp/edge abrasives present similar roughness independent of the rake angle as they always cleanly cut the work piece, producing chips for all rake angles. For the blunt/edge abrasives there is a similar trend as for the sharp abrasives, with higher rake angles resulting in more plowing and, thus, roughness, whereas for the blunt/flat abrasives there is no clear trend visible as they only plow the material irrespective of their rake angle. There seems to be a general correlation between grinding forces and surface quality for all abrasives producing chips, where they feature higher roughness with higher grinding forces and vice versa—Though this correlation does not hold when no chips are formed (i.e., blunt/flat). This also excludes the ship configuration, which features low grinding forces but high roughness for abrasives with 0° orientation. This can be traced back to the pure plowing of the blunt/flat and the ship 0° abrasives, which results in low grinding forces as the material flows around the particle but produces considerable roughness.
The material removal rate (MRR) ranges from 0 to over 350 μm3/μm and the median would be around 50 μm3/μm, though many of the sharp ship variants show greatly higher than average values and there are some variants that obviously do not remove any material at all. Again, the infeed depth greatly influences the results with higher infeed depths typically resulting in more removed material. Apart from the −30° rake angle at an infeed depth of 12 μm, no blunt/flat abrasives remove material properly, they only plow the material, produce virtually no chip at all, and are thus useless for any grinding operation. This is also directly connected to the equally low grinding forces for all four rake angles observed before. The result is in stark contrast to the blunt/edge variant, which all feature above-average MRR, which can be again traced back to the defined cutting edge the blunt particles have in their edge orientation and the complete absence of such a cutting edge in the flat orientation. The difference in MRR between the sharp/edge and sharp/flat abrasives is small, and the MRR for sharp/flat is only slightly lower than that of blunt/edge abrasives because all these abrasives effectively cut the work piece and produce chips. The slightly higher MRR for blunt/edge abrasives is a result of the greater contact area between blunt abrasives and work piece. Looking at the ship orientation, we observe a great difference in results between sharp and blunt abrasives. Even though we find one rotational orientation in each group that features an MRR close to zero, the high values of 150–350 μm3/μm will only occur for sharp abrasives, while blunt abrasives do not surpass 150 μm3/μm. This was already observed previously, where the blunt/ship variants struggled to produce a proper chip in the first place, but rather tend to “tunnel” through the work piece, squeezing and plowing a large amount of material. In contrast, sharp ships exhibit proper chip generation in two out of three rotational orientations (Supplementary Figure S3).
The last pair of graphs shows the maximum chip temperature and is therefore an important indicator for the heat introduced into the work piece, thereby representing the work piece damage potential of each variant. The lowest values are calculated slightly below 400 K, with average values around 550 K and the highest above 650 K. Infeed depth does not constitute a dominant impact in this case, but rake angle and orientation do. This is the only graph that includes the ship variants amid all other variants that do not feature extreme values, as might be expected due to the high amount of affected material. This may be an artifact of the “chips” temporarily including the ridges of the plowing abrasives that are thermally well-connected with the work piece and can therefore not heat up as much. Furthermore, the range of temperatures is similar for sharp and blunt abrasives, but the clusters vary. The lowest heat values are generated by sharp/edge −30° and the highest by sharp/flat 0°. An investigation of both variants shows, that sharp/flat 0° features a rather high grinding force, but all other values are average, while sharp/edge −30° shows no particular feature at all and the grinding forces are very average. However, the simulation of sharp/edge −30° was cut short as it had to aborted early, thus creating less overall heat, which is probably the main reason for the low chip temperature. Apart from that, there is a general correlation with MRR and grinding forces, which is also valid for real grinding processes in addition to the actual chip morphology (Wang et al., 2020; Wei et al., 2022). In comparison to the above, the situation with blunt abrasives seems fairly obvious. While the blunt/flat variants produce a constant low heat, they are also the variants without proper MRR and very low grinding forces. The blunt/edge variants, on the other hand, feature similar heat generation as the sharp abrasives, and they also feature a 150 K variance of results depending on their rake angles. Here, the rake angle dependence of the heat generation perfectly correlates with the grinding forces: higher grinding forces also produce more heat. Finally, for the ship orientation, the results vary between sharp and blunt abrasives by some 100 K, with sharp being higher. The differences due to rotational orientation are only about 50 K, so although some ship variants did not produce proper chips, the heat of a calculated chip is equally high. This means that heat will remain in the work piece. The generated heat does not correlate well with other measures for sharp abrasives, but the most prominent influence is the rake angle, spanning about 200 K for the edge and flat orientations, with the flat orientation being hotter. Overall, our results show that the simulated approach produces realistic and comprehensible data.
Such strong correlations between MRR, grinding forces, and chip temperature are regularly found in literature (Jin and Stephenson, 2006; Malkin and Guo, 2007; Klocke, 2018; Ren et al., 2019) and observed in various real-life applications, even though temperatures in grinding processes are difficult to measure. There are several limiters on the maximum temperature for a good grinding process of steel, such as the austenitizing temperature of around 730°C or surface softening temperatures of around 400°C, depending on the steel in question (Jin and Stephenson, 2006). The actual measurement of temperatures in a grinding process is limited by the applied technology and methods. Temperatures found in literature can vary from a few hundred degrees when measuring via work piece contact (Hadad et al., 2012), up to and above 1000°C when measuring the surfaces of abrasives or sparks via wavelength analysis (Ueda et al., 1993). Since with our methods, we directly simulate the work piece heat and energy, temperatures between 100°C and 600°C would be expected (Malkin and Guo, 2007; Baumgart et al., 2018), which is very well in line with our results.
3.2 Multi-abrasive grinding
In this section, we will now generalize the concepts introduced above for single-abrasive grinding to multi-abrasive grinding. This is done for several reasons: Firstly, as important as it is to understand the interaction between a single abrasive and the work piece, real grinding processes feature a multitude of abrasives that interact with the surface simultaneously. As the abrasives are confronted with ever-changing topographic scenarios produced by preceding abrasives, the abrasives also implicitly interact with each other. Secondly, we were interested in setting up a workflow that could make the best of the MPM method to simulate a realistic grinding process while working around the shortcomings of the implementation of the available MPM code. Thirdly, we wanted to compare the results obtained from these multi-abrasive and multi-pass MPM simulations with those obtained from pre-existing MD simulations (Eder et al., 2022), normalized by the size of the abrasive.
Figure 6 shows 3D-snapshots of the four sets of multi-abrasive simulations we carried out, with two different abrasive shapes (i.e., sharp and blunt) and two different abrasive orientations (i.e., edge and flat). Note that the shown snapshots comprise the entire modeled system, including the extended work piece real estate as well as the two ghost abrasives to allow us to implement the pseudo-periodic boundary conditions as described in the computational methods section.
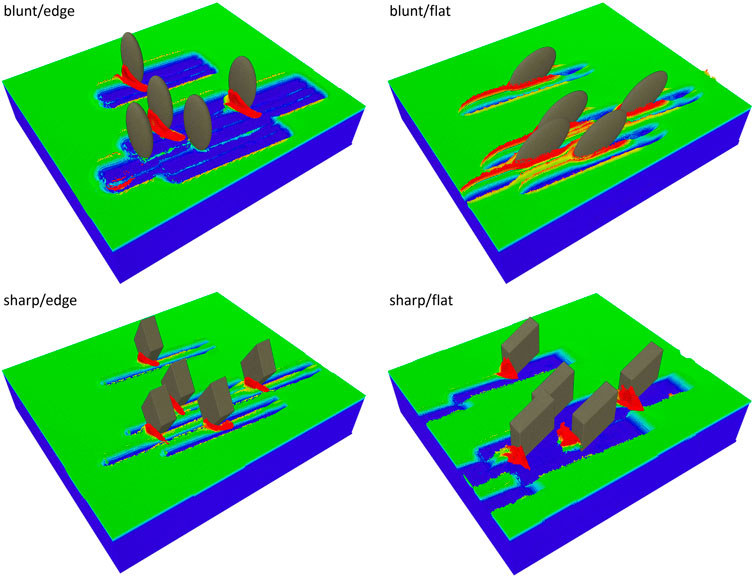
FIGURE 6. 3D visualizations of the four configurations (sharp and blunt abrasives in flat and edge orientations) used for the pseudo-periodic multi-abrasive MPM simulations. Since we had to work around periodic boundary conditions, the ghost-versions of the two abrasives exiting the simulation box during each simulation run are explicitly modeled, making a total of 5 abrasives. The infeed depth was 5 μm in all simulations, and the snapshots were taken after the first grinding pass.
In Figure 7, we have compiled a chronology of all four systems’ topographic development of the evaluation region, with top views shown just after the first indentation of the abrasives, as well as after 2, 3, 4, 5, and 6 grinding passes. The chips have already been removed from this view to focus on the topography.
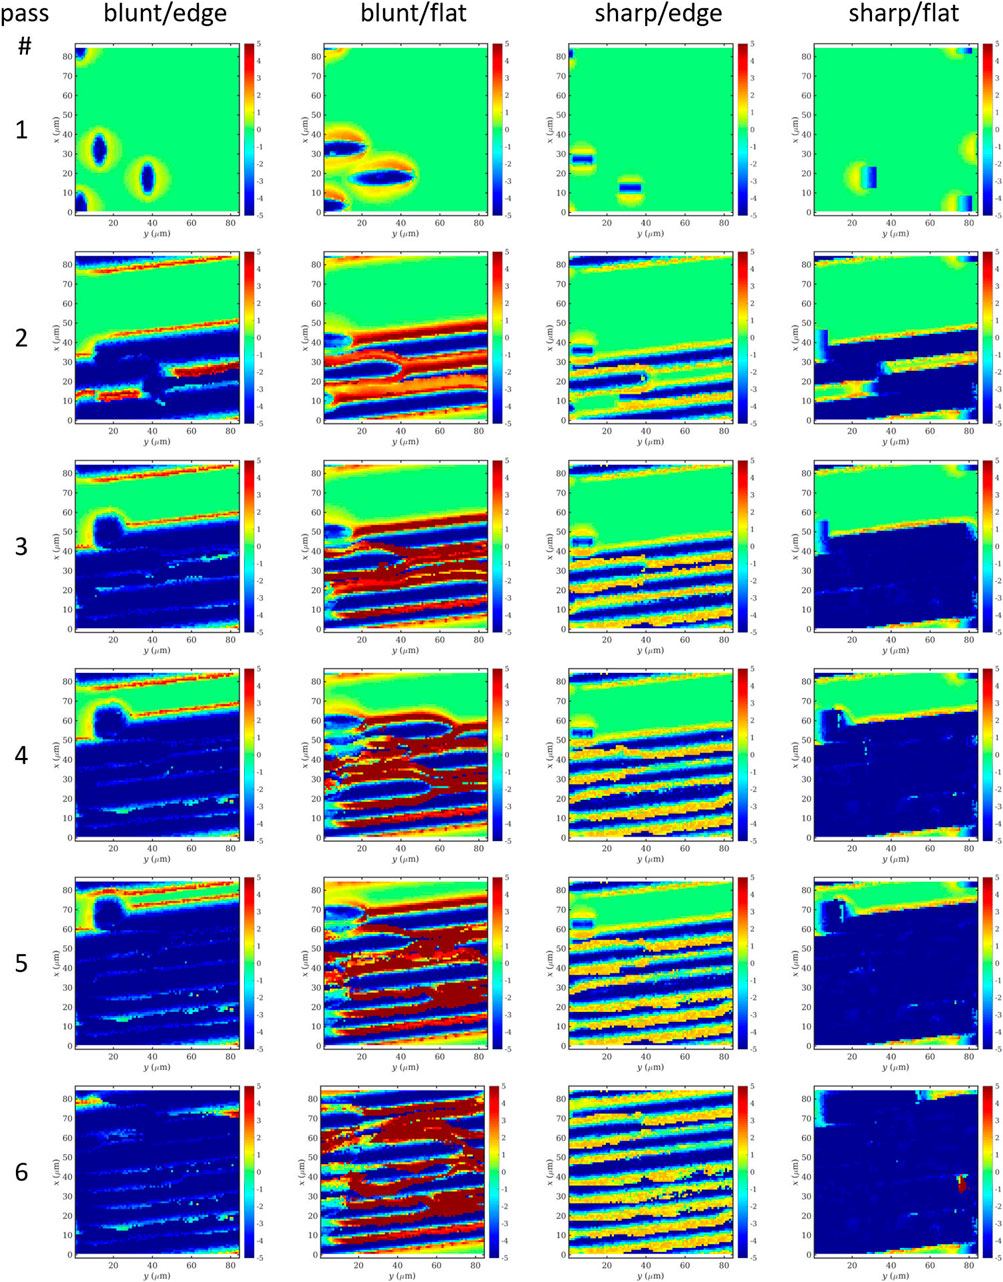
FIGURE 7. Surface topography of an MPM work piece ground with blunt or sharp abrasives in two configurations each (edge and flat) after several passes using pseudo-periodic boundary conditions.
From this overview, it is already obvious that there are two main resulting topography types: one where chips have been cleanly formed and removed, leading to an evenly machined surface, and another, characterized by plowing, where there is a clearly visible groove pattern on the final surface. What is perhaps surprising at first glance is that the most similar surfaces are being produced with blunt/edge and sharp/flat abrasives (even surface), as well as with blunt/flat and sharp/edge abrasives (groove pattern). The reason for this counter-intuitive result is that the rounded contour of the blunt abrasive in edge orientation effectively leads to a much broader cutting face than its sharp counterpart, while maintaining a largely favorable rake angle where material pile-up is minimal. The sharp/edge abrasive effectively produces chips without generating much material-pile up, but the scratch is simply too narrow, leading to little overlap between the abrasives and, therefore, to the observed groove pattern. This is in accordance to the observations made for single-abrasive grinding, which demonstrated high material removal rate with good surface quality for blunt/edge abrasives at 0° rake angle. Conversely, as the sharp/flat abrasive, which cuts with its narrower edge, becomes blunt, the resulting blunt/flat configuration deteriorates into pure plowing without any noticeable chip formation and the production of high grinding ridges.
A quantification of the corresponding removed matter depth and the RMS roughness (Sq roughness parameter) as a function of the grinding distance is shown in the top row of Figure 8. In this rendering, the removed matter has a negative sign, so the orange curve for blunt/flat that trends towards positive values must be an artifact of the pseudo-periodic boundary conditions, which allows for the possibility of matter being transported from outside the evaluation region to within, while due to pure plowing no chips are being formed that would lead to a net removal of matter. As the flat and the edge configurations represent rather extreme configurations of the abrasives, while typical (random) abrasive orientations will most likely lie somewhere between the two, we considered it helpful to also provide the average curves for sharp and blunt abrasives, shown in black. The trends of the removed matter are also reflected in the time-dependent roughness of the work piece, shown in the top right panel. The two favorable abrasive configurations, sharp/flat and blunt/edge, which lead to steadily high material removal, exhibit a trend of initially rising surface roughness and then decreasing roughness as the surface is evenly machined. By contrast, the two unfavorable configurations do not feature this downward trend in roughness, where the sharp/edge configuration seems like it may saturate to a roughness of 3 μm, while the blunt/flat configuration actually keeps deteriorating the surface quality, surpassing the expected roughness by a factor of two by the end of the simulation.
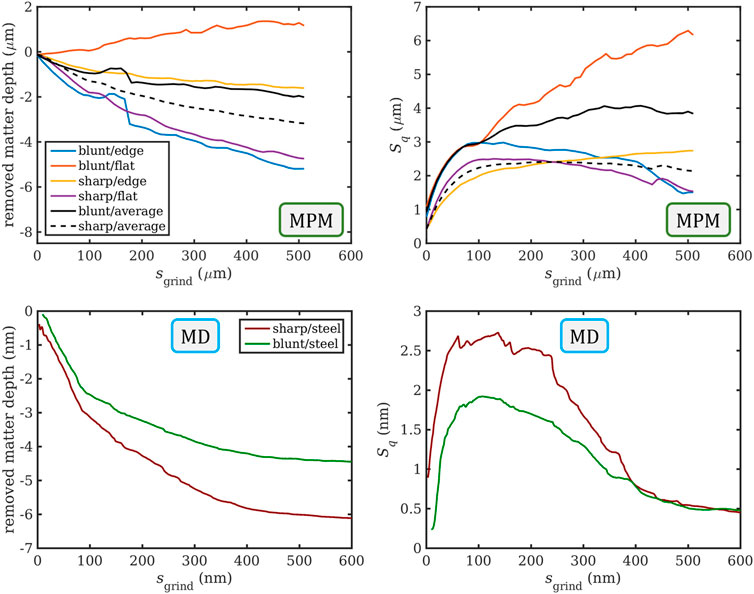
FIGURE 8. Removed matter depth and RMS roughness (Sq) as functions of the grinding distance for the four abrasive configurations studied using MPM, including trends that were averaged over the two extreme orientations (top), compared to similar MD simulations of grinding steel, scaled down by a linear factor of 1000, with data taken from Ref. (Eder et al., 2022). (bottom).
The bottom row of Figure 8 shows the corresponding results of the existing MD simulations for steel from Ref. (Eder et al., 2022). As a general guide for comparison, all lengths that are μm in the MPM simulations are nm in their MD counterparts. As shown in the snapshot in Figure 1, the MD abrasives are randomly oriented, so we would have expected their behavior to be comparable to the black average curves in the top row of Figure 8, which is clearly the case for the removed matter depth shown in the left column. This is because for the blunt abrasives, one of the extreme orientations effectively removes matter and one does not remove matter at all, whereas the sharp abrasives always remove matter irrespective of orientation. For the RMS roughness on the right side, the correspondence is not as clear cut. While the averaged MPM curves (top right) suggest that the sharp abrasives clearly outperform the blunt ones, as might be expected, this behavior seems to be dominated by the catastrophic performance of the blunt/flat configuration, and it is non-trivial to estimate which proportion of abrasives might be in this worst-case orientation on a real grinding tool. In the MD simulations (bottom right), the maximum work piece roughness at otherwise identical infeed depth is actually lower for the blunt abrasives, which is a result of their smoother abrasive contours while still largely maintaining their ability to cut a chip. Furthermore, the proper implementation of periodic boundary conditions in the MD simulations allows the abrasives to fully machine the work piece surface three times by the end of the simulation, which leads to the work piece roughness obtained with sharp and blunt abrasives to be almost identical, while the material removal performance would still clearly lead to a favoring of sharp abrasives over blunt ones. It may be tempting to blame size effects for any inconsistencies between the MPM and the MD results. However, in our previous study (Eder et al., 2022), where we compared MD results with experimental data (which featured abrasives of similar size as the MPM system) for sharp and blunt abrasives, the trend in the influence of abrasive bluntness on the normalized surface roughness was the same, and even the quantitative results were so similar that the error bars overlapped to a considerable degree. We would therefore argue that size effects play a subordinate role here.
4 Conclusion and outlook
In this work, we carried out an in-depth simulative analysis of grinding processes on steel using the mesh-free material point method (MPM). We studied the influence of the shape, orientation, and rake angle of a single abrasive on chip formation and morphology as well as on the surface quality of the resulting scratch. The results were first discussed in a qualitative way from the perspective of a surface processing engineer, but then also quantified in terms of the grinding forces, surface roughness, material removal rate, and chip temperature.
As grinding processes usually entail a multitude of abrasives, the main focus was to then generalize and extend this single-abrasive grinding approach to a multi-abrasive approach with pseudo-periodic boundary conditions. This revealed how the interaction of the abrasives with a work piece surface that had been in previous contact with other abrasives changed the final topography and made the transition from the consideration of a single-scratch to that of a fully machined surface. The latter aspect also allows a better appraisal of quantities such as the material removal rate and surface roughness, as these cannot be correctly reproduced using only single scratches. The pseudo-periodic multi-abrasive simulations were compared with existing data from molecular dynamics (MD) simulations, which were performed on a polycrystalline steel system that is scaled down by a factor of 1000 along all linear dimensions. Generally, the results of the multi-abrasive simulations agreed well with those from the single-abrasive simulations, and the same variants resulted in high MRR and surface quality. The comparison between MPM and MD works well for the removed matter depth, but for the work piece roughness, the consideration of an extreme abrasive shape/orientation dominates the MPM results, leading to a poorer correspondence between MD and MPM.
Internal trials at grinding labs or universities usually feature the measurement of the machine power to calculate grinding forces accordingly and evaluate damage potential—This is usually set as a critical exclusion criterion. For more accurate data, trials include complex force or direct heat measurements, e.g., via glass fibers inserted into the work piece. These results typically feature many specific variables and are therefore difficult to transfer to different setups and applications, while a simulated approach, such as this one, can cut down costs and time significantly. Apart from this typical process-driven objective, other options are shown in the simulation results. With the variation of shapes, angles, and rotation, there is plenty of room for improvement of actual abrasive shapes, especially in the realm of sintered ceramic grains. These usually generate high development costs, for each iteration of shape has to be tested in live trials, which does not only increase costs, but also significantly slows down the process of finding a new optimal shape for a certain application. The approach outlined here could lead to a much more efficient and streamlined development of new grain shapes and sizes for certain applications. Furthermore, it is possible to improve reshaping processes, such as the dressing of grinding wheels, since depending on individual shapes and orientations, the wear of a grain has a range of effects on the key results obtained from the simulation. Thus, with individual targets for the various parameters having been set, an optimal dressing strategy could be predicted.
Data availability statement
The original contributions presented in the study are included in the article/Supplementary Material, further inquiries can be directed to the corresponding author.
Author contributions
SL: Conceptualization; Methodology; Visualization; Investigation; Software; Writing—Original draft. PG: Investigation; Writing—Original draft. HH: Investigation; Writing—Original draft. SE: Conceptualization; Data curation; Formal analysis; Visualization; Investigation; Software; Methodology; Writing—Original draft.
Funding
This work was partly funded by the Austrian COMET-Program (Project K2 InTribology1, no. 872176) and carried out at the “Excellence Centre of Tribology”. SL and SE Acknowledge the Austrian Research Promotion Agency FFG (Project SyFi, no. 864790). The presented computational results were obtained in part using the Vienna Scientific Cluster (VSC). Open access funding was provided by TU Wien (TUW).
Conflict of interest
SL and SE were employed by the company AC2T research GmbH. HH was employed by Tyrolit—Schleifmittelwerke Swarovski K.G.
The remaining author declares that the research was conducted in the absence of any commercial or financial relationships that could be construed as a potential conflict of interest.
Publisher’s note
All claims expressed in this article are solely those of the authors and do not necessarily represent those of their affiliated organizations, or those of the publisher, the editors and the reviewers. Any product that may be evaluated in this article, or claim that may be made by its manufacturer, is not guaranteed or endorsed by the publisher.
Supplementary material
The Supplementary Material for this article can be found online at: https://www.frontiersin.org/articles/10.3389/fmtec.2023.1114414/full#supplementary-material
References
Afazov, S., Ratchev, S., and Segal, J. (2010). Modelling and simulation of micro-milling cutting forces. J. Mater. Process. Technol. 210 (15), 2154–2162. doi:10.1016/j.jmatprotec.2010.07.033
Bardenhagen, S. G., and Kober, E. M. (2004). The generalized interpolation material point method. Comput. Model. Eng. Sci. 5 (6), 447–495.
Baumgart, C., Heizer, V., and Wegener, K. (2018). In-process workpiece based temperature measurement in cylindrical grinding. Procedia CIRP 77, 42–45. doi:10.1016/j.procir.2018.08.206
COMSOL (1986). MultiphysicsⓇ v. 5.2a. Stockholm, Sweden: COMSOL AB. Avaliable At: www.comsol.com.
De Pellegrin, D., and Stachowiak, G. (2004). Sharpness of abrasive particles and surfaces. Wear 256 (6), 614–622. doi:10.1016/j.wear.2003.10.004
Eder, S. J., Bianchi, D., Cihak-Bayr, U., and Gkagkas, K. (2017). Methods for atomistic abrasion simulations of laterally periodic polycrystalline substrates with fractal surfaces. Comput. Phys. Commun. 212, 100–112. doi:10.1016/j.cpc.2016.10.017
Eder, S. J., Bianchi, D., Cihak-Bayr, U., Vernes, A., and Betz, G. (2014). An analysis method for atomistic abrasion simulations featuring rough surfaces and multiple abrasive particles. Comput. Phys. Commun. 185 (10), 2456–2466. doi:10.1016/j.cpc.2014.05.018
Eder, S. J., Cihak-Bayr, U., Bianchi, D., Feldbauer, G., and Betz, G. (2017). Thermostat influence on the structural development and material removal during abrasion of nanocrystalline ferrite. ACS Appl. Mater. Interfaces 9 (15), 13713–13725. doi:10.1021/acsami.7b01237
Eder, S. J., Cihak-Bayr, U., and Bianchi, D. (2017). “Large-scale molecular dynamics simulations of nanomachining,” in Advanced machining processes: Innovative modeling techniques. 1st Edn (Boca Raton: CRC Press).
Eder, S. J., Cihak-Bayr, U., and Bianchi, D. (2016). Single-asperity contributions to multi-asperity wear simulated with molecular dynamics. IOP Conf. Ser. Mater. Sci. Eng. 119, 012009. doi:10.1088/1757-899X/119/1/012009
Eder, S. J., Grützmacher, P., Spenger, T., Heckes, H., Rojacz, H., Nevosad, A., et al. (2022). Experimentally validated atomistic simulation of the effect of relevant grinding parameters on work piece topography, internal stresses, and microstructure. Friction 10 (4), 608–629. doi:10.1007/s40544-021-0523-3
Eder, S. J., Leroch, S., Grützmacher, P., Spenger, T., and Heckes, H. (2021). A multiscale simulation approach to grinding ferrous surfaces for process optimization. Int. J. Mech. Sci. 194, 106186106186. doi:10.1016/j.ijmecsci.2020.106186
Eder, S., Vernes, A., and Betz, G. (2014). Methods and numerical aspects of nanoscopic contact area estimation in atomistic tribological simulations. Comput. Phys. Commun. 185 (1), 217–228. doi:10.1016/j.cpc.2013.09.021
Gopal, A. V., and Rao, P. V. (2003). Selection of optimum conditions for maximum material removal rate with surface finish and damage as constraints in sic grinding. Int. J. Mach. Tools Manuf. 43 (13), 1327–1336. doi:10.1016/s0890-6955(03)00165-2
Groeber, M. A., and Jackson, M. A. (2014). DREAM.3D: A digital representation environment for the analysis of microstructure in 3D. Integrating Mater. Manuf. Innovation 3 (1), 56–72. doi:10.1186/2193-9772-3-5
Grützmacher, P. G., Gachot, C., and Eder, S. J. (2020). Visualization of microstructural mechanisms in nanocrystalline ferrite during grinding. Mater. Des. 195, 109053. doi:10.1016/j.matdes.2020.109053
Hadad, M., Tawakoli, T., Sadeghi, M., and Sadeghi, B. (2012). Temperature and energy partition in minimum quantity lubrication-MQL grinding process. Int. J. Mach. Tools Manuf. 54, 10–17. doi:10.1016/j.ijmachtools.2011.11.010
Henriksson, K. O., and Nordlund, K. (2009). Simulations of cementite: An analytical potential for the fe-c system. Phys. Rev. B 79 (14), 144107. doi:10.1103/physrevb.79.144107
Jin, T., and Stephenson, D. (2006). Analysis of grinding chip temperature and energy partitioning in high-efficiency deep grinding. Proc. Institution Mech. Eng. Part B J. Eng. Manuf. 220 (5), 615–625. doi:10.1243/09544054jem389
Johnson, G. R., and Cook, W. H. (1985). Fracture characteristics of three metals subjected to various strains, strain rates, temperatures and pressures. Eng. Fract. Mech. 21 (1), 31–48. doi:10.1016/0013-7944(85)90052-9
Karasawa, H., Yoshida, T., Fukui, R., Kizaki, T., Fujii, K., and Warisawa, S. (2019). Analysis of chip shape distribution using image processing technology to estimate wearing condition of gear grinding wheel. Procedia CIRP 81, 381–386. doi:10.1016/j.procir.2019.03.066
Klocke, F. (2018). Fertigungsverfahren 1: Zerspanung mit geometrisch bestimmter Schneide. Berlin, Germany: Springer-Verlag.
Kopac, J., and Krajnik, P. (2006). High-performance grinding—A review. J. Mater. Process. Technol. 175 (1-3), 278–284. doi:10.1016/j.jmatprotec.2005.04.010
Krajnik, P., Hashimoto, F., Karpuschewski, B., da Silva, E. J., and Axinte, D. (2021). Grinding and fine finishing of future automotive powertrain components. CIRP Ann. 70 (2), 589–610. doi:10.1016/j.cirp.2021.05.002
Kugalur Palanisamy, N., Rivière Lorphèvre, E., Arrazola, P. J., and Ducobu, F. (2022). Influence of coulomb’s friction coefficient in finite element modeling of orthogonal cutting of Ti6Al4V. Key Eng. Mater. 926, 1619–1628. doi:10.4028/p-be47dp
Leroch, S., Eder, S. J., Ganzenmüller, G., Murillo, L., and Ripoll, M. (2018). Development and validation of a meshless 3D material point method for simulating the micro-milling process. J. Mater. Process. Technol. 262, 449–458. doi:10.1016/j.jmatprotec.2018.07.013
Leroch, S., Eder, S. J., Varga, M., and Ripoll, M. R. (2022). Material point simulations as a basis for determining Johnson-Cook hardening parameters via instrumented scratch tests. Research Square [Preprint]. doi:10.21203/rs.3.rs-1674282/v1
Malkin, S., and Guo, C. (2007). Thermal analysis of grinding. CIRP Ann. 56 (2), 760–782. doi:10.1016/j.cirp.2007.10.005
Markopoulos, A. P., Karkalos, N. E., and Papazoglou, E. L. (2020). Meshless methods for the simulation of machining and micro-machining: A review. Archives Comput. Methods Eng. 27 (3), 831–853. doi:10.1007/s11831-019-09333-z
Miavaghi, A. S., and Kangarlou, H. (2017). Experimental modeling of dry friction coefficient between steel and aluminum alloy in the condition of severe plastic deformation. Dicle Üniversitesi Fen Bilim. Enstitüsü Derg. 6 (1), 10–16. doi:10.22453/LSJ-018.1.098105
Mishra, T., de Rooij, M., and Schipper, D. J. (2021). The effect of asperity geometry on the wear behaviour in sliding of an elliptical asperity. Wear 470, 203615. doi:10.1016/j.wear.2021.203615
Mishra, T., de Rooij, M., Shisode, M., Hazrati, J., and Schipper, D. J. (2020). A material point method based ploughing model to study the effect of asperity geometry on the ploughing behaviour of an elliptical asperity. Tribol. Int. 142, 106017. doi:10.1016/j.triboint.2019.106017
Patel, D. K., Goyal, D., and Pabla, B. (2018). Optimization of parameters in cylindrical and surface grinding for improved surface finish. R. Soc. open Sci. 5 (5), 171906. doi:10.1098/rsos.171906
Plimpton, S. (1995). Fast parallel algorithms for short-range molecular dynamics. J. Comput. Phys. 117 (1), 1–19. doi:10.1006/jcph.1995.1039
Rasim, M., Mattfeld, P., and Klocke, F. (2015). Analysis of the grain shape influence on the chip formation in grinding. J. Mater. Process. Technol. 226, 60–68. doi:10.1016/j.jmatprotec.2015.06.041
Ren, L., Zhang, G., Wang, Y., Zhang, Q., Wang, F., and Huang, Y. (2019). A new in-process material removal rate monitoring approach in abrasive belt grinding. Int. J. Adv. Manuf. Technol. 104 (5), 2715–2726. doi:10.1007/s00170-019-04124-z
Sato, B. K., Lopes, J. C., Diniz, A. E., Rodrigues, A., De Mello, H., Sanchez, L., et al. (2020). Toward sustainable grinding using minimum quantity lubrication technique with diluted oil and simultaneous wheel cleaning. Tribol. Int. 147, 106276. doi:10.1016/j.triboint.2020.106276
Sridhar, P., Rodríguez Prieto, J. M., and de Payrebrune, K. M. (2022). Modeling grinding processes—Mesh or mesh-free methods, 2D or 3D approach? J. Manuf. Mater. Process. 6 (5), 120. doi:10.3390/jmmp6050120
Stephenson, D. J., Veselovac, D., Manley, S., and Corbett, J. (2001). Ultra-precision grinding of hard steels. Precis. Eng. 25 (4), 336–345. doi:10.1016/s0141-6359(01)00087-3
Stukowski, A., and Albe, K. (2010). Extracting dislocations and non-dislocation crystal defects from atomistic simulation data. Model. Simul. Mater. Sci. Eng. 18 (8), 085001. doi:10.1088/0965-0393/18/8/085001
Sulsky, D., Chen, Z., and Schreyer, H. L. (1994). A particle method for history-dependent materials. Comput. methods Appl. Mech. Eng. 118 (1-2), 179–196. doi:10.1016/0045-7825(94)90112-0
Ueda, T., Tanaka, H., Torii, A., and Matsuo, T. (1993). Measurement of grinding temperature of active grains using infrared radiation pyrometer with optical fiber. CIRP Ann. 42 (1), 405–408. doi:10.1016/s0007-8506(07)62472-x
Varga, M., Leroch, S., Eder, S. J., Rojacz, H., and Ripoll, M. R. (2019). Influence of velocity on high-temperature fundamental abrasive contact: A numerical and experimental approach. Wear 426, 370–377. doi:10.1016/j.wear.2018.12.013
Varga, M., Leroch, S., Gross, T., Rojacz, H., Eder, S., Grillenberger, M., et al. (2021). Scratching aluminium alloys – modelling and experimental assessment of damage as function of the strain rate. Wear 476, 203670. doi:10.1016/j.wear.2021.203670
Wallstedt, P. C., and Guilkey, J. E. (2007). Improved velocity projection for the material point method. Comput. Model. Eng. Sci. 19 (3), 223–232. doi:10.3970/cmes.2007.019.223
Wang, B., Liu, Z., Cai, Y., Luo, X., Ma, H., Song, Q., et al. (2021). Advancements in material removal mechanism and surface integrity of high speed metal cutting: A review. Int. J. Mach. Tools Manuf. 166, 103744. doi:10.1016/j.ijmachtools.2021.103744
Wang, J. S., Zhang, X. D., and Fang, F. Z. (2020). Numerical study via total Lagrangian smoothed particle hydrodynamics on chip formation in micro cutting. Adv. Manuf. 8 (2), 144–159. doi:10.1007/s40436-020-00297-z
Wang, W., Hua, D., Luo, D., Zhou, Q., Eder, S. J., Li, S., et al. (2022). Exploring the nano-polishing mechanisms of invar. Tribol. Int. 175, 107840. doi:10.1016/j.triboint.2022.107840
Wegener, K., Bleicher, F., Krajnik, P., Hoffmeister, H. W., and Brecher, C. (2017). Recent developments in grinding machines. CIRP Ann. 66 (2), 779–802. doi:10.1016/j.cirp.2017.05.006
Wei, X., Wang, X., Qu, D., Zhu, Z., Chen, W., Chen, W., et al. (2022). Molecular dynamics simulation of chip morphology in nanogrinding of monocrystalline nickel. Coatings 12 (5), 647. doi:10.3390/coatings12050647
Wilk, W., and Tota, J. (2008). “Modern technology of the turbine blades removal machining,” in Proceedings of the 8 international conference advanced manufacturing operations (Kranevo, Bulgaria: Spinger).
Keywords: grinding modeling, material point method, molecular dynamics, bridging scales, abrasive shape
Citation: Leroch S, Grützmacher PG, Heckes H and Eder SJ (2023) Towards a multi-abrasive grinding model for the material point method. Front. Manuf. Technol. 3:1114414. doi: 10.3389/fmtec.2023.1114414
Received: 02 December 2022; Accepted: 23 January 2023;
Published: 03 February 2023.
Edited by:
Nikolaos Karkalos, National Technical University of Athens, GreeceReviewed by:
Angelos P. Markopoulos, National Technical University of Athens, GreeceAkinjide Oluwajobi, Obafemi Awolowo University, Nigeria
Copyright © 2023 Leroch, Grützmacher, Heckes and Eder. This is an open-access article distributed under the terms of the Creative Commons Attribution License (CC BY). The use, distribution or reproduction in other forums is permitted, provided the original author(s) and the copyright owner(s) are credited and that the original publication in this journal is cited, in accordance with accepted academic practice. No use, distribution or reproduction is permitted which does not comply with these terms.
*Correspondence: S. J. Eder, c3RlZmFuLmouZWRlckB0dXdpZW4uYWMuYXQ=