 Javier Villena Toro
 Anton Wiberg
 Mehdi Tarkian
- Design Automation Laboratory, Division of Product Realisation, Department of Management and Engineering, Linköping Univeristy, Linköping, Sweden
Introduction: Digitization is a crucial step towards achieving automation in production quality control for mechanical products. Engineering drawings are essential carriers of information for production, but their complexity poses a challenge for computer vision. To enable automated quality control, seamless data transfer between analog drawings and CAD/CAM software is necessary.
Methods: This paper focuses on autonomous text detection and recognition in engineering drawings. The methodology is divided into five stages. First, image processing techniques are used to classify and identify key elements in the drawing. The output is divided into three elements: information blocks and tables, feature control frames, and the rest of the image. For each element, an OCR pipeline is proposed. The last stage is output generation of the information in table format.
Results: The proposed tool, called eDOCr, achieved a precision and recall of 90% in detection, an F1-score of 94% in recognition, and a character error rate of 8%. The tool enables seamless integration between engineering drawings and quality control.
Discussion: Most OCR algorithms have limitations when applied to mechanical drawings due to their inherent complexity, including measurements, orientation, tolerances, and special symbols such as geometric dimensioning and tolerancing (GD&T). The eDOCr tool overcomes these limitations and provides a solution for automated quality control.
Conclusion: The eDOCr tool provides an effective solution for automated text detection and recognition in engineering drawings. The tool's success demonstrates that automated quality control for mechanical products can be achieved through digitization. The tool is shared with the research community through Github.
1 Introduction
Quality control is the process of verifying that a product or service meets certain quality standards. The purpose of quality control is to identify and prevent defects, non-conformities, or other problems in the product or service before it is delivered to the customer. Automating quality control can help to make the process more efficient and less error-prone. There are several reasons why automating quality control can be beneficial:
• Consistency: Automated quality control systems can ensure that the same standards are applied consistently to every product or service, reducing the risk of human error.
• Speed: Automated systems can process and analyze large amounts of data quickly and accurately, reducing the time needed for manual inspection and testing.
• Scalability: Automated systems can handle an increasing volume of products or services as production levels increase, without requiring additional human resources.
• Cost-effective: Automated systems can reduce labor costs, minimize downtime, and increase overall efficiency, leading to cost savings.
• Error detection: Automated systems can detect errors that might be difficult for human operators to spot, such as subtle defects or variations in patterns.
Overall, automation of quality control can help companies to improve the quality of their products or services, increase production efficiency, and reduce costs. Engineering drawings (EDs) play a crucial role in the quality control process of mechanical parts as they provide the contractual foundation for the design. Therefore, automating the reading of these EDs is the initial step towards fully automating the quality control process (Scheibel et al., 2021). EDs are 2D representations of complex systems and contain all relevant information about the systems (Moreno-García et al., 2018). These drawings come in different forms, including schematic and realistic representations. Examples of schematic EDs include piping and instrumentation diagrams (P&IDs) or electrical circuit diagrams which use symbols to model the system. Realistic representations include architectural and mechanical drawings, which are true physical representations of the system.
This paper examines the use of optical character recognition (OCR) for information retrieval in mechanical drawings. However, the methodology presented can also be applied to other types of EDs. OCR is a technique for identifying and extracting text from image inputs for further machine processing.
Computer-aided design (CAD) software is commonly used by engineers to generate and evaluate designs. Many commercial CAD software include production manufacturing information (PMI) workbenches to include manufacturing information as metadata. However, in many cases, companies have not yet implemented PMI in their CAD models, or there are incompatibilities between CAD and computer-aided manufacturing (CAM) software that slow down the flow of information. Currently, traditional EDs are the main channel for sharing geometric dimensioning and tolerancing (GD&T) and other textual data. This information is extracted manually and logged into other programs (Schlagenhauf et al., 2022). This task is time-consuming and error-prone, and even in cases of vertical integration within a company, the same activity may occur multiple times, such as from design-to-manufacturing and from manufacturing-to-quality control.
Despite the increasing use of CAD/CAM integration in the production process, given the fact that 250 million EDs are produced every year (Henderson, 2014), it is probable that billions of older EDs are in use and many of them are the only reminiscence of designs from the past. Three situations need to be confronted depending on the ED condition, increasing in complexity:
1. Vectorized EDs. CAD software can export drawings in multiple formats, such as “.pdf,” “.dxf,” or “.svg.” These vectorized formats contain text and line information that can be extracted without the need for OCR. If the CAD model is available, the geometrical information in the ED can be related to the CAD model using heuristics. They can easily be converted to the next category.
2. High-quality raster EDs. The ED only contains pixel information, with no readable geometrical or text information. However, the file has high quality and was obtained through a digital tool. The geometrical information is complete, but not accessible, requiring computer vision tools to link the information to a CAD model, if available.
3. Low-quality raster EDs. These typically include older, paper-based EDs that have been digitized through a scanner or camera. The files only contain pixel information and are susceptible to loss of content.
In order to achieve generalization, the developed OCR system has been tested on high-quality raster images. OCR systems typically consist of three or more steps: 1) image acquisition, 2) text detection, and 3) text recognition. Intermediate or additional steps may include image pre-processing, data augmentation, segmentation, and post-processing (Moreno-García et al., 2018). The methodology used to build this particular OCR system consists of five key components:
• Image segmentation: Divide, extract and suppress the ED information into two categories: information block and tables, GD&T information.
• Information block pipeline: Text detection and recognition for each individual box in the information block, aided by a developed ordering text algorithm.
• GD&T pipeline: Dual recognition model to predict on special symbols and regular characters.
• Dimension pipeline: Prediction and recognition on patches of the processed image, with post-processing techniques on recognition and a tolerance checker algorithm.
• Output generation: Storage of all information from the three pipelines in table format, supported by a colorful mask of the original ED to aid in reading and verifying predictions.
The paper begins with a literature review on general OCR, data extraction in EDs, and OCR in mechanical EDs. It then proceeds to present an analysis of the methodology, which comprises five key components and five supporting algorithms. The results are then compared with the latest contributions in the field, discussed in terms of their applications and limitations. The paper concludes with a discussion and summary of the findings in the Discussion and Conclusion sections.
2 Background and literature review
2.1 The mechanical engineering drawing, elements and standards
Within the mechanical engineering industry, there are several types of EDs that can be used to represent a product, depending on the type of information and the country of origin. The most common types are assembly drawings and production drawings. Assembly drawings contain partial or complete information about the assembly instructions for various parts, while production drawings, also known as machine drawings, typically contain information specific to a single part, such as information about its manufacture, surface finishing, tolerances, and grading.
In regards to the quality control process, the production ED is the principal document. The elements of a professional production ED are standardized by the International Organization for Standardization (ISO) and the American Society of Mechanical Engineers (ASME), among others, to ensure general understanding of the product’s geometrical requirements.
The first element to consider is the information block or data field. Relevant data such as general tolerancing of the part, acceptable tolerances if not indicated otherwise, general roughness, material, weight, and ED metadata are comprised within the information block. ISO 7200:2004 is the current international standard for the layout and content in the information block, but companies may choose and modify any other layout or standard of their convenience. Other relevant information regarding surface finishing, welding requirements, etc. can be either inside or outside of the information block. Refer to Figure 1 for an illustrated example.
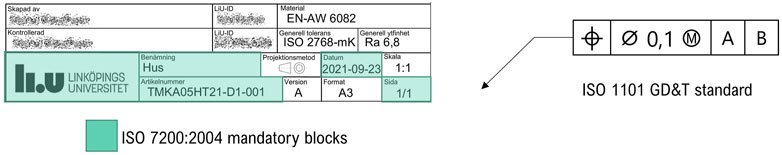
FIGURE 1. To the left, a typical Information block, it includes standard mandatory information and supplementary information. To the right, a typical feature control frame, FCF, following ISO 1101 GD&T standard.
Specific tolerancing and surface finishing is indicated together with dimensions in the views of the part. The part should have as many views as required to fully dimension the part, and the dimensions should be placed as evenly distributed as possible, and only contain the necessary dimensions to geometrically define the part. Other best practices should also be considered. The international standard for dimensioning is ISO 5459-1 and ISO 14405-1, while other standards are also broadly accepted such as ASME/ANSI Y14.5 in the USA and Canada, BS-8888 in the United Kingdom, and JIS-B-0401 in Japan.
In addition to tolerances attached to dimensions, other types of geometric tolerances can also be found in the so-called Feature Control Frame (FCF). The ASME Y14.5 and ISO 1101 standards cover the tolerance zone for the form, orientation, location, and run-out of features, also called GD&T. Refer to Figure 1 for an illustrated example.
Mastering the production and understanding of mechanical EDs is a career-long endeavor, and the vast amount of information and variations in the field cannot be fully covered in a single publication. This paper, from a research perspective, aims to establish a base tool that satisfies sufficient requirements to be used for quality control. In this chapter, we introduce a set of criteria to evaluate the tool’s performance and compare it to previous studies in the field.
R1. Support raster images and “.pdf” files as input formats. These are the two most common formats for finding EDs.
R2. Support the recognition of both assembly and production drawings. This includes the ability of the algorithm to differentiate tables and information blocks from geometrical information such as dimensions and other production drawing-related information.
R3. In line with R2., the algorithm should be also capable of sorting and grouping relevant information, and neglect information of reference.
R4. Tolerance recognition is a crucial requirement for the tool to be used in the quality control process. The tool must be able to accurately read and understand tolerance information.
R5. The tool should also be able to detect and recognize additional GD&T symbols and textual information inside the FCF.
2.2 Optical character recognition
In recent years, advancements in deep learning techniques have led to the widespread adoption of OCR in various applications, such as Google Translate or document scanning for identification documents, such as debit/credit cards or passports. In these contexts, the technology must be highly reliable and adaptable to poor image quality or varying lighting conditions.
The development of OCR technology dates back to the 1950s, when J. Rainbow created the first machine capable of scanning English uppercase characters at a rate of one per minute. Due to inaccuracies and slow recognition speed in early systems, OCR entered a period of relative stagnation that lasted for several decades, during which it was primarily used by government organizations and large enterprises. In the past 30 years, however, OCR systems have significantly improved, allowing for image analysis, support for multiple languages, a wide range of fonts and Unicode symbols, and handwriting recognition. Despite these advancements, the reliability of current OCR technology still lags behind that of human perception. Current research efforts in the field aim to further enhance OCR accuracy and speed, as well as support for new languages and handwritten text (Islam et al., 2016).
The advent of deep learning has greatly advanced OCR research. In recent literature, scene text detection and recognition algorithms such as EAST (Zhou et al., 2017), TextBoxes++ (Liao et al., 2018), ASTER (Shi et al., 2019), and Convolutional Recurrent Neural Network (CRNN) (Shi et al., 2017) have been introduced, along with labeled data sets for OCR such as ICDAR2015 (Karatzas et al., 2015) and COCO-Text (Veit et al., 2016). Popular open-source OCR frameworks include Tesseract (Smith, 2007), MMocr (Kuang et al., 2021), and keras-ocr (Morales, 2020).
Keras-ocr is a dual-model algorithm for text detection and recognition that provides an Application Programming Interface (API) API for custom training and alphabets. In the first stage, the detector predicts the areas with text in an image. The built-in detector is the CRAFT detection model from Baek et al. (2019). The recognizer then analyzes the cropped image generated by the detector’s bounding boxes to recognize characters one by one. The built-in recognizer is an implementation of CRNN in Keras, hence the name, keras-ocr. Keras is a high-level API built on top of Tensorflow for fast experimentation (Chollet, 2015).
2.3 Related work
This section provides an overview of current research in the detection and recognition of textual information, symbols, and other elements in engineering drawings. Much of the previous research has focused on P&ID diagrams, but the Section 2.3.1 delves deeper into the specific area of mechanical engineering drawings.
Previous studies, such as those by Moreno-García et al. (2017) and Jamieson et al. (2020), have made significant contributions to the field through the implementation of heuristics for segmentation in P&ID diagrams and the application of advanced deep learning techniques in OCR for raster diagrams, respectively. Other research, such as that by Rahul et al. (2019), Kang et al. (2019), and Mani et al. (2020), has focused on the complete digitization of P&ID diagrams, with a strong emphasis on the detection and recognition of symbols, text, and connections, utilizing a combination of image processing techniques, heuristics, and deep learning methods. Additionally, in the field of architectural engineering drawings, Das et al. (2018) implemented OCR for both hand and typewritten text.
Comprehensive reviews, such as those byMoreno-García et al. (2018) and Scheibel et al. (2021), provide further insight into the historical and comprehensive contributions to the field.
2.3.1 OCR in mechanical engineering
Table 1 provides a summary of the literature review on detection and recognition in mechanical EDs. The table is organized into three categories to allow the reader to quickly position each publication: text detection (TD), text recognition (TR), and graphical elements (GE). An overview of the requirements stated in Section 2.1 is provided to analyze the publication contributions and strengths when applied to quality control automation.
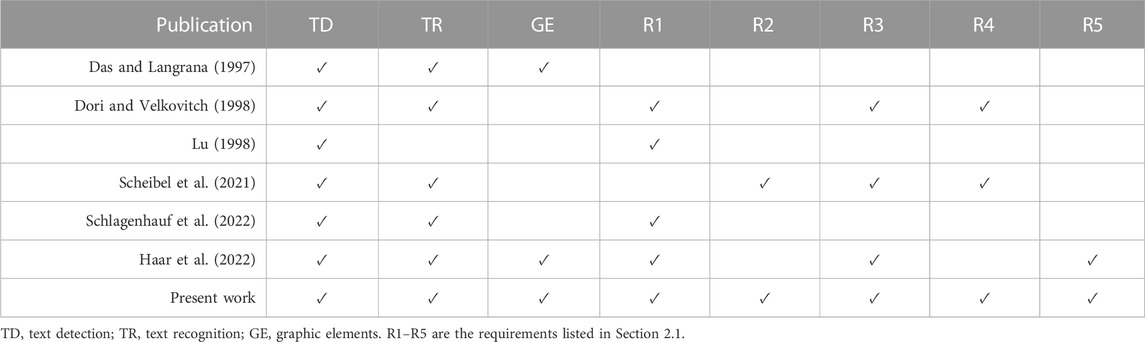
TABLE 1. Summary of contributions to detection and recognition elements on mechanical EDs.
Early work on digitizing mechanical EDs was carried out by Das and Langrana (1997), who used vectorized images to locate text by identifying arrowheads and perform recognition. Using other image processing techniques, Lu (1998) cleaned noise and graphical elements to isolate text in EDs, while Dori and Velkovitch (1998) used text detection, clustering, and recognition on raster images using neural networks (NNs). Their algorithm was able to handle tolerances but the recognition system was not able to handle enough characters for GD&T. The complexity and low computational power drastically decrease the research intent until Scheibel et al. (2021) came with an innovative approach for working with “.pdf” documents. They converted “.pdf” EDs to “html” and used scraping to extract the text, that combined with a clustering algorithm, returned good results efficiently shown in a user interface.
Recently, the methodology applied to raster drawings has primarily been pure OCR, utilizing the latest technology available. This approach involves a detector that identifies features or text, and a recognizer that reads text wherever it is present. Examples of this approach can be found in the publications of Schlagenhauf et al. (2022) and Haar et al. (2022), which use Keras-OCR and the popular algorithm YOLOv5, respectively. While these latest publications demonstrate promising results, they still lack sufficient refinement to be used in an industrial setting for quality control. R2 and R4 are not investigated further in these approaches.
To improve computer vision performance, Zhang et al. (2022) developed a data augmentation method in which they use labeled examples and component segmentation to generate a relatively large dataset of labeled samples.
Slightly different work in mechanical EDs has been published recently. Kasimov et al. (2015) use a graph matching system on vectorized EDs to identify previous designs or features in a database given a query, Villena Toro and Tarkian (2022) describe an experimental dual neural network algorithm for automatically completing EDs of similar workparts. Their algorithm is embedded in the CAD system, and Xie et al. (2022) utilizes graph neural networks to classify engineering drawings into their most suitable manufacturing method.
In addition to the scientific literature, there are also commercial products for feature extraction from EDs, such as the one offered by Werk24 (2020). However, the API for these products is closed and there is no access to the data or information about the methodology used, which limits the ability for the scientific community to improve upon the technology.
2.3.2 Research gap
When it comes to digitization of EDs, OCR technology provides a comprehensive solution for scanned documents and raster images. However, due to the complexity of engineering drawings, modifications to the OCR pipeline and image pre-processing are necessary to aid in the identification of relevant text. Additionally, post-processing is required to ensure accurate predictions and extraction of relevant information.
To automate the quality control process, it is essential that the information extracted from the GD&T boxes and tolerances is accurate and easily accessible through CAM software. Currently, there is no widely available open-source end-to-end algorithm that can achieve this. The pipeline presented in this research constitutes a significant advancement towards closing this automation gap.
3 eDOCr workflow
The eDOCr tool, presented in this paper, is a state-of-the-art OCR system designed to digitize assembly and production drawings with precision and efficiency. It is able to recognize and differentiate between different types of information in the drawings, and has a high level of tolerance recognition capability. Additionally, eDOCr can detect and recognize additional GD&T symbols and textual information, making it a comprehensive solution for digitizing EDs.
A detailed flowchart of the methodology is presented in Figure 2. The developed tool is divided into five distinct stages. Image processing forms the core of the tool, while the subsequent pipelines are modular and can be utilized independently, allowing the user to easily select the desired information to be extracted from the drawing.
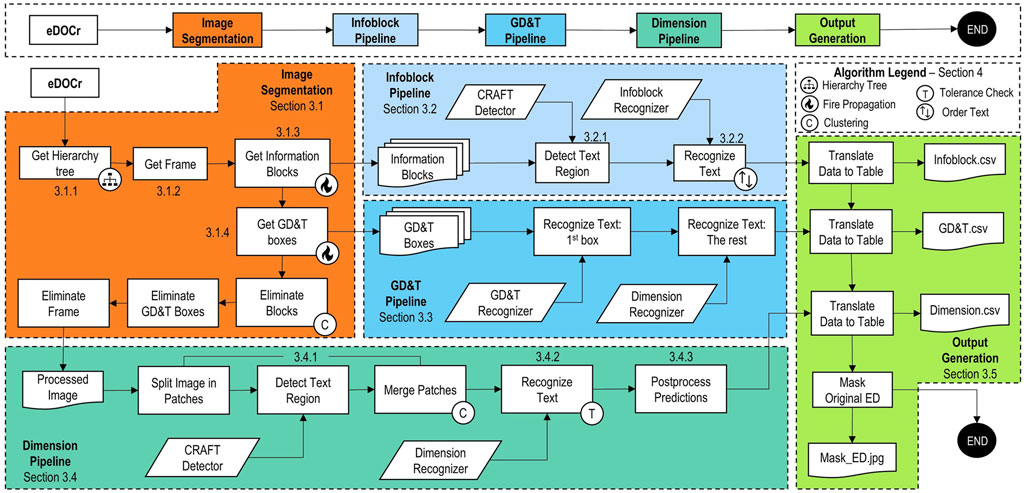
FIGURE 2. eDOCr detailed Flowchart. On top, the summarized workflow followed in Section 3. Below, a more complete representation of the whole system. The number next to the boxes refer to the subsection where they are explained in detail. The algorithms used are explained in Section 4.
The Image Segmentation stage utilizes element suppression techniques to clean the image as much as possible and maximize the effectiveness of the Dimension Pipeline. Three consecutive steps are employed to eliminate the frame, any information blocks in contact with the outer frame, and any potential GD&T information, which is assumed to be contained within its FCF in accordance with standards. This stage not only returns the processed image, but also stores the FCF and information blocks. Supporting both “pdf” and image formats meets Requirement R1. Refer to Section 3.1 for more details.
Each box of the Information Block or attached table may contain multiple lines of text. Text detection is performed for each box, and each word is recognized independently. As the detection of these words does not have a pre-established order, a sorting algorithm is necessary. The algorithm organizes the words based on their position and relative size to differentiate rows and columns. This pipeline satisfies requirement R2 and a portion of requirement R3. Refer to Section 3.2 for additional information.
The process of analyzing Feature Control Frames (FCF) with GD&T data does not require text detection, as the information is contained in separate boxes with a single line of text. The recognizer can be utilized to extract the textual elements. A specialized recognizer is trained for GD&T symbols in the first box, while the Dimension Recognizer is used for the remaining boxes. This pipeline fulfills the requirement R5. Refer to Section 3.3 for further details.
The final pipeline is the Dimension Pipeline. To improve the recall of the detector, it is common practice to divide large images, such as EDs, into smaller patches, detect, and then merge the image with the predictions. The clustering algorithm helps to combine close predictions in space into a single box. The tolerance checker algorithm is then used to analyze the possibility of tolerance in the box. If the tolerance checker is positive, the text is split into three to record the tolerance as well. Finally, a basic post-processing tool classifies the dimensions based on textual information (e.g., if it contains “M” as the first character, it is a thread). This pipeline meets requirements R3 and R4. See also Section 3.4.
The output of the system includes one “.csv” file for each pipeline and a masked drawing with an ID description of every predicted and recognized text. Visual inspection is necessary when the color in the masked ID is red, indicating that the number of characters does not match the number of contours in the box (e.g., in the case of a dimension such as: ∅ 44.5 being identified as ∅ 4.5).
3.1 Image segmentation
In the field of computer vision, it is standard practice to pre-process images in order to improve the performance of algorithms. These pre-processing techniques typically include denoising, blurring, setting thresholds, and converting RGB channels to grayscale. In the case of mechanical EDs, additional techniques such as segmentation may simplify the algorithm labor and improve the final output.
In this paper, we propose an Image Segmentation stage specifically for general mechanical EDs. In this step, the image is divided into regions of interest for further processing. This stage involves the detection and controlled suppression of the frame, the FCF, and the information block, with the relevant information being recorded and removed from the image.
The Image Segmentation code supports image file extensions and “.pdf.” The implementation is centered around an object called rect, which represents any rectangular shape found in the ED. The attributes of rect include positional information relative to the image, a cropped image of the shape, and hierarchical information in a tree structure where child boxes are contained within parent boxes. For more information on the hierarchy tree algorithm, see Section 4.1.
When developing, it was assumed that the information blocks and relevant tables are in close proximity to the ED frame and that the boxes containing text do not contain any other boxes within it. The process is summarized in Figure 3, which outlines the four steps involved in the segmentation stage.
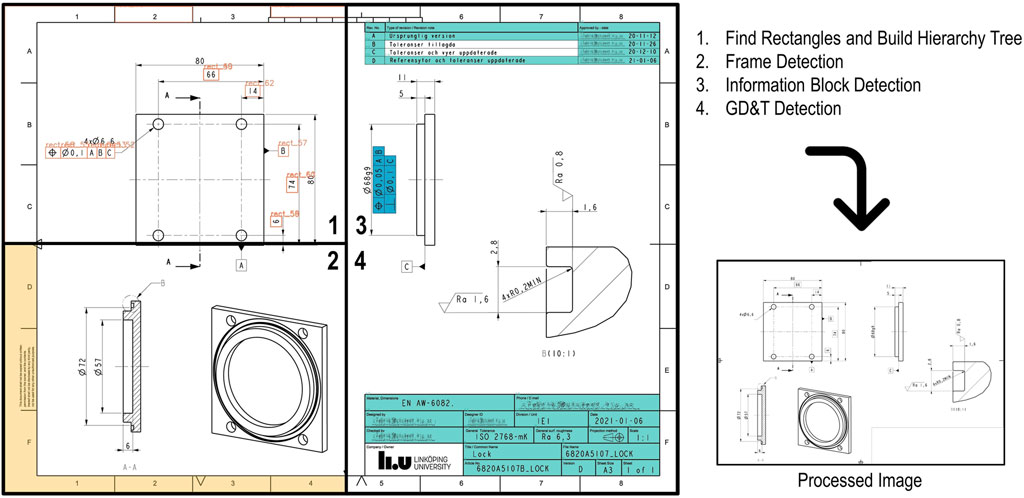
FIGURE 3. Image Processing Steps: 1) Top left corner, finding rectangles. 2) Bottom left corner, frame detection. 3) and 4) Right side, information block and FCF search.
3.1.1 Step I: Find rectangles and build hierarchy tree
The first step is the localization of rectangles as contours with four points and angles of 90°. The algorithm only considers perfect rectangles; any character or line intersecting the contour will not be considered. This can be observed in the top right table in Figure 3, where characters intersect the bottom line of the box. The Hierarchy tree generation (refer to Section 4.1) follows the detection of rectangles.
3.1.2 Step II: Frame detection
The second step is the detection of the frame. The frame is composed of two horizontal and two vertical lines that converge at four vertexes. The smallest combination that meets this requirement and exceeds a threshold set to 70% of the image size is considered the inner frame. This threshold can be adjusted by the user as an advanced setting.
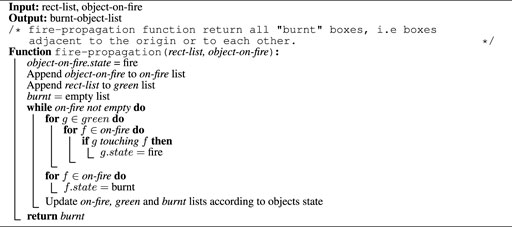
3.1.3 Step III: Information block detection
The third step is the identification of information tables. As a general rule, these boxes are always positioned close to the ED frame to conserve space for figures and annotations. The “fire propagation” algorithm is used to find every rectangle that can “propagate the fire.” This algorithm is explained in more detail in Section 4.2. Additionally, information boxes cannot have any other boxes within them in the hierarchy tree. In Figure 3, the logo from Linköping University contains two rectangles in the letters “l” and “i.”
3.1.4 Step IV: GD&T boxes detection
Lastly, the FCF boxes are identified using the “fire propagation” algorithm once more. If after the propagation, two or more boxes are in close proximity, these boxes are likely to contain GD&T information. However, if no text is found within the boxes, they will be eliminated from the GD&T pipeline.
The ED shown in Figure 3 has been selected to demonstrate the methodology and limitations of the image segmentation stage. Upon deletion of the frame, information block, and FCF, the image is prepared for the subsequent stage, the dimension pipeline.
3.2 Infoblock pipeline
The initial output generated during the image segmentation stage is a collection of boxes from the information block and any attached tables. These outputs are presented as cropped images of the original ED. For each box, a standard OCR pipeline extracts the textual information, and the text ordering algorithm organizes the predictions in a left-to-right, top-to-bottom fashion.
The information block pipeline is composed of the pre-trained text detector CRAFT (Baek et al., 2019), a custom CRNN (Shi et al., 2017) model trained on an extended alphabet, and the ordering text algorithm (see Section 4.4).
3.2.1 Text region detection
No fine-tuning is necessary for the CRAFT model, as the results are already satisfactory. The CRAFT model has been pre-trained on the ICDAR 15 dataset (Karatzas et al., 2015), which includes real images with text in various orientations and camera angles. Text in black horizontal text on a white background is relatively easy for the model to detect. Figure 4 illustrates the text detection in a real ED from the Linköping University workshop.
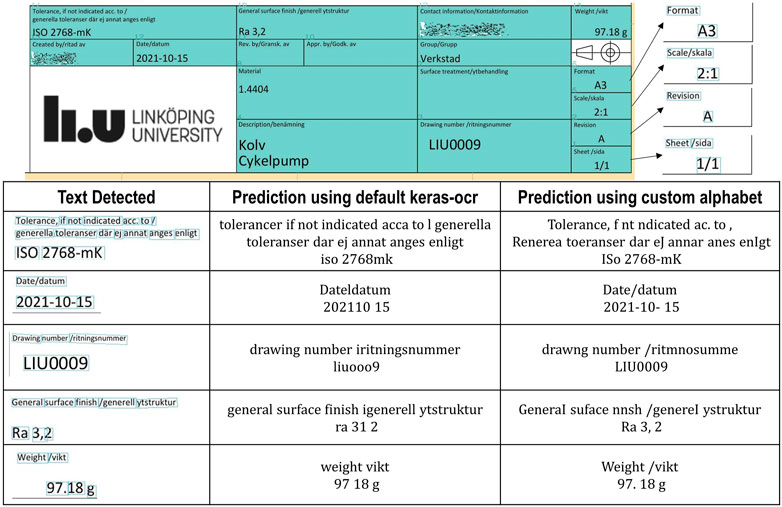
FIGURE 4. Information block pipeline. In the table: boxes extracted from image processing, prediction of the keras-ocr default recognizer and prediction of custom recognizer.
3.2.2 Text recognition and organization
The next step in the pipeline is recognition. The keras-ocr CRNN pre-trained model only supports digits, upper and lowercase letters, and does not include any punctuation or mathematical symbols. Empty character predictions or mismatches are two main concerns when using this model.
The main advantage of using keras-ocr over other OCR approaches is its flexibility in modifying the alphabet, i.e., the number of classes in the output layer of the CRNN. The neural network topology is automatically modified for training. The alphabet used for the Information Block pipeline includes digits, upper and lowercase letters, and the following symbols: , . : −/.
The recognizer with a custom alphabet - and this applies to all three recognizer models - has been trained on auto-generated data. A training script is provided for custom alphabet training based on the keras-ocr documentation. The auto-generated samples consist of pictures with white background and 5–10 characters of various sizes and fonts. Free-source fonts that include enough symbols for GD&T are not very common and only a few have been included in the training: “osifont,” “SEGUISYM,” “Symbola,” and “unifont” are the available fonts.
The custom recognizer performs poorly on small text because the generated samples were relatively larger. This is a clear indication of overfitting, which can be addressed by increasing the number of fonts, training on real samples, and optimizing the model’s hyperparameters.
Once the text inside the boxes has been predicted, the ordering text algorithm organizes the text so that the text boxes in the same row are separated by a space, and rows are separated by a “;.” For demonstration purposes, the “;” has been removed in Figure 4.
3.3 GD&T pipeline
The GD&T Pipeline is simpler than the Information Block pipeline as it does not require text detection. Every box in the FCF contains one or more symbols in a single row, so the only heuristic necessary is to ensure that the special symbol recognizer predicts on the first box of the FCF. If the FCF is horizontal, the first box is always placed at the lowest x-coordinate, and they are ordered left-to-right, while if the FCF is vertical, this box has the highest y-coordinate, and they are ordered bottom-to-top.
A dual recognizer has been found to be more effective than a single recognizer after several trials, but further training with more fonts and real samples could challenge this conclusion and make the pipeline slightly less complex and more time-efficient.
Examples of predictions in FCF are shown in Figure 5. However, it is not relevant to compare it against general OCR systems such as keras-ocr or Google Vision API, as they are not trained for the majority of the symbols present in the GD&T.
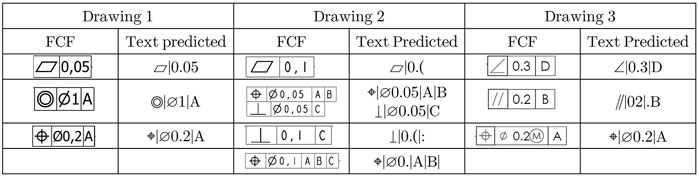
FIGURE 5. Results from the GD&T pipeline for three different mechanical ED.
The limitations present in the Information Block Pipeline also apply to this pipeline. The font in Drawing 1 is more favorable to the algorithm, while in Drawing 2, the number “1” poses a challenge as it is a vertical line. In Drawing 3, the points can be overlooked or inserted. In the third sample in Drawing 3, the pipeline is not trained to detect the Maximum Material Condition, and the symbol is not recognized.
3.4 Dimension pipeline
If the threshold values have been properly set and the image segmentation has been effective, the resulting image should be an ED without the frame, FCFs or information block and tables. Only geometrical views, annotations and dimension sets should be present in the new image.
3.4.1 Text detection
Even without the frame, EDs are relatively large documents. To extract the most information from these large images, some computer vision algorithms in oriented object detection, such as those trained on the DOTA dataset (Xia et al., 2017), opt for a different approach. Split the original image into smaller patches, perform predictions on each patch, and merge the results later. This way, the algorithm can handle the large size EDs and extract information effectively.
This procedure has also been implemented in this pipeline, but with the additional step of using the clustering algorithm to merge text predictions and group relatively close predictions to acquire surrounding information of a nominal measurement, such as tolerances.
3.4.2 Text recognition
Once the textual information has been detected, the tolerance check algorithm searches for any available tolerance information. If the algorithm is successful, the box is divided into three boxes, as presented in Section 4.5. In any case, the text recognition process runs through all the predicted boxes to retrieve the text. The recognizer model is trained on the most common characters present in this type of textual elements, this is: digits, letters “AaBCDGHhMmnR” and symbols “(), + − ± : /°“∅.”
3.4.3 Text post-processing
To cleanse the geometrical information and isolating dimension information as much as possible, a basic post-processing system based on heuristics is used. Most of the rules are directed towards eliminating undesired predictions, such as supplementary textual information and detection mismatches. Analysis of the number of characters (n > 15) and digits search help to rule out these predictions.
The second part of the post-processing is a dimension type classifier, where depending on the recognized characters, they are classified as angle (contains the symbol “°” and numbers), thread (contain “M” for bolts or “G” for pipes as first character), roughness (contains “Ra,” which is the most common, but more roughness types exist), or length (the rest). If the prediction is a length dimension, tolerance information is studied and separated from the nominal value. However, all these rules are far from being complete, and much more rule definitions, or alternatively and more appropriate, text processing algorithms, are required.
3.4.4 Dimension pipeline Paradigm
The figure Figure 6, complemented with Table 2, illustrates a representative example of the inner workings and limitations of the pipeline, from clustering to post-processing. The algorithm flagged five measurements as the number of contours and characters did not match. Of these, measurement 14 and 20 were recognized correctly. Measurements 9 and 18 were missing one character, while measurement 12 was incorrect, likely due to the horizontal support line confusing the algorithm.
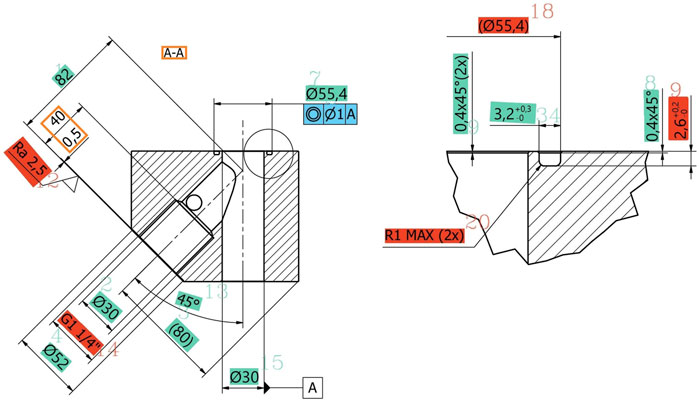
FIGURE 6. Results from the dimension pipeline. Masked image. Blue predictions are potentially correct predictions, red predictions are potentially missing one or more characters, orange outlines are predictions discarded.
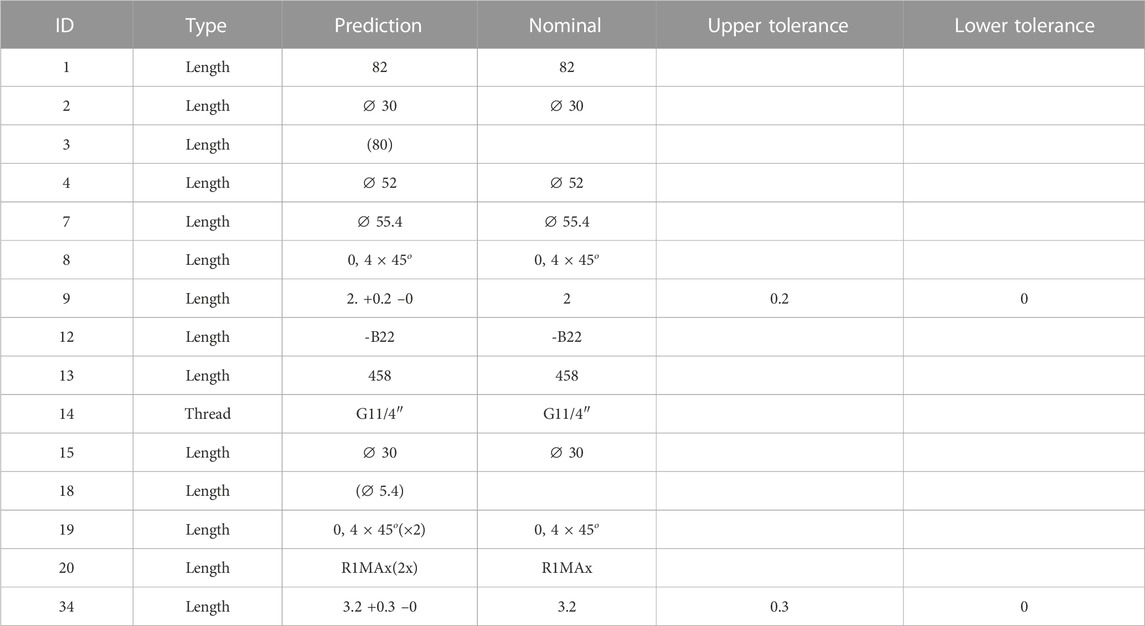
TABLE 2. Results from the dimension pipeline. Table with results after postprocessing. Red rows are flagged dimensions with potential missing characters. The table expresses the ID of the prediction, type of measurement, predicted text, nominal value, and lower and upper tolerances.
On the other hand, the tolerance check functioned as intended, correctly identifying the tolerances in measurements 9 and 34 and displaying them in the table. Information in brackets is not considered as it refers to annotations. Measurements 3 and 18 are for reference only.
Two measurements, placed on the left of the ED, were not included on the table, as they were clustered together, recognized incorrectly, and removed for not containing any digits.
All measurements except measurement 14 were recognized as length measurements. However, measurement 13 is an angle that had a recognition error, with the symbol “°” being recognized as “8” instead.
For this particular sample, a summary of the detection and recognition could be:
• 17/17 measurements detected, 15/17 measurements recognized.
• 5/15 measurements flagged, 2/5 flagged measurements are correct, 2/5 missing one character.
• 11/15 measurements recognized correctly, 2/15 missing one character, 2/15 wrong, 1/15 wrong and not flagged.
3.5 Output generation
The output generation includes three “.csv” files for the information block, GD&T, and measurements, as well as a masked image. The masked image is crucial for the end-user as it allows them to match every prediction with the ID provided in the “.csv” files.
The masked images use colors for different objects in the drawing. The red color on measurements can be particularly useful. If this color is shown, it indicates that the number of contours and the number of characters predicted do not match. It helps the user to identify where a possible character may have been overlooked. However, it is important to note that this rule does not mean that the prediction is incorrect, for instance, the character “i” is composed of two contours.
4 eDOCr algorithms
4.1 Boxes hierarchy tree algorithm
The use of a hierarchical tree of rectangles is important for understanding the containment or coverage relationships between different rectangles. In order to maintain an organized structure for the prediction of text, it is essential to ensure that each box is the ultimate child in the tree. By only detecting text on boxes that do not have any children, it is possible to guarantee that there will not be any duplication of text.
Algorithm 1:. Hierarchy Tree Algorithm
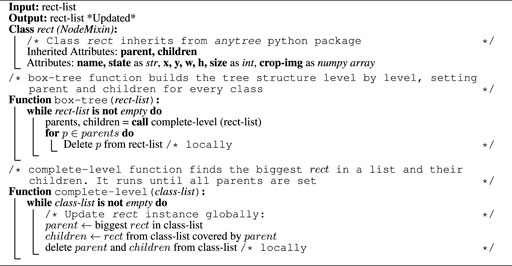
With this goal in mind, a hierarchical tree algorithm was developed. The algorithm works by selecting the largest rectangle as the parent on every iteration. Then, the children rectangles are determined by identifying those that are fully covered by the parent rectangle. This process is repeated, selecting a new parent rectangle until there are no more rectangles in the list. Once a level is completed, the parent rectangles are removed from the list and the process starts again at the next level, choosing the largest rectangles as new parents. The parent-child relationships for each rectangle are updated as the algorithm progresses. The pseudo-code for this algorithm is shown in Algorithm 1.As shown in Figure 7, the use of a hierarchical tree structure allows for the identification of specific rectangles (children 4, 6, and 8 in this example) that are likely to contain text. Without this hierarchical structure, all rectangles would be considered potential text locations and this would result in repeated predictions and inefficiencies.
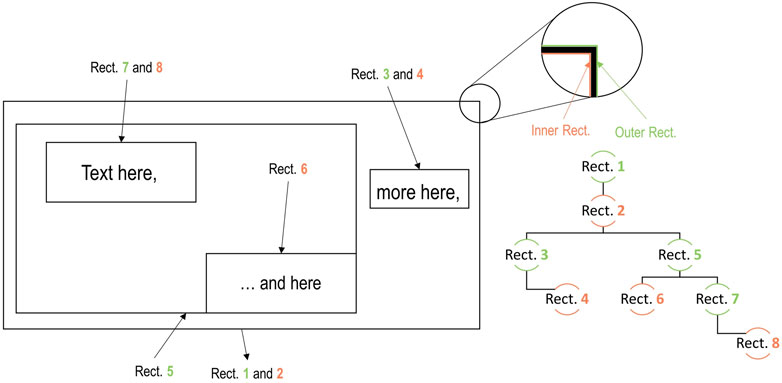
FIGURE 7. Tree Hierarchy for a general image. Inner rectangles are highlighted in orange and outer rectangles in green.
4.2 “Fire propagation” algorithm
The “Fire Propagation” Algorithm is a propagation algorithm. Given an array of classes with certain state (green), and a trigger (on fire), the function will run episodes until the array of classes “on fire” is empty. After every episode, all “green classes” adjacent to a class “on fire” acquires the status “on fire,” while every class “on fire” evolves to the final “burnt” state, that cannot no longer propagate the fire. This algorithm is depicted in Algorithm 2 and illustrated in Figure 8.
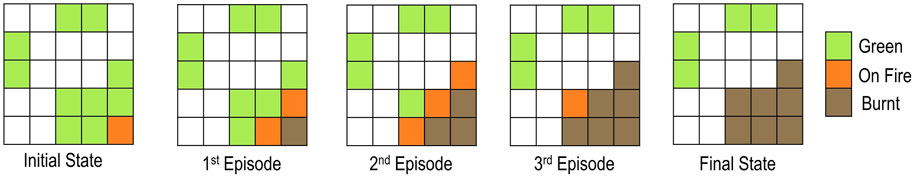
FIGURE 8. “Fire propagation” algorithm illustration per episode. The function’s output is the burnt cells.
Algorithm 2:. “Fire Propagation” Algorithm
The concept of “boxes touching each other” is implemented in the code using a threshold. Two boxes that are next to each other are separated by a black line (see Figure 7). They meet the requirement if, when the first box is scaled to 110% of its size, it intersects the second box.
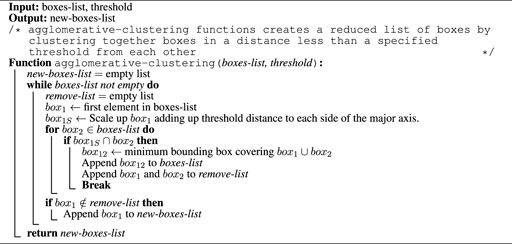
4.3 Clustering algorithm
The Clustering Algorithm (see Algorithm 3) groups together words or any type of character expressions that are in proximity to each other. It takes as input the boxes predicted by the text detector (CRAFT) and returns a reduced list of boxes. One of the most significant contributions of this algorithm to the system is the ability to gather tolerance information related to the nominal measurement, as shown in Figure 9. The concept of proximity is introduced in the algorithm as a threshold value. The algorithm scales up the box under analysis so that its size includes a space in the major axis equal to the threshold, as depicted in Figure 9.
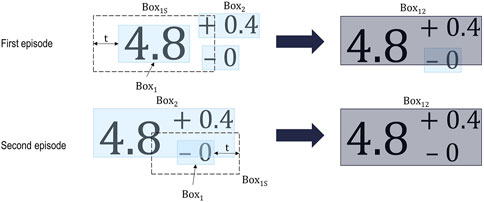
FIGURE 9. Consecutive episodes of the clustering algorithm to group three boxes of text that belong together. t is the threshold.
Algorithm 3:. Clustering Algorithm
The effectiveness of the algorithm in clustering the objects of interest accurately is highly dependent on the layout and font of the text. Thresholds that are suitable for one ED may not group all the information in others. However, it is important to note that clustering independent text because they are in close proximity to each other is worse than leaving some text ungrouped. Therefore, the threshold value is presented as an advanced setting that the user can modify to suit the specific ED they are working with.
4.4 Text ordering algorithm
The CRAFT detector by itself does not arrange the words it detects, which would defeat the purpose of the system as the text would lose all meaning when separated. To address this issue, the Text Ordering Algorithm takes all detected words and sorts them into rows based on their vertical coordinate and size. The algorithm then arranges the words from left to right within each row. A row is defined as a consecutive group of words with the same size, meaning words at the same level with different size are stored in different rows. The algorithm presented in Algorithm 4 makes it possible to order the text in a meaningful manner.
Algorithm 4:. Text Ordering Algorithm
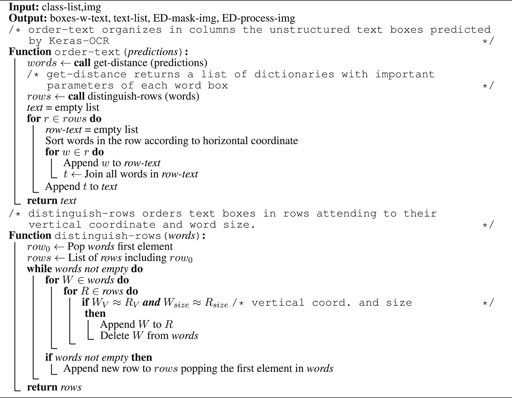
The text ordering algorithm is specifically used in the Information Block pipeline, as it is the only pipeline that can contain multiple rows of text within each box. In contrast, the other two pipelines - Dimension Pipeline, GD&T pipeline - typically only contain single line text and thus the text ordering algorithm is not necessary.
4.5 Tolerance check algorithm
The tolerance check algorithm is built using image processing rules to identify whether the dimensions boxes have or not tolerances attached. The steps to make the algorithm given a detected box are:
1. Find maximum and minimum y coordinate with black pixels.
2. Search from right to left the closest black pixel and record the distance until encounter. The search interval will be from 30% to 70% of image width, to avoid lower or higher characters, as seen in the third example of Figure 10.
3. If a recorded distance Δx is bigger than 80% of the distance between ymax and ymin, the box is considered as having tolerance boxes in it.
4. From the biggest Δx found, the algorithm looks for the first horizontal coordinate with no black pixels. The encapsulation of the nominal value of the measurement is now finished.
5. From the y-coordinate of the biggest Δx found, and increasing the y-coordinate, the algorithm stops at the first black pixel to divide the tolerance boxes.
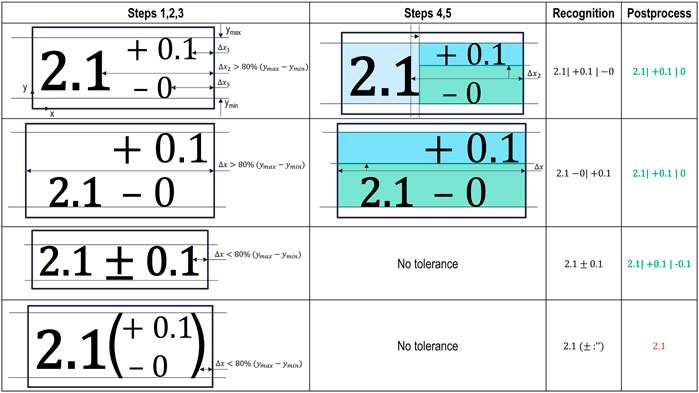
FIGURE 10. Tolerance check algorithm table for different tolerance layout. The top most example details the process in higher detail. The algorithm in combination with recognition and post-processing return positive results for three out of the four examples presented, while the forth example is an “algorithm killer.”
In the second example in Figure 10, the algorithm will find in Step 3 that the first column without a black pixel is the first pixel column of the box. As a result, the nominal box is empty and only the two tolerance boxes are sent to the recognizer. In post-processing, the minus or plus sign will alert the system, allowing it to split the information correctly. This is also the case in the third example, where the symbol ± triggers a rule to identify the tolerance.
This algorithm is not flawless and may produce incorrect results in certain situations. For example, tolerances expressed as shown in the fourth example of Figure 10 will result in a wrong prediction. Additionally, if the orientation of the detection is highly deviated from the text baseline, the algorithm may also produce faulty results.
5 Evaluation
The Evaluation section is composed of three subsections. The first subsection provides a training summary for the three recognizers included in eDOCr, which were trained on randomly generated data samples. The second subsection studies the metrics chosen to measure eDOCr’s overall key performance. The last subsection applies these metrics to five different EDs obtained from various sources.
5.1 Recognizer training
The number of characters present in an ED can be quite extensive. Ideally, a single recognizer for all characters would suffice. However, after several training trials, it became clear that the accuracy of the algorithm did not meet the requirements for information extraction. As a result, an alternative approach was adopted, and three different recognizers were trained.
1. Dimension Recognizer: Digits, Letters AaBCDRGHhMmnx and the symbols (), + − ± :° /”; ∅. Trained on 5,000 auto-generated samples for 6 epochs
2. Information Block recognizer: Digits, ASCII letters and the symbols , . : . − /. Trained on 50,000 auto-generated samples for 2 epochs ∼1 h 40 min h training
3. GD&T Recognizer: GD&T symbols. Trained on 50,000 auto-generated samples for 2 epochs ∼1 h 50 min training.
All models were trained locally on a NVIDIA Geforce RTX 2060 GPU with 2 GB of memory. The results of the loss and validation loss for each epoch of training are shown in Figure 11. The models were trained using the pre-trained keras-ocr model with the top of the network removed. The Dimension Recognizer was trained first, using 5,000 samples. However, it quickly overfitted after the second epoch. The training was stopped, increased the number of samples to 10,000 and re-trained for 3 more epochs. The loss and validation loss are improving after re-training. For the next two trainings, 50,000 samples were generated. The GD&T Recognizer also showed overfitting in the second epoch, while the information block model could have been run for one more epoch. The selected model is the one obtained from the epoch with the lowest validation loss.
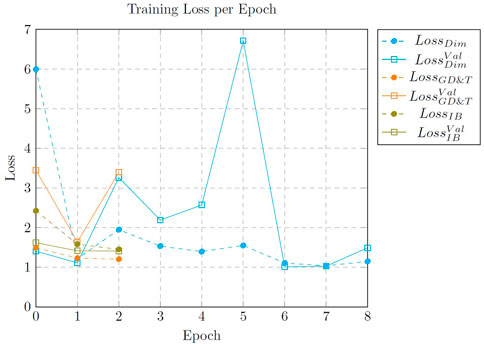
FIGURE 11. Loss per epoch when training the different recognizer. Loss and validation loss are displayed with dashed lines and solid lines, respectively.
The training performance for the three algorithms is poor as convergence is not reached. However, the three models perform relatively well in testing on real EDs. Increasing the number of fonts, fine-tuning and optimization of hyperparameters can improve the recognizer’s performance. Additionally, fine-tuning by training on real data will be more beneficial than using automatically generated samples. The overall performance when testing on real drawings is analyzed in Subsection 5.3.
5.2 Validation metrics
There are several metrics that are widely accepted for evaluating the performance of OCR systems. The complexity of eDOCr, which is composed of three pipelines and at least three supporting algorithms (clustering, tolerance check, and ordering text), increases the number of metrics that can be used. Common metrics used for text detection and recognition include recall, precision, and F1-score. Additionally, character error rate and word error rate can also be used to evaluate the performance of the recognizer. While all of these metrics can provide useful information, using all of them can be impractical and overwhelming.
The performance of eDOCr is evaluated using a combination of metrics, including recall and precision for the combination of GD&T and dimension text detection, as well as F1-score and character error rate for the dimension and GD&T recognizers. These metrics have been selected as they are considered the most important for quality control automation and are easier to retrieve due to the large number of characters involved in the information block. Additionally, word error rate has been discarded as it is implicit in the character error rate. In total, four metrics are used to evaluate the performance of eDOCr. The ED shown in Figure 6 will be utilized to better explain and exemplify the metrics presented in the following sections. In Subsection 5.3, these metrics are applied when evaluating eDOCr on seven relevant EDs.
5.2.1 Text detection recall
In the context of set of dimensions retrieved, Scheibel et al. (2021) defines the recall as the ratio of extracted relevant dimension sets over all relevant dimension sets:
This recall definition needs to be adapted and generalized for the two pipelines (GD&T and dimensions) in eDOCr, therefore, the Text Detection Recall (RTD) is the ratio of the sum of true GD&T and dimension sets over all relevant elements:
In Figure 6, the RTD = (1 + 15)/(1 + 17) = 88.9% since 15 out of 17 dimensions and 1 out of 1 GD&T boxes are detected. It is important to note that recall does not take into account mismatches, i.e., even if one extra dimension that does not exist were to be predicted, the recall would not be affected.
5.2.2 Text detection precision
Similarly to the detection recall, Scheibel et al. (2021) also use the precision as a metric, defined as the ratio of extracted relevant dimension sets over all extracted elements:
This formula, that adapted to eDOCr needs translates to the precision PTD, which is the ratio of true detections to all detections:
Using the example in Figure 6, the PTD = (1 + 15)/(1 + 15) = 100%. It is important to note that in this case, if an extra dimension that does not exist were to be predicted, the precision would be negatively affected.
5.2.3 Text recognition micro-average F1-score
The F1-score is a measure of a test’s accuracy that balances precision and recall. It is the harmonic mean of precision and recall, where the best value is 1.0 and the worst value is 0.0. As mentioned in the previous metrics, precision is a measure of how many of the OCR predicted elements are actually correct, while recall is a measure of how many of the ground truth elements were predicted correctly. If we consider every character as a single element, the formula for the F1-score F1 is:
This metric is particularly useful when the data set is imbalanced and there are many more false positives than true positives or vice versa. Given two equal dimension samples of the form ∅ 34.5 and two predictions: ∅ 84.5 and 34.S. In the first case, precision is P = 4/5 and recall is R = 4/5, so the F1-score
5.2.4 Micro-average character error rate
The Character Error Rate (CER) calculates the number of character-level errors divided by the total number of characters in the ground truth. Therefore, CER always falls in the interval 0 to 1, and the closer to 0, the better the model is. In a multi-class recognition problem such as OCR, the CER is more representative than the general accuracy or micro-average accuracy. The CER is calculated as:
where S, I, D and TC are Substitutions, Insertions, Deletions and ground True Characters, respectively. Applied to eDOCr:
Given two equal dimension samples of the form ∅ 34.5 and two predictions: ∅ 84.5 and 34.S, in the first case, the CER = (1 + 0 + 0)/5 = 20% while in the second case CER = (1 + 0 + 1)/5 = 40%. The micro-average CER is
5.3 Analysis of results
The four metrics presented in the previous subsection measure the performance of eDOCr. The detection algorithm is analyzed on dimension sets and FCFs by studying the recall RTD and precision RTD. The performance of eDOCr in character recognition for dimension sets and FCFs is studied with the macro-average character error rate

TABLE 3. Validation results based on the seven examples EDs in terms of the metrics presented, with default settings and tuned settings.
All EDs have been tested using default eDOCr parameters. The metrics for the seven EDs analyzed indicate high performance in text detection and recognition, with an average recall and precision in detection of around 90%. However, additional analysis is needed to fully understand the results on a per-drawing basis.
• Partner ED is the most complex of those analyzed, featuring 38 dimension sets and four FCFs. Interestingly, the majority of recognition errors are deletions, which occur when the same character appears consecutively, such as when a dimension of the type 100 is recognized as 10.
• Halter, Gripper, and Adapterplatte are EDs uploaded by Scheibel et al. (2021). These EDs have been particularly challenging for the OCR system. Despite image pre-processing being performed to convert gray to black, the frame was not detected, resulting in only partial consideration of the information block. For a fair comparison, dimension sets and GD&T detections on the information block and frame were not included in the metrics shown in Tables 3, 4. Even with this assumption, these three EDs still have the lowest recall and precision in detection and the highest Character Error Rate (CER). Halter has higher detection metrics due to the high ratio of FCF over dimension sets.
• In the ED BM plate, 3 out of 18 dimension sets were not considered. The main concern in this ED is the substitution of all “1” characters with a “(.” In this ED, the character “1” is presented as a vertical bar, which is not a representation that the OCR system’s recognizer has been trained on.
• Finally, LIU0010 and Candle Holder are EDs generated for a university workshop, and their detection metrics are the best among all the samples.
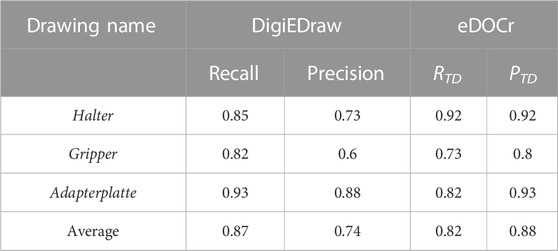
TABLE 4. Comparison between the DigiEDraw and eDOCr tools. A comparison between html scrapping and clustering technique against production drawings supported OCR system.
Table 4 compares DigiEDraw Scheibel et al. (2021) results against eDOCr. This comparison is only possible when comparing dimension sets detection, since they do not use a recognizer.
In addition to the recall and precision, a general comparison between the two software can help the reader understand their strengths and potential against each other. The two algorithms, DigiEDraw and eDOCr, have different strengths and weaknesses when it comes to digitizing EDs.
DigiEDraw has a good recall and precision when retrieving measurements, which makes it a useful tool for analyzing and extracting information from vectorized PDF drawings. It does not require a recognizer, which can simplify the process of digitization. Additionally, it has the potential to incorporate information blocks analysis with minimal effort. However, it is limited to only support vectorized PDFs, which can make it difficult to use with other types of drawings. It also has problems with dimensions at angles and can be susceptible to content loss during the conversion from PDF to HTML. It is also font-sensitive and does not have the capability to detect GD&T symbols.
On the other hand, eDOCr is a versatile OCR system that supports both PDF and raster image formats, making it more adaptable than DigiEDraw. One of its key features is the ability to detect GD&T symbols, which is essential for quality control in EDs. Additionally, eDOCr is able to accurately retrieve dimension sets regardless of their orientation within the drawing. However, it should be noted that the algorithm’s performance is based on auto-generated samples, which can result in inaccuracies in recognition. The algorithm’s performance can be significantly improved with a labeled training dataset of EDs. While eDOCr can acquire general information through its Information Block pipeline, it is important to note that relevant material may be missed if not included in the information block. As DigiEDraw, the algorithm is also threshold-sensitive, while character recognition is limited to the alphabet used in the training process, which means that it is language-sensitive.
6 Discussion: Application in quality control and technical limitations
This section gives an overview of the applicability of the developed tool in the industry as it is. To do that, the utility scope is introduced, and the requirements expressed in Section 2.1 are discussed and accompanied of current limitations and potential solutions to these limitations.
The research presented in this paper aims to develop a reliable tool for the first step towards automating the quality control process for manufactured parts. The tool, eDOCr, is intended for small to medium-sized manufacturers who rely on production drawings and manual work for quality control. The goal is to alleviate the manual and intensive labor of extracting part requirements from EDs, and to move towards the next step in automation: understanding how to check specific requirements on a part. The future research question is whether an algorithm can understand which device to use, where on the part to use it, and how to check a specific requirement, given a command from the quality engineer.
The requirements are discussed following a requirement R*, limitation L* and potential solution structure.
R1 Support raster images and “.pdf” files as input formats. These are the two most common formats for finding EDs.
The first requirement for the tool is the ability to support a wide range of input formats, specifically raster images and PDF files, as these are the two most common formats for EDs. The tool eDOCr addresses this requirement by being able to accept both image and PDF formats as input.
L1 However, there is a limitation with this implementation, as eDOCr is not currently able to support vectorized EDs. While it is possible to update eDOCr to also support vectorized images, the process of converting these documents to raster image format can result in loss of valuable information such as metadata and exact size and position of geometrical elements. To address this limitation, a potential solution could be to incorporate an opposing algorithm that is able to retrieve this lost information and validate the textual information extracted by eDOCr. Geometrical verification has been implemented by Das and Langrana (1997) and the commercial software Werk24 (2020) according to some of their documentation.
R2 Support the recognition of both assembly and production drawings. This includes the ability of the algorithm to differentiate tables and information blocks from geometrical information such as dimensions and other production drawing-related information.
The developed information block pipeline is responsible for retrieving and isolating this information from the rest of the dimension sets. With minimal effort, it can also separate tables from the information block, as they have been clustered separately and merge them together in the output file. eDOCr filters the words into rows and orders the text. Most publications in the field disregard this information, however, it specifies general tolerances and surface roughness requirements.
L2 Despite these capabilities, the pipeline is limited to content inside boxes that are in contact with the outer frame. Even though the standard dictates that the information block should follow this layout, general information can also be expressed outside the main information block. Furthermore, there are limitations in detection and recognition performance. As previously mentioned, higher quality data in training can potentially alleviate inaccuracies in the recognition phase.
R3 In line with R2., the algorithm should also be capable of sorting and grouping relevant information, and neglect information of reference.
The eDOCr tool includes a clustering algorithm that is able to group related information together, which contributes to its overall performance in the dimensions pipeline. This feature is shared with other publications such as (Dori and Velkovitch, 1998; Scheibel et al., 2021). The inclusion of this algorithm sets eDOCr apart from other publications, such as Schlagenhauf et al. (2022), which argue that keras-ocr is not suitable for EDs. eDOCr has proven that with adequate preprocessing and postprocessing, keras-ocr can be effectively utilized for ED information retrieval.
L3 The clustering algorithm in eDOCr plays a crucial role, however, it can also negatively impact detection recall by grouping independent measurements together or failing to group information that belongs together. The threshold for this algorithm should be set by the user, and properly optimizing it can be a complex task that varies depending on individual EDs.
R4 Tolerance recognition is a crucial requirement for the tool to be used in the quality control process. The tool must be able to accurately read and understand tolerance information.
The metrics presented in Section 5.3 provide insight into the overall performance of eDOCr. Although eDOCr has achieved low values of
L4 This limitation is primarily due to the poor quality of the auto-generated measurements used to train the recognizers. Possible solutions include improving the data generation process, increasing the number of fonts used, fine-tuning and optimizing the RCNN model. Using intelligent data augmentation techniques proposed by Zhang et al. (2022) can also help address this issue. However, the most effective solution would be to manually label a high-quality training dataset, as this would enable eDOCr to achieve the same level of accuracy as other state-of-the-art OCR systems such as Google Vision API.
R5 The tool should also be able to detect and recognize additional GD&T symbols and textual information inside the FCF.
One of the most significant achievements of eDOCr is its ability to detect and recognize FCF boxes. The detection and recognition of GD&T symbols was an issue that had not been addressed in previous publications until Haar et al. (2022) used the popular CNN YOLOv5 to classify the symbols. However, their approach did not connect the symbols to the actual content of the FCF. The versatility of keras-ocr in training on any Unicode character has been impressive in this regard.
L5 As previously mentioned, the main limitation of eDOCr is the performance of the recognizer, particularly when it comes to recognizing symbols such as Maximum/Least Material Condition. Despite efforts to train the model to recognize these symbols, the performance was greatly impacted during testing. Potential solutions have been outlined above.
In summary, the eDOCr tool is presented as a state-of-the-art solution for information retrieval in mechanical EDs. Its key contributions include the ability to fully recognize FCFs, accurately segment information blocks, support for raster EDs, and good performance in detecting and recognizing dimension sets. In addition, it is shared publicly as a python package for experimentation and future community development.
In the future, research efforts will be directed towards improving eDOCr by supporting vectorized images and developing an opposing algorithm as discussed in L1. Additionally, efforts will also be focused on enhancing recognition performance. One effective approach could be the release of a dataset of complex and labeled EDs, similar to how the ICDAR 2015 (Karatzas et al., 2015) dataset was released for natural image processing.
In the long term, future work will center on addressing the main research question: Can an algorithm understand which measurement device to use, where on the part it should be used, and how to check for specific requirements? This will require further advancements in computer vision and machine learning techniques to enable the algorithm to understand the context and intent of the EDs.
7 Conclusion
This paper has presented eDOCr, a powerful and innovative optical character recognition system for mechanical engineering drawings. The system has been designed with the goal of automating the quality control process for mechanical products where engineering drawings constitute the main information channel.
eDOCr is composed of a segmentation stage that sends the information to three different pipelines: the Information block and tables pipeline, the feature control frame pipeline, and the dimension set pipeline. Each pipeline is supported by pre-processing and post-processing algorithms. The final output consists of three tables, one for each pipeline, as well as a colorful mask to aid the reader’s understanding. On average, the algorithm demonstrates a recall and precision of approximately 90% in detecting dimension sets and feature control frames, and an F1-Score of around 94% with a character error rate lower than 8% in recognition.
The key contributions of eDOCr are its ability to separate general requirements found in the information block, high performance in detection and recognition of Geometric dimensioning and tolerancing information, and its ability to process complex text structures such as tolerances. The eDOCr tool is shared with the research community through Github, and the authors hope it will make a significant contribution towards engineering drawing digitization, and the goal of achieving quality control automation in the production of mechanical products.
In the future, research will be directed towards further improving the eDOCr system, including supporting vectorized images, enhancing recognition performance, and creating a dataset of complex and labeled engineering drawings.
8 Algorithm syntax
8.1 Hierarchy tree algorithm
rect—An object representing a rectangular portion of the ED. Attributes of the class are reference name, position relative to the image, size, the portion of the image itself and state. The state attribute is used in the “Fire Propagation” algorithm. Inherited attributes are parent and children.
rect-list—A pythonic list of rect objects.
NodeMixin—A class built in anytree python package to enable hierarchies using objects.
parent—A rect object that have one or more children.
children—A rect object completely covered by another rect object.
8.2 “Fire propagation” algorithm
object-on-fire—A rect object with attribute state equal to fire
on-fire, green, burnt—A pythonic list of rect objects with different state attribute.
8.3 Clustering algorithm
box—A numpy array expressing position and size (x, y, w, h).
boxes-list, remove-list, new-boxes-list—Pythonic lists of box objects.
8.4 Text ordering algorithm
predictions—A numpy array expressing characters value, position and size of each predicted word.
words—Structured pythonic dictionary expressing word information.
rows—A numpy array formed by words.
text—A numpy array formed by rows.
Data availability statement
The original contributions presented in the study are included in the article/supplementary material, further inquiries can be directed to the corresponding author.
Author contributions
All authors contributed to the study conception and design. Material preparation, data collection and analysis were performed by JV as main contributor and AW as project leader. The first draft of the manuscript was written by JV and all authors commented on previous versions of the manuscript. All authors read and approved the final manuscript.
Funding
This work was supported by Vinnova under grant 2021-02481, iPROD project.
Acknowledgments
The authors would like to thank Vinnova for making this research project possible.
Conflict of interest
The authors declare that the research was conducted in the absence of any commercial or financial relationships that could be construed as a potential conflict of interest.
Publisher’s note
All claims expressed in this article are solely those of the authors and do not necessarily represent those of their affiliated organizations, or those of the publisher, the editors and the reviewers. Any product that may be evaluated in this article, or claim that may be made by its manufacturer, is not guaranteed or endorsed by the publisher.
References
Baek, Y., Lee, B., Han, D., Yun, S., and Lee, H. (2019). “Character region awareness for text detection,” in Proceedings of the IEEE/CVF conference on computer vision and pattern recognition (CVPR) (IEEE: Long Beach, CA, USA).
Das, A. K., and Langrana, N. A. (1997). Recognition and integration of dimension sets in vectorized engineering drawings. Comput. Vis. Image Underst. 68, 90–108. doi:10.1006/cviu.1997.0537
Das, S., Banerjee, P., Seraogi, B., Majumder, H., Mukkamala, S., Roy, R., et al. (2018). “Hand-written and machine-printed text classification in architecture, engineering & construction documents,” in 2018 16th International Conference on Frontiers in Handwriting Recognition (ICFHR), Niagara Falls, NY, USA, 05-08 August 2018, 546–551. doi:10.1109/ICFHR-2018.2018.00101
Dori, D., and Velkovitch, Y. (1998). Segmentation and recognition of dimensioning text from engineering drawings. Comput. Vis. Image Underst. 69, 196–201. doi:10.1006/cviu.1997.0585
Haar, C., Kim, H., and Koberg, L. (2022). “Ai-based engineering and production drawing information extraction,” in Flexible automation and intelligent manufacturing: The human-data-technology nexus. Editors K.-Y. Kim, L. Monplaisir, and J. Rickli (Cham: Springer International Publishing), 374–382.
Henderson, T. C. (2014). Analysis of engineering drawings and raster map images. New York: Springer. doi:10.1007/978-1-4419-8167-7
Islam, N., Islam, Z., and Noor, N. (2016). A survey on optical character recognition system. ITB J. Inf. Commun. Technol. 10. doi:10.48550/arXiv.1710.05703
Jamieson, L., Moreno-Garcia, C. F., and Elyan, E. (2020). “Deep learning for text detection and recognition in complex engineering diagrams,” in 2020 International Joint Conference on Neural Networks (IJCNN), Glasgow, UK, 19-24 July 2020, 1–7. doi:10.1109/IJCNN48605.2020.9207127
Kang, S.-O., Lee, E.-B., and Baek, H.-K. (2019). A digitization and conversion tool for imaged drawings to intelligent piping and instrumentation diagrams (p&id). Energies 12, 2593. doi:10.3390/en12132593
Karatzas, D., Gomez-Bigorda, L., Nicolaou, A., Ghosh, S., Bagdanov, A., Iwamura, M., et al. (2015). “Icdar 2015 competition on robust reading,” in 2015 13th International Conference on Document Analysis and Recognition (ICDAR), Tunis, Tunisia, 23-26 August 2015. doi:10.1109/ICDAR.2015.7333942
Kasimov, D. R., Kuchuganov, A. V., and Kuchuganov, V. N. (2015). Individual strategies in the tasks of graphical retrieval of technical drawings. J. Vis. Lang. Comput. 28, 134–146. doi:10.1016/j.jvlc.2014.12.010
Kuang, Z., Sun, H., Li, Z., Yue, X., Lin, T. H., Chen, J., et al. (2021). Mmocr: A comprehensive toolbox for text detection, recognition and understanding. (ACM MM: Chengdu, China). arXiv preprint arXiv:2108.06543.
Liao, M., Shi, B., and Bai, X. (2018). Textboxes++: A single-shot oriented scene text detector. IEEE Trans. Image Process. 27, 3676–3690. doi:10.1109/TIP.2018.2825107
Lu, Z. (1998). Detection of text regions from digital engineering drawings. IEEE Trans. Pattern Analysis Mach. Intell. 20, 431–439. doi:10.1109/34.677283
Mani, S., Haddad, M. A., Constantini, D., Douhard, W., Li, Q., and Poirier, L. (2020). “Automatic digitization of engineering diagrams using deep learning and graph search,” in 2020 IEEE/CVF Conference on Computer Vision and Pattern Recognition Workshops (CVPRW), Seattle, WA, USA, 14-19 June 2020, 673–679. doi:10.1109/CVPRW50498.2020.00096
Morales, F. (2020). keras-ocr. Available at: https://github.com/faustomorales/keras-ocr.
Moreno-García, C. F., Elyan, E., and Jayne, C. (2017). “Heuristics-based detection to improve text/graphics segmentation in complex engineering drawings,” in Engineering applications of neural networks. Editors G. Boracchi, L. Iliadis, C. Jayne, and A. Likas (Cham: Springer International Publishing), 87–98.
Moreno-García, C. F., Elyan, E., and Jayne, C. (2018). New trends on digitisation of complex engineering drawings. Neural Comput. Appl. 31, 1695–1712. doi:10.1007/s00521-018-3583-1
Rahul, R., Paliwal, S., Sharma, M., and Vig, L. (2019). Automatic information extraction from piping and instrumentation diagrams. Manhattan, New York: IEEE ICPRAM. doi:10.48550/ARXIV.1901.11383
Scheibel, B., Mangler, J., and Rinderle-Ma, S. (2021). Extraction of dimension requirements from engineering drawings for supporting quality control in production processes. Comput. Industry 129, 103442. doi:10.1016/j.compind.2021.103442
Schlagenhauf, T., Netzer, M., and Hillinger, J. (2022). “Text detection on technical drawings for the digitization of brown-field processes,” in 16th CIRP conference on intelligent computation in manufacturing engineering (Amsterdam, Netherlands: Elsevier B.V). doi:10.48550/ARXIV.2205.02659
Shi, B., Bai, X., and Yao, C. (2017). An end-to-end trainable neural network for image-based sequence recognition and its application to scene text recognition. IEEE Trans. Pattern Analysis Mach. Intell. 39, 2298–2304. doi:10.1109/TPAMI.2016.2646371
Shi, B., Yang, M., Wang, X., Lyu, P., Yao, C., and Bai, X. (2019). Aster: An attentional scene text recognizer with flexible rectification. IEEE Trans. Pattern Analysis Mach. Intell. 41, 2035–2048. doi:10.1109/TPAMI.2018.2848939
Smith, R. (2007). “An overview of the tesseract ocr engine,” in Ninth International Conference on Document Analysis and Recognition ICDAR 2007). 23-26 September 2007, Curitiba, Brazil, 629–633. doi:10.1109/ICDAR.2007.4376991
Veit, A., Matera, T., Neumann, L., Matas, J., and Belongie, S. (2016). Coco-text: Dataset and benchmark for text detection and recognition in natural images. (IEEE: Las Vegas, NV, USA). doi:10.48550/ARXIV.1601.07140
Villena Toro, J., and Tarkian, M. (2022). “Automated and customized CAD drawings by utilizing machine learning algorithms: A case study,” in International design engineering technical conferences and computers and information in engineering conference. (ASME: St Louis, MO, USA). Volume 3B: 48th Design Automation Conference (DAC). doi:10.1115/DETC2022-88971
Xia, G.-S., Bai, X., Ding, J., Zhu, Z., Belongie, S., Luo, J., et al. (2017). Dota: A large-scale dataset for object detection in aerial images. (IEEE: Salt Lake City, UT, USA). doi:10.48550/ARXIV.1711.10398
Xie, L., Lu, Y., Furuhata, T., Yamakawa, S., Zhang, W., Regmi, A., et al. (2022). Graph neural network-enabled manufacturing method classification from engineering drawings. Comput. Industry 142, 103697. doi:10.1016/j.compind.2022.103697
Zhang, W., Chen, Q., Koz, C., Xie, L., Regmi, A., Yamakawa, S., et al. (2022). “Data augmentation of engineering drawings for data-driven component segmentation,” in International design engineering technical conferences and computers and information in engineering conference (ASME: St Louis, MO, USA). Volume 3A: 48th Design Automation Conference (DAC). doi:10.1115/DETC2022-91043.V03AT03A016
Zhou, X., Yao, C., Wen, H., Wang, Y., Zhou, S., He, W., et al. (2017). “East: An efficient and accurate scene text detector,” in 2017 IEEE conference on computer vision and pattern recognition (CVPR). (IEEE: Honolulu, HI, USA), 2642–2651. doi:10.1109/CVPR.2017.283
Glossary
API application programming interface
ASCII American standard code for information interchange
ASME American society of mechanical engineers
AUC area under the ROC curve
CAD computer-aided design
CAM computer-aided manufacturing
CER character error rate
CRNN convolutional recurrent neural network
D deletions
ED(s) engineering drawing(s)
F1 F1-score
FCF feature control frame
GD&T geometric dimensioning and tolerancing
GE graphical elements
I insertions
ISO International organization for standardization
NN(s) neural network(s)
OCR optical character recognition
P precision
P&ID(s) piping and instrumentation diagram(s)
PMI production manufacturing information
PTD text detection precision
R recall
ROC (curve) receiver operating characteristic (curve)
RTD text detection recall
S substitutions
TC true characters
TD text detection
TR text recognition
Keywords: optical character recognition, image segmentation, object detection, engineering drawings, quality control, keras-ocr
Citation: Villena Toro J, Wiberg A and Tarkian M (2023) Optical character recognition on engineering drawings to achieve automation in production quality control. Front. Manuf. Technol. 3:1154132. doi: 10.3389/fmtec.2023.1154132
Received: 30 January 2023; Accepted: 28 February 2023;
Published: 20 March 2023.
Edited by:
Ravi Sekhar, Symbiosis International University, IndiaReviewed by:
Nitin Solke, Symbiosis International University, IndiaJayant Jagtap, Symbiosis International University, India
Priya Jadhav, Symbiosis International University, India
Copyright © 2023 Villena Toro, Wiberg and Tarkian. This is an open-access article distributed under the terms of the Creative Commons Attribution License (CC BY). The use, distribution or reproduction in other forums is permitted, provided the original author(s) and the copyright owner(s) are credited and that the original publication in this journal is cited, in accordance with accepted academic practice. No use, distribution or reproduction is permitted which does not comply with these terms.
*Correspondence: Javier Villena Toro, amF2aWVyLnZpbGxlbmEudG9yb0BsaXUuc2U=