 Boxuan Yang
 Ceri J. RichardsTimea B. GandekIsa de BoerItxaso Aguirre-ZuazoElse Niemeijer
 Christoffer Åberg*
- Pharmaceutical Analysis, Groningen Research Institute of Pharmacy, University of Groningen, Groningen, Netherlands
How many nanoparticles are taken up by human cells is a key question for many applications, both within medicine and safety. While many methods have been developed and applied to this question, microscopy-based methods present some unique advantages. However, the laborious nature of microscopy, in particular the consequent image analysis, remains a bottleneck. Automated image analysis has been pursued to remedy this situation, but offers its own challenges. Here we tested the recently developed deep-learning based cell identification algorithm Cellpose on fluorescence microscopy images of HeLa cells. We found that the algorithm performed very well, and hence developed a workflow that allowed us to acquire, and analyse, thousands of cells in a relatively modest amount of time, without sacrificing cell identification accuracy. We subsequently tested the workflow on images of cells exposed to fluorescently-labelled polystyrene nanoparticles. This dataset was then used to study the relationship between cell size and nanoparticle uptake, a subject where high-throughput microscopy is of particular utility.
1 Introduction
The interaction between nanoparticles and cells is studied for a number of applications; within medicine for drug delivery (Shi et al., 2017; Akinc et al., 2019; Wolfram and Ferrari, 2019; Kulkarni et al., 2021; Mitchell et al., 2021), imaging (Bogart et al., 2014; Yu and Zheng, 2015; Kim et al., 2018; Han et al., 2019), vaccination (Friedrichs and Bowman, 2021; Fries et al., 2021; Kisby et al., 2021), and cell therapies (Chakravarty et al., 2010; Stewart et al., 2016; Xiong et al., 2021) and within toxicology to ensure the safe implementation of nanotechnology (Oberdörster et al., 2005; Rivera-Gil et al., 2013; Valsami-Jones and Lynch, 2015; Park et al., 2017; Kah et al., 2021). The ultimate effect of the nanoparticle, whether it is a therapeutic or an adverse one, ultimately depends on the number of particles that may exert said effect. While nanoparticles have been shown to cause effects on cells indirectly over a barrier (Bhabra et al., 2009; Sood et al., 2011; Dugershaw et al., 2020), in most cases their effects occur within the cell, and consequently the number of nanoparticles that enter a cell remains a key question (Åberg, 2021).
To investigate the uptake of nanoparticles by cells, a range of techniques have been used and developed, including Inductively Coupled Plasma Mass Spectrometry (ICP-MS) for metal-containing particles (Chithrani et al., 2006; Cho et al., 2009), magnetophoresis for magnetic particles (Wilhelm et al., 2002), and flow cytometry for fluorescently labelled particles (Salvati et al., 2018), just to name a few [see previous literature for a more comprehensive list; (Salvati et al., 2018; Åberg, 2021)].
Optical microscopy is also a useful technique, in particular for fluorescently labelled particles (Jiang et al., 2010a; Schübbe et al., 2010; Åberg et al., 2021), but also for particles that intrinsically exhibit fluorescence [e.g., quantum dots (Jiang et al., 2010b; Summers et al., 2011)] as well as particles that scatter light strongly (Gibbs-Flournoy et al., 2011). In fact, microscopy has a range of advantages (in particular for adherent cells) that sets it apart from many other techniques to measure nanoparticle cell uptake. Perhaps the most obvious one is that it is possible to directly observe the cell, and thereby relate its accumulated amount of nanoparticles to its phenotypic traits (e.g., cell area) (Panet et al., 2017; Rees et al., 2019), or other characteristics (Caicedo et al. (2017) [e.g., cell cycle state, (Kim et al., 2012; Åberg et al., 2017), as well as its local environment (Snijder et al., 2009)]. Another advantage is that in principle it is possible to explicitly count the number of particles inside a cell, as opposed to relying on more indirect measures such as fluorescence intensity. Admittedly nanoparticles often accumulate within the same organelles inside cells (Sandin et al., 2012; Åberg et al., 2016), and the resulting clusters are often below the diffraction limit, so counting individual objects is not sufficient to gain knowledge of the total number of particles. However, to resolve such clusters one may use super-resolution approaches (Schermelleh et al., 2019), such as stimulated emission depletion microscopy (Schübbe et al., 2010; Müller et al., 2012), or estimate the number of particles within a cluster based on the total fluorescence intensity of the cluster (Wang et al., 2009; Åberg et al., 2016; Rees et al., 2019).
A major disadvantage of microscopy, however, is that the resulting image analysis is labour-intensive and consequently it is typically only applied to a handful of cells. Imaging cytometry can certainly offset the low-throughput character of microscopy (Summers et al., 2011), and may be useful for many applications, but some of the advantages of microscopy are also lost (e.g., the possibility of observing the cell in its native state). Various approaches to make microscopy more high-throughput have consequently been pursued, including within the nanoparticle-cell interactions field (Brayden et al., 2015; Collins et al., 2017). One such approach is the usage of automatic cell identification algorithms, both using commercial (Panarella et al., 2016; Kelly et al., 2021) and free (Panarella et al., 2016; Rees et al., 2019) software. In particular, the free software CellProfiler (Carpenter et al., 2006; Kamentsky et al., 2011; McQuin et al., 2018; Stirling et al., 2021) is quite popular for this purpose, within biological imaging in general and for nanoparticle-cell studies in particular. A quite different approach is the physical separation of the cells, by seeding the cells on specifically prepared arrays where cells only adhere within predefined and well-separated areas (Murschhauser et al., 2019), thereby completely avoiding the difficulty of identifying where one cell ends and the other begins.
More recently, deep-learning (LeCun et al., 2015) based algorithms have been developed to improve automatic cell identification. This is the approach we took in the work reported here; specifically, we used the deep-learning based algorithm Cellpose (Stringer et al., 2021; Pachitariu and Stringer, 2022), and developed a workflow that couples high-throughput microscopy of cells to a semi-automatic identification of the cells based on Cellpose. This workflow was set up because by necessity only limited fields of view of the full sample can be captured, and these views have to subsequently be united post-acquisition into a full(er) view of the sample. Our workflow ensures that all cells are identified, that no cells are identified twice, and that all cells are complete (as opposed to two halves of a cell being identified separately in two images). While the automatic cell identification by Cellpose worked very well, we also included a manual inspection step in the workflow to review the automatic cell identification. We tested the workflow by applying it to microscopy images of cells exposed to polystyrene nanoparticles. Subsequently this dataset was used to investigate the relationship between cell size and nanoparticle uptake (Panet et al., 2017; Rees et al., 2019; Åberg et al., 2021), a topic where microscopy has several advantages over other techniques and where high-throughput is very much desired.
2 Materials and methods
2.1 Materials
HeLa cervical adenocarcinoma cells were acquired from American Type Culture Collection (ATTC; CCL-2TM, lot no. 61647128). Minimal Essential Medium (MEM) containing Earle’s salts and l-glutamine, Foetal Bovine Serum (FBS), Dulbecco’s Modified Eagle Medium (DMEM), Dulbecco’s Phosphate Buffered Saline (PBS) without CaCl2 and MgCl2, and 0.05% trypsin–EDTA were purchased from ThermoFisher (Gibco, Life Technologies).
Yellow/green carboxylated polystyrene nanoparticles of 100 and 500 nm diameter (excitation 505 nm; emission 515 nm) and Wheat Germ Agglutinin (WGA) conjugated with Alexa Fluor 555 were obtained from ThermoFisher (Gibco, Life Technologies) and used without further modifications. DAPI was purchased from AppliChem. and Mowiol 4-88 was acquired from Merck Millipore. Glycerol was obtained from ThermoFisher.
2.2 Cell culture
HeLa cells were cultured under standard conditions (37°C, humidified atmosphere and 5% CO2) in MEM supplemented with 10% (v/v) FBS (cMEM) or DMEM supplemented with 10% (v/v) FBS (cDMEM). Mycoplasma tests were performed regularly and showed no contamination.
2.3 High-throughput fluorescence microscopy
Microscopy coverslips of 12 mm diameter were placed in each well of a 24-well plate. HeLa cells cultured in cMEM were seeded at a density of 50,000 cells per well and left to adhere to the substrate by incubation overnight at 37°C under a humidified atmosphere and 5% CO2. Nanoparticle dispersions were prepared by diluting the nanoparticle stock in cMEM to obtain the appropriate concentrations. The cells were exposed to the particles by replacing the medium with the nanoparticle dispersion, after which the cells were further incubated for 4 h at 37°C under a humidified atmosphere and 5% CO2. Subsequently, the nanoparticle-containing medium was removed and the cells were washed with PBS, followed by fixation using 4% formaldehyde following the protocol provided by the manufacturer. The fixing solution was removed and cells were washed with PBS. Subsequently, the cells were stained using WGA diluted in PBS (1:200 dilution) by incubation at 37°C for 10 min, followed by washing with PBS. Nuclei were stained by incubation with DAPI diluted in PBS (1:5,000) for 5–10 min at room temperature and subsequent rinsing. Finally, the coverslips were mounted on microscope slides (ThermoScientific) using 200 mg/mL Mowiol dissolved in glycerol and left at room temperature for 24 h. The cells were observed with a 40× oil objective using a Zeiss AxioObserver Z1 microscope equipped with a CMOS-colour camera PL-B623 Pixelink 3.1 Megapixels and using TissueFAXS acquisition software.
2.4 Image analysis using CellProfiler
The images were analysed using Cellprofiler (McQuin et al., 2018) (version 3.1.8). To account for a non-uniform intensity of the nuclear (DAPI) signal, however, ilastik (Berg et al., 2019) (version 1.3.3) was first used to identify the nuclei. The IdentifyPrimaryObject module in CellProfiler was then used to identify the nuclei in the binary image output by ilastik. Subsequently, the IdentifySecondaryObjects module in CellProfiler was used to identify the cells from the cytoplasm (WGA) signal, working with the “Propagation” method of the IdentifySecondaryObjects module. The “Propagation” method starts from each nucleus and stops when hitting another cell or when the intensity is below a threshold (McQuin et al., 2018). The threshold was set after measuring the background intensity in a region without cells.
2.5 Image analysis using Cellpose
The workflow is described in the main text. Briefly, Cellpose (Stringer et al., 2021) was run on all images, using the same cell diameter (100 pixels) throughout. The identified cells were manually checked. In a few images, air bubbles were present, in which case the cells within the bubble were removed. Identified cells touching the border were removed from each image and subsequently identified cells that were part of two neighbouring images were removed from the right and/or bottom of the two images. Measurements were then performed on the resulting identified cells: Cell area was evaluated as the number of pixels within and including each outline from Cellpose, multiplied by the size of a pixel (0.228151 μm) squared. Nanoparticle fluorescence was evaluated as the sum of the fluorescence intensity within each outline from Cellpose. Unless otherwise stated, an estimate of the background fluorescence was subtracted from the nanoparticle fluorescence of each cell. The estimate of the background fluorescence was calculated from an empirical linear relationship between the background fluorescence and cell area, evaluated from cells not exposed to nanoparticles as described in Supplementary Figure S3. To show that the conclusions do not depend upon this background subtraction we also show results without it (see main text). When fitting mathematical models to the distribution of experimental data, we fitted to the empirical cumulative distribution function derived from the experimental data (rather than the histogram of experimental values), thereby making the fitting procedure independent of the bins chosen for the histograms.
2.6 Simulations
In order to compare the relationship between cell area and nanoparticle uptake within the model, simple numerical simulations were performed. These simulations were based on the same assumptions as the model, and the results obtained from the simulations were analysed in the same way as the experimental data. In total, 50,000 cells were simulated. Their areas were sampled from a gamma distribution (Eq. 1 below) with a certain shape parameter, k, and scale parameter, θ. The shape and scale parameters were taken from experimental data (Figure 3 below), unless otherwise noted. To evaluate nanoparticle uptake into the simulated cells, for each cell i, the number of nanoparticles it took up was sampled from a Poisson distribution with rate parameter λAiCt, where λ is the rate of uptake per unit area and concentration, Ai the area of the cell, C nanoparticle concentration, and t time. The nanoparticle concentration, C, and time, t, was set according to the experimental conditions the simulations were supposed to describe, while the rate of uptake, λ, was evaluated from fits to the experimental data (e.g., Figure 4B below). Nanoparticle/cell area histograms were determined in the same way as from the experimental data, aside from that the total number of cells were scaled down to the experimentally sampled number of cells for ease of comparison.
2.7 Flow cytometry
HeLa cells cultured in cDMEM were seeded in 24-well plates 2 days or 1 day prior to the nanoparticle exposure at a density of approximately 150,000 cells per well. The well plates were left to incubate at 37°C under a humidified atmosphere and 5% CO2 until the day of the experiment.
A 500 nm particle dispersion at a concentration of 100 or 150 μg/mL was freshly prepared on the day of the experiment under minimal light and under sterile conditions. The nanoparticle stock was vortexed, after which a small amount was diluted in cDMEM to the right concentration. The resulting dispersion was vortexed before incubation in a warm bead bath for at least 30 min to allow for the formation of a biomolecular corona.
Prior to nanoparticle exposure to cells, the nanoparticle dispersion was briefly vortexed again to ensure a homogenous suspension of the nanoparticles. Then the medium was removed from the wells and replaced with nanoparticle dispersion. The cells were further incubated for various times at 37°C under a humidified atmosphere and 5% CO2. After nanoparticle exposure, the nanoparticle dispersions were removed and the cells were washed once with cDMEM and twice with PBS. Subsequently, the cells were detached with the addition of trypsin and incubation for 5 min at 37°C under a humidified atmosphere and 5% CO2. The detached cell suspensions were diluted in cDMEM and centrifuged for 5 min at 250 relative centrifugal force, after which the supernatant was removed by inversion. The cells were resuspended in PBS before flow cytometry measurement.
Measurements were performed using a Novocyte Quanteon (Agilent) flow cytometer. The yellow-green nanoparticles were excited at 488 nm and emission was collected at 530/30 nm. Forward scattering area (FSC-A) and side scattering area (SSC-A) were used to separate living cells from debris and dead cells. These living cells were further separated from doublets using FSC-A against forward scattering height (FSC-H). Cells with no particles and cells with one particle were analysed separately as described in the main text. As a control, a dispersion of 500 nm particles at a concentration of 20 μg/mL was also run through the flow cytometer.
2.8 Particle dispersion characterisation
The 100 nm particle dispersions were characterised using Nanoparticle Tracking Analysis (NTA). The particles were dispersed at a concentration of 109 particles/mL in PBS and cMEM respectively. The cMEM dispersions were left for at least an hour to allow for biomolecular corona formation. The dispersions were measured at room temperature using a NanoSight LM14, measuring at 5 sections of each sample. The results were analysed using NTA 3.0 software (Malvern) and are presented as the average ± standard deviation over the five sections (Supplementary Table S1) or as the full distribution (Supplementary Figure S1).
The 500 nm particle dispersions were characterised using dynamic light scattering by dispersing the particles in PBS and cDMEM, respectively, at a concentration of 150 μg/mL, the highest concentration used when exposing the particles to cells. The cDMEM dispersions were left for at least an hour to allow for biomolecular corona formation. The dispersions were measured at room temperature using a Malvern ZetaSizer Nano ZS (Malvern Instruments, Malvern, United Kingdom). Three measurements of at least 10 runs were recorded for each condition. The measurements were analysed using ZetaSizer Software version 7.13 (Malvern Instruments, Malvern, United Kingdom). The results are presented as the average ± standard deviation over three replicate samples of the z average and polydispersity index evaluated by cumulant analysis (Supplementary Table S1) or the distributions from CONTIN analysis (Supplementary Figure S2).
3 Results
As a nanoparticle model system, we used commercially available yellow/green fluorescently labelled carboxylated polystyrene nanoparticles of 100 nm diameter, because we have previous data on the uptake of these particles to compare to and to support our conclusions (Kim et al., 2012; Varela et al., 2012; Varela et al., 2015; Åberg et al., 2016; Vtyurina et al., 2021; Åberg et al., 2021; de Boer et al., 2022). As a cell model, we used HeLa (human adenocarcinomic cervical epithelial) cells, a well-characterised and well-used cell line (Collinet et al., 2010; Simpson et al., 2012). We also used 500 nm diameter sized yellow/green fluorescently labelled carboxylated polystyrene nanoparticles, because their strong fluorescence proved crucial for further support of our conclusions, as will transpire below. In line with previous studies (dos Santos et al., 2011; Kim et al., 2012; Åberg et al., 2016; Vtyurina et al., 2021; de Boer et al., 2022), dynamic light scattering showed that these nanoparticles are fairly monodisperse and remain well-dispersed in cell culture medium supplemented with serum (Supplementary Table S1 and Supplementary Figures S1, S2).
For measuring cellular nanoparticle uptake using microscopy with high-throughput it is necessary to automatically identify (segment) the cells in the microscopy images. To test the possibility of doing so, HeLa cells were fixed and incubated with DAPI (4′,6-diamidino-2-phenylindole), to stain the cell nuclei, and fluorescently-labelled WGA (Alexa Fluor 555-labelled Wheat Germ Agglutinin) to stain the cytoplasm (Figure 1A).
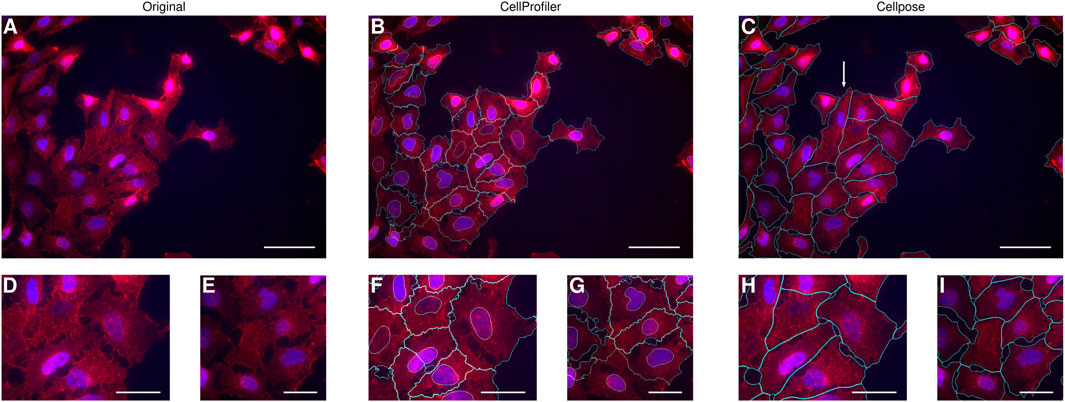
FIGURE 1. Comparison of automatic cell identification using different software. HeLa cells were labelled with WGA to distinguish the cytoplasm (red) and with DAPI to distinguish the nuclei (blue). (A–C) One field of view of the cell culture. Scale bars 50 μm. (D–I) Zoom-in at two different locations within the field of view. Scale bars 25 μm. (A,D–E) Original image from which it is easy to discern individual cells by eye. (B,F–G) Cells (cyan) and their nuclei (also cyan) identified using CellProfiler (in combination with ilastik). The outline of many of the cells correspond to what one may discern by eye, but in some cases the outlines clearly do not capture the actual cell borders (cf. panels D,F; and E,G, respectively). (C, H–I) Cells (cyan) identified using Cellpose. The outline of the majority of the cells correspond to what one may discern by eye, including those examples where our usage of CellProfiler did not result in a sufficiently accurate identification (cf. panels D, F, H; and E, G, I, respectively). Nevertheless, there were some cells that were not correctly identified, for example, the cell indicated by a white arrow in panel C, which is actually 2 cells (cf. panel A) though the DAPI staining of the second cell is somewhat faint.
In a preliminary investigation, we used the open-source software CellProfiler (Carpenter et al., 2006; McQuin et al., 2018) to identify the cells in the images. More specifically, we first used the machine-learning based program ilastik (Berg et al., 2019) to identify the nuclei, as their intensity sometimes varied between cells. Subsequently, we used the “propagation” method in CellProfiler to find the cell borders (Figure 1B; see Materials and Methods for details). Unfortunately, we noticed some issues with the cell identification, typically when two cells bordered each other, where sometimes the borders identified by the algorithm did not match the borders that are quite clear from the original image (cf. Figures 1D, F; Figures 1E, G). While the identification can probably be optimised to some degree by changing parameters and, if all else fails, be corrected manually, we found the identification to be less than optimal.
As an alternative, we thus turned to Cellpose (Stringer et al., 2021). We had to optimise the choice of one parameter, cell size, since Cellpose has been trained on microscopy images of a different resolution compared to ours. However, once we had found a reasonable value for the cell size parameter, we found that cell identification worked very well (Figure 1C). In particular, we found that Cellpose identified the cell borders close to what the original image would suggest (cf. Figures 1D, H; Figures 1E, I). It is beyond the scope of the present work to fully compare the CellProfiler- and Cellpose-based approaches; however, see Chen and Murphy (2022) for a study along these lines. Suffice to say here that Cellpose clearly performed better than our usage of CellProfiler (cf. Figures 1D, F; Figures 1E, G). Nevertheless, some misidentification did occur (e.g., Figure 1C; arrow), which could potentially be remedied by optimisation of the staining procedure and/or changing the cell identification parameters (other than cell size). Despite these misidentifications, we reasoned that there were so few misidentifications that correcting these manually would be quick, especially given the rather efficient graphical user interface available for Cellpose (where shortcuts and mouse gestures make correction swift).
Having convinced ourselves that the cells could be identified well and fast, we proceeded by acquiring microscopy images. We employed an automatic imaging system (TissueFAXS) that allowed us to acquire many fields of view of cells in widefield mode, for a total of up to 1,900 cells per sample (more is possible, but was not necessary here). Each field of view was composed of 1,392 × 1,040 pixels, corresponding to 318 × 237 μm2. The images were acquired in a 7 × 9 grid (Figure 2A), where there was substantial overlap between images to ensure that all cells would be fully included in (at least) one image (Figure 2B) and thereby avoid eventual issues from identified cells having to be stitched together from two different images (Figure 2C).
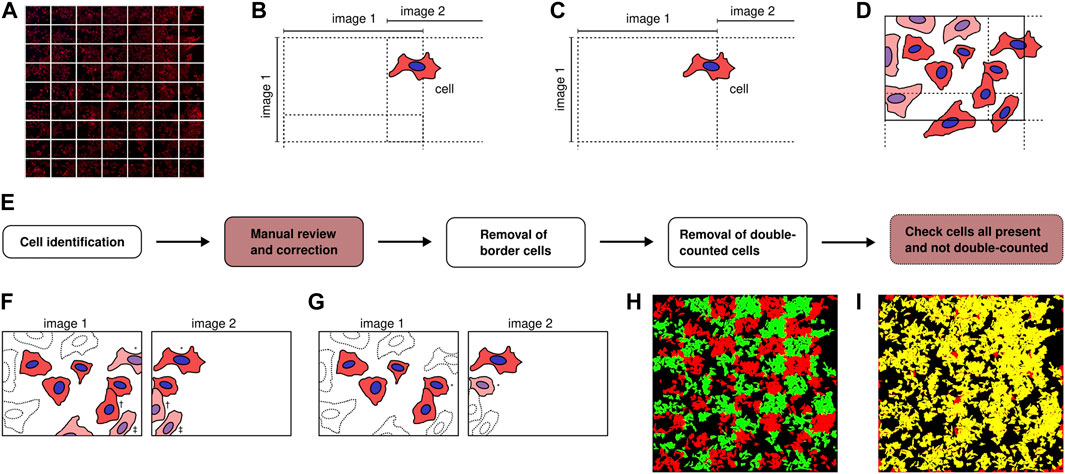
FIGURE 2. Illustration of high-throughput microscopy and image analysis. (A) Microscopy images were acquired in a grid to cover a large area. (B) Schematic of the situation (which we employed) when the microscopy images are acquired in such a way that they overlap. The indicated cell is here in both image 1 and 2, but only part of the cell is in image 1, while the whole cell is in image 2. Analysis of this cell is consequently easiest if performed in image 2. (C) Schematic of the situation when the microscopy images are acquired in such a way that they do not overlap (contrary to our set up). In this case, the indicated cell is in both image 1 and 2, but is not complete in either. Analysis of this cell consequently needs to be stitched together from two different images. (D–G) Algorithm to ensure each identified cell is included in the dataset only once. The cells that are discarded in each step are shaded, while cells that were previously discarded are shown with dotted outlines. (D) All cells on the overall outer border are removed, thereby keeping only cells that were fully captured in (at least) one image. (E) Depiction of the different steps of the workflow. The steps that can be fully automated have a white background, while the steps that involves manual operation have a red background. The final step is not strictly necessary. (F) All identified cells on the border of each image (not just the border of the overall area) are removed. Potentially this could lead to removal of some correctly identified cells, but if the overlap between images is large enough, then each cell will be captured in at least one image and there will be no cells lost. For example, the cell indicated by an asterisk (*) is removed from image 1, but is fully included in image 2. Similarly, the cell indicated by a dagger (†) is removed from image 2, but is fully included in image 1. The cell indicated by a double dagger (‡) is removed from both image 1 and 2; it should therefore be included in the image below image 1 or 2, if the overlap is large enough. (G) Finally, all remaining identified cells within the overlap region that are in two images are removed from one image, always keeping such an identified cell in the uppermost or leftmost of the two images. For example, the cell indicated by an asterisk (*) is included in both image 1 and 2. This cell is kept in the identification related to image 1, since image 1 is to the left of image 2. (H) To ensure that there is no double counting of identified cells, a useful quick check is to overlay the images of all the identified cells, alternating the colour (here between red and green) between each image. A cell that is included in two images then easily stands out as it will be in both colours (here yellow). (I) Similarly, a quick check to see if all the cells that were originally identified (before the algorithm illustrated by panel D,F–G potentially removed them) is to overlay the originally identified cells (here red) with the final dataset (here green). Cells that have been removed are then readily visible as they are only in one colour (here red).
To analyse these images, after a bit of trial-and-error we arrived at the workflow depicted by Figure 2E, which we found to be quite efficient: First, we ran Cellpose on all microscopy images with a fixed (optimised) cell size. Depending upon the specifics of the computer hardware (especially the presence or absence of graphical processing units, GPUs) and the number of images, this step can take some time. As an admittedly informal guide, it took 25 min to analyse 63 images of 1,392 × 1,040 pixels and in total 1,900 cells with a cell size of 100 pixels on a computer without GPU support. This analysis can, however, be executed without any human intervention. As a next step, we subsequently went through each image and corrected any misidentified cells. This becomes quite efficient after learning all software shortcuts, but nevertheless is somewhat labour intensive. Again as an informal guide, it took us around 90 min to do this for 63 images containing in total some 1,900 identified cells. The (local) density of cells is a major factor here, as cells are typically well-identified when fairly isolated, while the majority of errors occur in dense areas.
At this point we thus had only cells that were considered to be well-identified, but had many cells that were identified in several images. Next, for each image we removed all identified cells touching any of the borders of that image. This discards all identified cells at the overall grid border (Figure 2D), the size and other characteristics of which we cannot know for sure, since they were not fully captured in any image. However, it also discards a large number of identified cells within the overlap regions (Figure 2F). A prerequisite for this step to make sense is thus that each cell is captured fully in at least one image (ensured by choosing a large overlap distance) because then removing the identified cells touching the border will not matter as the cell will also have been identified in a neighbouring image. We carried out this step as follows: For each image, we considered each pixel along each of the four borders (left, top, right, and bottom). If a pixel had been identified to belong to a certain cell, then that cell was removed (from the whole image). This step was performed in a fully automated fashion, something that can be done without expending any substantial computing power. This is advantageous as it decreases the amount of human effort, as well as time.
After this step, we removed all remaining identified cells that were included in two neighbouring images, always keeping the identified cell that was identified either in the left or upper neighbouring image (Figure 2G). The choice of left and upper is, of course, arbitrary, but has to be performed consistently throughout the grid. We carried out this step in the following way: For each overlap region, we considered the identified cells that were identified in the left (upper) image. For each such identified cell, we found the identified cells, if any, that were identified in the right (bottom) image and which overlapped with the cell identified in the left (upper) image. The overlapping cells identified in the right (bottom) image were then removed, if the overlap was large enough (to allow a slightly different identification in the two overlapping images). Again this step was fully automated and does not require a substantial amount of computing power; consequently it can be performed quickly and without human intervention.
Finally we checked that all cells that were originally identified were still included in the dataset and included only once. This can be done quite efficiently by displaying the full grid of images (in reduced resolution) in such a way that the images are overlapped by the amount they were overlapped upon acquisition and alternating the colour between each image (Figure 2H). An identified cell that is present in two images will then exhibit both colours and easily stand out by eye. Similarly to ensure that all cells that were originally identified are still present in the dataset, one can overlap both sets of identified cells, again in two colours. A cell that has been removed during the overall procedure will then have only one colour (Figure 2I). In our dataset this occurred for cells along the outer borders (by design), but also some other cells were removed in this way (Figure 2I). This can be corrected manually, but since they are clearly a minority one can also proceed without them.
Having thus created a dataset containing ∼1,900 cells we then quantified the cell area distribution, since cell area is a parameter where a microscopy-based method exhibits clear advantages over other high-throughput methods. For example, flow cytometry is certainly high-throughput, but does not give an accurate estimate of cell size (Shapiro, 2003). Furthermore, cell-to-cell variability in nanoparticle uptake has been suggested to be driven by cell area Rees et al. (2019). We thus evaluated the area, A, of each identified cell and from that the cell area distribution (Figure 3). We may observe that the distribution is not a normal distribution, but rather exhibits a wider tail towards larger cell sizes. Previous reports have described the cell area distribution, f(A), in terms of a gamma distribution (Rees et al., 2019)
where Γ is the gamma function, k is a shape parameter and θ a scale parameter. Consistent with this description, we find that a gamma distribution provides an excellent fit to the data (Figure 3; inset), and from such a fit we can evaluate the parameters to be k = 4.99 and θ = 122 μm2. It should be noted that [like previous work (Rees et al., 2019)] the cell area here is quantified using two-dimensional microscopy, so the area is perhaps best interpreted as the projected cell area, rather than the full cell surface area embedded in three-dimensional space. Nevertheless, if we assume that the latter is proportional to the projected cell area, then the two areas will have the same shape of the distribution.
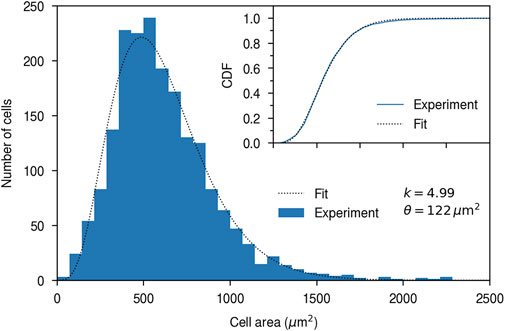
FIGURE 3. HeLa cell area quantified using high-throughput microscopy. HeLa cells were stained with DAPI (cell nuclei) and WGA (cytoplasm) and observed using fluorescence microscopy (as in Figure 1). The histogram shows experimental data, while the dotted line is a fit of a gamma distribution (Eq. 1) to the data. k and θ are the resulting fitting parameters. Note that the fit was performed on the cumulative distribution function, so as to be independent of the bins chosen for the histogram. (Inset) Cumulative distribution function showing the goodness of fit. (Blue) Empirical cumulative distribution. (Dotted line) Fit. Same x-axis as the main figure.
Having set up the workflow to identify the HeLa cells using high-throughput microscopy, we then exposed the cells to 100 nm nanoparticles (Figure 4A). Nanoparticle uptake was quantified in terms of the total nanoparticle fluorescence per cell. Part of the measured fluorescence is background and while this is small in comparison to the signal (Supplementary Figure S3) we nevertheless wanted to remove it to better relate the measured fluorescence to nanoparticle numbers. Fortunately, we noted a very strong correlation between background fluorescence and cell area for cells not exposed to nanoparticles (Supplementary Figure S3), which allows us to predict the background fluorescence for a cell of a given area. By thus removing the background we were able to quantify the fluorescence stemming solely from the nanoparticles, something we then assumed is proportional to the number of nanoparticles, and hence the number of objects, that entered. Figure 4B shows the resulting distribution of nanoparticle fluorescence over cells, from which we observe a fairly well-defined distribution that appears roughly normally distributed, aside from a clear tail towards higher fluorescences.
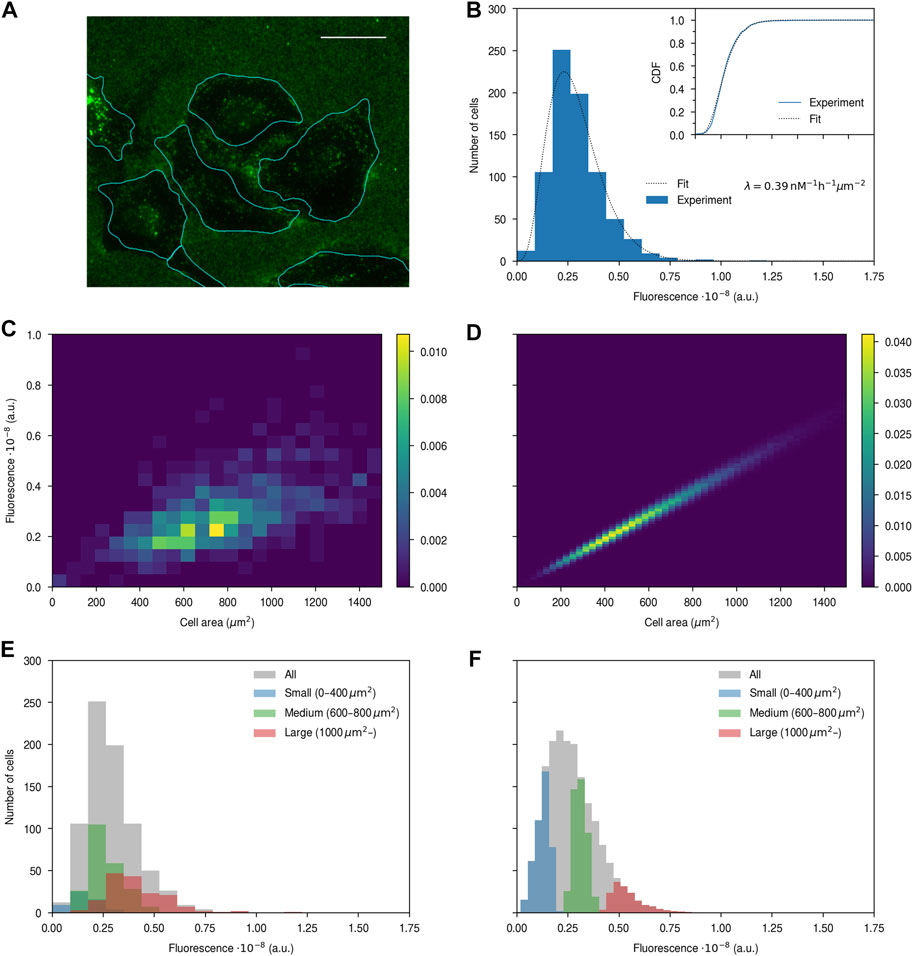
FIGURE 4. Nanoparticle uptake quantified by high-throughput fluorescence microscopy. HeLa cells were exposed to 100 μg/mL of the 100 nm nanoparticles for 4 h, stained with DAPI (cell nuclei) and WGA (cytoplasm), and observed using fluorescence microscopy. (A) Example image with nanoparticles in green and cell outlines (identified as exemplified in Figure 1C) in cyan. Note that there is a substantial number of nanoparticles stuck on the glass outside the cells. Scale bar 25 μm. (B) Fluorescence distribution over cells after background subtraction (Supplementary Figure S3). The histogram shows experimental data, while the dotted line is a fit of a model to the data, assuming a fluorescence per nanoparticle of 105 and using cell area parameters (k and θ) from control cells (Figure 3). λ is the resulting fitting parameter. Note that the fit was performed on the cumulative distribution function, so as to be independent of the bins chosen for the histogram. (Inset) Cumulative distribution function showing the goodness of fit. (Blue) Empirical cumulative distribution. (Dotted line) Fit. Same x-axis as the main figure. (C–D) Two-dimensional cell area-fluorescence distribution from (C) experiments and (D) simulations of the model. In both cases, the distribution has been normalised such that its integral is unity. (E–F) Fluorescence distributions of cells of a given size from (E) experiments and (F) simulations.
Rees et al. developed a model to describe the distribution of number of nanoparticles per cell (Rees et al., 2019), and we decided it would be interesting to test their model also on our data. Their model is essentially based on two ingredients, namely, that the uptake of a particle is a Poisson process and that the probability of uptake is proportional to the area of a cell. Based on these two assumptions, and the empirical observation (Figure 3) that the cell area distribution is approximately a gamma distribution (Eq. 1), Rees et al. showed that the probability, pN, that a cell has taken up N particles is given by
Here k and θ are the two parameters of the cell area distribution (Eq. 1), and λ the rate of uptake per unit area and concentration. Furthermore, the probability of uptake depends on the two variables concentration, C, and time, t, which, however, in the model only enter together as their product, Ct.
One subtlety of the model that is important to note is that in principle it is formulated not in terms of the total number of particles within the cells, but the total number of nanoparticle clusters (single nanoparticles or nanoparticle agglomerates). Furthermore, what is important is the number of clusters at the time of entrance. In general this may be an issue, because at least the nanoparticles we use here cluster within organelles intracellularly (Sandin et al., 2012; Åberg et al., 2016). The number of clusters that we would count after some time of exposure (e.g., 4 h in the case of Figure 4) therefore has no direct relation to the number of clusters at the time of entrance. Fortunately, the nanoparticles we use here are well-dispersed in medium and typically enter cells as single objects (Sandin et al., 2012; Åberg et al., 2016), so that the total number of nanoparticles is a good approximation to the number of objects that entered the cells. In general, though, using the model on nanoparticles that both agglomerate extracellularly and cluster within the cell would appear fraught with difficulties.
To test whether the model can describe our data we fitted the model with the normalised uptake rate, λ, as free parameter and the known cell area distribution parameters (k and θ) fixed from the experiment on cells not exposed to nanoparticles (Figure 3). Since the model is formulated in terms of number of objects, rather than fluorescence, we furthermore had to make an assumption on the fluorescence exhibited by a single nanoparticle. We used several different values, which, as expected, give different quantitative results, but give the same qualitative outcomes. We therefore focus the presentation here on one choice, but refer to the supplement for others (Supplementary Figures S4, S7). With this approach we observed that the model can describe the nanoparticle fluorescence distribution well, given that a fit of the model with only one free parameter shows good agreement (Figure 4B; inset), an outcome that is independent of the choice of the fluorescence of a single nanoparticle (Supplementary Figure S4) as well as whether we do the background subtraction or not (Supplementary Figure S5).
As a more detailed test of the model, we next investigated the interrelation between cell area and nanoparticle uptake (fluorescence) more directly. Thus we evaluated the two-dimensional distribution of fluorescence and cell area from the experimental data (Figure 4C), from which we observe a fairly wide distribution of fluorescence for a given cell area. To make this more explicit, we furthermore selected cells of a small (<400 μm2), medium (600–800 μm2) and large (>1,000 μm2) size and considered the fluorescence distribution corresponding to these cells specifically (Figure 4E). Even though the sizes of these cell subpopulations were chosen not to overlap, we observe that the corresponding fluorescence distributions still overlap to a quite substantial degree.
To compare these results to what is predicted from the model, we performed simple numerical simulations (see Methods) based on the same assumptions that underlie the model, and evaluated the corresponding simulation data in the same way as the experimental data (Figures 4D, F). We observe that while the model describes the overall fluorescence distribution well (Figures 4B, F grey) it predicts a far too narrow distribution of fluorescence for a given cell size (Figure 4D). This conclusion is unaffected by using the cell area parameters evaluated from the cells exposed to nanoparticles (Supplementary Figure S6) rather than those we evaluated from cells not exposed to nanoparticles (Figure 3). Importantly, the conclusion remains the same also if we use a different assumed value for the fluorescence per nanoparticle (Supplementary Figure S4) as well as if we do not perform the background subtraction (Supplementary Figure S5). The only possibility for realising a wider variability within the model is to assume a much higher fluorescence per nanoparticle (Supplementary Figure S7). However, even then the agreement between model and experiments is rather poor and, furthermore, such high fluorescences would imply that a typical cell takes up only 13 nanoparticles under the conditions shown in Figure 4, contrary to previous observations from microscopy which suggest hundreds of nanoparticles after just a few minutes of nanoparticle exposure at similar concentrations [Supplementary Figure S7; (Åberg et al., 2016; Vtyurina et al., 2021)]. Finally, the corresponding fluorescence distributions of the subpopulations of small, medium and large cells are completely disjoint in the model (Figure 4F), while they strongly overlap experimentally (Figure 4E). All of these conclusions also remain valid at half the nanoparticle concentration (Supplementary Figure S8).
To test the model without assumptions on the fluorescence per particle, we next turned to flow cytometry. While flow cytometry reports on the nanoparticle fluorescence per cell, we were nevertheless able to use that fluorescence to explicitly measure, with high-throughput, the actual number of nanoparticles. To do so, we started from the literature observation that when micron-sized polystyrene particles are exposed to cells, under certain conditions one observes well-defined and well-separated peaks in the fluorescence distribution over cells (dos Santos et al., 2011), consistent with a distinction between cells that have taken up (or at least associate with) 0, 1, 2, etc., particles. We interpret such results as reflecting both a low extracellular particle concentration, and a consequent low probability of uptake, as well as the strong fluorescence of the micron-sized particles, which implies a favourable separation of the peaks from each other. We thus attempted to find conditions where a separation between individual peaks could also be observed for particles smaller than a few microns, which is more relevant for the present study. We succeeded in doing so using 500 nm polystyrene nanoparticles (as opposed to the 100 nm particles used for the results presented in Figure 4) by using a concentration of 150 μg/mL and exposing the cells between 0.5 and 4 h.
Figure 5A exemplifies the fluorescence distribution over cells for one such sample (black outline). We interpret these results to mean that some cells (zeroth peak) have no associated nanoparticles, while other cells have 1, 2, 3, etc., associated nanoparticles (first, second, and third peak, respectively). After the third peak, individual peaks become less well-defined (depending upon the concentration and exposure time). The measured cells are actually cells with associated particles, as opposed to just particles without the cells, as nothing is measured if we simply run the 500 nm particles by themselves through the flow cytometer (Supplementary Figure S9). By considering also the forward scattering of the cells, one readily differentiates cells within the first two peaks from each other (Figure 5B). Indeed, by defining two subpopulations of cells based on their fluorescence intensity and forward scattering (polygons in Figure 5B) we find a good description of the two fluorescence peaks (Figure 5A, blue and red).
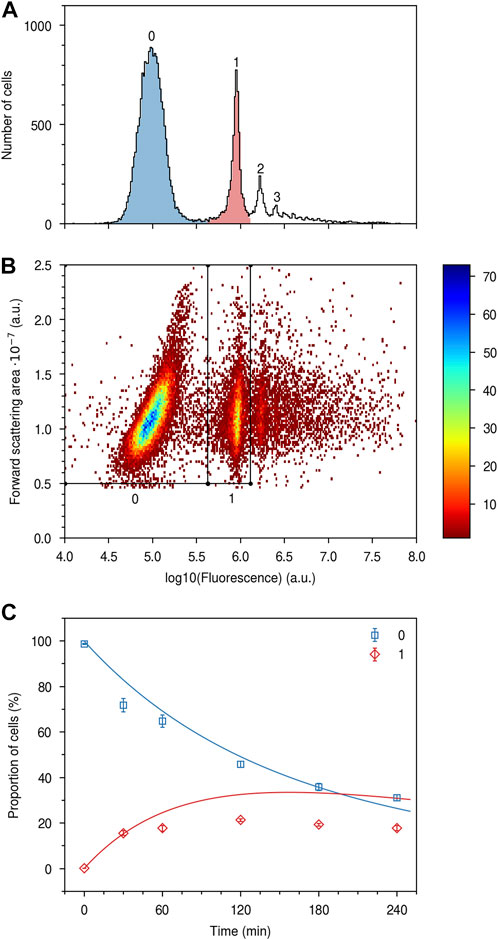
FIGURE 5. Nanoparticle uptake quantified in terms of numbers. HeLa cells were exposed to a 150 μg/mL concentration of the 500 nm particles for various times up to 4 h and then measured using flow cytometry. (A) Distribution of cell fluorescence for a sample exposed to nanoparticles for 1 h. (Black outline) All cells; (Blue) Cells within the zeroth, and (Red) first subpopulation indicated in panel B. The two subpopulations (blue and red) completely overlap with the full population (black outline) for the zeroth and first peaks, indicating that the two subpopulations have been well-identified. (B) Two-dimensional fluorescence-forward scattering distribution. Several subpopulations are easily identified and the first two are indicated by the polygons. The colour bar refers to the number of cells. (C) Proportion of cells with no nanoparticles and one nanoparticle, respectively, as a function of time. (Datapoints) Experimental data. Cells with no particles and cells with one particle were identified as illustrated by panels A–B and their proportion of the full population quantified. The data points represent the mean over 3 samples and the error bars the corresponding standard deviation. (Blue line) Fit of model (Eq. 3) to the experimentally determined proportion of cells with no nanoparticles, with θλC as fitting parameter and k fixed. (Red line) Subsequent parameter-free prediction of model (Eq. 4) for the proportion of cells with one nanoparticle. Repeat experiments are shown in Supplementary Figure S10.
With the approach illustrated by Figures 5A, B, we were able to quantify the number of cells without any nanoparticles and the number of cells with one nanoparticle (this proved sufficient for our purposes but in principle we would be able to do the same also for higher nanoparticle numbers). This is something we can directly compare to the model (Eq. 2), which predicts that the proportion of cells with no nanoparticles is given by
while the proportion of cells with one nanoparticle is given by
Here k and θ are the two parameters describing the cell area distribution (Figure 3), λ the normalised uptake rate, C the concentration and t the exposure time.
We thus exposed cells to nanoparticles for various times up to 4 h, thereby giving us experimental measures of the proportion of cells with, respectively, no nanoparticles and one nanoparticle as a function of time. Figure 5C (squares) shows how the proportion of cells without any nanoparticles starts at 100% before any nanoparticles have been supplied, and then decreases with time. While it may appear that there is a saturation of the proportion of cells that do not take up nanoparticles, a separate experiment, where we used the same nanoparticle concentration but exposed the cells for 18 h, showed that only 3.7% ± 0.2% (mean ± standard deviation of three samples) of the cells remained without particles. Turning to the cells with one nanoparticle, the proportion of such cells (diamonds) starts at 0% before nanoparticle exposure, then increases, and appears to plateau, before presumably decreasing again.
Since the cell area parameters (k and θ) are known and since we varied time t, we next fitted the model (Eq. 3) with θλC as free parameter to the experimentally determined proportion of cells with no nanoparticles. Note that λ, the normalised uptake rate, cannot be taken from our earlier results (Figure 4) because those were for the 100 nm nanoparticles and it seems reasonable to assume that the uptake rate is different for the 500 nm nanoparticles used here. Note, furthermore, that agreement between model and experiment for the first data point is a trivial outcome of the model, which, rightly, implies that no cells will have any nanoparticles before the nanoparticles have been supplied (t = 0 in Eq. 3). After performing the fit, we notice that the best fitted line (Figure 5C; blue line) describes the experimental data rather well. We subsequently used the model for a parameter-free prediction of the proportion of cells with one nanoparticle (Eq. 4), since all parameters of the model have now been independently specified (k and θ from the cell area distribution and θλC from the fit to the proportion of cells without nanoparticles). As may be observed, the prediction (Figure 5C; red line) does not describe the experimental data (diamonds) well. Again, note that agreement between model and experiment is trivial for the first data point, where the model implies that no cells will have one nanoparticle before the cells have been exposed to nanoparticles (t = 0 in Eq. 4). Repeat experiments show the same outcome (Supplementary Figure S10). Applying a similar procedure but leaving all parameters free (i.e., using both k and θλC as fitting parameters) does give a better fit of the model to the data, but at the expense of giving a cell area distribution that is both unreasonable and different from what is experimentally observed (Supplementary Figure S11). Overall, it thus appears that the model cannot describe the experimental data well.
4 Conclusion
Fluorescence microscopy has several advantages over other techniques to quantify nanoparticle uptake, including that the cells can be viewed live and in their native state, and that cell parameters such as size and other visible phenotypic traits can be determined. In terms of image acquisition there are no major limitations on the number of cells that can be studied; however, the resulting image analysis has traditionally been a bottleneck preventing microscopy from becoming a true high-throughput technique.
Here we have demonstrated the use of the deep-learning based algorithm Cellpose (Stringer et al., 2021; Pachitariu and Stringer, 2022) on fluorescence microscopy images to quantify the uptake of nanoparticles by cells. The Cellpose cell identification worked very well on our microscopy images, but we nevertheless included manual review of cell identification as an additional quality control. We set up a systematic workflow, including the manual review step but that otherwise is fully automated, to ensure that all cells would be identified and that no cells would be double-counted.
While we here opted for a manual review step, we note that the cell identification was so good that the results are independent of whether we perform this manual review or not (Supplementary Figure S12). Future studies may thus consider using the results as-is and, potentially, instead add a filtering step to remove likely misidentifications. Such a filtering step is, for example, standard in flow cytometry, where one removes data that likely represent cell debris or cell doublets by only considering objects whose measured scattering values are within certain limits Salvati et al. (2018). One could do something similar with the cells identified from microscopy images: For example, identified cells with very small areas could be removed, as one may expect them to often represent debris or other non-cell objects. However, this has to be done with some care, as cells with an area substantially smaller than the average do exist, for example, when a cell divides. The nuclear signal may then give additional information, as dividing cells are expected to have a more intense nuclear signal. Similarly, identified cells with a very large area may be removed, as one would expect them to represent several cells that have been misidentified as a single cell. Again, cells with a substantially larger cell area than the average do exist, and the nuclear signal could be used to differentiate actual large cells (single nucleus) from multiple cells misidentified as one (several nuclei). Regardless of the specifics, it seems feasible to develop an approach to perform this filtering and with time and use have it become de facto standardised.
As a proof-of-concept we used our workflow to create a dataset of some thousands of cells, exposed or not exposed to nanoparticles. We subsequently used this dataset to test a model which has been advanced to explain the observed variability in nanoparticle uptake between cells (Rees et al., 2019). This model is based on the assumptions that nanoparticle internalisation is a Poisson process and that nanoparticle uptake is proportional to cell area. While the model does indeed describe the distribution of nanoparticles over cells well, the model predicts a relationship between nanoparticle uptake and cell area which is quite different to that observed experimentally. Complementary flow cytometry measurements also show a discrepancy between model prediction and experiments. Overall, it thus appears that the model cannot describe the cell-to-cell variability in uptake of the polystyrene nanoparticles used in this study. A likely reason for this is that cell area is not the only relevant cell characteristic that matters, but that other factors also play a role. This is consistent with a recent study of ours, where multiple lines of evidence were presented suggest that, while nanoparticle uptake is certainly correlated with cell size, there are also other cellular characteristics at play (Åberg et al., 2021).
Overall, we have demonstrated the utility of deep-learning based cell identification, specifically the Cellpose algorithm (Stringer et al., 2021), to extract cell characteristics from fluorescence microscopy images. We set up a workflow which includes manual, but swift, human review of cell identification, that allowed us to measure nanoparticle uptake in thousands of cells with confidence. Thus, fluorescence microscopy can be routinely applied to measure nanoparticle uptake, at single-cell level and with high-throughput, and this technique also possesses some advantages compared to other high-throughput techniques.
Data availability statement
The original contributions presented in the study are included in the article/Supplementary Material, further inquiries can be directed to the corresponding author.
Author contributions
CÅ designed research; TG performed the high-throughput microscopy experiments; BY performed a preliminary analysis of the microscopy images using CellProfiler and analysed the corresponding data; CÅ and IA-Z set up the Cellpose analysis pipeline; CÅ performed the analysis of the microscopy images using Cellpose and analysed the corresponding data; BY and CÅ interpreted the microscopy data; CR performed the flow cytometry experiments, and the nanoparticle size characterisation; IdB and EN performed preliminary flow cytometry experiments; CÅ wrote the paper with comments and input from all. All authors listed have made a substantial, direct, and intellectual contribution to the work and approved it for publication.
Funding
CR was supported by a scholarship awarded under the Molecular Life and Health programme of the Faculty of Science and Engineering, University of Groningen.
Acknowledgments
The high-throughput microscopy experiments were carried out at the University Medical Center Groningen Imaging and Microscopy Center, which is sponsored by an NWO grant 40-00506-98–9021, while the flow cytometry measurements were carried out at the Flow Cytometry Unit of the University Medical Center Groningen. We thank the Department of Pharmaceutical Technology and Biopharmacy, Groningen Research Institute of Pharmacy, University of Groningen for providing access to the NanoSight LM14, and Henny C. van der Mei and Hans J. Kaper at the Department of Biomedical Engineering, University Medical Center Groningen for access to the Malvern ZetaSizer Nano ZS.
Conflict of interest
The authors declare that the research was conducted in the absence of any commercial or financial relationships that could be construed as a potential conflict of interest.
Publisher’s note
All claims expressed in this article are solely those of the authors and do not necessarily represent those of their affiliated organizations, or those of the publisher, the editors and the reviewers. Any product that may be evaluated in this article, or claim that may be made by its manufacturer, is not guaranteed or endorsed by the publisher.
Supplementary material
The Supplementary Material for this article can be found online at: https://www.frontiersin.org/articles/10.3389/fnano.2023.1181362/full#supplementary-material
References
Åberg, C., Kim, J. A., Salvati, A., and Dawson, K. A. (2017). Reply to “The interface of nanoparticles with proliferating mammalian cells. Nat. Nanotechnol. 12, 600–603. doi:10.1038/nnano.2017.139
Åberg, C. (2021). Kinetics of nanoparticle uptake into and distribution in human cells. Nanoscale Adv. 3, 2196–2212. doi:10.1039/D0NA00716A
Åberg, C., Piattelli, V., Montizaan, D., and Salvati, A. (2021). Sources of variability in nanoparticle uptake by cells. Nanoscale 13, 17530–17546. doi:10.1039/D1NR04690J
Åberg, C., Varela, J. A., Fitzpatrick, L. W., and Dawson, K. A. (2016). Spatial and structural metrics for living cells inspired by statistical mechanics. Sci. Rep. 6, 34457. doi:10.1038/srep34457
Akinc, A., Maier, M. A., Manoharan, M., Fitzgerald, K., Jayaraman, M., Barros, S., et al. (2019). The Onpattro story and the clinical translation of nanomedicines containing nucleic acid-based drugs. Nat. Nanotechnol. 14, 1084–1087. doi:10.1038/s41565-019-0591-y
Berg, S., Kutra, D., Kroeger, T., Straehle, C. N., Kausler, B. X., Haubold, C., et al. (2019). ilastik: Interactive machine learning for (bio)image analysis. Nat. Methods 16, 1226–1232. doi:10.1038/s41592-019-0582-9
Bhabra, G., Sood, A., Fisher, B., Cartwright, L., Saunders, M., Evans, W. H., et al. (2009). Nanoparticles can cause DNA damage across a cellular barrier. Nat. Nanotechnol. 4, 876–883. doi:10.1038/nnano.2009.313
Bogart, L. K., Pourroy, G., Murphy, C. J., Puntes, V., Pellegrino, T., Rosenblum, D., et al. (2014). Nanoparticles for imaging, sensing, and therapeutic intervention. ACS Nano 8, 3107–3122. doi:10.1021/nn500962q
Brayden, D. J., Cryan, S.-A., Dawson, K. A., O’Brien, P. J., and Simpson, J. C. (2015). High-content analysis for drug delivery and nanoparticle applications. Drug Discov. Today 20, 942–957. doi:10.1016/j.drudis.2015.04.001
Caicedo, J. C., Cooper, S., Heigwer, F., Warchal, S., Qiu, P., Molnar, C., et al. (2017). Data-analysis strategies for image-based cell profiling. Nat. Methods 14, 849–863. doi:10.1038/nmeth.4397
Carpenter, A. E., Jones, T. R., Lamprecht, M. R., Clarke, C., Kang, I. H., Friman, O., et al. (2006). CellProfiler: Image analysis software for identifying and quantifying cell phenotypes. Genome Biol. 7, R100. doi:10.1186/gb-2006-7-10-r100
Chakravarty, P., Qian, W., El-Sayed, M. A., and Prausnitz, M. R. (2010). Delivery of molecules into cells using carbon nanoparticles activated by femtosecond laser pulses. Nat. Nanotechnol. 5, 607–611. doi:10.1038/nnano.2010.126
Chen, H., and Murphy, R. F. (2022). Evaluation of cell segmentation methods without reference segmentations. Mol. Biol. Cell 2022, mbcE22080364. Published ahead of print. doi:10.1091/mbc.E22-08-0364
Chithrani, B. D., Ghazani, A. A., and Chan, W. C. W. (2006). Determining the size and shape dependence of gold nanoparticle uptake into mammalian cells. Nano Lett. 6, 662–668. doi:10.1021/nl052396o
Cho, E. C., Xie, J., Wurm, P. A., and Xia, Y. (2009). Understanding the role of surface charges in cellular adsorption versus internalization by selectively removing gold nanoparticles on the cell surface with a I2/KI etchant. Nano Lett. 9, 1080–1084. doi:10.1021/nl803487r
Collinet, C., Stoter, M., Bradshaw, C. R., Samusik, N., Rink, J. C., Kenski, D., et al. (2010). Systems survey of endocytosis by multiparametric image analysis. Nature 464, 243–249. doi:10.1038/nature08779
Collins, A. R., Annangi, B., Rubio, L., Marcos, R., Dorn, M., Merker, C., et al. (2017). High throughput toxicity screening and intracellular detection of nanomaterials. Wiley Interdiscip. Rev. Nanomed. Nanobiotechnol. 9, e1413. doi:10.1002/wnan.1413
de Boer, I., Richards, C. J., and Åberg, C. (2022). Simultaneous exposure of different nanoparticles influences cell uptake. Pharmaceutics 14, 136. doi:10.3390/pharmaceutics14010136
dos Santos, T., Varela, J., Lynch, I., Salvati, A., and Dawson, K. A. (2011). Quantitative assessment of the comparative nanoparticle-uptake efficiency of a range of cell lines. Small 7, 3341–3349. doi:10.1002/smll.201101076
Dugershaw, B. B., Aengenheister, L., Hansen, S. S. K., Hougaard, K. S., and Buerki-Thurnherr, T. (2020). Recent insights on indirect mechanisms in developmental toxicity of nanomaterials. Fibre Toxicol. 17, 31. doi:10.1186/s12989-020-00359-x
Friedrichs, S., and Bowman, D. M. (2021). COVID-19 may become nanomedicine’s finest hour yet. Nat. Nanotechnol. 16, 362–364. doi:10.1038/s41565-021-00901-8
Fries, C. N., Curvino, E. J., Chen, J.-L., Permar, S. R., Fouda, G. G., and Collier, J. H. (2021). Advances in nanomaterial vaccine strategies to address infectious diseases impacting global health. Nat. Nanotechnol. 16, 1–14. doi:10.1038/s41565-020-0739-9
Gibbs-Flournoy, E. A., Bromberg, P. A., Hofer, T. P., Samet, J. M., and Zucker, R. M. (2011). Darkfield-Confocal Microscopy detection of nanoscale particle internalization by human lung cells. Fibre Toxicol. 8, 2. doi:10.1186/1743-8977-8-2
Han, X., Xu, K., Taratula, O., and Farsad, K. (2019). Applications of nanoparticles in biomedical imaging. Nanoscale 11, 799–819. doi:10.1039/C8NR07769J
Jiang, X., Dausend, J., Hafner, M., Musyanovych, A., Röcker, C., Landfester, K., et al. (2010a). Specific effects of surface amines on polystyrene nanoparticles in their interactions with mesenchymal stem cells. Biomacromolecules 11, 748–753. doi:10.1021/bm901348z
Jiang, X., Röcker, C., Hafner, M., Brandholt, S., Dörlich, R. M., and Nienhaus, G. U. (2010b). Endo- and exocytosis of zwitterionic quantum dot nanoparticles by live HeLa cells. ACS Nano 4, 6787–6797. doi:10.1021/nn101277w
Kah, M., Johnston, L. J., Kookana, R. S., Bruce, W., Haase, A., Ritz, V., et al. (2021). Comprehensive framework for human health risk assessment of nanopesticides. Nat. Nanotechnol. 16, 955–964. doi:10.1038/s41565-021-00964-7
Kamentsky, L., Jones, T. R., Fraser, A., Bray, M.-A., Logan, D. J., Madden, K. L., et al. (2011). Improved structure, function and compatibility for CellProfiler: Modular high-throughput image analysis software. Bioinformatics 27, 1179–1180. doi:10.1093/bioinformatics/btr095
Kelly, S., Byrne, M. H., Quinn, S. J., and Simpson, J. C. (2021). Multiparametric nanoparticle-induced toxicity readouts with single cell resolution in HepG2 multicellular tumour spheroids. Nanoscale 13, 17615–17628. doi:10.1039/D1NR04460E
Kim, D., Kim, J., Park, Y. I., Lee, N., and Hyeon, T. (2018). Recent development of inorganic nanoparticles for biomedical imaging. ACS Cent. Sci. 4, 324–336. doi:10.1021/acscentsci.7b00574
Kim, J. A., Åberg, C., Salvati, A., and Dawson, K. A. (2012). Role of cell cycle on the cellular uptake and dilution of nanoparticles in a cell population. Nat. Nanotechnol. 7, 62–68. doi:10.1038/nnano.2011.191
Kisby, T., Yilmazer, A., and Kostarelos, K. (2021). Reasons for success and lessons learnt from nanoscale vaccines against COVID-19. Nat. Nanotechnol. 16, 843–850. doi:10.1038/s41565-021-00946-9
Kulkarni, J. A., Witzigmann, D., Thomson, S. B., Chen, S., Leavitt, B. R., Cullis, P. R., et al. (2021). The current landscape of nucleic acid therapeutics. Nat. Nanotechnol. 16, 630–643. doi:10.1038/s41565-021-00898-0
LeCun, Y., Bengio, Y., and Hinton, G. (2015). Deep learning. Nature 521, 436–444. doi:10.1038/nature14539
McQuin, C., Goodman, A., Chernyshev, V., Kamentsky, L., Cimini, B. A., Karhohs, K. W., et al. (2018). CellProfiler 3.0: Next-generation image processing for biology. PLOS Biol. 16, e2005970. doi:10.1371/journal.pbio.2005970
Mitchell, M. J., Billingsley, M. M., Haley, R. M., Wechsler, M. E., Peppas, N. A., and Langer, R. (2021). Engineering precision nanoparticles for drug delivery. Nat. Rev. Drug Discov. 20, 101–124. doi:10.1038/s41573-020-0090-8
Müller, T., Schumann, C., and Kraegeloh, A. (2012). STED microscopy and its applications: New insights into cellular processes on the nanoscale. ChemPhysChem 13, 1986–2000. doi:10.1002/cphc.201100986
Murschhauser, A., Röttgermann, P. J. F., Woschée, D., Ober, M. F., Yan, Y., Dawson, K. A., et al. (2019). A high-throughput microscopy method for single-cell analysis of event-time correlations in nanoparticle-induced cell death. Commun. Biol. 2, 35–11. doi:10.1038/s42003-019-0282-0
Oberdörster, G., Oberdörster, E., and Oberdörster, J. (2005). Nanotoxicology: An emerging discipline evolving from studies of ultrafine particles. Environ. Health Perspect. 113, 823–839. doi:10.1289/ehp.7339
Pachitariu, M., and Stringer, C. (2022). Cellpose 2.0: How to train your own model. Nat. Methods 19, 1634–1641. doi:10.1038/s41592-022-01663-4
Panarella, A., Bexiga, M. G., Galea, G., O’ Neill, E. D., Salvati, A., Dawson, K. A., et al. (2016). A systematic high-content screening microscopy approach reveals key roles for Rab33b, OATL1 and Myo6 in nanoparticle trafficking in HeLa cells. Sci. Rep. 6, 28865. doi:10.1038/srep28865
Panet, E., Mashriki, T., Lahmi, R., Jacob, A., Ozer, E., Vecsler, M., et al. (2017). The interface of nanoparticles with proliferating mammalian cells. Nat. Nanotechnol. 12, 598–600. doi:10.1038/nnano.2017.140
Park, M. V. D. Z., Bleeker, E. A. J., Brand, W., Cassee, F. R., van Elk, M., Gosens, I., et al. (2017). Considerations for safe innovation: The case of graphene. ACS Nano 11, 9574–9593. doi:10.1021/acsnano.7b04120
Rees, P., Wills, J. W., Brown, M. R., Barnes, C. M., and Summers, H. D. (2019). The origin of heterogeneous nanoparticle uptake by cells. Nat. Commun. 10, 2341. doi:10.1038/s41467-019-10112-4
Rivera-Gil, P., Jimenez De Aberasturi, D., Wulf, V., Pelaz, B., Del Pino, P., Zhao, Y., et al. (2013). The challenge to relate the physicochemical properties of colloidal nanoparticles to their cytotoxicity. Acc. Chem. Res. 46, 743–749. doi:10.1021/ar300039j
Salvati, A., Nelissen, I., Haase, A., Åberg, C., Moya, S., Jacobs, A., et al. (2018). Quantitative measurement of nanoparticle uptake by flow cytometry illustrated by an interlaboratory comparison of the uptake of labelled polystyrene nanoparticles. NanoImpact 9, 42–50. doi:10.1016/j.impact.2017.10.004
Sandin, P., Fitzpatrick, L. W., Simpson, J. C., and Dawson, K. A. (2012). High-speed imaging of Rab family small GTPases reveals rare events in nanoparticle trafficking in living cells. ACS Nano 6, 1513–1521. doi:10.1021/nn204448x
Schermelleh, L., Ferrand, A., Huser, T., Eggeling, C., Sauer, M., Biehlmaier, O., et al. (2019). Super-resolution microscopy demystified. Nat. Cell Biol. 21, 72–84. doi:10.1038/s41556-018-0251-8
Schübbe, S., Cavelius, C., Schumann, C., Koch, M., and Kraegeloh, A. (2010). STED microscopy to monitor agglomeration of silica particles inside A549 cells. Adv. Eng. Mat. 12, 417–422. doi:10.1002/adem.201000093
Shapiro, H. M. (2003). “Chapter 7. Parameters and probes,” in Practical flow cytometry (Hoboken, New Jersey: John Wiley and Sons, Inc.), 273–410.
Shi, J., Kantoff, P. W., Wooster, R., and Farokhzad, O. C. (2017). Cancer nanomedicine: Progress, challenges and opportunities. Nat. Rev. Cancer 17, 20–37. doi:10.1038/nrc.2016.108
Simpson, J. C., Joggerst, B., Laketa, V., Verissimo, F., Cetin, C., Erfle, H., et al. (2012). Genome-wide RNAi screening identifies human proteins with a regulatory function in the early secretory pathway. Nat. Cell Biol. 14, 764–774. doi:10.1038/ncb2510
Snijder, B., Sacher, R., Ramo, P., Damm, E.-M., Liberali, P., and Pelkmans, L. (2009). Population context determines cell-to-cell variability in endocytosis and virus infection. Nature 461, 520–523. doi:10.1038/nature08282
Sood, A., Salih, S., Roh, D., Lacharme-Lora, L., Parry, M., Hardiman, B., et al. (2011). Signalling of DNA damage and cytokines across cell barriers exposed to nanoparticles depends on barrier thickness. Nat. Nanotechnol. 6, 824–833. doi:10.1038/nnano.2011.188
Stewart, M. P., Sharei, A., Ding, X., Sahay, G., Langer, R., and Jensen, K. F. (2016). In vitro and ex vivo strategies for intracellular delivery. Nature 538, 183–192. doi:10.1038/nature19764
Stirling, D. R., Swain-Bowden, M. J., Lucas, A. M., Carpenter, A. E., Cimini, B. A., and Goodman, A. (2021). CellProfiler 4: Improvements in speed, utility and usability. BMC Bioinforma. 22, 433. doi:10.1186/s12859-021-04344-9
Stringer, C., Wang, T., Michaelos, M., and Pachitariu, M. (2021). Cellpose: A generalist algorithm for cellular segmentation. Nat. Methods 18, 100–106. doi:10.1038/s41592-020-01018-x
Summers, H. D., Rees, P., Holton, M. D., Brown, M. R., Chappell, S. C., Smith, P. J., et al. (2011). Statistical analysis of nanoparticle dosing in a dynamic cellular system. Nat. Nanotechnol. 6, 170–174. doi:10.1038/nnano.2010.277
Valsami-Jones, E., and Lynch, I. (2015). How safe are nanomaterials? Science 350, 388–389. doi:10.1126/science.aad0768
Varela, J. A., Åberg, C., Simpson, J. C., and Dawson, K. A. (2015). Trajectory-based co-localization measures for nanoparticle-cell interaction studies. Small 11, 2026–2031. doi:10.1002/smll.201401849
Varela, J. A., Bexiga, M., Åberg, C., Simpson, J. C., and Dawson, K. A. (2012). Quantifying size-dependent interactions between fluorescently labeled polystyrene nanoparticles and mammalian cells. J. Nanobiotechnology 10, 39. doi:10.1186/1477-3155-10-39
Vtyurina, N., Åberg, C., and Salvati, A. (2021). Imaging of nanoparticle uptake and kinetics of intracellular trafficking in individual cells. Nanoscale 13, 10436–10446. doi:10.1039/D1NR00901J
Wang, Z., Tiruppathi, C., Minshall, R. D., and Malik, A. B. (2009). Size and dynamics of caveolae studied using nanoparticles in living endothelial cells. ACS Nano 3, 4110–4116. doi:10.1021/nn9012274
Wilhelm, C., Gazeau, F., Roger, J., Pons, J. N., and Bacri, J.-C. (2002). Interaction of anionic superparamagnetic nanoparticles with cells: Kinetic analyses of membrane adsorption and subsequent internalization. Langmuir 18, 8148–8155. doi:10.1021/la0257337
Wolfram, J., and Ferrari, M. (2019). Clinical cancer nanomedicine. Nano Today 25, 85–98. doi:10.1016/j.nantod.2019.02.005
Xiong, R., Hua, D., Van Hoeck, J., Berdecka, D., Léger, L., De Munter, S., et al. (2021). Photothermal nanofibres enable safe engineering of therapeutic cells. Nat. Nanotechnol. 16, 1281–1291. doi:10.1038/s41565-021-00976-3
Keywords: nanoparticles, cell uptake, fluorescence microscopy, high-throughput, machine learning, image segmentation, modelling, Cellpose
Citation: Yang B, Richards CJ, Gandek TB, de Boer I, Aguirre-Zuazo I, Niemeijer E and Åberg C (2023) Following nanoparticle uptake by cells using high-throughput microscopy and the deep-learning based cell identification algorithm Cellpose. Front. Nanotechnol. 5:1181362. doi: 10.3389/fnano.2023.1181362
Received: 07 March 2023; Accepted: 26 April 2023;
Published: 18 May 2023.
Edited by:
Giancarlo Franzese, University of Barcelona, SpainReviewed by:
Gionni Marchetti, University of Barcelona, SpainHender Lopez, Technological University Dublin, Ireland
Copyright © 2023 Yang, Richards, Gandek, de Boer, Aguirre-Zuazo, Niemeijer and Åberg. This is an open-access article distributed under the terms of the Creative Commons Attribution License (CC BY). The use, distribution or reproduction in other forums is permitted, provided the original author(s) and the copyright owner(s) are credited and that the original publication in this journal is cited, in accordance with accepted academic practice. No use, distribution or reproduction is permitted which does not comply with these terms.
*Correspondence: Christoffer Åberg, Y2hyaXN0b2ZmZXIuYWJlcmdAcnVnLm5s