 Guodong Song1,2
 Chunmei Li1
 Xiaojie Luo1
 Xuna Zhao3Shuai Zhang1,2
 Yi Zhang3Shanshan Jiang3Xianlong Wang4Yuhui Chen5Haibo Chen5Tao Gong5
 Jinyuan Zhou3Min Chen1,2*
- 1Department of Radiology, Beijing Hospital, National Center of Gerontology, Beijing, China
- 2Graduate School of Peking Union Medical College, Beijing, China
- 3Department of Radiology, Johns Hopkins University, Baltimore, MD, USA
- 4Department of Radiology, Zhujiang Hospital of Southern Medical University, Guangzhou, China
- 5Department of Neurology, Beijing Hospital, National Center of Gerontology, Beijing, China
Amide proton transfer-weighted (APTW) magnetic resonance imaging (MRI) has recently become a potentially important tool for evaluating acidosis in ischemic stroke. The purpose of this study was to evaluate the dynamic pH-related changes in the lesions in patients with ischemia. Thirty-nine patients with ischemic stroke (symptom onset to imaging time ranging 2 h–7 days) were examined with a 3.0-T MRI system. Patients were divided into four groups: at the hyperacute stage (onset time ≤ 6 h), at the acute stage (6 h < onset time ≤ 48 h), at the early subacute stage (48 h < onset time ≤ 96 h), and at the late subacute stage (96 h < onset time ≤ 168 h). The APTW signal intensities were quantitatively measured in multiple ischemic regions for each patient. Compared with the contralateral normal white matter, APTW signals were significantly lower in ischemic tissue for all four stages (P < 0.05). The APTW signal intensities (APTWave and APTWmin) increased consistently with onset time (R2 = 0.11, P = 0.040; R2 = 0.13, P = 0.022, respectively). APTWmax–min showed a continued reduction with onset time (R2 = 0.44, P < 0.001). Our results suggest that persistent tissue acidification could occur after ischemia, and as the time from stroke onset increases, the acidotic environment would alleviate. APTW signal intensities could reflect pH-weighted properties in ischemic tissue at different stages and time points.
Introduction
In the ischemic brain, tissue dysfunction develops from a complex cascade of pathophysiological events that progress temporally and spatially (1, 2). After the critical reduction of cerebral blood flow, normal cerebral oxygen and glucose metabolism are destroyed, and accumulated lactate concentrations due to anaerobic glycolysis often incur intracellular acidosis (3). The maintenance of appropriate intracellular pH in the brain is of paramount importance to its normal physiological activities, for pH regulates various cellular activities and processes (4, 5). As glial acidification is the key trigger of excess glutamate liberation, the glutamate-mediated excitotoxicity can directly induce neuronal cell death (6). Without timely restoration of blood flow, tissue acidification can lead to irreversible tissue damage (7). Intracellular pH of brain tissue varies over ischemic time and cerebral energy status after stroke (8). Thus, tissue pH may serve as a potential surrogate biomarker to reflect the metabolic state and disease evolution during ischemia (9).
Although the use of multimodal magnetic resonance imaging (MRI) protocols in the detection and evaluation of ischemic stroke is increasing (10–12), routine MRI techniques such as perfusion-weighted imaging (PWI) and diffusion-weighted imaging (DWI) are insufficient to depict tissue pH changes, except the magnetic resonance spectroscopy (MRS) method. MRS can detect the changes of cerebral metabolites and measure tissue pH non-invasively, and previous MRS studies have found that early acidosis and subacute alkalosis occurred during ischemic stroke (13, 14). Nevertheless, there still remain challenges for the MRS approach due to low spatial and temporal resolution which limit its clinical application in brain ischemia (15). Thus, novel pH-weighted imaging methods are desired to evaluate the change of intracerebral pH after stroke.
As a variant of the chemical exchange saturation transfer (CEST) MR imaging method (16), amide proton transfer-weighted (APTW) MRI is a novel protein and peptide-based imaging technique (17). By detecting endogenous concentrations of exchangeable amide protons in vivo, APTW MRI has been employed to evaluate the changes of mobile abnormal proteins and peptides in tumors (18, 19) and other diseases (20). Besides, it has shown considerable promise in detecting the change in pH non-invasively without any exogenous contrast agents. APTW MRI can assess the severity of tissue acidification and depict the ischemic penumbra by complementing with traditional MRI methods in hyperacute and acute stroke (9, 21–25). To our knowledge, APT-related studies have paid little attention to evaluating dynamic changes of pH in cerebral infarction (26), especially in patients. The clarification of detailed environmental evolutions of the ischemic tissue by APTW MRI would promote our understanding of stroke pathophysiology and may benefit future APT studies in stroke. In this study, changes of tissue pH environment in ischemic stroke are explored using the APTW MRI technique. We will systematically describe APTW MRI signal characteristics in stroke at different phases and investigate their dynamic changes with time, which may facilitate understanding the evolution of ischemic tissue.
Patients and Methods
Patients
The study was approved by the local institutional review board. Written informed consent was obtained from all patients participating in this study. Ischemic stroke patients were prospectively and consecutively enrolled during March 2014 to April 2016. The diagnosis of ischemic stroke was based on clinical findings and computed tomography or MRI scans (27). Exclusion criteria included patient’s age <18 years, receiving intravenous t-PA therapy and endovascular thrombectomy before APTW MRI, other brain disorders, unclear symptom onset time, insufficient image quality, small lesions (less than 10 mm in diameter on the transverse DWI), and contraindications to MRI.
Patient Groups
The time intervals to describe different phases of stroke have not reached general agreement among various researchers (28–30). In our study, 39 patients enrolled were divided into four groups based on the symptom onset to imaging time (28): 4 patients at the hyperacute stage (onset time ≤ 6 h), 18 patients at the acute stage (6 h < onset time ≤ 48 h), 10 patients at the early subacute stage (48 h < onset time ≤ 96 h), and 7 patients at the late subacute stage (96 h < onset time ≤ 168 h).
MRI Imaging Techniques
Magnetic resonance imaging images were acquired on a 3.0-T MRI system (Achieva, Philips Medical Systems, Best, the Netherlands) with an 8-channel receive-only head coil. Several routine MR images, including axial Diffusion-weighted (DW), T2-weighted, and T1-weighted were collected to confirm the locations of the ischemic stroke lesions and exclude any other structural abnormalities.
Amide proton transfer-weighted MRI was acquired with a fat-suppressed, single-shot, turbo-spin-echo sequence, and the parameters were as follows: repetition time = 3,000 ms, turbo-spin-echo factor factor = 54, acquisition matrix size = 104 × 101, reconstruction matrix size = 400 × 400, field of view = 230 mm × 221 mm, and slice thickness = 6 mm. A multi-offset, multi-acquisition APTW protocol (31, 32) was used, and 31 offsets spanned +6 to −6 ppm [31 offsets = 0, ±0.25, ±0.5, ±0.75, ±1, ±1.5, ±2, ±2.5, ±3.0 (2), ±3.25 (4), ±3.5 (8), ±3.75 (4), ±4 (2), ±4.5, ±5.0, ±6.0 ppm; the values in parentheses were the number of acquisitions, which was 1 if not specified]. An unsaturated image was also acquired for signal normalization. One transverse slice was acquired with the largest ischemic lesions, matching the DWI location. Besides, to evaluate the conventional magnetization transfer effect, a saturated image at 15.6 ppm was also acquired. The total duration of the APTW MRI sequence was 3 min 12 s.
Data Processing and Analysis
We used the Interactive Data Language (Exelis Visual Information Solutions, Boulder, CO, USA) to process the APTW MRI data. The pH-sensitive CEST effect was detected by analyzing the z-spectrum on a pixel-by-pixel basis (17). In the z-spectrum, the amide proton frequency was conventionally referenced with respect to the water signal (assigned to be 0 ppm). Magnetization transfer ratio was defined as MTR = 1 − Ssat/S0 (in which Ssat and S0 were the signal intensities with and without selective RF irradiation), and MTR asymmetry (MTRasym) analysis was performed with respect to the water signal. Thus, the APTW signal was calculated based on the MTRasym at 3.5 ppm, i.e., MTRasym(3.5 ppm) = Ssat(−3.5 ppm)/S0 − Ssat(+3.5 ppm)/S0. Of course, MTRasym(3.5 ppm) contains not only the mobile amide proton transfer ratio (APTR), which is related to pH and other changes in tissue, but also the complicating , resulting in . can be attributed to the upfield nuclear Overhauser enhancement (NOE) effect of various non-exchangeable protons (33, 34). Thus, MTRasym(3.5 ppm) images are generally called APTW images.
The quantitative MRI analysis was performed in five small regions of interest (ROIs) within the ischemic lesions defined by DWI for each patient (Figure 1). One ROI in the contralateral normal white matter (CNWM) was also chosen for comparison. The maximum APTW (APTWmax) signal intensity, the minimum APTW (APTWmin) signal intensity, and the difference between APTWmax and APTWmin (APTWmax–min), which reflects APTW signal heterogeneity, the average APTW (APTWave), and MTR(15.6 ppm) signal intensity (corresponding to the APTWmin), were reported. In the contralateral normal tissue, APTW (APTW@CNWM) and MTR(15.6 ppm) signal intensities were also calculated.
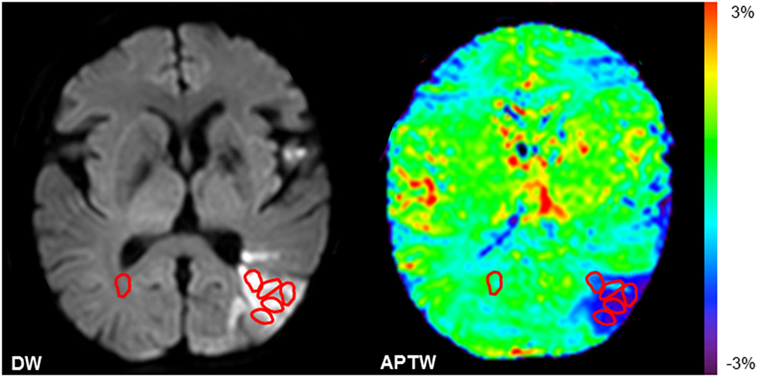
Figure 1. Examples of the definition of the regions of interest (ROIs). Five ROIs in the ischemic tissue and one ROI in the contralateral normal white matter were chosen.
Statistical Analysis
All statistical analyses were performed using the SPSS 17.0 software package. APTW and MTR signal intensities in the ischemic tissue and the contralateral normal tissue were obtained for each patient. The results were presented as the format of mean ± SE. The difference of sex among the four groups was compared using Chi-squared test. Time-related changes of APTW signals were assessed by regression analysis, and goodness-of-fit was determined by calculation of an R2 value. One-way analysis of variance with post hoc tests was performed for comparing multiple values of parameters at different stages. Tukey’s post hoc tests were used if the P value resulted from tests for homogeneity of variance was greater than or equal to 0.05. Otherwise, Games-Howell post hoc tests would be employed if P < 0.05. The comparisons of MTR parameters between the ischemic tissue and CNWM were analyzed by Student’s t-test. P values <0.05 were considered statistically significant.
Results
Baseline Data
A total of 62 patients were recruited and 39 patients remained in our study. Twenty-three patients were ineligible because of small ischemic lesions on the routine DW images (n = 10), accompaniment with brain tumors (n = 2), an unclear onset time (n = 4), obvious motion artifacts (n = 5), and the intravenous t-PA treatment before APTW MRI (n = 2). Of the 39 included patients, baseline data are shown in Table 1. These data show no significant sex or age-related differences, while there were obviously significant differences of the mean onset to scan time among four stages.
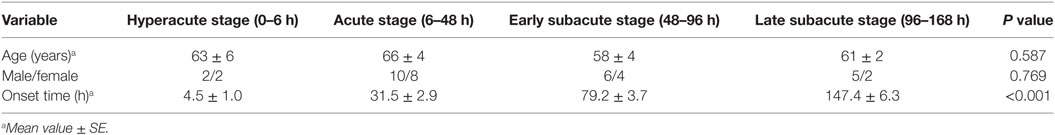
Table 1. Baseline demographic data for patients with different stages.
MTRasym Spectrum and APTW Image Features
Figure 2 shows the average MTRasym spectra corresponding to APTWmin values of the four stages. For all patients enrolled, the CEST effect in the ischemic tissue showed a visible reduction at the offset range of 2–5 ppm in the MTRasym spectra compared with the CNWM. All MTRasym spectra became negative at offsets greater than 3 ppm (in the ischemic areas) or >3.5 ppm (in the CNWM), as reported previously (35, 36). The maximal CEST effect reduction appeared at the offset of 3.5 ppm, where amide resonances of the backbones of soluble proteins and peptides were present, and the process has been proved to be sensitive to the change of pH (17). Among different stages, MTRasym(3.5 ppm) signal intensities, which were the apparent APTW signals, showed larger reduction during the hyperacute stage than the other stages. A trend toward higher values of MTRasym(3.5 ppm) signal intensities in the ischemic tissue could be observed among the four stages after stroke (Figure 2E). On the contrary, MTRasym(3.5 ppm) values in the CNWM stayed stable (Figure 2F).
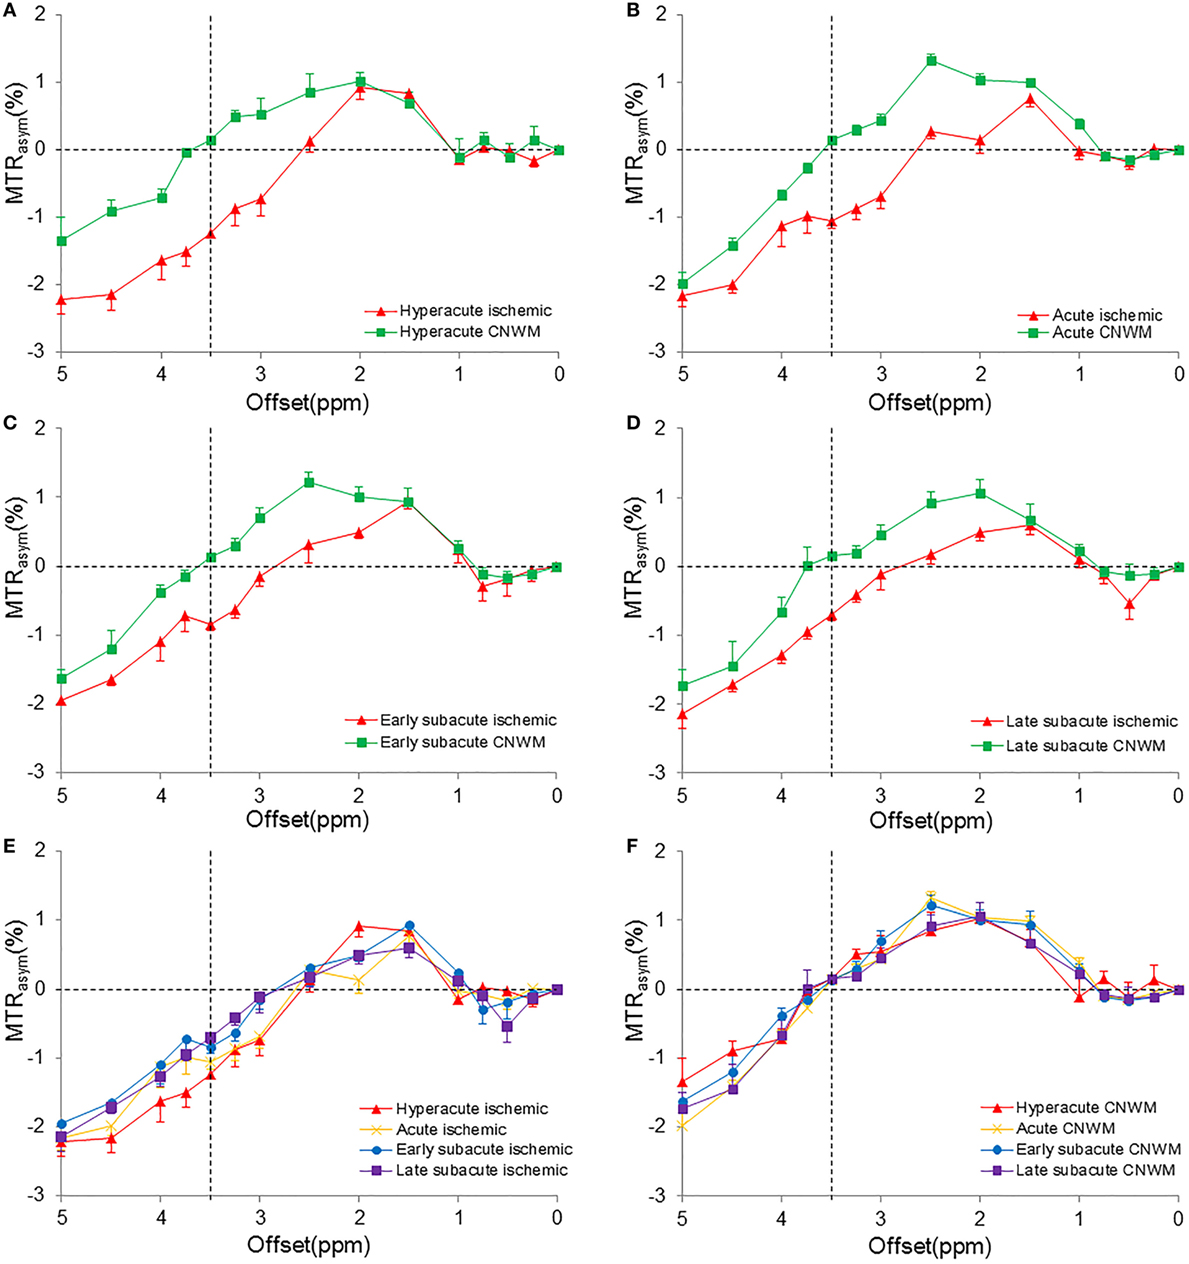
Figure 2. Measured MTRasym spectra in the ischemic tissue and the contralateral normal white matter (CNWM) of different stages (corresponding to the APTWmin value). (A) Hyperacute stage. (B) Acute stage. (C) Early subacute stage. (D) Late subacute stage. (E) The combination of MTRasym spectra in the ischemic tissue of different stages. (F) The combination of MTRasym spectra in the CNWM of different stages. The chemical exchange saturation transfer effect reduced in the offset range of 2–5 ppm in all stages. MTRasym(3.5 ppm) showed the largest reduction in the hyperacute stage (A). An increase was shown in the MTRasym(3.5 ppm) in the ischemic tissue (E).
Figure 3 shows the APTW and standard MR images of patients at four different stages. From the images, we can see that APTW signal intensities in the ischemic tissue were visibly lower than the CNWM at the hyperacute stage, the acute stage, and the early subacute stage. However, APTW images acquired from patients at the late subacute stage showed that the reduction of APTW values in the ischemic tissue was not obvious compared with those in CNWM (APTW@CNWM), which suggested pH restoration might occur.
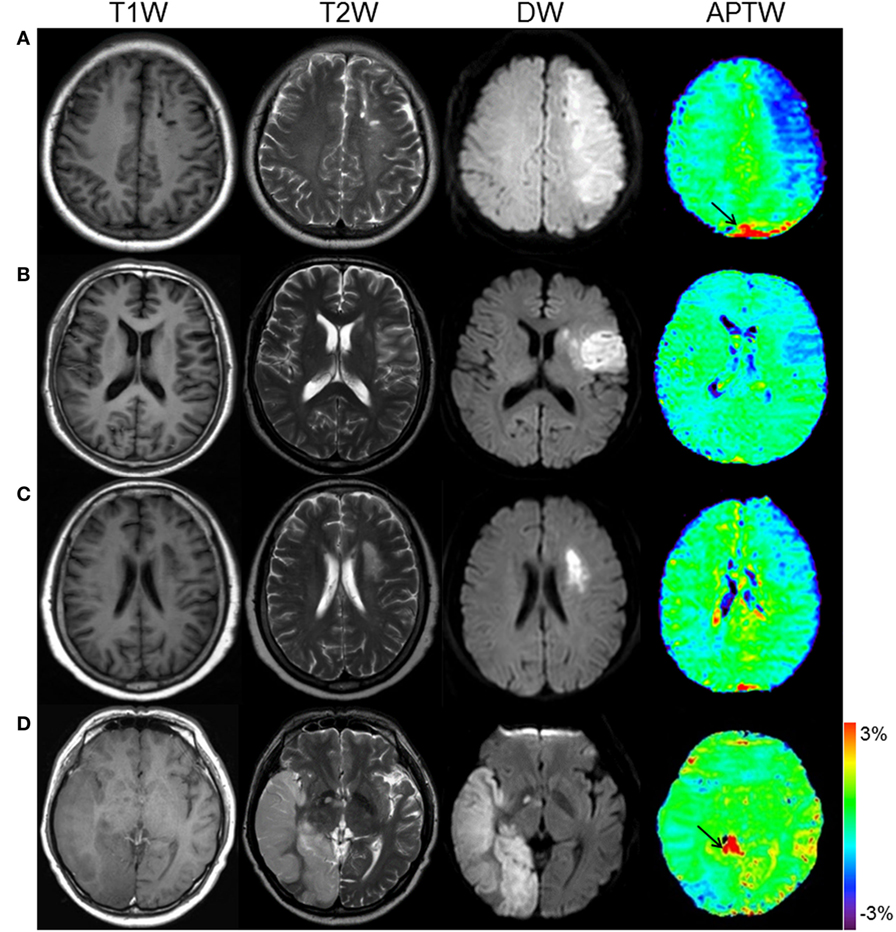
Figure 3. APT and conventional MR images for different stage patients. (A) F/50 years, a hyperacute stage patient at 2 h after symptom onset. APTWave = −0.83%, APTWmax–min = 1.30%. (B) M/54 years, an acute stage patient at 17 h after symptom onset. APTWave = −0.63%, APTWmax–min = 0.99%. (C) F/62 years, an early subacute stage patient at 72 h after symptom onset. APTWave = −0.40%, APTWmax–min = 0.72%. (D) M/54 years, a late subacute stage patient at 120 h after symptom onset. APTWave = 0.03%, APTWmax–min = 0.53%. Note the presence of CSF artifacts (black thin arrows).
Quantitative Analyses of APTW and MTR Signal Intensities
Tables 2 and 3 quantitatively compare several APTW and MTR parameters at different stages post-stroke. APTWave, APTWmin, and APTWmax values were significantly lower in the ischemic tissue than APTW@CNWM (P < 0.05 in all four stages), which suggested a reduction of APT effect compared with the CNWM occurred after ischemia. APTWave and APTWmax values showed no significant differences among different stages, which suggested that persistent acidification might exist in the four different stages. In addition, APTWmin values in the hyperacute stage were significantly lower than the early and late subacute stage (P = 0.006, and P = 0.003, respectively), suggesting tissue acidification in the ischemic tissue might be more severe in the hyperacute stage.
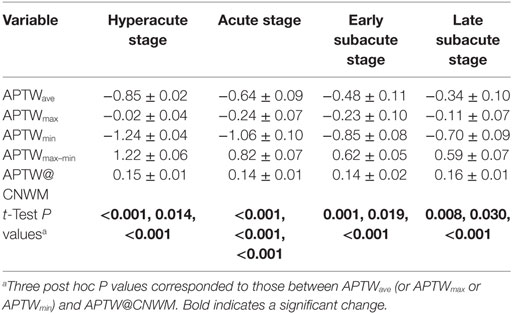
Table 2. Amide proton transfer-weighted (APTW) intensity values among four stages (%; mean value ± SE).
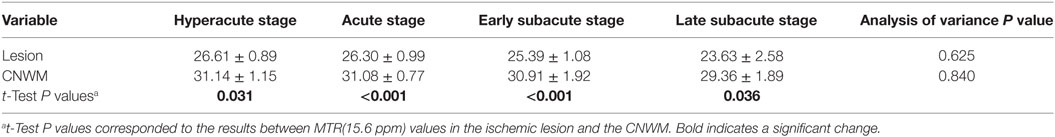
Table 3. MTR(15.6 ppm) intensity values in the ischemic lesion and the contralateral normal white matter (CNWM) among four stages (%; mean value ± SE).
APTWmax–min was significantly higher in patients at the hyperacute stage after stroke than in patients at the other three stage (P = 0.006, P = 0.001, and P = 0.001, respectively), suggesting that the most heterogeneous APTW signal variety existed at the hyperacute stage of stroke. In contrast, APTW@CNWM values among groups showed no significant difference.
Paired Student’s t-test results showed that the MTR(15.6 ppm) value in the ischemic tissue was significantly lower compared with that in CNWM at the four stages (P = 0.031, P < 0.001, P < 0.001, and P = 0.036, respectively), indicating that the conventional MT effect may be reduced after ischemia. In addition, multiple comparisons of MTR(15.6 ppm) values in the ischemic tissue among groups showed no significant differences, and similar results were found for MTR(15.6 ppm) values in the CNWM.
Regression Analysis of APTW Signal Intensities with Time
Figure 4 shows the results of regression analysis of APTW signals against the onset time. There were significantly increasing logarithmic time-related changes of the APTWave and APTWmin values (R2 = 0.11, P = 0.040; R2 = 0.13, P = 0.022, respectively), which indicated that tissue acidification alleviated with time, but the goodness-of-fit was relatively poor. In addition, APTWmax–min values followed a decreasing logarithmic curve with the onset time (R2 = 0.44, P < 0.001), indicating that the APTW signal heterogeneity in the ischemic tissue reduced with time, and the most significant changes seemingly occurred within the first few hours. In contrast, no significant time-related change was observed for APTWmax and APTW@CNWM values.
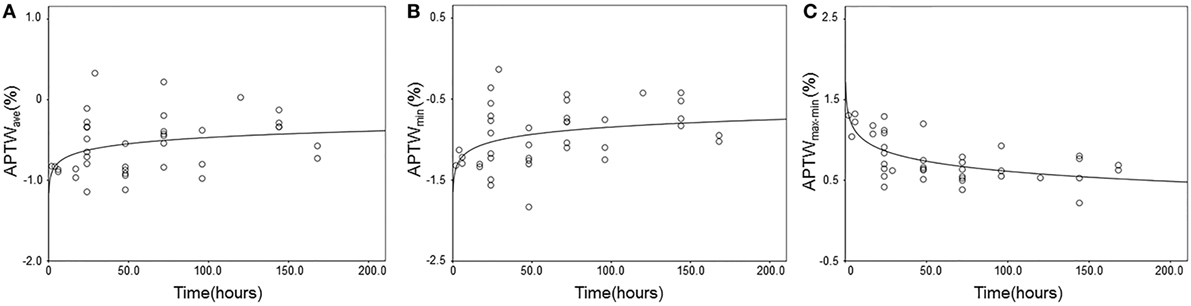
Figure 4. Experimental and fitted time-related changes of different amide proton transfer-weighted (APTW) values in the ischemic tissue. (A) APTWave values (R2 = 0.11, P = 0.040); (B) APTWmin values (R2 = 0.13, P = 0.022); (C) APTWmax–min values (R2 = 0.44, P < 0.001).
Discussion
In this study, we used the APTW MRI technique to investigate the dynamic change of pH in ischemic tissue in patients at the early stage after stroke (the onset to scan time varied from 2 h to 7 days), which has not been the focus clinically before. We found that tissue acidification in the ischemic zone would occur after stroke compared with the contralateral normal tissue, and the acidification would alleviate with the onset time increased. The APTW intensity showed higher heterogeneity at the hyperacute and acute stage after stroke, which suggested that pH variety existed during this time period. This was consistent with the finding of graded ischemic acidosis in previous studies (24, 25). The APTW intensity became more homogeneous as the onset to scan time increased. As APTW signals might be affected by potential confounding influences of treatment effects, we acquired APTW images in patients without receiving interventions of intravenous t-PA therapy and endovascular treatment, which would help us to describe the dynamic change of APT effect in the progress of stroke without treatment interventions.
We studied several APT parameters (APTWave, APTWmax, APTWmin, APTWmax–min, and the CNWM APTW signal intensities) in patients at different stages after stroke and evaluated time-related changes of the APTW effect by regression analysis. The results showed that APTWave and APTWmin signal intensities acquired in the infarction lesions were reduced significantly in the ischemic tissue compared with those in the CNWM at the hyperacute and acute stages, suggesting that tissue acidosis occurred after stroke onset, which had been confirmed by previous studies during the initial ischemic period of stroke (17, 37). The reduction of intracellular pH is mainly due to the accumulation of lactic acid in anaerobic glycolysis, and the correlation of APT effect with intracellular pH has been proved (22, 26). In addition, APTWave and APTWmin values were also lower compared with those in the CNWM at the subacute stage, which may suggest that APTW effect could still be reduced during this time period, and the results are consistent with Zhao’s study (38). In their study, they just found hypointense APTW signals in a small number of stroke patients. As tissue acidification is one of the important pathophysiology factors affecting APTW signals (26), the reduction of APTWave and APTWmin signals during this stage may be partially due to tissue acidification. The results suggested that persistent tissue acidification might occur after stroke.
Moreover, we found that APTWave and APTWmin values were lower at the hyperacute stage, and higher at the subacute stage than the other stages, and the regression analysis demonstrated that APTWave and APTWmin signals intensities increased with the onset to scan time. The increase of APTWave and APTWmin suggested that acidosis of the infarction tissue may be reduced and alleviated with the onset to scan time, and this is consistent with several previous studies (13, 14), which have showed that the reduced pH of ischemic brain would increase after stroke in the follow-up of several patients by the MRS method. Similar results have been detected in animal models by the APTW MRI method (26). The increase of pH after stroke could be explained by active compensatory mechanisms within the ischemic tissue according to prior results (14). In addition, a shift from acute acidosis to subacute alkalosis was detected in several works (13, 14, 39, 40), and alkalotic pH occurred in the first few days after ischemia could be influenced by the duration and degree of ischemia acidosis (41). We did not consistently observe the shift in our current data; the deviation of the pH changes might be contributed to the confounding factors that may influence the APT imaging results in ischemic tissue, such as the tissue temperature (26) and protein concentration (17).
Previous studies have shown that the infarct core suffered severe acidosis, and the peri-infarct tissue suffered from moderate acidification (25, 42). The heterogeneity of the APTW signal (APTWmax–min) may reveal the diversity of pH values in the ischemic tissue. From the fitted curve, it showed that APTWmax–min decreased significantly with the onset to scan time of stroke symptoms. The dynamic change of APTWmax–min suggests that the ischemic tissue seems to become more homogeneous with the increase of onset to scan time. The seemingly significant changes occurred during the first few hours after stroke, which corresponded to the hyperacute stage, and patients at this stage had significantly higher APTWmax–min values than other stages. This period is consistent with the therapeutic time window for stroke. APTWmax–min may serve as a useful biomarker to reflect tissue microenvironment at different time points after ischemia and allow further options of stroke interventions.
In addition, APTW signals of the CNWM were stable in the four stages, which suggested relatively unremarkable interindividual variability of the APTW@CNWM values among different individuals. The magnetization transfer effect in the ischemic tissue reduced comparing with the CNWM, which may contribute to the cerebral edema and partial neuronal death after ischemia. Consistent with previous studies, our results for the magnetization transfer effect remained stable in the first several days after stroke (43, 44). The inconsistency between APTW and MTR values in the ischemic tissue suggests APT effect may change gradually without the influence of underlying MT effects at the early stage after stroke.
Our research shows some preliminary results of pH-weighted APT effect in ischemia, which may be helpful for further APTW MRI studies in stroke. Here, we mainly focus on patients without the consideration of therapeutic interventions, and further studies are needed to clarify the detailed APT effect changes after receiving treatment. Furthermore, due to a very limited number of patients receiving PWI in our study, we did not take PWI into consideration, which limited the full evaluation of penumbra. The number of subjects in our study was relatively small especially at the hyperacute phase, and patients just received one scan without longitudinal follow-up APTW MRI data. Thus, a large-scale longitudinal study including more patients and scan time points would be required to validate our results. In addition, we used single slice image acquisition, and APTW signals in other ischemic lesions could not be evaluated. Therefore, the three-dimensional APT imaging method, which has been developed in gliomas (45), should be optimized and validated in future stroke studies.
Finally, the standard APTW metric, MTRasym(3.5 ppm), was used in this study. As reported previously (35, 36), all MTRasym spectra were negative at the higher offsets (>3 ppm for the ischemic areas or >3.5 ppm for the CNWM) due to the possible inherent asymmetry of the conventional MT effect and the possible NOEs of aliphatic protons of mobile macromolecules (33, 34). It has been demonstrated recently that MTRasym(3.5 ppm) remains a valid metric for APT imaging at 3 T (46, 47). However, it is essentially important to obtain relatively pure APT and NOE signals and to assess whether both are pH dependent (48–50). In this regard, a novel APT imaging analysis approach (46, 47), such as the extrapolated semisolid magnetization transfer reference, may be used.
In conclusion, our study shows that tissue acidification after stroke may alleviate as the onset to scan time increases. APTW signal intensities could reflect pH-weighted properties in ischemic tissue at different stages and time points. APTW MRI provides an alternative method to depict pH changes in ischemia, and APTW signals could potentially serve as a surrogate pH-weighted imaging marker in non-invasive and dynamic evaluation of tissue evolution in patients at the early stage after stroke.
Ethics Statement
This study was carried out in accordance with the recommendations of the human ethics committee of the Beijing Hospital with written informed consent from all subjects. All subjects gave written informed consent in accordance with the Declaration of Helsinki. The protocol was approved by the human ethics committee of the Beijing Hospital.
Author Contributions
JZ and MC conceived and designed the research. GS, CL, XL, XZ, SZ, YZ, SJ, XW, YC, HC, and TG performed the research. All the authors analyzed the data. GS, JZ, and MC wrote the paper. CL, JZ, and MC obtained funding. All the authors read and approved the final draft.
Conflict of Interest Statement
The authors declare that the research was conducted in the absence of any commercial or financial relationships that could be construed as a potential conflict of interest.
The reviewer PR and handling editor declared their shared affiliation and the handling editor states that the process nevertheless met the standards of a fair and objective review.
Funding
This work was supported in part by grants from the National Natural Science Foundation of China (81361120392 and 81401404), Beijing Natural Science Foundation (7154235 and 7162171), and the National Institutes of Health (R01NS083435, R01EB009731, and R01CA166171).
References
1. Dirnagl U, Iadecola C, Moskowitz MA. Pathobiology of ischaemic stroke: an integrated view. Trends Neurosci (1999) 22(9):391–7. doi:10.1016/S0166-2236(99)01401-0
2. Xing C, Arai K, Lo EH, Hommel M. Pathophysiologic cascades in ischemic stroke. Int J Stroke (2012) 7(5):378–85. doi:10.1111/j.1747-4949.2012.00839.x
3. Siesjo BK. Pathophysiology and treatment of focal cerebral ischemia. Part I: pathophysiology. J Neurosurg (1992) 77(2):169–84. doi:10.3171/jns.1992.77.2.0169
4. Busa WB, Nuccitelli R. Metabolic regulation via intracellular pH. Am J Physiol (1984) 246(4 Pt 2):R409–38.
5. Casey JR, Grinstein S, Orlowski J. Sensors and regulators of intracellular pH. Nat Rev Mol Cell Biol (2010) 11(1):50–61. doi:10.1038/nrm2820
6. Beppu K, Sasaki T, Tanaka KF, Yamanaka A, Fukazawa Y, Shigemoto R, et al. Optogenetic countering of glial acidosis suppresses glial glutamate release and ischemic brain damage. Neuron (2014) 81(2):314–20. doi:10.1016/j.neuron.2013.11.011
7. Kalimo H, Rehncrona S, Soderfeldt B, Olsson Y, Siesjo BK. Brain lactic acidosis and ischemic cell damage: 2. Histopathology. J Cereb Blood Flow Metab (1981) 1(3):313–27. doi:10.1038/jcbfm.1981.34
8. Orlowski P, Chappell M, Park CS, Grau V, Payne S. Modelling of pH dynamics in brain cells after stroke. Interface Focus (2011) 1(3):408–16. doi:10.1098/rsfs.2010.0025
9. Zhou J, van Zijl PC. Defining an acidosis-based ischemic penumbra from pH-weighted MRI. Transl Stroke Res (2011) 3(1):76–83. doi:10.1007/s12975-011-0110-4
10. Albers GW, Thijs VN, Wechsler L, Kemp S, Schlaug G, Skalabrin E, et al. Magnetic resonance imaging profiles predict clinical response to early reperfusion: the diffusion and perfusion imaging evaluation for understanding stroke evolution (DEFUSE) study. Ann Neurol (2006) 60(5):508–17. doi:10.1002/ana.20976
11. Macintosh BJ, Graham SJ. Magnetic resonance imaging to visualize stroke and characterize stroke recovery: a review. Front Neurol (2013) 4:60. doi:10.3389/fneur.2013.00060
12. Nael K, Khan R, Choudhary G, Meshksar A, Villablanca P, Tay J, et al. Six-minute magnetic resonance imaging protocol for evaluation of acute ischemic stroke: pushing the boundaries. Stroke (2014) 45(7):1985–91. doi:10.1161/STROKEAHA.114.005305
13. Levine SR, Helpern JA, Welch KM, Vande Linde AM, Sawaya KL, Brown EE, et al. Human focal cerebral ischemia: evaluation of brain pH and energy metabolism with P-31 NMR spectroscopy. Radiology (1992) 185(2):537–44. doi:10.1148/radiology.185.2.1410369
14. Zollner JP, Hattingen E, Singer OC, Pilatus U. Changes of pH and energy state in subacute human ischemia assessed by multinuclear magnetic resonance spectroscopy. Stroke (2015) 46(2):441–6. doi:10.1161/STROKEAHA.114.007896
15. Hohn-Berlage M, Okada Y, Kloiber O, Hossmann KA. Imaging of brain tissue pH and metabolites. A new approach for the validation of volume-selective NMR spectroscopy. NMR Biomed (1989) 2(5–6):240–5. doi:10.1002/nbm.1940020512
16. Ward KM, Aletras AH, Balaban RS. A new class of contrast agents for MRI based on proton chemical exchange dependent saturation transfer (CEST). J Magn Reson (2000) 143(1):79–87. doi:10.1006/jmre.1999.1956
17. Zhou J, Payen JF, Wilson DA, Traystman RJ, van Zijl PC. Using the amide proton signals of intracellular proteins and peptides to detect pH effects in MRI. Nat Med (2003) 9(8):1085–90. doi:10.1038/nm907
18. Yan K, Fu Z, Yang C, Zhang K, Jiang S, Lee DH, et al. Assessing amide proton transfer (APT) MRI contrast origins in 9 L gliosarcoma in the rat brain using proteomic analysis. Mol Imaging Biol (2015) 17(4):479–87. doi:10.1007/s11307-015-0828-6
19. Jiang S, Yu H, Wang X, Lu S, Li Y, Feng L, et al. Molecular MRI differentiation between primary central nervous system lymphomas and high-grade gliomas using endogenous protein-based amide proton transfer MR imaging at 3 tesla. Eur Radiol (2016) 26(1):64–71. doi:10.1007/s00330-015-3805-1
20. Li C, Wang R, Chen H, Su W, Li S, Zhao X, et al. Chemical exchange saturation transfer MR imaging is superior to diffusion-tensor imaging in the diagnosis and severity evaluation of Parkinson’s disease: a study on substantia nigra and striatum. Front Aging Neurosci (2015) 7:198. doi:10.3389/fnagi.2015.00198
21. Sun PZ, Zhou J, Sun W, Huang J, van Zijl PC. Detection of the ischemic penumbra using pH-weighted MRI. J Cereb Blood Flow Metab (2007) 27(6):1129–36. doi:10.1038/sj.jcbfm.9600424
22. Sun PZ, Cheung JS, Wang E, Lo EH. Association between pH-weighted endogenous amide proton chemical exchange saturation transfer MRI and tissue lactic acidosis during acute ischemic stroke. J Cereb Blood Flow Metab (2011) 31(8):1743–50. doi:10.1038/jcbfm.2011.23
23. Tietze A, Blicher J, Mikkelsen IK, Ostergaard L, Strother MK, Smith SA, et al. Assessment of ischemic penumbra in patients with hyperacute stroke using amide proton transfer (APT) chemical exchange saturation transfer (CEST) MRI. NMR Biomed (2014) 27(2):163–74. doi:10.1002/nbm.3048
24. Harston GW, Tee YK, Blockley N, Okell TW, Thandeswaran S, Shaya G, et al. Identifying the ischaemic penumbra using pH-weighted magnetic resonance imaging. Brain (2015) 138(Pt 1):36–42. doi:10.1093/brain/awu374
25. Guo Y, Zhou IY, Chan ST, Wang Y, Mandeville ET, Igarashi T, et al. pH-sensitive MRI demarcates graded tissue acidification during acute stroke – pH specificity enhancement with magnetization transfer and relaxation-normalized amide proton transfer (APT) MRI. Neuroimage (2016) 141:242–9. doi:10.1016/j.neuroimage.2016.07.025
26. Jokivarsi KT, Grohn HI, Grohn OH, Kauppinen RA. Proton transfer ratio, lactate, and intracellular pH in acute cerebral ischemia. Magn Reson Med (2007) 57(4):647–53. doi:10.1002/mrm.21181
27. Sacco RL, Kasner SE, Broderick JP, Caplan LR, Connors JJ, Culebras A, et al. An updated definition of stroke for the 21st century: a statement for healthcare professionals from the American Heart Association/American Stroke Association. Stroke (2013) 44(7):2064–89. doi:10.1161/STR.0b013e318296aeca
28. Baird AE, Warach S. Magnetic resonance imaging of acute stroke. J Cereb Blood Flow Metab (1998) 18(6):583–609. doi:10.1097/00004647-199806000-00001
29. Huang IJ, Chen CY, Chung HW, Chang DC, Lee CC, Chin SC, et al. Time course of cerebral infarction in the middle cerebral arterial territory: deep watershed versus territorial subtypes on diffusion-weighted MR images. Radiology (2001) 221(1):35–42. doi:10.1148/radiol.2211001412
30. Allen LM, Hasso AN, Handwerker J, Farid H. Sequence-specific MR imaging findings that are useful in dating ischemic stroke. Radiographics (2012) 32(5):1285–97. doi:10.1148/rg.325115760
31. Wen Z, Hu S, Huang F, Wang X, Guo L, Quan X, et al. MR imaging of high-grade brain tumors using endogenous protein and peptide-based contrast. Neuroimage (2010) 51(2):616–22. doi:10.1016/j.neuroimage.2010.02.050
32. Li C, Peng S, Wang R, Chen H, Su W, Zhao X, et al. Chemical exchange saturation transfer MR imaging of Parkinson’s disease at 3 Tesla. Eur Radiol (2014) 24(10):2631–9. doi:10.1007/s00330-014-3241-7
33. Hua J, Jones CK, Blakeley J, Smith SA, van Zijl PC, Zhou J. Quantitative description of the asymmetry in magnetization transfer effects around the water resonance in the human brain. Magn Reson Med (2007) 58(4):786–93. doi:10.1002/mrm.21387
34. Ling W, Regatte RR, Navon G, Jerschow A. Assessment of glycosaminoglycan concentration in vivo by chemical exchange-dependent saturation transfer (gagCEST). Proc Natl Acad Sci U S A (2008) 105(7):2266–70. doi:10.1073/pnas.0707666105
35. Zhou J, Blakeley JO, Hua J, Kim M, Laterra J, Pomper MG, et al. Practical data acquisition method for human brain tumor amide proton transfer (APT) imaging. Magn Reson Med (2008) 60(4):842–9. doi:10.1002/mrm.21712
36. Zhou J, Hong X, Zhao X, Gao JH, Yuan J. APT-weighted and NOE-weighted image contrasts in glioma with different RF saturation powers based on magnetization transfer ratio asymmetry analyses. Magn Reson Med (2013) 70(2):320–7. doi:10.1002/mrm.24784
37. Zong X, Wang P, Kim SG, Jin T. Sensitivity and source of amine-proton exchange and amide-proton transfer magnetic resonance imaging in cerebral ischemia. Magn Reson Med (2014) 71(1):118–32. doi:10.1002/mrm.24639
38. Zhao X, Wen Z, Huang F, Lu S, Wang X, Hu S, et al. Saturation power dependence of amide proton transfer image contrasts in human brain tumors and strokes at 3 T. Magn Reson Med (2011) 66(4):1033–41. doi:10.1002/mrm.22891
39. Nakada T, Houkin K, Hida K, Kwee IL. Rebound alkalosis and persistent lactate: multinuclear (1H, 13C, 31P) NMR spectroscopic studies in rats. Magn Reson Med (1991) 18(1):9–14. doi:10.1002/mrm.1910180103
40. Hugg JW, Duijn JH, Matson GB, Maudsley AA, Tsuruda JS, Gelinas DF, et al. Elevated lactate and alkalosis in chronic human brain infarction observed by 1H and 31P MR spectroscopic imaging. J Cereb Blood Flow Metab (1992) 12(5):734–44. doi:10.1038/jcbfm.1992.104
41. Chopp M, Chen H, Vandelinde AMQ, Brown E, Welch KMA. Time course of postischemic intracellular alkalosis reflects the duration of ischemia. J Cereb Blood Flow Metab (1990) 10(6):860–5. doi:10.1038/jcbfm.1990.142
42. Back T, Hoehn M, Mies G, Busch E, Schmitz B, Kohno K, et al. Penumbral tissue alkalosis in focal cerebral ischemia: relationship to energy metabolism, blood flow, and steady potential. Ann Neurol (2000) 47(4):485–92. doi:10.1002/1531-8249(200004)47:4<485:Aid-Ana12>3.0.Co;2-8
43. Prager JM, Rosenblum JD, Huddle DC, Diamond CK, Metz CE. The magnetization transfer effect in cerebral infarction. AJNR Am J Neuroradiol (1994) 15(8):1497–500.
44. Tourdias T, Dousset V, Sibon I, Pele E, Menegon P, Asselineau J, et al. Magnetization transfer imaging shows tissue abnormalities in the reversible penumbra. Stroke (2007) 38(12):3165–71. doi:10.1161/Strokeaha.107.483925
45. Zhou J, Zhu H, Lim M, Blair L, Quinones-Hinojosa A, Messina SA, et al. Three-dimensional amide proton transfer MR imaging of gliomas: initial experience and comparison with gadolinium enhancement. J Magn Reson Imaging (2013) 38(5):1119–28. doi:10.1002/jmri.24067
46. Heo HY, Zhang Y, Jiang S, Lee DH, Zhou J. Quantitative assessment of amide proton transfer (APT) and nuclear Overhauser enhancement (NOE) imaging with extrapolated semisolid magnetization transfer reference (EMR) signals: II. Comparison of three EMR models and application to human brain glioma at 3 tesla. Magn Reson Med (2016) 75(4):1630–9. doi:10.1002/mrm.25795
47. Heo HY, Zhang Y, Lee DH, Hong X, Zhou J. Quantitative assessment of amide proton transfer (APT) and nuclear Overhauser enhancement (NOE) imaging with extrapolated semi-solid magnetization transfer reference (EMR) signals: application to a rat glioma model at 4.7 tesla. Magn Reson Med (2016) 75(1):137–49. doi:10.1002/mrm.25581
48. Jin T, Wang P, Zong X, Kim SG. Magnetic resonance imaging of the amine-proton exchange (APEX) dependent contrast. Neuroimage (2012) 59(2):1218–27. doi:10.1016/j.neuroimage.2011.08.014
49. Jones CK, Huang A, Xu J, Edden RA, Schar M, Hua J, et al. Nuclear Overhauser enhancement (NOE) imaging in the human brain at 7T. Neuroimage (2013) 77:114–24. doi:10.1016/j.neuroimage.2013.03.047
Keywords: APT imaging, chemical exchange saturation transfer imaging, stroke, pH, magnetization transfer
Citation: Song G, Li C, Luo X, Zhao X, Zhang S, Zhang Y, Jiang S, Wang X, Chen Y, Chen H, Gong T, Zhou J and Chen M (2017) Evolution of Cerebral Ischemia Assessed by Amide Proton Transfer-Weighted MRI. Front. Neurol. 8:67. doi: 10.3389/fneur.2017.00067
Received: 13 November 2016; Accepted: 15 February 2017;
Published: 02 March 2017
Edited by:
Thanh G. Phan, Monash Health, AustraliaReviewed by:
Parnesh Raniga, Monash University, AustraliaGötz Thomalla, University Medical Center Hamburg-Eppendorf, Germany
Copyright: © 2017 Song, Li, Luo, Zhao, Zhang, Zhang, Jiang, Wang, Chen, Chen, Gong, Zhou and Chen. This is an open-access article distributed under the terms of the Creative Commons Attribution License (CC BY). The use, distribution or reproduction in other forums is permitted, provided the original author(s) or licensor are credited and that the original publication in this journal is cited, in accordance with accepted academic practice. No use, distribution or reproduction is permitted which does not comply with these terms.
*Correspondence: Min Chen, Y2hlbm1pbjYyQHlhaG9vLmNvbQ==