 Irina Sidorenko1Varvara Turova2Nikolai Botkin1Laura Eckardt3Ana Alves-Pinto2
 Ursula Felderhoff-Müser3Esther Rieger-Fackeldey4Andrey Kovtanyuk2
 Renée Lampe2*
- 1Mathematical Faculty, Technical University of Munich, Garching, Germany
- 2Orthopedic Department, University Hospital Rechts der Isar, Technical University of Munich, Munich, Germany
- 3Pediatric Department I, Neonatology, Pediatric Intensive Care, Pediatric Neurology, University Hospital Essen, University Duisburg-Essen, Essen, Germany
- 4Pediatric Department, University Hospital Rechts der Isar, Technical University of Munich, Munich, Germany
Intraventricular hemorrhage (IVH) is one of the most critical complications in the development of preterm infants. The likelihood of IVH is strongly associated with disturbances in cerebral blood flow (CBF) and with microvascular fragility in the germinal matrix (GM). The CBF value and its reactivity to changes in arterial carbon dioxide pressure (pCO2) and mean arterial blood pressure (MABP) are relevant indicators in the clinical assessment of preterm infants. The objective of the present study is mathematical modeling of the influence of pCO2 and MABP on CBF in immature brain, based on clinical data collected from 265 preterm infants with 23–30 gestational weeks. The model was adapted to the peculiarities of immature brain by taking into account the morphological characteristics of the GM capillary network and vascular reactivity, according to gestational and postnatal age. An analysis of model based values of CBF and its reactivity to changes in MABP and pCO2 was performed separately for each gestational week and for the first two days of life both for preterm infants with and without IVH. The developed model for the estimation of CBF was validated against equivalent experimental measurements taken from the literature. A good agreement between the estimated values of CBF, as well as its reaction on changes in MABP and pCO2 and the equivalent values obtained in experimental studies was shown.
Introduction
Advances in neonatal care have increased the chances of survival of preterm infants, but the occurrence of complications in postnatal development remains high. One of the most frequent complications, around 15–20% of cases, in infants born before 32 weeks of gestation (WG) is intraventricular hemorrhage (IVH) (1), which can lead to lifelong impairments such as cerebral palsy. Hemorrhages occur mostly in the subependymal germinal matrix (GM) (2), a specific region in the immature brain located between the thalamus and caudate nucleus, having a high vascularity (3) and a fragile capillary network. The GM reaches its maximum size of 5% from the total brain volume at 22 WG, rapidly shrinking after 28 WG and practically disappearing by 34 WG (3). Electron-microscope observations have shown that the density of micro vessels in this region is about 1.5 times higher than in any other part of the brain and that the average diameter of vessels is also larger than in the cortex (4, 5). According to Laplace's law, vessels in the GM are, therefore, subjected to larger wall tensions and, consequently, they have higher probability of rupture (5). There is also evidence that, due to the lack of collagen and elastane, the walls of GM vessels are thinner (5), have less supporting tissue, and are more fragile than in other parts of the brain. This makes vessels of the GM more sensitive to fluctuations in CBF than vessels in other regions of the brain. Therefore, the assessment of physical properties of the microcirculation from standard medical parameters is important for the evaluation of biomechanical stability of capillaries in GM.
Another pathological mechanism that can increase the likelihood of intracranial hemorrhage in preterm infants is a weak autoregulatory response of arterioles to changes in mean arterial blood pressure (MABP) and in partial pressure of blood gases (6–8). An intact autoregulatory mechanism keeps cerebral blood flow (CBF) almost constant despite changes in MABP. Impaired autoregulation leads to a linear dependence of CBF on MABP (7) (designated as “passive autoregulation” below). A high fragility of vessel walls in the GM and a deficient cerebral autoregulation in the immature brain make it more sensitive to fluctuations in CBF than the mature brain of full-term infants (4, 9), which can contribute to trigger a hemorrhage and/or ischemia.
Hence, regular monitoring of the CBF level as well as observing its fluctuations caused by passive autoregulation are critical to prevent the occurrence of complications in preterm infants. Several techniques for measuring CBF, such as near-infrared spectroscopy (10–12) (NIRS), Xenon-133 clearance measurements (10, 13, 14), transcranial Doppler ultrasonography (9, 15), MRI based arterial spin labeling (16, 17) (MRI ASL) and diffusion correlation spectroscopy (12, 18–20) (DCS), are currently available in medical treatment. However, they are not yet part of clinical routine. An alternative approach is to employ mathematical models of cerebral hemodynamics (21, 22) to estimate CBF. During recent years, numerical simulations describing the origin, influencing factors, and consequences of intraventricular hemorrhage in preterm infants have been developed (23, 24). These simulations, however, did not take into account the presence of the GM in the premature brain.
The purposes of the present study were, therefore, the following: (I) Development of a mathematical model for numerical evaluation of CBF, taking into account a realistic description of the GM along with cerebral autoregulation, according to the gestational age of each patient. (II) Demonstration of the research capabilities of this model in assessing physical properties of the microcirculation in the GM. (III) Verification of the model by comparison of model based values of CBF, as well as CBF reactivity to changes in MABP and pCO2, with equivalent measurements from experimental studies reported in the literature (9–14, 17).
Materials and Methods
Description of the Sample Group
Clinical data were obtained retrospectively from the records of 265 preterm infants treated in the Departments of Neonatology of the University Hospital Rechts der Isar of the Technical University of Munich (MRI TUM) and of the University Hospital of Essen. The project was approved by the Ethics Committees of the University Hospital Rechts der Isar, Technical University of Munich (Ref. 364/15) and of the University Hospital Essen, University Duisburg-Essen (Ref. 16-7284-BO).
The gestational age of the sample group ranged from 23 to 30 WG (26.1 ± 2.2 WG), and the birth weight from 335 to 1580 g (856.66 ± 278.94 g). Although all infants included in this study were preterm, we divided them into control and risk groups according to the absence or presence of IVH. The cranial ultrasound examinations were performed routinely on the 1st, 3rd, 7th, 14th days and sometimes more often (even daily) in case of abnormalities or suspected bleeding. IVH was diagnosed in 136 cases (risk group). The remaining 129 patients were not diagnosed with IVH (control group). Separation of patients into groups according to IVH degree was not done here, because this difference is not accounted for in the present mathematical model. Obstetric characteristics for different gestational ages are presented in Tables 1, 2. A total of 107 (78.7%) infants were diagnosed with IVH during first 5 days, which is typically caused by hemodynamic instability. Another 29 (21.3%) infants had IVH after day 5, which may indicate that other clinical factors contributed to origin of bleeding. Available clinical details for 29 infants, for whom IVH was diagnosed after day 5, were reviewed to decide whether or not those infants should be included in the analysis (see Table 3). In percentage, there were more cases of EPH Gestosis, Necrotizing Enterocolitis, Thrombocytopenia, Cardiopulmonary Adaptation, and Cholestasis in infants with IVH diagnosis after day 5 than in infants with IVH diagnosed within the first 5 days after birth. However, since there is no direct evidence for the presence or absence of a causal influence of these factors on hemodynamic stability, the 29 infants were included into the analysis.
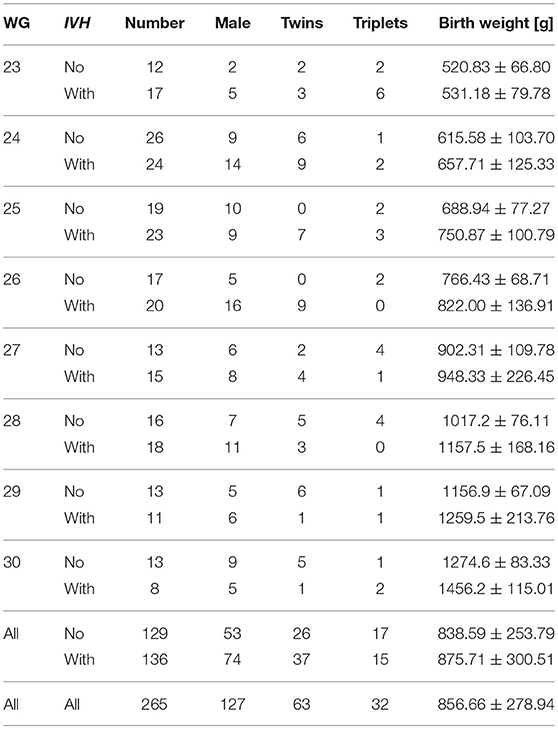
Table 1. Obstetric characteristics of the control (no IVH) and risk (with IVH) groups.
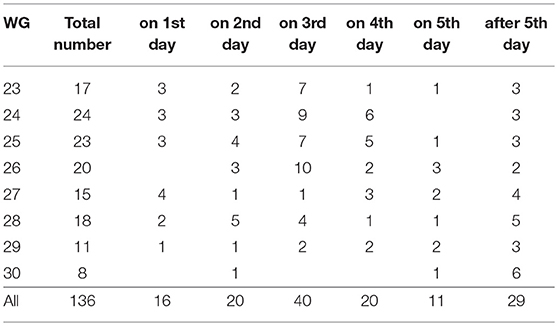
Table 2. The day of IVH diagnosis (number of diagnosed infants for each gestational week).
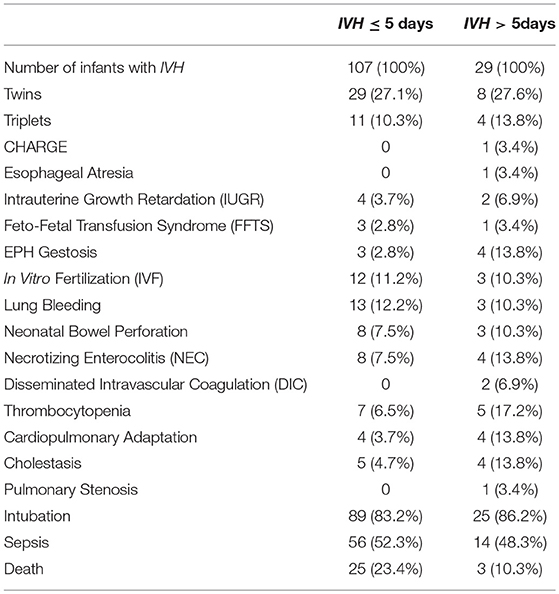
Table 3. Baseline clinical parameters for infants with IVH before and after 5th postnatal day.
To account for the fast involution (3) of the GM after 22 WG (Table 4) and impaired autoregulation during first days of postnatal life (13), patients were assigned to groups according to the gestational age in weeks, and data were analyzed for different postnatal days.
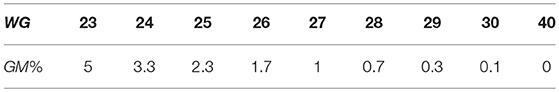
Table 4. Volume fraction of germinal matrix (in% from total brain volume) (3).
Collection of Clinical Data
The MABP and pCO2 records were collected from standard clinical measurements during routine clinical nursing for the first 10 days after birth in the control group, and for up to 7 consecutive days before and 3 days after hemorrhage in the risk group. Only arterial and capillary blood gas values were considered in the analysis. MABP was measured either invasively via an arterial catheter or non-invasively with a cuff placed on the upper part of the neonate's arm. No distinction between two measuring methods was done because of a good agreement between them, irrespective of birth weight and gestational age of preterm infants (25). Although measurement of MABP and pCO2 were done at different times, only coincident records of MABP and pCO2 were used in numerical computations. The number of coincident records of MABP and pCO2 varied from 1 to 44 per patient, with a median of 12 and an interquartile range of 10. The total number of coincident records was 3439.
Statistical Methods
Statistical description of clinical records was required for modeling the cerebral autoregulation processes in preterm infants. Mean values of MABP and pCO2 were estimated from the control group and taken as reference values in the mathematical model of cerebral autoregulation.
Fast changes in the GM size (3) and vessels' reactivity (11, 13) during the development suggest a correlation between the CBF and gestational age (in weeks) as well as postnatal age (in days). Therefore, a statistical analysis of clinically measured MABP and pCO2, model based CBF, and its sensitivity to MABP and pCO2 was done separately for each gestational week and for the first two postnatal days.
Statistical comparisons of relevant variables between infants with and without IVH were also performed. Comparisons were done using either the Student t-test or the Wilcoxon rank-sum test, depending on whether data were normally distributed or not, which was controlled with Kolmogorov-Smirnov tests. All statistical analyses were carried out with the standard statistical library of MATLAB R2018a.
Mathematical Model of Cerebral Blood Vessel System
A mathematical model of adult brain (22) was adapted to describe the cerebral hemodynamics of immature brain in preterm infants. The following adaptations to the model were done: (I) The number of vessels as well as their lengths and diameters were scaled down in agreement with experimental measurements (4, 26) and according to the brain weight of each infant. (II) The presence and extension of the GM was simulated according to gestational age (3). (III) A phenomenological cerebral autoregulation model (23) describing the myogenic response to fluctuations in MABP was incorporated into the hierarchical cerebrovascular model (22) and adjusted to preterm infants, based on average values derived from the clinical records of preterm infants without IVH. (IV) Vascular activity was simulated as changes in the vessel radius in response to changes in MABP and carbon dioxide pressure (pCO2), with accounting for gestational and postnatal age. Since carbon dioxide is 20 times more soluble in blood than oxygen, and CBF is almost 10 times more sensitive to changes in pCO2 [reactivity (9) 32.7% kPa−1] than in pO2 [reactivity (9) −3.1% kPa−1], carbon dioxide is recognized as a major determinant of CBF (27). Therefore, the effect of pO2 was neglected in the mathematical modeling of CBF. (V) The presence of red blood cells was accounted for by application of a micropolar fluid model (28–30) of blood flow (24). The methods and adaptations performed are schematically described in Figure 1.
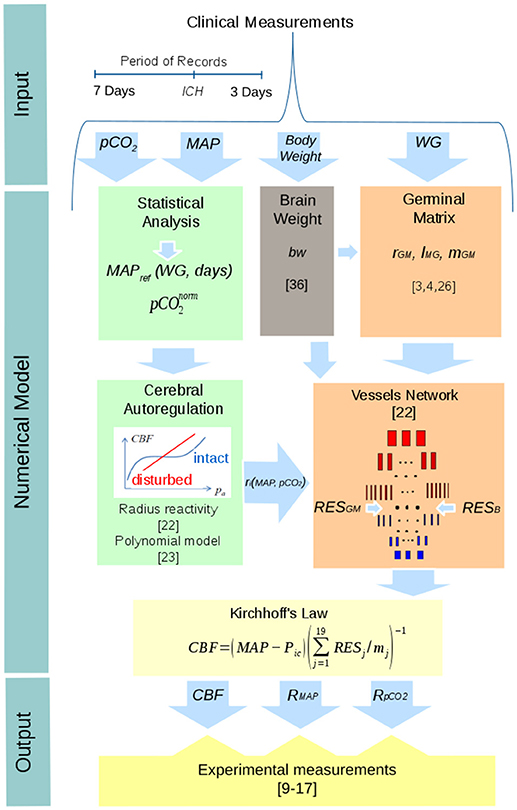
Figure 1. Schematic representation of the numerical model of CBF used in this study and of the procedure used in its validation.
Numerical calculation of the CBF was based on a hierarchical cerebrovascular model proposed for adult brain (22) and adjusted to the case of preterm infants (23, 24). In this approach, the vascular system is divided in 19 levels according to the morphological characteristics of the vessels. The magnitude of CBF is derived from the Kirchhoff's law as:
where MABP is the mean arterial blood pressure, Picis the intracranial pressure (ICP), mj and RESj are the number and resistance of vessels on level j, respectively. In numerical calculations MABP is taken from the clinical records of each patient. The Picvalue is also individual for each patient and could be inserted into the mathematical model directly from clinical records. However, because of missing ICP records in our data, a constant Pic value of 5 mmHg was assigned to all patients. The mean ICP values in preterm neonates can vary from 2.7 mmHg (31, 32) to 12.5 mmHg (33) depending on the measurement method. However, according to (32), ICP values greater than 7 mmHg are “indicative of intracranial hypertension, but occurred in relation to nursing events and positioning of the patient's head.” The used ICP value of 5 mmHg is a mean between 3 and 7 mmHg, which is in accordance with the mean ICP values of 4–6.5 mmHg (34) and 5.1 mmHg (35) measured in preterm infants.
Thus, the volume of blood flow depends on the perfusion pressure, MABP−Pic, and vessel resistances, RESj, influenced by the density and morphology of the vessel network and the rheological characteristics of blood. In the simplest case of Hagen-Poiseuille's flow of Newtonian fluid, the vessel resistance RESj is given by:
where μ is the dynamic viscosity of blood, and lj and rj are the length and radius of vessels on each level j = 1 … 19. The vessel radius rj is not constant but varies depending on the reactivity of blood vessels (i.e., vasodilation or vasoconstriction) to pCO2 and MABP (see section Accounting for Cerebral Autoregulation below).
In the present work, the setting , where the right-hand side was derived using micropolar description (28–30) of blood flow, is utilized. This technique accounts for the presence of rigid, randomly oriented particles (red blood cells) suspended in a viscous medium. The method assumes the introduction of additional rotational degrees of freedom into the flow equations. In the case of incompressible steady state flow through a pipe with circular section, a power series expansion of solutions yields an easily computable approximation of the flow velocity and flow resistance under the assumption of constant hematocrit (24, p. 5–8). We do not show here the corresponding formulas obtained with the Maple software for symbolic computations because they are exceedingly long.
The modification of the number of vessels mj, their initial diameter and length lj, on each hierarchical level j, j = 1 … 19, in comparison with these values for adult brain (22), was done according to the gestational age and brain weight bw under the following empirical assumptions: (I) The number of main arteries (m1) and veins (m19) is constant across age. (II) The number of small arterioles, capillaries, and venules decreases depending on the amount of brain tissue. (III) The length and the diameter of large arteries and veins decrease with brain weight. (IV) The morphometric values of capillaries are similar to the values used in the model of adult cerebral microvascular system (22). Such definition of vessel size is supported by studies (26) suggesting that characteristics of the capillary network are determined by metabolic processes and are similar across mammals. Thereby, the following modifications in the number of vessels mj, their length lj, and diameter dj were applied:
Here Mj, Lj and Dj are the number, length and diameter of vessels in level j of the adult brain, respectively. The coefficient 0.1 is used to scale the vessel length and diameter to experimental measurements (4, 26). The value of 1,200 g corresponds to the approximate weight of the adult brain (22) and bw is the brain weight of the preterm infant, computed from his body weight (BW) according to the regression formula (36):
Accounting for the Presence of the Germinal Matrix
The model network used in this study included an additional part, at the capillary level, describing the presence of the GM in the brain of infants with WG < 32. Accounting for the GM in the computation of CBF was implemented through dividing the vascular system at the capillary level, j = 10, into two parallel circuits. One circuit describes the GM with the total hydraulic resistance calculated with the above mentioned micropolar flow model (24) and with the number of (parallel connected) vessels given by:
Here M10 is the number of capillaries on the 10th level of the adult vascular network (22), GMvf is the fractional volume of the GM relative to the total brain volume (3) (see Table 4), and the factor 1.5 describes a density correction factor (4) for the GM.
The second circuit corresponds to the rest of the capillary system of the brain. Its total hydraulic resistance was calculated using the number of (parallel connected) vessels given by:
Values of capillary length and diameter were taken from the literature as follows: lGM = 40 μm, dGM = 6.7 μm for the GM (4, 26), and lB = 60 μm and dB = 5.6 μm for the rest of the brain (22).
The total resistance of the capillary level becomes
It is important to note that the effect of the GM on the global CBF is rather small because of the relatively small volume of GM. However, because of the larger radius of the GM capillaries, the wall tension is likely to be larger than that in the capillaries of other brain regions. Notice that the wall tension in capillary vessels obeys Laplace's law:
where P10is the pressure in the capillary level, t = 0.5 μm is the thickness of the capillary wall, and r is the radius of the capillary, in the GM or in the other region of the brain, altered (vasodilation or vasoconstriction) as a result of changes in pCO2 and MABP.
Accounting for Cerebral Autoregulation
Vessel reactivity plays a major role in supporting a stable CBF. Fluctuations in MABP and pCO2 induce contraction and relaxation of muscle cells within vessel's walls. Vasodilation and vasoconstriction change vessel's radius and hence vessel's resistance to blood flow. Autoregulation processes mainly occur in arteries and arterioles. Capillary walls do not have layers with muscular tissue, but they also elastically react to fluctuations in CBF. Moreover, the role of pericytes in regulating capillary diameter was recently addressed (37).
In the hierarchical cerebrovascular model (22) the influence of pCO2 on CBF is modeled through the modification of the vessel radius as follows, where cj are the reactivity coefficients:
The reactivity coefficients cj are different for different vascular levels (22). The strongest reaction with c8 = 13.9% kPa−1 (1.81% mmHg−1) is demonstrated by arterioles at the 8th level. For capillaries and venules it decreases reaching the lowest value of c19 = 2.1% kPa−1 (0.28% mmHg−1) for veins at the 19th level.
The increase/decrease in the vessel radius rj is a function of the deviation of pCO2 from the baseline value . In the present work, we take 40 mmHg, which is the middle value between the lower and upper bounds of normocapnia described in the literature as 35 ≤ pCO2 ≤ 45 mmHg (38) or 30 ≤ pCO2 ≤ 55 mmHg (39).
Experimental measurements of the CBF reactivity to pCO2 in preterm infants showed that the reactivity was decreased down to 10% kPa−1 (1.3% mmHg−1) (15, 27) on the first day of life but could reach normal values of 30% kPa−1 (4% mmHg−1) (16, 22) already on the second day. This reduction in the reactivity on the first day of life was accounted for in the simulations by decreasing the reactivity coefficients cj by a factor of 3 for the first day of life.
Another very important mechanism of cerebral autoregulation is the myogenic response to fluctuations in blood pressure. To simulate this mechanism, the cerebrovascular model was extended by adding the effect of MABP on the vessel radius as follows (23):
For a fixed pCO2, the dependence of rjon MABP has a sigmoidal shape with a plateau around the reference pressure MABPref. This dependence was adjusted to experimental data via the polynomial coefficients ai (23). The value of MABPref and the width of the plateau are much smaller in newborns than in adults (30). However, MABPref increases with gestational and postnatal age (see Figure 2A). This behavior was accounted for by using polynomial fits to estimate MABPref as function of WG for each postnatal day. The following results, shown also in Figure 2B, were obtained with a standard library of MATLAB R2018a:
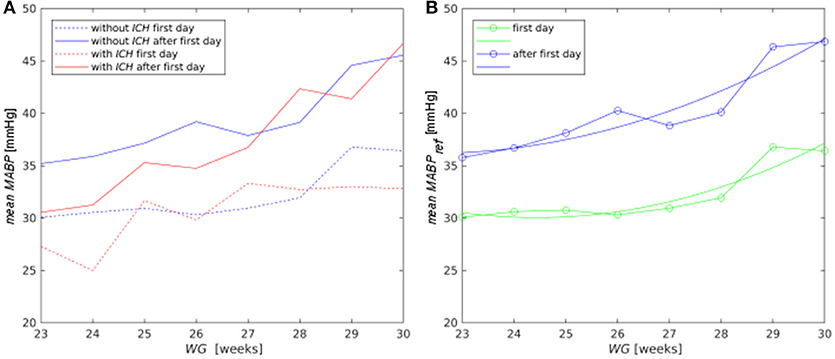
Figure 2. (A) Mean MABP for the control (blue lines) and risk (red lines) groups for the first day (dashed lines) and for the following days (solid lines); (B) polynomial approximation (lines without symbols) to the average pressure MABPref obtained from the clinical records (lines with symbols) in the control group for the first day (green curves) and for the period after the first postnatal day (blue curves).
When analyzing the combined effect of MABP and pCO2, both the risk of hemorrhage and ischemia need to be considered. If vessels are dilated at pCO2 > 50 mmHg, additional vessel dilation due to decreasing MABP can lead to IVH. If pCO2 < 30 mmHg, and vessels are constricted, additional vessel constriction as a reaction to increasing MABP can lead to ischemia (40, 41). These bounding values (30 and 50 mmHg) provide physiologically acceptable limits for intact autoregulation. Thus, the vital range for pCO2 ensuring stable CBF was assumed to be |pCO2– | ≤ 10 mmHg (41) with 40 mmHg (38, 39). As for MABP, the intact autoregulation was defined by the condition |MABP – MABPref| ≤ 5 mmHg (6, 40, 41).
The modeled effect of MABP on CBF for different pCO2 values is illustrated in Figure 3A for 23 WG. The autoregulatory plateau in Figure 3A corresponds to the region of stable CBF, formed around the reference pressure MABPref = 30 mmHg. The plateau disappears for MABP < 25 mmHg and MABP > 35 mmHg. Outside the plateau CBF changes passively in a linear way with respect to MABP. Figure 3B illustrates the combined effect of MABP and pCO2 on CBF, with the reference pressure value at MABPref = 30 mmHg and = 40 mmHg. The autoregulatory plateau corresponding to stable CBF is located in the region {25 mmHg < MABP < 35 mmHg, 30 mmHg < pCO2 < 50 mmHg}. In all other regions, CBF depends linearly on MABP and pCO2. The absence of the autoregulatory plateau and linear dependence of CBF on MABP for pCO2 > 50 mmHg in our model is in agreement with the autoregulation breakpoint pCO2 = 51 mmHg identified with bilinear regression analysis of Doppler measurements of CBF (15).
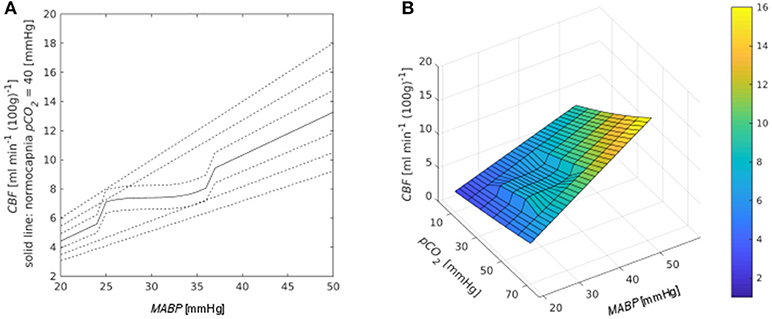
Figure 3. (A) Dependence of CBF on MABP. The platea occurs around MABPref = 30 mmHg. Different lines correspond to different values of pCO2 in mmHg [from bottom to top: 10, 20, 30, 40 (solid line corresponds to normocapnia), 50, 60, 70]. (B) Combined effect of MABP and pCO2 on CBF.
Results
Analysis of Clinical Data
Mean MABP increased both with gestational and postnatal age (Figure 2A). On the first day, the mean MABP of the risk group was lower than that of the control group only for infants with WG < 25 (p = 0.002). However, from the second day on, infants from the risk group with WG < 28 had lower MABP than infants from control group (p = 0.057). The mean MABP value of the control group was used as the reference pressure MABPref (Figure 2B) in the autoregulation law of the mathematical model for CBF.
For infants with WG < 30, pCO2 values averaged over all postnatal days were not statistically different for the risk and control groups (48.51 ± 11.45 mmHg vs. 46.75 ± 9.64 mmHg) and were above or close to the upper bound of normocapnia condition determined in different experimental studies as 45 mmHg (38) or 55 mmHg (39).
Analysis of Simulation Results
Accounting of the Germinal Matrix
Inclusion of the GM in the model at the capillary level (j = 10) changed the resistance of the whole layer (Figure 4A). The resistance of the whole capillary layer RES10 was reduced, especially for earlier WG. The average value of the resistance for infants with WG = 23 decreased from 4.8 × 10⁸ Pa s m−3 to 4.3 × 10⁸ Pa s m−3. The effect of this reduction was small (<1%) for global CBF, but it was considerable for blood flow in individual capillaries, especially for low WG. Thus, inclusion of the GM produced a decrease in blood flow in individual capillaries in other areas of the brain up to 13.5% for 23 WG, up to 9.7% for 24 WG, and to only 0.3% for 30 WG. Furthermore, the most relevant consequence of the presence of the GM was a 20% larger wall tension in capillaries of GM in comparison with that of the rest brain (Figure 4B), which was evaluated with Laplace's law (see section Accounting for the Presence of the Germinal Matrix).

Figure 4. (A) Resistance of the capillary layer with and without GM; (B) Wall tension in a single capillary of the GM and in another area of the brain.
Comparison of Model Based CBF and Its Reactivity to pCO2 and MABP With Experimental Results
Because of the lack of clinical measurements of CBF for preterm infants of all gestational ages analyzed here, the comparison between our numerical results (Table 5) and experimental measurements available from the literature (Table 6) was made using values averaged over gestational ages. The reference experimental data were taken from intravenous Xenon-133 clearance measurements (10, 13, 14), computer-controlled pulsed Doppler measurements (9, 15), NIRS (10–12), and MRI ASL (17) techniques. Another promising modern non-invasive method for CBF measurements is diffuse correlation spectroscopy (DCS). However, DCS measured flow needs a calibration against a baseline CBF measured by another techniques (18–20). Since such data were not at our disposal, we did not compare calculated CBF with DCS measurements.
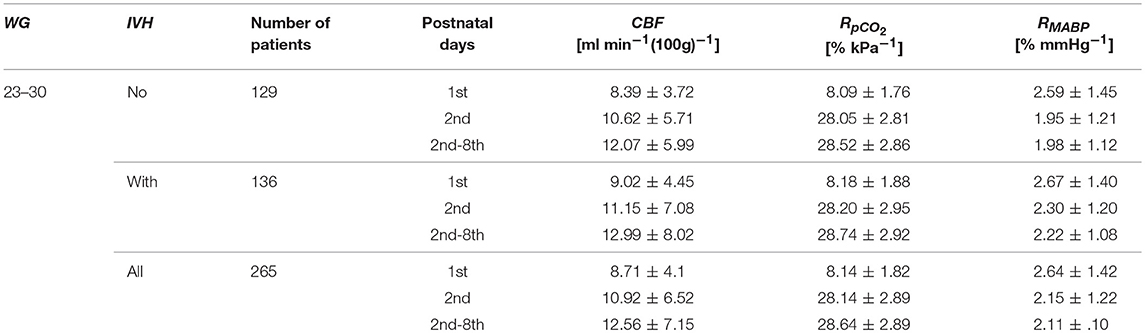
Table 5. Numerical values of CBF and its reactivity to pCO2 (RpCO2) and MABP (RMABP).
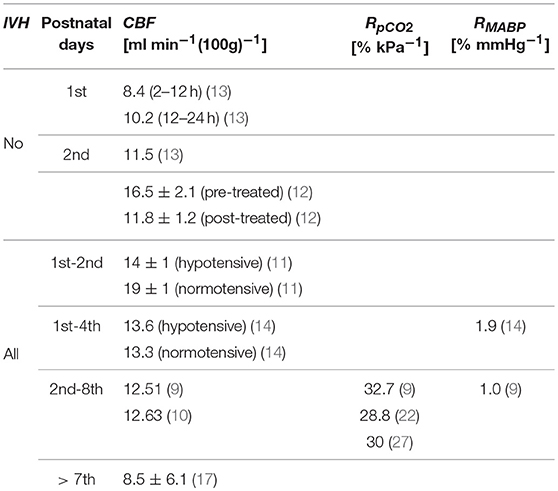
Table 6. Experimental values of CBF and its reactivity to pCO2 (RpCO2) and MABP (RMABP) taken from the literature (9–14, 17, 22, 27).
For patients without IVH model based CBF was equal to 8.39 ml min−1 (100 g)−1 for the first day of life and to 10.62 ml min−1 (100 g)−1 for the second day of life, which was in a good agreement with experimental values (13) of 8.4 ml min−1 (100 g)−1 for period 2–12 h, 10.2 ml min−1 (100g)−1 for period 12–24 h, and 11.5 ml min−1 (100 g)−1 for period 24–48 h.
During the period from the 2nd to the 8th day, estimated CBF for all patients increased up to 12.56 ml min−1 (100 g)−1, whilst Doppler measured experimental value (9) was 12.51 ml min−1 (100 g)−1, Xenon measured (10) values were equal to 12.63 ml min−1 (100 g)−1 and 13.3 ml min−1 (100 g)−1 for later postnatal days (14), and NIRS measured (11) values were equal to 14 ml min−1 (100 g)−1 for hypotensive and to 19 ml min−1 (100 g)−1 for normotensive preterm infants.
Numerically calculated reactivity of CBF to pCO2 for all patients was equal to 8.14% kPa−1 on the first day of life, but already on the second day, it increased up to 28.16% kPa−1, which agrees with reports on decreased pCO2 reactivity on the first day of life (15, 27). The average value computed over all patients for a time period from the 2nd to the 8th postnatal day was equal to RpCO2 = 28.64% kPa−1, which is lower than the reactivity (9) of 32.7% kPa−1, but is similar to the reactivity (22) of 28.8% kPa−1 and the reactivity (27) of 30% kPa−1. The numerically estimated mean value of RMABP over all patients in the time period from the 2nd to the 8th day was equal to 2.11% mmHg−1, which is almost twice higher than the Doppler-measured (9) value of 1% mmHg−1, but agrees with the Xenon measured (14) one of 1.9% mmHg−1.
Variability of model based CBF values depending on three constant input parameters (intracranial pressure, Pic, baseline value , and dynamic viscosity of blood μ) was estimated. The response of CBF to ±10% variation of these parameters, averaged over all infants with gestational age from 23 WG to 30 WG and postnatal age from 2nd to 8th days, is presented in Table 7. The variation of CBF was around 1.5% for Pic, about 13% for , and ~10% for μ. However, all model based values of CBF were in the range from 11.03 to 14.18 ml min−1 (100 g)−1, which matched the experimentally measured range from 8.04 to 19 ml min−1 (100 g)−1 (Table 6).
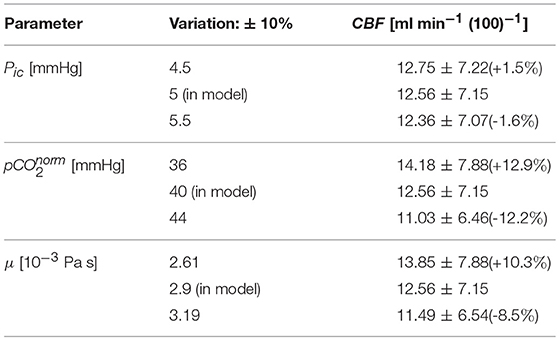
Table 7. Effect of variations of input constant parameters on the model based CBF.
Analysis of Model Based CBF and Its Reactivity to pCO2 and MABP
Model based CBF values increased with gestational and postnatal ages for the both control and risk groups (Figure 5A). No statistically significant difference in mean CBF between the control and risk groups was observed. However, fluctuations of CBF around the mean value for the control group (Figure 5B) were larger for patients with IVH than without IVH (p = 0.065).
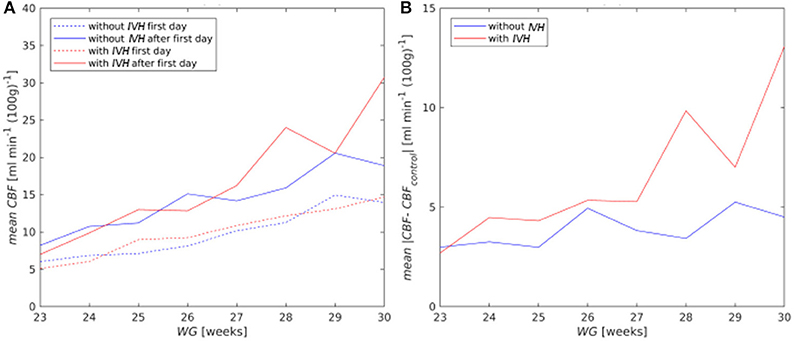
Figure 5. (A) Mean CBF for the first (dashed curves) and after the first day of life (solid curves); (B) mean absolute deviation of CBF from the mean value of the control group (CBFcontrol) for all postnatal days.
On the first postnatal day, CBF reactivity to pCO2 (RpCO2) averaged over all patients was equal to 8.16% kPa−1, but already on the second day it increased almost to normal values both in the control group (28.07% kPa−1) and in the risk group (28.23% kPa−1). The RpCO2 value averaged over the time period from the 2nd to 8th postnatal days was equal to 28.52% kPa−1 for the control group and to 28.74% kPa−1for the risk group. No difference across gestational age and between the risk and control groups was observed (Figure 6A).
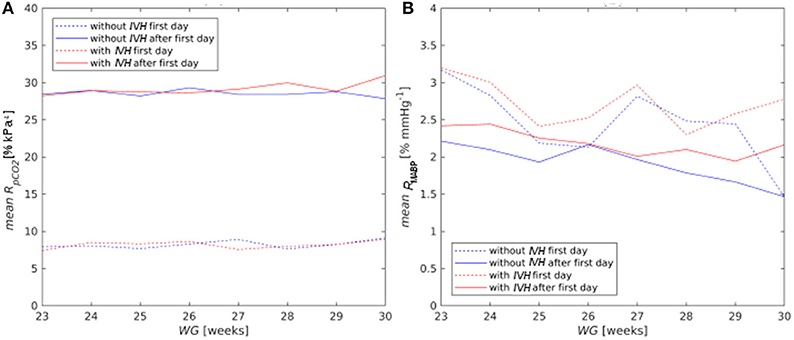
Figure 6. Mean reactivity of CBF on pCO2 (A) and MABP (B) for the first (dashed curves) and after the first day of life (solid curves).
CBF reactivity to MABP (RMABP) was high for all newborns on the first day (2.64% mmHg−1) and decreased with postnatal and gestational age (Figure 6B), although it stayed always higher for the risk group than for the control one. The RMABP value averaged over the time period from the 2nd to 8th postnatal days was higher (p = 0.02) for the risk group (2.22% mmHg−1) than that for the control one (1.98% mmHg−1).
Discussion
The main purpose of the present work was (I) the adjustment of a mathematical model for the calculation of CBF to the peculiar characteristics of the immature cerebral circulation; (II) the comparison of model predictions with equivalent experimental data from the literature, and (III) a statistical analysis of model based CBF and its reactivity to MABP and pCO2 changes for different gestational and postnatal age of patients with and without IVH.
Adjustment of the Hierarchical Cerebrovascular Model to Immature Brain
A mathematical model for assessment of CBF (22) was adapted to cerebral hemodynamics of the immature brain by including a microvascular network describing the GM into the hierarchical cerebrovascular blood flow according to the gestational age of preterm infants. When adapting the model, some constant values of parameters (e.g., intracranial pressure Pic, baseline value and dynamic viscosity of blood μ) were taken from the literature. Even if the literature sources suggest slightly different values of these parameters, our evaluation showed that the effect of a 10% variation of each of them preserved the model based CBF in the ranges reported in the literature.
Accounting for the GM in the modeling of the capillary level helped to understand specific features of immature brain. Since GM volume constitutes only up to 5% of the total brain volume, the effect of the GM on the global CBF was small (<1%), but it was noticeable at the capillary level. For a gestational age of 23 weeks, the numerically computed resistance of the capillary level decreased from 4.8 × 10⁸ Pa s m−3 to 4.3 × 10⁸ Pa s m−3 (Figure 4A) after accounting for the GM. This drop was in agreement with the mathematically predicted drop (42) from 8 × 10⁸ Pa s m−3 to 6.9 × 10⁸ Pa s m−3 [second value was calculated as (RESGM−1 + RESB−1)−1 with RESGM = 51.5 × 10⁸ Pa s m−3 and RESB = 8 × 10⁸ Pa s m−3, see Table 4 from the article (42)] in a 6-edge topology model of the capillary network including GM. Furthermore, accounting for the GM can change blood flow in individual vessels up to 13.5%. Additionally, the wall tension in capillaries of the GM was estimated to be 20% higher than that in the rest brain, which occurred due to the larger diameter of the capillary vessels of the GM in comparison with that of other brain regions. This may explain the fact that most hemorrhages originate in the GM (2). The observed increase of wall tension is significant in modeling biomechanical stresses in vessel walls and evaluation of hazard values of medical characteristics leading to vessel rupture and IVH.
Comparison of Numerical Estimations With Experimental Measurements
Model based CBF and its reactivity to MABP and pCO2 was in a good agreement with experimental data from the literature (9–14, 17). Also larger fluctuations of computed CBF for infants with IVH, compared to those without IVH, were in accordance with strongly fluctuating CBF observed experimentally as a result of impaired cerebral autoregulation in preterm infants (7, 8, 43, 44).
A good agreement of the numerical results with the experimental measurements confirms the ability of the model to correctly describe effects of MABP and pCO2 on CBF in immature brain. Thus, the model developed can be applied for the analysis of clinical parameters which are critical for the occurrence of IVH. Hierarchical modeling of the cerebral vasculature enables us to calculate the pressure and estimate shear stresses in walls of GM vessels, where IVH usually originates.
Furthermore, in the absence of CBF measurements during clinical monitoring of preterm infants, numerically calculated extreme values and high fluctuations of CBF can be regarded as risk factors of IVH.
Statistical Analysis According to the Gestational and Postnatal Age
An important advantage of the present study was its large sample size (3,439 clinical records), which allowed the analysis of baseline clinical parameters and numerical results obtained for infants with and without IVH. The evolution of the results according to gestational and postnatal ages could also be analyzed.
For infants of the risk group with WG < 25, strong hypotension was established from the first day and for those with WG < 28 from the second day on. However, an increase of mean MABP with gestational and postnatal ages was observed both for the control and risk groups.
Model based CBF increased with gestational and postnatal ages. Although absolute values of CBF were not significantly different between the risk and control groups, the fluctuations of CBF were significantly higher in the risk group for all gestational ages. That is, the occurrence of critical high (low) values of CBF and, therefore, of hemorrhages (ischemia), are more likely in the risk than in the control group.
The reactivity of CBF to pCO2 did not depend on gestational age, but the reactivity of CBF to MABP decreased with gestational and postnatal age, which means a stabilization of CBF behavior toward intact autoregulation.
Statistical analysis of clinically measured pCO2 showed no difference regarding the gestational age. Depending on the definition of the upper limit of normocapnia [45 mmHg (38) or 55 mmHg (39)] we found established or close to established hypercapnia values for both control and risk groups. Previous experimental studies (14, 39, 43) demonstrated that hypercapnia leads to vasodilation, which in turn increases the risk of IVH in preterm infants. However, in the present study, mean pCO2 was not statistically different in the risk and control groups. This observation suggests that hypercapnia alone cannot be responsible for the development of IVH. More likely, this occurs in combination with hypotension and/or strong fluctuating CBF.
Limitations and Further Work
The model developed was calibrated using averaged values of MABP and pCO2 of the control group. Though processing of less cluttered data is easier and provides smoother results, this can withdraw some valid samples from the consideration. The model was parameterized using clinical data collected in two clinics, and its good predictive ability was demonstrated using experimental data from the literature. However, the model should additionally be validated by analyzing the CBF behavior in an independent clinical group.
The model accounts for the dependence of CBF on only two important clinical parameters, MABP and pCO2. They are, however, recognized as the main factors affecting CBF (27). A statistical analysis was done to evaluate the relation between CBF, MABP, pCO2, and the origin of IVH. The predictive power of the model with respect to the origin of IVH was not studied because the latter is multifactorial, and, therefore, an analysis of other risk factors affecting cerebral hemodynamics like, e.g., amount of thrombocytes, presence of inflammation, etc., is necessary. Such a study and an appropriate extension of the current model are planned.
Our mathematical simulation involves the whole cerebrovascular network. Based on a model of micropolar fluid flow in circular pipes (28), adjusted to blood reology (29, 30), we were able, to some extent, to take into consideration non-Newtonian characteristics of blood. However, the model does not account for spatial vessel structure and hematocrit distributions in microcirculation as described, e.g., in (45, 46). Future work will include accounting for red blood cells distributions and more realistic 3D topologies of microcirculatory networks using approaches like those described in (47). Additional improvements can also be achieved by using real data sets presenting spatial architectures of cerebral vessel trees (48), network topologies of the capillary system (42), effects of penetrating vessel occlusions (49), and other hematological parameters relevant for the description of immature brain of preterm infants.
The model developed has a significant potential for both research and clinical purposes. Regular monitoring of the CBF level and its fluctuations in preterm infants is important to assess impaired cerebral autoregulation leading to complications such as IVH. Although several techniques for measuring CBF are currently available, they are not yet part of clinical routine. Model based prediction of CBF values can provide complementary information to routine clinical measurements. The origin of IVH is multifactorial, and model based estimated CBF can be used as one of the independent variables in multivariate statistical analysis of risk factors of IVH.
An advantage of the hierarchical cerebrovascular model is the possibility to evaluate physical characteristics of the microcirculatory network from standard clinical measurements. The estimation of blood flow velocity and pressure in individual vessels enables the assessment of biomechanical stresses in walls of capillaries and determination of critical values of MABP and pCO2 beyond which the likelihood of disruption of GM vessels grows, and the probability of an hemorrhage increases.
Conclusions
A hierarchical cerebrovascular model for the adult brain (22) was modified according to infants' gestational age by scaling the vessel number and size to brain weight and by accounting for the presence of the GM in the calculation of vascular resistance at the capillary level. Furthermore, values of clinically measured MABP were employed for the adaptation of an autoregulation model to preterm infants. Intact or impaired autoregulation was simulated as vascular response to changes in MABP and pCO2 and accounting for gestational and postnatal age. Additionally, a micropolar fluid model describing blood flow in vessels accounting for microrotations of red blood cells suspended in plasma was applied to the calculation of the hydraulic resistance for vessels of each hierarchical level. To the best of our knowledge, there is no other model of cerebral blood circulation in the immature brain which includes all these features. Model based values of CBF and its reactivity to changes in MABP and pCO2 showed a good agreement with equivalent experimental measurements described in the literature. Therefore, the developed model can be proposed as a complimentary tool for assessing CBF in preterm infants and for estimating the physical characteristics of the microvessel network from standard medical parameters, hazard for biomechanical failure of capillaries in the GM and origin of IVH.
Data Availability Statement
The data underlying the study are available as Supplementary Table 1.
Author Contributions
RL: supervising; VT, NB, IS, and AK: model development; LE, ER-F, and UF-M: Data collection; IS, VT, and NB: numerical simulations; IS, VT, and AA-P: statistical analysis. Each author contributed important content during model development, data analysis and interpretation, manuscript drafting and revision. All authors approved the final version of the manuscript and agree to be accountable for the content of the work.
Funding
The authors acknowledge the financial support of the Tschira Foundation (Project Nr. 00.302.2016), Würth Foundation, and Buhl-Strohmaier-Foundation.
Conflict of Interest Statement
The authors declare that the research was conducted in the absence of any commercial or financial relationships that could be construed as a potential conflict of interest.
Acknowledgments
The authors are thankful to Christine Klindt-Schuster and Dr. Susmita Roy (both from the clinic rechts der Isar, Technical University of Munich) for their help with collecting and organizing experimental data.
Supplementary Material
The Supplementary Material for this article can be found online at: https://www.frontiersin.org/articles/10.3389/fneur.2018.00812/full#supplementary-material
Abbreviations
IVH, intraventricular hemorrhage; ICP, intracranial pressure; WG, weeks of gestation; GM, germinal matrix; MABP, mean arterial blood pressure; pCO2, carbon dioxide pressure; CBF, cerebral blood flow.
References
1. Szpecht D, Szymankiewicz M, Nowak I, Gadzinowski J. Intraventricular hemorrhage in neonates born before 32 weeks of gestation—retrospective analysis of risk factors. Childs Nerv Syst. (2016) 32:1399–404. doi: 10.1007/s00381-016-3127-x
2. Hambleton G, Wigglesworth JS. Origin of intraventricular haemorrhage in the preterm infant. Arch Dis Child (1976) 51:651–9. doi: 10.1136/adc.51.9.651
3. Kinoshita Y, Okudera T, Tsuru E, Yokota A. Volumetric analysis of the germinal matrix and lateral ventricles performed using MR images of postmortem fetuses. Am J Neuroradiol. (2001) 22:382–8.
4. Ballabh P, Braun A, Nedergaard M. Anatomic analysis of blood vessels in germinal matrix, cerebral cortex, and white matter in developing infants. Pediatr Res. (2004) 56:117–24. doi: 10.1203/01.PDR.0000130472.30874.FF
5. Grunnet ML. Morphometry of blood vessels in the cortex and germinal plate of premature neonates. Pediatr Neurol. (1989) 5:12–6. doi: 10.1016/0887-8994(89)90003-9
6. da Costa CS, Czosnyka M, Smielewski P, Mitra S, Stevenson GN, Austin T. Monitoring of cerebrovascular reactivity for determination of optimal blood pressure in preterm infants. J Pediatr. (2015) 167:86–91. doi: 10.1016/j.jpeds.2015.03.041
7. Soul JS, Hammer PE, Tsuji M, Saul JP, Bassan H, Limperopoulos C, et al. Fluctuating pressure-passivity is common in the cerebral circulation of sick premature infants. Pediatr Res. (2007) 61:467–73. doi: 10.1203/pdr.0b013e31803237f6
8. Wu TW, Azhibekov T, Seri I. Transitional hemodynamics in preterm neonates: clinical relevance. Pediatr Neonatol. (2016) 57:7–18. doi: 10.1016/j.pedneo.2015.07.002
9. Menke J, Michel E, Rabe H, Bresser BW, Grohs B, Schmitt RM, et al. Simultaneous influence of blood pressure, PCO2, and PO2 on cerebral blood flow velocity in preterm infants of less than 33 weeks' gestation. Pediatr Res. (1993) 34:173–7. doi: 10.1203/00006450-199308000-00014
10. Bucher HU, Edwards AD, Lipp AE, Duc G. Comparison between near infrared spectroscopy and 133Xenon clearance for estimation of cerebral blood flow in critically ill preterm infants. Pediatr Res. (1993) 33:56–60. doi: 10.1203/00006450-199301000-00012
11. Munro MJ, Walker AM, Barfield CP. Hypotensive extremely low birth weight infants have reduced cerebral blood flow. Pediatrics (2004) 114:1591–6. doi: 10.1542/peds.2004-1073
12. Diop M, Kishimoto J, Toronov V, Lee DS, Lawrence KS. Development of a combined broadband near-infrared and diffusion correlation system for monitoring cerebral blood flow and oxidative metabolism in preterm infants. Biomed Opt Express (2015) 6:3907–18. doi: 10.1364/BOE.6.003907
13. Pryds O, Greisen G, Lou H, Frils-Hansen B. Heterogeneity of cerebral vasoreactivity in preterm infants supported by mechanical ventilation. J Pediatr. (1989) 115:638–45. doi: 10.1016/S0022-3476(89)80301-4
14. Jayasinhe D, Gill AB, Levene MI. CBF reactivity in hypotensive and normotensive preterm infants. Pediatr Res. (2003) 54:848. doi: 10.1203/01.PDR.0000088071.30873.DA
15. Noori S, Anderson M, Soleymani S, Seri I. Effect of carbon dioxide on cerebral blood flow velocity in preterm infants during postnatal transition. Acta Paediatr. (2014) 103:e334–9. doi: 10.1111/apa.12646
16. Buckley EM, Parthasarathy AB, Grant PE, Yodh AG, Franceschini MA. Diffuse correlation spectroscopy for measurement of cerebral blood flow: future prospects. Neurophotonics (2014) 1:011009. doi: 10.1117/1.Nph.1.1.011009
17. De Vis JB, Hendrikse J, Groenendaal F, de Vries LS, Kersbergen KJ, Benders MJ, et al. Impact of neonate haematocrit variability on the longitudinal relaxation time of blood: Implications for arterial spin labelling MRI. Neuroimage Clin. (2014) 4:517–25. doi: 10.1016/j.nicl.2014.03.006
18. Buckley EM, Cook NM, Durduran T, Kim MN, Zhou C, Choe R, et al. Cerebral hemodynamics in preterm infants during positional intervention measured with diffuse correlation spectroscopy and transcranial Doppler ultrasound. OptExpress (2009) 17:12571–81. doi: 10.1364/OE.17.012571
19. Durduran T, Yodh AG. Diffuse correlation spectroscopy for non-invasive, micro-vascular cerebral blood flow measurement. Neuroimage (2014) 85:51–63. doi: 10.1016/j.neuroimage.2013.06.017
20. Yu G, Floyd TF, Durduran T, Zhou C, Wang J, Detre JA, et al. Validation of diffuse correlation spectroscopy for muscle blood flow with concurrent arterial spin labeled perfusion MRI. Opt Express (2007) 15:1064–75. doi: 10.1364/OE.15.001064
22. Piechnik SK., Chiarelli PA, Jezzard P. Modelling vascular reactivity to investigate the basis of the relationship between cerebral blood volume and flow under CO2 manipulation. Neuroimage (2008) 39:107–18. doi: 10.1016/j.neuroimage.2007.08.022
23. Lampe R., Botkin N, Turova V, Blumenstein T, Alves-Pinto A. Mathematical modelling of cerebral blood circulation and cerebral autoregulation: towards preventing intracranial hemorrhages in preterm newborns. Comput Math Methods Med. (2014) 2014:965275. doi: 10.1155/2014/965275
24. Turova V, Botkin N, Alves-Pinto A, Blumenstein T, Rieger-Fackeldey E, Lampe R. Modelling autoregulation of cerebral blood flow using viability approach. In: International Symposium on Dynamic Games and Applications. Cham: Birkhäuser. (2016) 15:345–63. doi: 10.1109/MED.2017.7984123
25. Meyer S, Sander J, Graeber S, Gottschling S, Gortner L. Agreement of invasive versus non-invasive blood pressure in preterm neonates is not dependent on birth weight or gestational age. J Paediatr Child Health (2010) 46:249–54. doi: 10.1111/j.1440-1754.2009.01679.x
26. Trommer BL, Groothuis DR, Pasternak JF. Quantitative analysis of cerebral vessels in the newborn puppy: the structure of germinal matrix vessels may predispose to hemorrhage. Pediat Res. (1987) 22:23–8. doi: 10.1203/00006450-198707000-00007
27. Greisen G. To autoregulate or not to autoregulate - that is no longer the question. Semin Pediatr Neurol (2009) 16:207–15. doi: 10.1016/j.spen.2009.09.002
28. Erdogan ME. Polar effects in the apparent viscosity of a suspension. Rheol Acta. (1970) 9:434–8. doi: 10.1007/BF01975413
29. Papautsky I., Brazzle J, Ameel T, Frazierac AB. Laminar fluid behavior in microchannels using micropolar fluid theory. Sens Actuat A Phys. (1999) 73:101–8. doi: 10.1016/S0924-4247(98)00261-1
30. Hoffmann KH, Marx D, Botkin ND. Drag on spheres in micropolar fluids with non-zero boundary conditions for microrotations. J Fluid Mech. (2007) 590:319–30. doi: 10.1017/S0022112007008099
31. Yordy M, Hanigan WC. Cerebral perfusion pressure in the high-risk premature infant. Pediatr Neurosurg. (1985) 12:226–31. doi: 10.1159/000120256
32. Wiegand C, Richards P. Measurement of intracranial pressure in children: a critical review of current methods. Dev Med Child Neurol. (2007) 49:935–41. doi: 10.1111/j.1469-8749.2007.00935.x
33. Philip AG, Long JG, Donn SM. Intracranial pressure: Sequential measurements in full-term and preterm infants. Am J Dis Child (1981) 135:521–4. doi: 10.1001/archpedi.1981.02130300021008
34. Urlesberger B, Müller W, Ritschl E, Reiterer F. The influence of head position on the intracranial pressure in preterm infants with posthemorrhagic hydrocephalus. Child Nerv Syst. (1991) 7:85–7.
35. Easa D, Tran A, Bingham W. Noninvasive intracranial pressure measurement in the newborn: an alternate method. Am J Dis Child. (1983) 137:332–5. doi: 10.1001/archpedi.1983.02140300014004
36. Guihard-Costa AM, Larroche JC. Differential growth between the fetal brain and its infratentorial part. Early Hum Dev. (1990) 23:27–40. doi: 10.1016/0378-3782(90)90126-4
37. Hall CN, Reynell C, Gesslein B, Hamilton NB, Mishra A, Sutherland BA, et al. Capillary pericytes regulate cerebral blood flow in health and disease. Nature (2014) 508:55. doi: 10.1038/nature13165
38. Mariani G, Cifuentes J, Carlo WA. Randomized trial of permissive hypercapnia in preterm infants. Pediatrics (1990) 104:1082–8. doi: 10.1203/00006450-199704001-00981
39. Huang H, Cheung PY, O'Reilly M, van Os S, Solevag AL, Aziz K, et al. Impact of changing clinical practices on early blood gas analyses in very preterm infants and their associated inpatient outcomes. Front Pediatr. (2017) 5:11. doi: 10.3389/fped.2017.00011
40. Newfield P, Cottrell JE. Handbook of Neuroanesthesia: Clinical and Physiologic Essentials. Boston, MA: Little Brown GBR (1983). doi: 10.1093/bja/59.7.947
41. Kretz FJ, Becke K. Anasthesie und Intensivmedizin bei Kindern. Padiatrische Praxis. Stuttgart: Georg Thieme Verlag KG (2008).
42. Botkin ND, Kovtanyuk AE, Turova VL, Sidorenko IN, Lampe R. Direct modeling of blood flow through the vascular network of the germinal matrix. Comput Biol Med. (2018) 92:147–55. doi: 10.1016/j.compbiomed.2017.11.010
43. Kaiser JR, Gauss CH, Pont MM, Williams DK. Hypercapnia during the first 3 days of life is associated with severe intraventricular hemorrhage in very low birth weight infants. J Perinatol. (2006) 26:279–85. doi: 10.1038/sj.jp.7211492
44. Perlman JM, Goodman S, Kreusser KL, Volpe JJ. Reduction in intraventricular hemorrhage by elimination of fluctuating cerebral blood-flow velocity in preterm infants with respiratory distress syndrome. N Engl J Med. (1985) 312:1353–7. doi: 10.1056/NEJM198505233122104
45. Gould IG, Tsai P, Kleinfeld D, Linninger A. The capillary bed offers the largest hemodynamic resistance to the cortical blood supply. J Cereb Blood Flow Metab. (2017) 37:52–68. doi: 10.1177/0271678X16671146
46. Linninger AA, Gould IG, Marinnan T, Hsu CY, Chojecki M, Alaraj A. Cerebral microcirculation and oxygen tension in the human secondary cortex. Ann Biomed Eng. (2013) 41:2264–84. doi: 10.1007/s10439-016-1722-3
47. Gould IG, Linninger AA. Hematocrit distribution and tissue oxygenation in large microcirculatory networks. Microcirculation (2015) 22:1–8. doi: 10.1111/micc.12156
48. Lorthois S, Cassot F, Lauwers F. Simulation study of brain blood flow regulation by intra-cortical arterioles in an anatomically accurate large human vascular network. Part II: flow variations induced by global or localized modifications of arteriolar diameters. Neuroimage (2011) 54:2840–53. doi: 10.1016/j.neuroimage.2010.10.040
Keywords: intraventricular hemorrhage, germinal matrix, cerebral autoregulation, gestational age, capillary wall tension
Citation: Sidorenko I, Turova V, Botkin N, Eckardt L, Alves-Pinto A, Felderhoff-Müser U, Rieger-Fackeldey E, Kovtanyuk A and Lampe R (2018) Modeling Cerebral Blood Flow Dependence on Carbon Dioxide and Mean Arterial Blood Pressure in the Immature Brain With Accounting for the Germinal Matrix. Front. Neurol. 9:812. doi: 10.3389/fneur.2018.00812
Received: 28 June 2018; Accepted: 10 September 2018;
Published: 09 October 2018.
Edited by:
Tomoki Arichi, King's College London, United KingdomReviewed by:
Thomas Alderliesten, University Medical Center Utrecht, NetherlandsSubhabrata Mitra, University College London, United Kingdom
Copyright © 2018 Sidorenko, Turova, Botkin, Eckardt, Alves-Pinto, Felderhoff-Müser, Rieger-Fackeldey, Kovtanyuk and Lampe. This is an open-access article distributed under the terms of the Creative Commons Attribution License (CC BY). The use, distribution or reproduction in other forums is permitted, provided the original author(s) and the copyright owner(s) are credited and that the original publication in this journal is cited, in accordance with accepted academic practice. No use, distribution or reproduction is permitted which does not comply with these terms.
*Correspondence: Renée Lampe, cmVuZWUubGFtcGVAdHVtLmRl