 Sofya Gorlova1
 Tomohisa Ichiba2
 Hiroshi Nishimaru1
 Yusaku Takamura1
 Jumpei Matsumoto1
 Etsuro Hori1Yoshinao Nagashima2Tsuyoshi Tatsuse3Taketoshi Ono1
 Hisao Nishijo1*
- 1System Emotional Science, Graduate School of Medicine and Pharmaceutical Sciences, University of Toyama, Toyama, Japan
- 2Personal Health Care Lab, KAO Corp, Tokyo, Japan
- 3Department of Epidemiology and Health Policy, Graduate School of Medicine and Pharmaceutical Sciences, University of Toyama, Toyama, Japan
Sleep is a physiological state that plays important role in the recovery of fatigue. However, the relationship between the physiological status of sleep and subjective fatigue remains unknown. In the present study, we hypothesized that the non-recovery of fatigue at wake time due to non-restorative sleep might be ascribed to changes in specific parameters of electroencephalography (EEG) and heart rate variability (HRV) in poor sleepers. Twenty healthy female shift-working nurses participated in the study. Subjective fatigue was assessed using the visual analog scale (VAS) at bedtime and wake time. During sleep on the night between 2 consecutive day shifts, the EEG powers at the frontal pole, HRV based on electrocardiograms, and distal-proximal gradient of skin temperature were recorded and analyzed. The results indicated that the subjects with high fatigue on the VAS at wake time exhibited (1) a decrease in deep non-rapid eye movement (NREM) (stageN3) sleep duration in the first sleep cycle; (2) a decrease in REM latency; (3) a decrease in ultra-slow and delta EEG powers, particularly from 30 to 65 min after sleep onset; (4) a decrease in the total power of HRV, particularly from 0 to 30 min after sleep onset; (5) an increase in the very low frequency component of HRV; and (6) a smaller increase in the distal-proximal gradient of skin temperature, than those of the subjects with low fatigue levels. The correlational and structural equation modeling analyses of these parameters suggested that an initial decrease in the total power of HRV from 0 to 30 min after sleep onset might inhibit the recovery from fatigue during sleep (i.e., increase the VAS score at wake time) via its effects on the ultra-slow and delta powers from 30 to 65 min after sleep onset, stageN3 duration in the first sleep cycle, REM latency, and distal-proximal gradient of skin temperature. These findings suggest an important role of these physiological factors in recovery from fatigue during sleep, and that interventions to modify these physiological factors might ameliorate fatigue at wake time.
Introduction
Sleep is a physiological state that plays important role in the recovery of fatigue (1). Extensive studies have reported some changes in the electroencephalography (EEG) power and heart rate variability (HRV) in various diseases (e.g., chronic fatigue syndrome, multiple sclerosis, and cancers) associated with sleep disturbances and fatigue. In chronic fatigue syndrome, patients exhibit sleep disturbance (2, 3), and changes in ultra-slow and delta powers as well as changes in HRV during sleep (4–7). Multiple sclerosis patients reported both sleep disturbance and fatigue, in which the former significantly contributed to the latter (8, 9). In cancer patients and cancer survivors, sleep disorders and fatigue are prevalent, and cancer-related fatigue is correlated with various subjective sleep parameters such as sleep quality (10). Interventions for optimizing sleep quality could lower fatigue in such patients (11). However, the direct relationship between fatigue and the objectively measured quality and quantity of sleep remains unknown (1, 12).
The association between shift work and fatigue in workers has been examined extensively. The problems related to rotational-shift work affect sleep and work performance (13–15). Nurses with greater fatigue and poorer sleep quality more often made decisions that they later regretted (16). However, there are individual differences in the sensitivity to shift work among shift workers (17). Our recent study on nurses found that the subjective fatigue at wake time while they worked the day off to day shift and day shift to day shift was significantly higher in poor sleepers than in good sleepers (18). These results suggest that certain physiological factors during sleep might be related to individual differences (i.e., good vs. poor sleepers), which might in turn affect subjective fatigue at wake time.
In the present study, we hypothesized that fatigue at wake time might be ascribed to “non-restorative sleep,” which is linked to specific changes in EEG and HRV parameters in poor sleepers. To investigate this issue, we analyzed the relationship between subjective fatigue at wake time and the physiological parameters during sleep in shift nurses, in the same situation as in our previous study (18) (i.e., the nurses worked the same shift schedule and slept at home). For this purpose, the physiological data were recorded from the nurses at their home while they worked similar shift work schedules.
Materials and Methods
Subjects
Twenty healthy female full-time nurses (mean age 35.0 ± 2.0 years; mean ± SEM) working at the Toyama University Hospital participated in the study. The nurses were neither pregnant nor breastfeeding. They were instructed to refrain from drinks that contain caffeine or alcohol after dinner. Data from one subject who consumed alcohol on the night of recording were excluded from the analysis, leaving a total of 19 subjects for further data analysis (mean age 34.7 ± 2.1 years). The inclusion criteria for subject selection were as follows: (1) female nurses who worked in the university hospital in a specific shift work pattern (see next section). The exclusion criteria for subject selection were as follows: (1) subjects who routinely took medicines such as sleeping pills; (2) subjects who were receiving medical treatment; (3) subjects who could not attach probes on own body by themselves; (4) subjects who had allergies to medical tapes; (5) subjects whose sleep period time were < 270 min on the experimental day; (6) subjects who took drinks including caffeine or alcohol in and after the dinner on the experimental day. All subjects were treated in strict compliance with the Declaration of Helsinki and the U.S. code of Federal Regulations for the Protection of Human Subjects. The experiments were conducted with the understanding and informed written consent of each subject, and approved by the Clinical Research and Ethics Committee at the University of Toyama.
Study Schedule
The data were recorded from nurses who were engaged in the following shift schedule; day off (day 1), 8 h day shift for 2 days (days 2 and 3), and one 18 h night shift (days 4 and 5) (the day off—day shift—day shift—night shift [ODDN] schedule) (Figure 1). Prior to the ODDN schedule, all subjects were trained to attach an EEG/electrocardiogram (ECG) device and skin temperature electrodes, and performed a trial night at home. We confirmed that all subjects could correctly record EEGs and ECGs in a trial recording. Furthermore, prior to the ODDN schedule, the subjects completed three self-report questionnaires including the Pittsburgh Sleep Quality Index (PSQI), and Morningness-eveningness questionnaire (MEQ). On the night of day 2, EEGs, ECGs, and skin temperature were recorded at home. On the physiological recording days (before bedtime on day 2 and after wake-up on day 3), the nurses rated their current anxiety using the state anxiety questionnaires in State-Trait Anxiety Inventory (STAI-S), subjective fatigue using the Visual Analog Scale (VAS), and subjective sleepiness using the Karolinska sleepiness scale (Japanese version) (KSS-J) before bedtime on day 2. Furthermore, after they woke on day 3, they also assessed their subjective sleep quality using the St. Mary's hospital (SMH) sleep questionnaire, and rated their subjective fatigue using the VAS and current subjective level of sleepiness using the KSS-J. The subjects were instructed to measure blood pressure on the physiological recording days (before bedtime on day 2 and after waking on day 3).
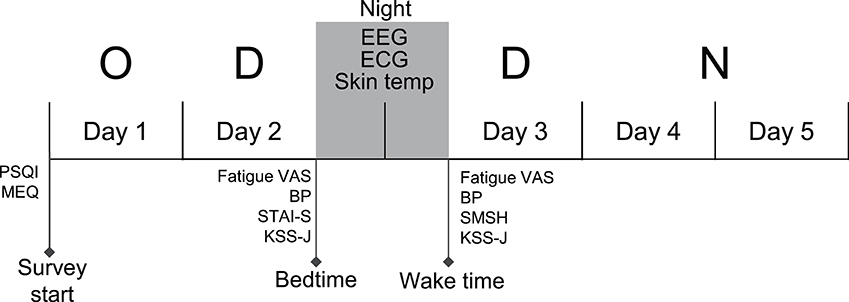
Figure 1. Experimental and shift schedule during the survey. The EEGs, ECGs, and skin temperature (Skin temp) were recorded on the night between consecutive dayshift (between day 2 and day 3). Fatigue and other subjective parameters were measured at bedtime on day 2 and at wake time on day 3, respectively. O, Day Off; D, Day shift; N, Night shift; PSQI, Pittsburgh Sleep Quality Index; MEQ, Morningness-Eveningness Questionnaire; STAI-S, state anxiety questionnaires of State-Trait Anxiety Inventory; VAS, visual analog scale; SMSH, Saint Mary's Hospital Sleep Questionnaire; KSS-J, Karolinska Sleepiness Scale (Japanese version); BP, blood pressure.
Questionnaires
The PSQI is widely used for clinical purposes in order to assess subjective sleep quality over a 1 month period, and consists of 19 items in seven domains (19). The total score ranges from 0 to 21, with a lower score indicating better sleep quality. The MEQ consists of 19 items measuring the degree to which the respondent favors morning over evening (20), with high and low scores representing morningness and eveningness, respectively. The STAI-S is a commonly used inventory for measure of state anxiety levels (21).
Subjective fatigue was rated using the VAS (18, 22, 23). Subjective sleep quality (e.g., sleep depth, sleep quality, satisfaction) was rated using the SMH sleep questionnaire (24), and the current subjective level of sleepiness was rated using Karolinska sleepiness scale (Japanese version) (25).
Physiological Recordings
The active/rest cycle and sleep/wake parameters were measured throughout the study period using the Actiwatch Spectrum Plus® (Philips Respironics, Bend Oregon). EEGs and ECGs were recorded during sleep at home using a single-channel portable EEG device (Brainwave Sensor ZA®; Proasist, Osaka, Japan) at a sampling rate of 128 Hz. The participants were instructed to place disposable surface electrodes at the center of the forehead and right mastoid process (for the EEG) and another two electrodes were placed on the chest to record ECGs (lead II).
The nocturnal skin temperature was recorded on the same night using nine temperature loggers (iButton® DS1920; Maxim Integrated, CA, USA). The temperature loggers were placed on the bilateral subclavian regions, center of the abdomen at 1 cm above the navel, bilateral lunate bones on the palmar side, center of the thigh on the bilateral limbs, and bilateral regions below the medial malleolus (26).
Data Analysis
In accordance with the original criteria (27, 28), sleep stages were determined by visual inspection of the EEG data recorded from the frontal pole during each 30 s epoch by a clinical professional technologist, and classified into the four sleep stages; (1) awake (stageW), (2) rapid eye movement (REM) sleep (stageR), (3) light non-REM (NREM) sleep (stageN1 and stageN2), and (4) deep NREM sleep (stageN3). Simultaneous sleep recordings using the single-channel EEG device with single-channel EOGs (Brainwave Sensor ZA®) and conventional polysomnography according to the AASM Manual Scoring rules Ver. 2.1 (29) indicated that sleep stage scoring based on single channel EEGs using the same device as that in the present study was comparable to the scoring based on polysomnography according to the AASM Manual Scoring rules Ver. 2.1 (28). Furthermore, sleep stage scoring based on single-channel EEG recording from the frontal pole without EOG and EMG recording was comparable to that with conventional polysomnography, although the EEG device different from, but very similar to, the present device was used (30), which has been previously applied to measurements of REM latency (31). Other sleep components including the time in bed (TIB) (time elapsed from going to bed to final arising), sleep period time (SPT) (time elapsed from sleep onset to the last epoch of sleep), total sleep time (TST) (duration of time spent in NREM and REM during SPT), sleep latency (time elapsed from going to bed to sleep onset), wake time after sleep onset (WASO) (total time of wake stage >60 s after sleep onset), and sleep efficiency (ratio of TST/SPT) were calculated (27). REM sleep onset latency (REM latency) was defined as the time interval between sleep onset and the first occurrence of an epoch of REM sleep. The above parameters to assess sleep architectures were derived from the whole night recording. Based on the EEG sleep stage analysis, a total of 250 min of the data of EEGs, ECGs, and body temperature around sleep onset (5 min before sleep onset and 245 min after sleep onset) were further analyzed in the present study (see below).
Spectral analysis of the EEGs using a fast Fourier transform with a Hanning window was performed every 30 s using commercial software (SleepSign-Lite; KISSEI COMTEC Co., Ltd., Matsumoto, Japan) in the following bands: ultra-slow (0.3–0.8 Hz), delta (0.8–4.0 Hz), theta (4.0–8.0 Hz), alpha (8.0–12.0 Hz), sigma (12.0–16.0 Hz), and beta (16.0–30 Hz). In the individual bands, the mean spectral power density and standard deviation (SD) were computed. The spectral power data in all bands in the epoch in which the mean power of the delta wave exceeded the mean+3SD were excluded from the analysis as noise (32). The 30 s epochs that were assigned as the awake stage were also excluded from the analysis. The mean power was then computed in every 5 min epoch in each band in each subject. The power spectrum data in the 5 min epochs were natural-log transformed for further analyses. The data of the 5 min epochs in each band were also normalized by mean power density across the total sleep period (33).
A total of 250 min of data of the ECGs around sleep onset (5 min before sleep onset and 245 min after sleep onset, i.e., 50 5 min epochs) were analyzed. HRV based on the R-R intervals was analyzed using commercial software with the maximum-entropy method (MemCalc/Win ver2.0; GMS Co., Ltd., Tokyo) (34). Frequency domain spectral analysis of the HRV, which was downsampled to generate a signal to be analyzed for the spectral analysis, was performed on each 120 s epoch, which was shifted by 30 s; the power spectrum was computed every 30 s in a 120 s window (33). The following four power spectrum components were analyzed; very low frequency (VLF) (0.003–0.04 Hz), low frequency (LF) (0.04–0.15 Hz), high frequency (HF) (0.15–0.4 Hz), and total power (0.003–0.4 Hz). Furthermore, the ratio of LF to HF power (LF/HF) was estimated. The mean power spectrum or LF/HF ratio was then computed for every 5 min epoch. These data were natural-log transformed.
The skin temperature of each body region was averaged for every 5 min epoch. The distal-proximal gradient of the skin temperature was calculated by subtracting the proximal temperature (mean temperature between the bilateral subclavicular regions) from the peripheral temperature (mean temperature among the bilateral feet and hands). The difference in distal-proximal gradient of the skin temperature (dDPG) was then computed by subtracting the mean baseline data of distal-proximal gradient of the skin temperature for 30 min before sleep onset from the data after sleep onset.
Grouping of the Subjects and Statistical Analysis
The subjects were divided into two groups based on subjective fatigue (as determined by the VAS) at wake time on day 3; the low fatigue group (n = 12, fatigue VAS score of ≤5.0) and the high fatigue group (n = 7, fatigue VAS score of >5.0). The physiological data over 250 min (50 5 min epochs) were analyzed by a two-way analysis of variance (ANOVA) with “group” and “time” as factors. Furthermore, correlations between possible two factors were analyzed by simple linear regression analysis. The significance level was set at p < 0.05 except for post-hoc multiple comparisons. Post-hoc multiple comparisons after two-way ANOVA were performed using Bonferroni test with a significant adjusted p < 0.05. The all data were presented as mean values ± standard error of the mean (SEM).
Based on the above correlation analyses, seven autonomic and EEG-related variables were identified as potential factors that might affect the VAS score at wake time (see Results). Furthermore, based on the temporal relationships among these eight variables, a path diagram for the hypothesized set of relationships was created and analyzed by structural equation modeling. Structural equation modeling is a collection of statistical techniques that allow analysis of a set of relationships among multiple factors or measured variables (35). The structural equation modeling analyses were conducted using IBM SPSS AMOS V. 20. To assess the fitness of the hypothetical model, the root mean square error of approximation (RMSEA); comparative fit index (CFI), which is identical to relative non-centrality index; and Tucker-Lewis index (TLI), in addition to χ2 values and χ2/df, were used (36). Furthermore, bootstrap resampling of the original sample was performed using the same software, and the resampled data were re-analyzed by structural equation modeling. The sample size of the resampled data was set at n = 10,000 (37).
Results
Baseline and Psychological Characteristics
The baseline and psychological data of the subjects are presented in Table 1. There were no significant differences in the baseline characteristics (age, height, body weight, and body mass index, and blood pressure) between the low and high fatigue groups (t-test, p > 0.05). Furthermore, there were no significant differences in the PSQI, MEQ, and STAI-S scores as well as KSS-J scores at bedtime and wake time between the two groups (t-test, p > 0.05). In addition, there were no significant differences in sleepiness (responses to SMH questionnaires) between the two groups (t-test, p > 0.05) (Supplementary Table 1). The high fatigue group reported higher VAS scores (Fatigue VAS) at wake time than did the low fatigue group (t-test, p < 0.0001) based on definition of the two groups. However, there were no significant differences in the VAS scores at bedtime between the two groups (t-test, p > 0.05). Furthermore, statistical analysis of the VAS score at bedtime and wake time by a two-way ANOVA with “group” (low vs. high fatigue groups) and “time” (bedtime vs. wake time) as factors indicated that there were significant main effects of group [F(1, 34) = 26.95, p < 0.0001] and time [F(1, 34) = 32.24, p < 0.0001], and a significant interaction between group and time [F(1, 34) = 4.517, p = 0.0409] (Figure 2). Post-hoc tests indicated that the VAS score in the low fatigue group was significantly smaller at wake time than at bedtime (Bonferroni test, p < 0.0001), and that the VAS score at wake time was significantly smaller in the low fatigue group than in the high fatigue group (Bonferroni test, p < 0.05). However, there were no significant differences in the VAS score between bedtime and wake time in the high fatigue group (Bonferroni test, p > 0.05). These findings indicated that VAS fatigue was decreased at wake time after sleep in the low fatigue group, but not in the high fatigue group.
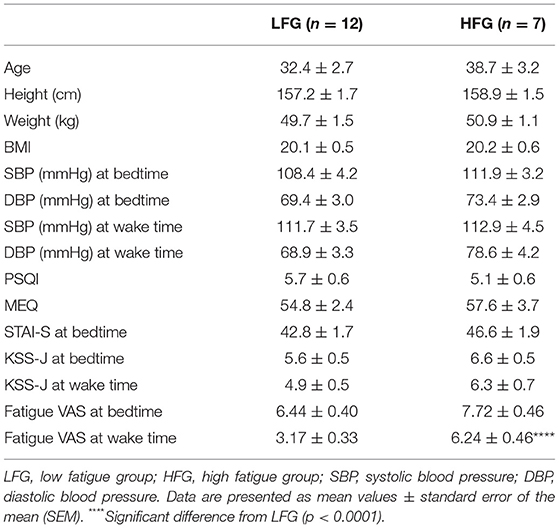
Table 1. Comparison of the baseline characteristics between the LFG and HFG.
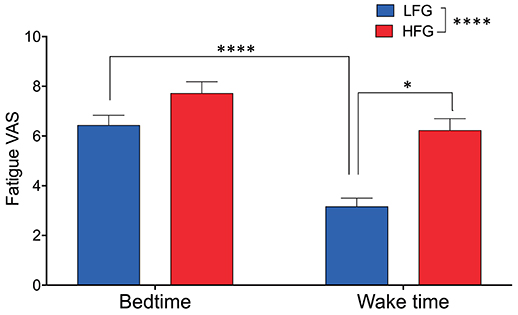
Figure 2. Comparison of subjective feeling of fatigue between the low fatigue and high fatigue groups. LFG, low fatigue group; HFG, high fatigue group. *p < 0.05, ****p < 0.0001.
Sleep Architectures and EEG Analysis
Table 2 presents the sleep architectures in the low and high fatigue groups. There were no significant differences in the TIB, SPT, TST, sleep efficiency, WASO, REM duration, and light NREM duration between the low and high fatigue groups (t-test, p > 0.05). However, the stageN3 sleep duration in the whole sleep period tended to be shorter in the high fatigue group than the low fatigue group (t-test, p = 0.0505), and the stageN3 sleep duration in sleep cycle 1 was significantly shorter in the high fatigue group than the low fatigue group (t-test, p < 0.05). Furthermore, the REM latency was significantly shorter in the high fatigue group than in the low fatigue group (t-test, p < 0.05).
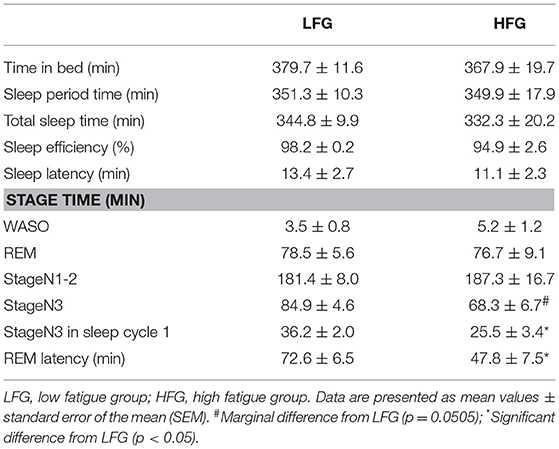
Table 2. Comparison of sleep architectures between the LFG and HFG.
Figure 3 provides the results derived from the power spectrum analysis in each frequency band for the first 250 min of sleep. The data in each frequency band were natural-log transformed; beta power (Ln Beta) (Figure 3A), sigma power (Ln Sigma) (Figure 3B), alpha power (Ln Alpha) (Figure 3C), theta power (Ln Theta) (Figure 3D), delta power (Ln Delta) (Figure 3E), and ultra-slow power (Ln US) (Figure 3F). The data in each frequency band were analyzed by two-way ANOVA with “group” and “time” as factors, and summary of the statistical results was shown in Table 3. The results indicated that there were significant main effects of group as well as time in Ln Beta, Ln Theta, Ln Delta, and Ln US (Table 3). However, there was no significant interaction between group and time in the all frequency bands (Table 3). Furthermore, consistent with the decreased stageN3 duration in sleep cycle 1 in the high fatigue group (Table 2), the mean Ln Delta from 30 to 65 min after sleep onset (Ln Delta_30–65 min) was significantly smaller in the high fatigue group than in the low fatigue group (t-test, p = 0.0268) (Figure 3E, inset). In addition, the mean Ln US from 30 to 65 min after sleep onset (Ln US_30–65 min) was significantly smaller in the high fatigue group than in the low fatigue group (t-test, p = 0.0425) (Figure 3F, inset).
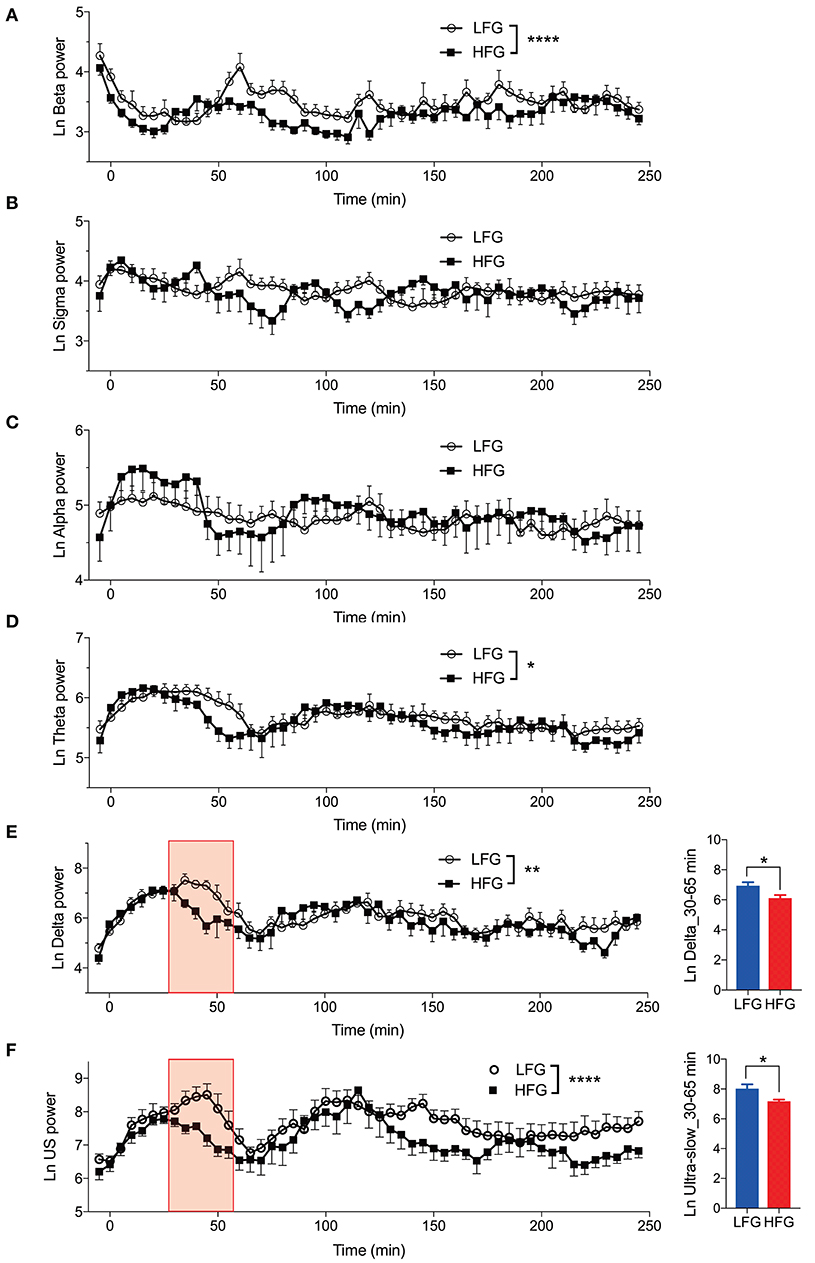
Figure 3. Changes in the electroencephalography powers during sleep. (A) Changes in the natural-log transformed beta power (Ln Beta). (B) Changes in the natural-log transformed sigma power (Ln Sigma). (C) Changes in the natural-log transformed alpha power (Ln Alpha). (D) Changes in the natural-log transformed theta power (Ln Theta). (E) Changes in the natural-log transformed delta power (Ln Delta). The inset indicates the difference in the mean natural-log transformed delta power from 30 to 65 min (red-colored shaded area) after sleep onset (Ln Delta_30–65 min) between the high fatigue group (HFG) and the low fatigue group (LFG). (F) Changes in the natural-log transformed ultra-slow power (Ln US). The inset indicates the difference in the mean natural-log transformed ultra-slow power from 30 to 65 min (red-colored shaded area) after sleep onset (Ln US_30–65 min) between the HFG and LFG. *p < 0.05, **p < 0.01, ****p < 0.0001, respectively.
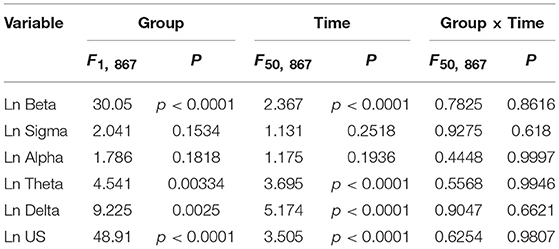
Table 3. Summary of the statistical results in the EEG data analyses by two-way ANOVA with “group” and “time” as factors in each frequency band.
Figure 4 presents the normalized EEG powers, relative to the mean power across the whole sleep, in each frequency band across the three sleep cycles. The normalized data in each frequency band were analyzed by two-way ANOVA with “group” and “sleep cycle” as factors, and summary of the statistical results was shown in Table 4. The results indicated that there were significant main effects of sleep cycle in the normalized US, delta, theta, alpha, and sigma powers (Table 4). Post-hoc tests for the normalized ultra-slow (US) power indicated that the mean normalized US power was larger in sleep cycle 2 than in sleep cycles 1 and 3 (Bonferroni test, p = 0.0104 and 0.0049, respectively) (Figure 4A). Post-hoc tests for the normalized delta power indicated that the mean normalized delta power was large r in sleep cycle 1 than in sleep cycle 2, and larger in sleep cycle 2 than in sleep cycle 3 (Bonferroni test, p = 0.0020 and p < 0.0001, respectively) (Figure 4B). Post-hoc tests for the normalized theta power indicated that the mean normalized theta power was larger in sleep cycle 1 than in sleep cycle 2, and larger in sleep cycle 2 than in sleep cycle 3 (Bonferroni test, p < 0.0001) (Figure 4C). Post-hoc tests for the normalized alpha power indicated that the mean normalized alpha power was larger in sleep cycle 1 than in sleep cycles 2 and 3 (Bonferroni test, p = 0.0019 and p < 0.0001, respectively) (Figure 4D). Post-hoc tests for the normalized sigma power indicated that the mean normalized sigma power was larger in sleep cycle 1 than in sleep cycles 2 and 3 (Bonferroni test, p < 0.0001) (Figure 4E). Furthermore, there was a significant interaction between group and sleep cycle only in the normalized delta power (Table 4). The post-hoc test for the interaction indicated that the mean normalized delta power was significantly smaller in the high fatigue group than the low fatigue group in sleep cycle 1 (Bonferroni test, p = 0.0312).
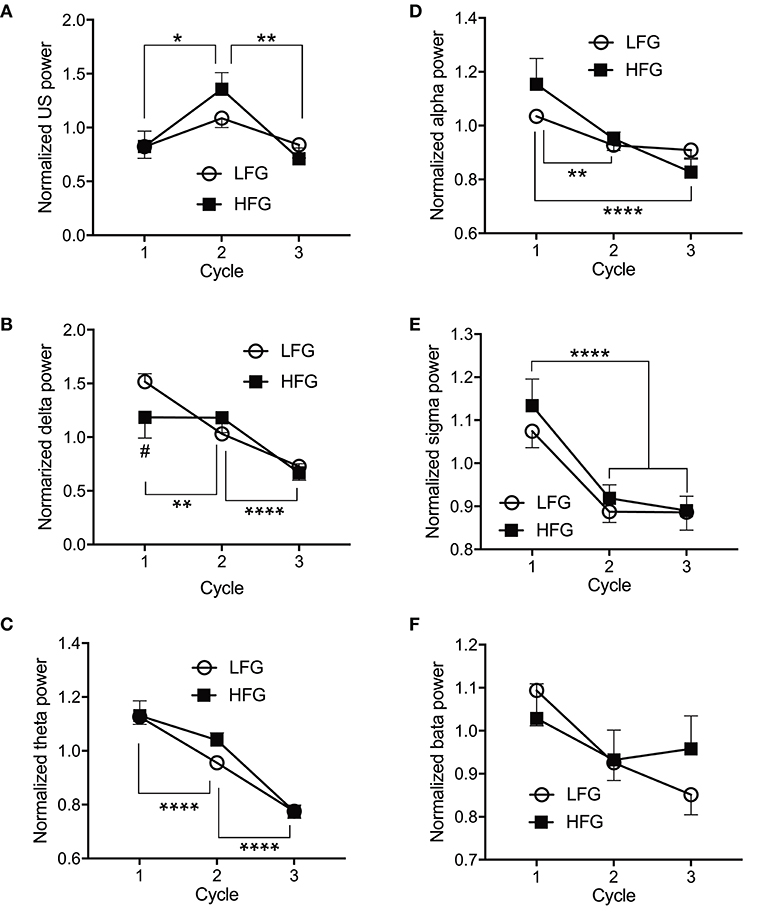
Figure 4. Comparison of the normalized electroencephalography powers across the three initial sleep cycles. (A) The normalized ultra-slow (US) power. (B) The normalized delta power. (C) The normalized theta power. (D) The normalized alpha power. (E) The normalized sigma power. (F) The normalized beta power. LFG, low fatigue group; HFG, high fatigue group; cycle, sleep cycle. *p < 0.05, **p < 0.01, ****p < 0.0001, respectively. #Significant difference from the LFG (p < 0.05).
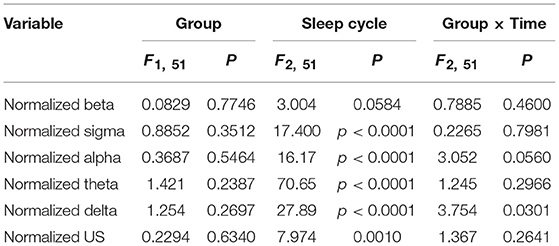
Table 4. Summary of the statistical results in the normalized EEG data analyses by two-way ANOVA with “group” and “sleep cycle” as factors in each frequency band.
The above results indicated that there were significant differences in the four parameters [the stageN3 sleep duration in sleep cycle 1, REM latency, and slow waves (delta and ultra-slow waves)] between the two groups. Figure 5 indicates the relationships between these parameters. Statistical analyses by simple regression analysis indicated that the stageN3 sleep duration in sleep cycle 1 (stageN3 duration in cycle 1) was significantly and positively correlated with the mean Ln US in sleep cycle 1 (Ln US_cycle1) [F(1, 17) = 10.86, p = 0.0043] (Figure 5A) and those from 30 to 65 min after sleep onset (Ln US_30–65 min) [F(1, 17) = 7.412, p = 0.0145] (Figure 5B). Furthermore, statistical analyses by simple regression analysis indicated that the stageN3 duration in cycle 1 was significantly and positively correlated with the mean Ln Delta in sleep cycle 1 (Ln Delta_cycle1) [F(1, 17) = 6.128, p = 0.0241] (Figure 5C) and the Ln Delta_30–65 min [F(1, 17) = 7.027, p = 0.0168] (Figure 5D). In addition, statistical analysis by simple regression analysis indicated that the REM latency was significantly and positively correlated with the stageN3 duration in cycle 1 [F(1, 17) = 5.145, p = 0.0366] (Figure 5E). These results suggest that the decrease in the stageN3 duration in sleep cycle 1 and the REM latency in the high fatigue group (Table 2) might be ascribed to the decrease in the ultra-slow and delta powers in the high fatigue group.
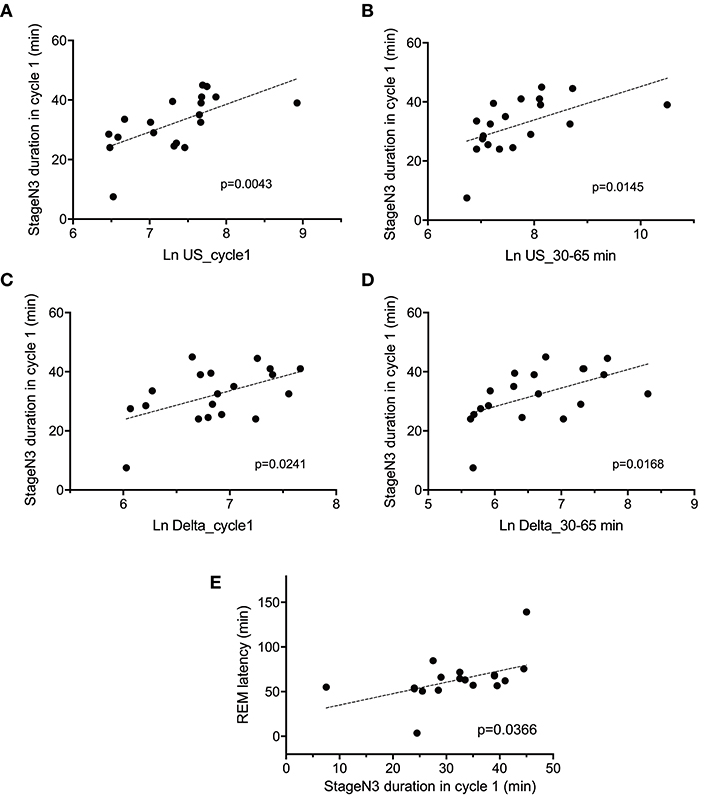
Figure 5. Correlation between the deep non-rapid eye movement sleep duration in sleep cycle 1 and the electroencephalography parameters. Correlations of the stageN3 duration in sleep cycle 1 (stageN3 duration in cycle 1) with (A) the mean natural-log transformed ultra-slow powers in sleep cycle 1 (Ln US_cycle1), (B) the mean natural-log transformed ultra-slow powers from 30 to 65 min after sleep onset (Ln US_30–65 min), (C) the mean natural-log transformed delta powers in sleep cycle 1 (Ln Delta_cycle1), (D) the mean natural-log transformed delta powers from 30 to 65 min after sleep onset (Ln Delta_30–65 min), and (E) the REM latency.
Autonomic Activity During Sleep
Figures 6A–E presents the changes in natural-log transformed HRV parameters during sleep in the low and high fatigue groups. The natural-log transformed HRV data were analyzed by two-way ANOVA with “group” and “time” as factors, and summary of the statistical results was shown in Table 5. The statistical results indicated that there were significant main effects of group in the natural-log transformed LF (Ln LF), natural-log transformed VLF (Ln VLF), and natural-log transformed total power (Ln TP) (Table 5), while there were significant main effects of time in the natural-log transformed HF (Ln HF), Ln VLF, and Ln TP (Table 5). Furthermore, there was a significant interaction between group and time only in Ln TP (Table 5). Post-hoc tests for the interaction indicated that the Ln TP was smaller in the high fatigue group than in the low fatigue group in the 7th epoch (from 25 to 30 min after sleep onset) (Bonferroni test, p < 0.0001). In addition, the mean Ln VLF from 30 to 65 min after sleep onset (Ln VLF_30–65 min) was significantly greater in the high fatigue group than in the low fatigue group (t-test, p = 0.0400) (Figure 6D, inset), while the mean Ln TP from 0 to 30 min after sleep onset (Ln TP_0–30 min) was significantly smaller in the high fatigue group than in the low fatigue group (t-test, p = 0.0108) (Figure 6E, inset).
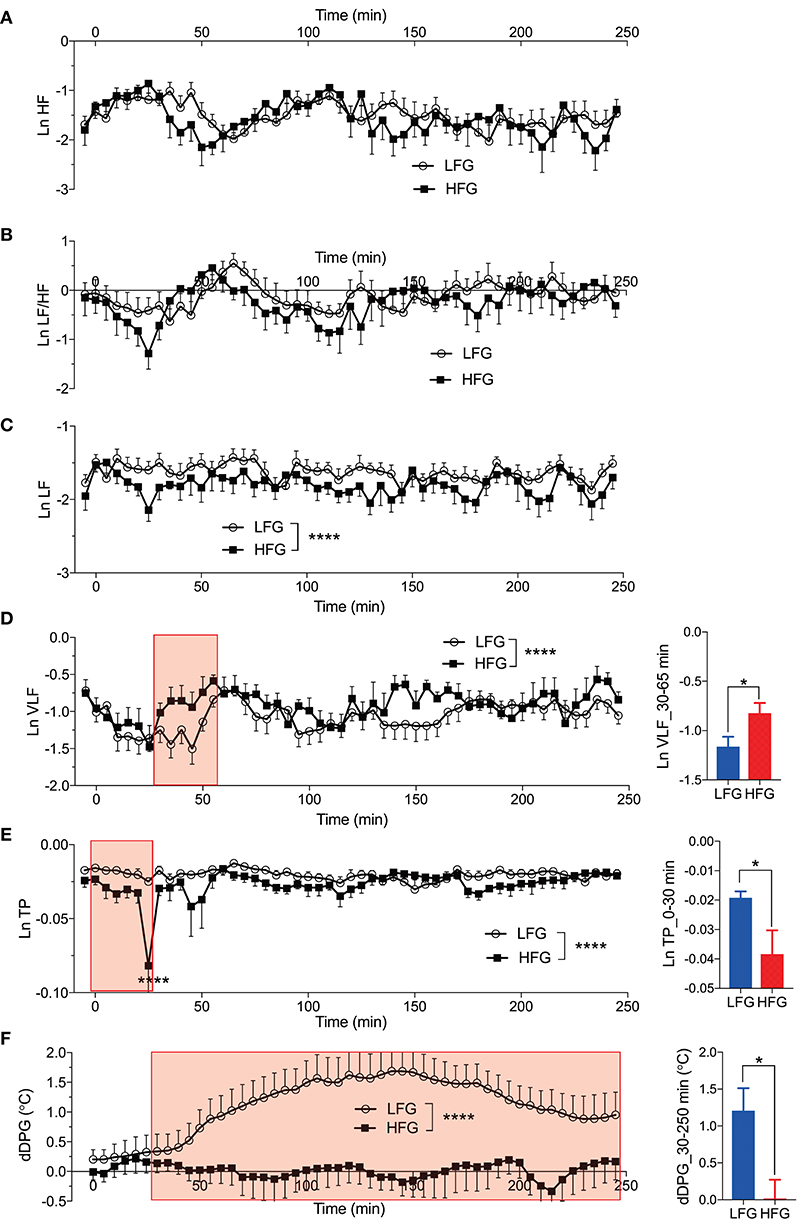
Figure 6. Changes in the autonomic parameters during sleep. (A) Changes in the natural-log transformed high frequency (HF) (Ln HF). (B) Changes in the natural-log transformed low frequency (LF)/HF (Ln LF/HF). (C) Changes in the natural-log transformed LF (Ln LF). (D) Changes in the natural-log transformed very low frequency (VLF) (Ln VLF). The inset indicates the comparison of the mean Ln VLF from 30 to 65 min (red-colored shaded area) after sleep onset (Ln VLF_30–65 min) between the low fatigue group (LFG) and the high fatigue group (HFG). (E) Changes in the natural-log transformed total power (Ln TP). The inset indicates the comparison of the mean Ln TP from 0 to 30 min (red-colored shaded area) after sleep onset (Ln TP_0–30 min) between the HFG and the LFG. (F) Changes in the difference distal-proximal gradient (dDPG). The inset indicates the comparison of the mean dDPG from 30 to 250 min (red-colored shaded area) after sleep onset (dDPG_30–250 min) between the HFG and LFG. *p < 0.05, ****P < 0.0001, respectively.
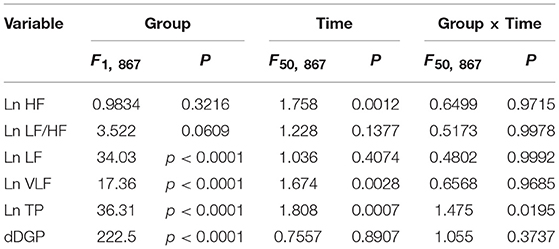
Table 5. Summary of the statistical results in the autonomic data analyses by two-way ANOVA with “group” and “time” as factors in each frequency band.
In the dDPG (Figure 6F), statistical analysis by two-way ANOVA indicated that there was a significant main effect of group, but no significant interaction between group and time (Table 5). Furthermore, the mean dDPG from 30 to 250 min after sleep onset (dDPG_30–250 min) was significantly greater in the low fatigue group than in the high fatigue group (t-test, p = 0.0163) (Figure 6F, inset). These results indicated that there were also significant differences in the autonomic parameters during sleep between the low and high fatigue groups.
Relationships Between the VAS Score and the EEG and Autonomic Parameters
We then analyzed the relationships between the fatigue VAS score at wake time and the EEG and autonomic parameters with significant differences between the low and high fatigue groups. Statistical analyses by simple regression analyses indicated that four parameters were found to be significantly correlated with fatigue as evaluated by the VAS at wake time (Figure 7); fatigue VAS at wake time was significantly and negatively correlated with the stageN3 duration in cycle 1 [F(1, 17) = 10.02, p = 0.0056] (Figure 7A) and the dDPG_30–250 min [F(1, 17) = 9.006, p = 0.0080] (Figure 7B). Furthermore, fatigue VAS at wake time was significantly and negatively correlated with the Ln TP_0-30 min [F(1, 17) = 10.83, p = 0.0043] (Figure 7C) and the REM latency [F(1, 17) = 8.151, p = 0.0110] (Figure 7D).
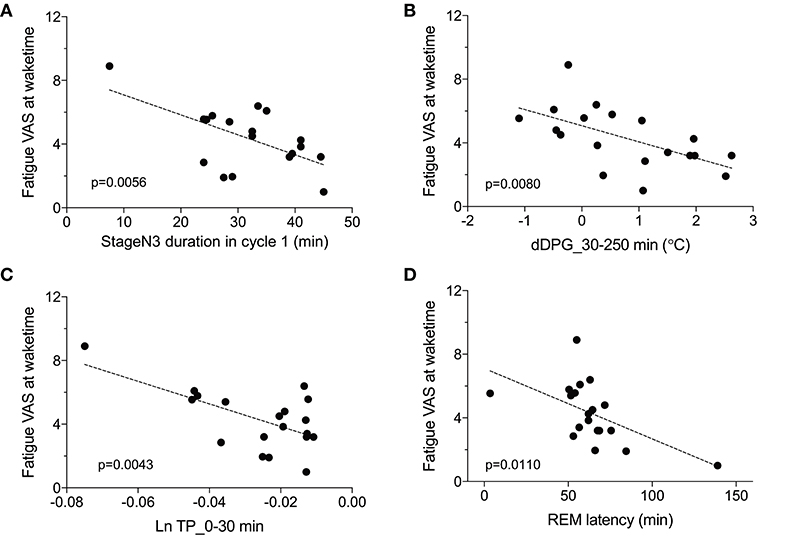
Figure 7. Parameters correlated with fatigue as determined by the visual analog scale at wake time (Fatigue VAS at waketime). (A) Correlation with the stageN3 duration in sleep cycle 1 (stageN3 duration in cycle 1). (B) Correlation with the mean difference distal-proximal gradient (dDPG) from 30 to 250 min after sleep onset (dDPG_30–250 min). (C) Correlation with the mean natural-log transformed total power from 0 to 30 min after sleep onset (Ln TP_0–30 min). (D) Correlation with the rapid eye movement (REM) latency.
The above data in Figure 7 indicate that fatigue VAS at wake time was correlated with four parameters (stageN3 duration in cycle 1, dDPG_30–250 min, Ln TP_0–30 min, and REM latency). Furthermore, stageN3 duration in cycle 1 was correlated to Ln US_cycle1, Ln US_30–65 min, Ln Delta_cycle1, and Ln Delta_30–65 min (Figure 5). Among these parameters, the Ln TP_0–30 min underwent the earliest changes. This suggests that changes in the remaining parameters might be induced by changes in Ln TP_0–30 min. We analyzed this possibility; Figure 8 demonstrates the relationships between the Ln TP_0–30 min and other factors. Statistical analyses by simple regression analysis indicated that the Ln TP_0–30 min was significantly and positively correlated with the stageN3 duration in cycle 1 [F(1, 17) = 22.67, p = 0.0002] (Figure 8A), and tended to be positively correlated with the dDPG_30–250 min [F(1, 17) = 4.364, p = 0.052] (Figure 8B). The significant correlation of the Ln TP_0–30 min with the stageN3 duration in cycle 1 might be mediated via the effect of the Ln TP_0–30 min on the ultra-slow and delta powers. Consistent with this notion, the Ln TP_0–30 min tended to be positively correlated with the Ln US_30–65 min [F(1, 17) = 4.079, p = 0.0595] (Figure 8C), and with the mean Ln US_cycle1 [F(1, 17) = 4.431, p = 0.0505] (Figure 8D). Furthermore, the Ln TP_0–30 min was significantly and positively correlated with the Ln Delta_30–65 min [F(1, 17) = 6.585, p = 0.0200] (Figure 8E), and tended to be positively correlated with the Ln Delta_cycle1 [F(1, 17) = 3.795, p = 0.0681] (Figure 8F).
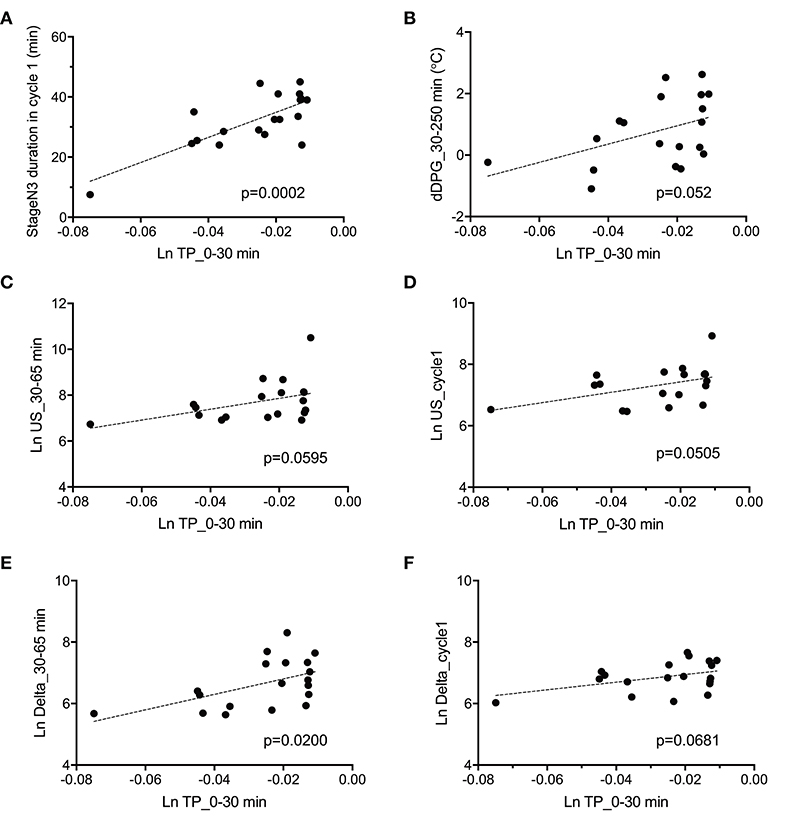
Figure 8. Parameters correlated with total power during the initial phase of sleep (Ln TP_0–30 min). (A) Correlation with the stageN3 duration in sleep cycle 1 (stageN3 duration in cycle 1). (B) Correlation with the mean difference distal-proximal gradient (dDPG) from 30 to 250 min after sleep onset (dDPG_30–250 min). (C) Correlation with the mean natural-log transformed ultra-slow power (Ln US) from 30 to 65 min after sleep onset (Ln US_30–65 min). (D) Correlation with the mean Ln US in sleep cycle 1 (Ln US_cycle1). (E) Correlation with the mean natural-log transformed delta power (Ln Delta) from 30 to 65 min after sleep onset (Ln Delta_30–65 min). (F) Correlation with the mean Ln Delta in sleep cycle 1 (Ln Delta_cycle1).
The above results identified the six possible variables (the Ln TP_0–30 min, Ln US_30–65 min, Ln Delta_30–65 min, dDPG_30–250 min, stageN3 duration in cycle 1, and REM latency) with an additional factor of LnVLF_30–65 min that was increased in the high fatigue group, which might affect fatigue VAS at wake time. Based on the time when the variables changed and the linear relationships between the variables, we hypothesized that the initial decrease in the Ln TP_0–30 min might increase fatigue VAS at wake time via the changes in the Ln US_30–65 min, Ln Delta_30–65 min, dDPG_30–250 min, Ln VLF_30–65 min, stageN3 duration in cycle 1, and REM latency (Figure 9) (see the Discussion). This hypothetical model was analyzed by structural equation modeling. The overall fit indices of the model indicated that fitting with the data was acceptable [χ2 = 14.623, (p = 0.479); df = 15; χ2/df = 0.975; CFI = 1.000; RMSEA = 0.000; TLI = 1.013]. However, it was noted that the path from the Ln US_30–65 min to the stageN3 duration in cycle1 and another path from the REM latency to fatigue VAS at wake time was not significant (p > 0.05). We then analyzed the modified model in which these two paths were deleted (Figure 10). The results indicated that fitting with the data was acceptable [χ2 = 17.756, (p = 0.404); df = 17; χ2/df = 1.044; CFI = 0.986; RMSEA = 0.050; TLI = 0.977]. All paths aside from the Ln TP_0–30 min to the Ln VLF_30–65 min path were significant (p < 0.05). We further analyzed this modified model by bootstrapping (n = 10,000). The bootstrapping data confirmed the same results as those in the original data (n = 19); all paths aside from the Ln TP_0–30 min to the Ln VLF_30–65 min path were significant.
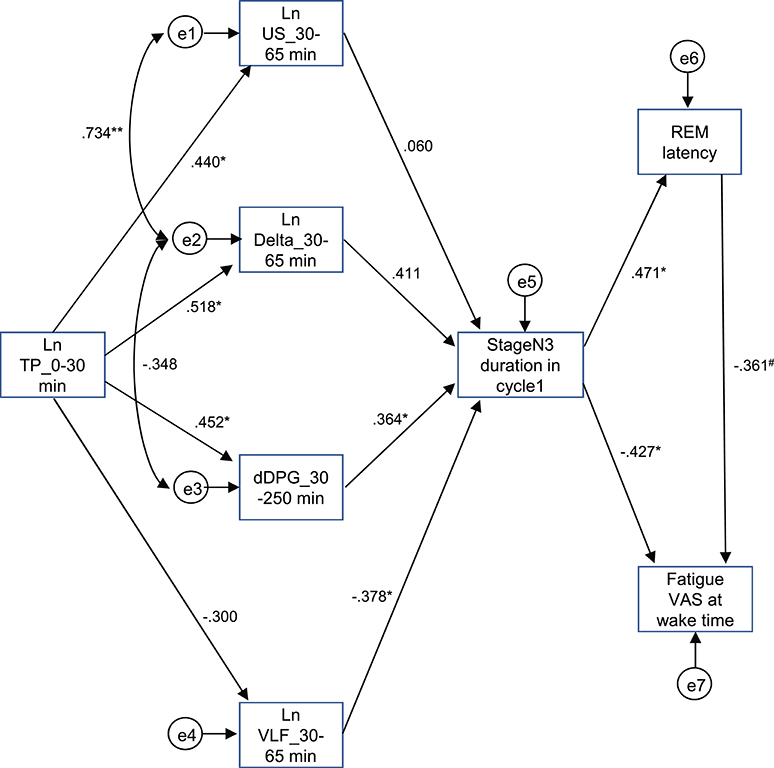
Figure 9. Diagram and results derived from structural equation modeling with eight observed variables. Single-headed arrows (paths) indicate the causal relationships in the model, with the variable at the tail of the arrow causing the variable at the point. Double-headed arrows indicate covariances or correlations, without a causal interpretation. Statistically, the single-headed arrows (paths) represent regression coefficients, while the double-headed arrows represent covariances. e1-8, measurement errors. Values near the arrows indicate standardized regression coefficients. *p < 0.05, **p < 0.01, #p < 0.1.
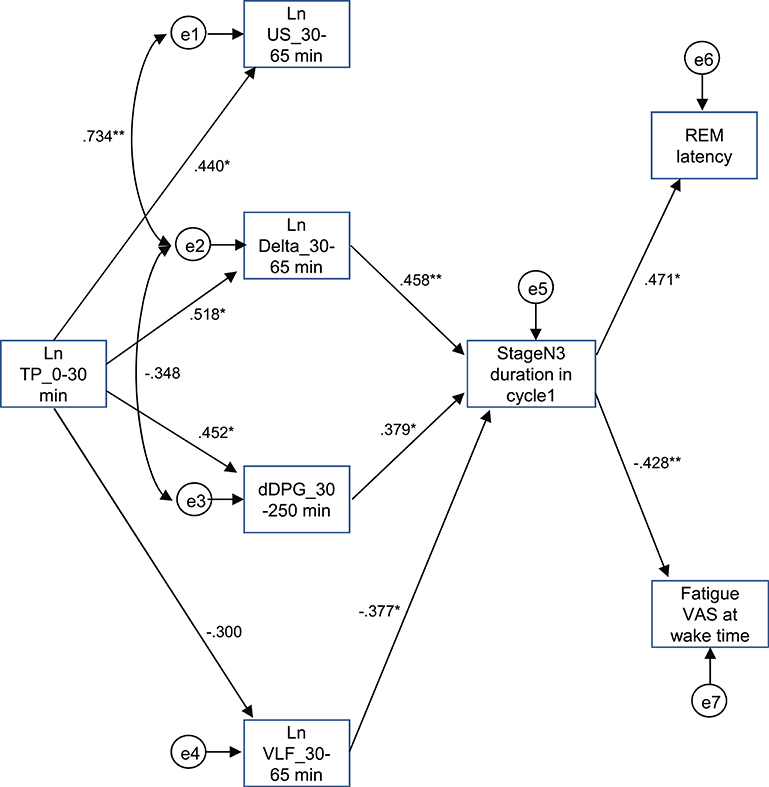
Figure 10. Modified diagram and results derived from structural equation modeling with eight observed variables. Description is the same as that for Figure 9. *p < 0.05, **p < 0.01.
Discussion
Physiological Differences Between the Low and High Fatigue Groups
In the present study, the fatigue VAS score was lower at wake time in the low fatigue group, but not in the high fatigue group, suggesting that the low fatigue group recovered from fatigue during sleep, but the high fatigue group did not recover; i.e., “non-restorative sleep” occurred in the high fatigue group. The high fatigue group exhibited the following changes compared to the low fatigue group; (1) a decrease in the stageN3 sleep duration in sleep cycle 1; (2) a decrease in the ultra-slow, delta, theta, and beta powers; (3) a decrease in the REM latency; (4) a decrease in the LF and total power of HRV; (5) an increase in the VLF; and (6) a smaller increase in the dDPG. Consistent with the present results, previous studies reported that a decrease in the ultra-slow and delta powers occurs in chronic fatigue syndrome (CFS) (6, 38). These findings suggest that the changes in the EEG powers in the high fatigue group might affect recovery from fatigue during sleep.
In addition to the decreased mean REM latency in the high fatigue group, the one subject showed very short REM latency (<8 min) in the high fatigue group (Figure 7D), and could be narcoleptic. However, it is unlikely since the decreased REM latency in the high fatigue group could be ascribed to sleep loss (Total sleep time <6 h) and/or shift work in the present study. Previous studies reported that both sleep loss and shift work were significantly associated with short onset of REM sleep (<8–15 min) in a nocturnal polysomnography and Sleep-Onset REM (SOREM) in a daytime multiple sleep latency test (MSLT) (39, 40), which can lead to a false positive diagnosis for narcolepsy (39, 40). Thus, the present results are consistent with these previous studies, and the given subject with short REM latency <8 min in the present study might be non-narcoleptic since majority of subjects with positive findings in the MSLT seemed to be false positive in diagnosis of narcolepsy especially in female subjects (39). However, it is noted that the sleep stage scoring in the present study was based on single-channel EEGs, and the present results should be interpreted with caution (see Conclusions and limitations).
Interestingly, Ln TP and Ln LF, which were significantly decreased in the high fatigue group, were relatively stable over 250 min. In contrast, Ln HF showed cyclic changes similar to Ln Delta that correlates with sleep depth or sleep stage by definition, while Ln LF/HF and Ln VLF showed opposite patters to that of Ln Delta. These findings are consistent with previous studies in which sympathetic-dominant activity (e.g., Ln LF/HF, Ln VLF) was negatively correlated with sleep stages, while vagal-dominant activity (e.g., Ln HF) was positively correlated with sleep stages (41, 42). Since LF and total power of HRV include both parasympathetic and sympathetic activity (43–45), these two variables could be less prone to show sleep stage-related changes. Second, some studies reported changes in total power of HRV, which was negatively correlated with urine levels of cortisol and noradrenaline and saliva cortisol levels (46), and a decrease in the LF and total power of HRV in athletes with fatigue and patients with CFS (4, 47), suggesting that total power of HRV is reduced in stressed or exhausted conditions.
Furthermore, the distal-proximal gradient of the skin temperature is an indirect measure of heat dissipation or heat loss from the core (brain) to the periphery (hand and leg skin) due to vasodilation in the peripheral skin, which is associated with sleepiness and the body's readiness for sleep as well as NREM (48–50). The smaller increase in the dDPG in the high fatigue group suggests that heat dissipation to lower the core temperature leading to NREM sleep was less evident in the high fatigue group. Furthermore, the VLF was increased in the high fatigue group. It is reported that an increase in the VLF reflects thermogenesis by an increase in metabolism (51, 52), suggesting that thermogenesis was increased in the high fatigue group. These two physiological processes (an increase in thermogenesis and lowered heat dissipation) might increase the core temperature, which might in turn have decreased NREM sleep in the high fatigue group.
Physiological Mechanisms of Fatigue at Wake Time
The difference in the EEG and autonomic parameters between the low and high fatigue groups may be due to the individual differences in physiological reactions to shift-work conditions. The above inference suggests that the non-recovery from fatigue due to “non-restorative sleep” in the high fatigue group might be ascribed to the changes in the EEG and HRV parameters. Consistent with this notion, fatigue as determined by the VAS at wake time was negatively correlated with (1) the mean Ln TP_0–30 min), (2) stageN3 duration in cycle 1, (3) mean dDPG_30–250 min, and (4) REM latency (Figure 7). Among these four factors correlated with fatigue as determined by VAS, Ln TP_0–30 min underwent the earliest changes, and was correlated with the stageN3 duration in cycle 1 and dDPG_30–250 min (Figures 8A,B). Furthermore, (1) the Ln TP_0–30 min was correlated with the EEG parameters in NREM sleep in sleep cycle 1 (Ln US_30–65 min, Ln US_cycle1, Ln Delta_30–65 min, Ln Delta_cycle1) (Figures 8C–F), and (2) the stageN3 duration in cycle 1 was correlated with the REM latency (Figure 5E). These findings suggest that the Ln TP_0–30 min might affect fatigue VAS at wake time indirectly, via the remaining five factors (the dDPG_30–250 min, Ln US_30–65 min, Ln Delta_30–65 min, stageN3 duration in cycle 1, and REM latency). In addition, the Ln VLF_30–65 min, which was also increased in the high fatigue group, might also mediate effects of the Ln TP_0–30 min. The structural equation modeling results support this initial hypothesized model (Figure 9). However, the modified model indicated that the Ln US_30–65 min and REM latency might not be directly related to fatigue VAS at wake time (Figure 10).
There is some evidence that pro-inflammatory cytokines (e.g., IL-1β, TNF-α, IL-6) reduce HRV including HF, LF, and total power of HRV (53–56), and extensive studies have reported that various cytokines are associated with the pathogenesis of fatigue in various diseases such as CFS, cancers, and multiple sclerosis (57–59). Although the subjects in the present study were healthy adult women without such diseases, it is reported that the serum levels of cytokines increase in response to various stresses including psychological stress (60), and serum cytokine levels are also affected by circadian rhythms and increase as early as 30 min after sleep onset in healthy subjects (61). Furthermore, administration of IL-6 resulted in a decrease in the first half of NREM sleep in humans (62), which was consistent with the decrease in the stageN3 sleep duration in sleep cycle 1 in this study. IL-6 was also found to increase body temperature in humans (62), and IL-6 levels in the cerebrospinal fluid were correlated with an increase in body temperature in rats (63), which was consistent with the reported increase in the VLF associated with thermogenesis (51, 52). In addition, animal experiments suggest that sleep, body temperature, and cardiovascular functions are controlled by distinct groups of neurons within the preoptic area of the hypothalamus, and different information from these groups of neurons are integrated within this nucleus as well as by an interaction with global networks for homeostasis (64, 65). Furthermore, a complex interaction between brain areas controlling autonomic nervous system and those controlling sleep-wake state has been proposed (66). These findings suggest that increased levels of pro-inflammatory cytokines in response to various stressors during the day might induce a decrease in the total power of HRV during the initial phase of sleep, which in turn might induce various changes in the EEG and autonomic parameters as well as fatigue VAS at wake time through activity changes in the preoptic area of the hypothalamus.
Conclusions and Limitations
The present results indicated that the high fatigue group did not recover from fatigue, which might be mediated through the following sequential three processes. First, the present results along with the previous studies suggest that an increase in peripheral pro-inflammatory cytokines might suppress total power of HRV, which might be mediated through their direct effects on the autonomic control areas such as the hypothalamus and/or indirect effects via peripheral afferent nerves (67, 68). Second, the correlational and structural equation modeling analyses indicated that an initial decrease in total power of HRV decreased the stageN3 sleep duration in sleep cycle 1 via its effects on other autonomic and EEG parameters including delta power and dDPG. It is reported that the autonomic nervous system densely interacts with the hypothalamus including the preoptic area controlling wakefulness-sleep cycle as well as body temperature (64–66). Therefore, the initial decrease in total power of HRV might affect dDPG and stageN3 sleep duration in sleep cycle 1 through the complex interactive pathways between the two systems. Third, the decrease in the stageN3 sleep duration in sleep cycle 1 might inhibit the recovery from fatigue during sleep (see below).
Sleep is important for homeostasis as a restorative process (69–71); cell damages are repaired, brain wastes are cleared, and macromolecules/neurotransmitters are restored during sleep. The present results indicated that the high fatigue group with short stageN3 sleep duration in sleep cycle 1 did not recover from fatigue. These findings suggest that stageN3 sleep in sleep cycle 1 is important for recovery from disturbed physiological conditions in the brain and body due to activity during wakefulness (e.g., cell damages, increases in wastes, shortages of macromolecules/neurotransmitters), while the disturbed physiological conditions did not fully recover, and the physiological conditions remained disturbed until wake time in the high fatigue group with short stageN3 sleep duration in sleep cycle 1. The sleep cycle 1 might be important for the recovery since stageN3 sleep period is usually longest in this sleep cycle. Consistent with this notion, protein synthesis during sleep was positively correlated to ratios of deep NREM (stageN3) sleep in that sleep although differences in protein synthesis among different sleep cycles remain unknown, suggesting that stageN3 sleep is important for restorative sleep (72). Furthermore, previous studies have reported that warming of the periocular and posterior cervical regions increased the delta power in the first 90 min of the sleep episode and decreased fatigue at wake time (73, 74). Further studies are required to investigate the selective role of sleep cycle 1 in recovery from fatigue.
However, the present study has several limitations. The number of enrolled subjects was relatively small. Second, sleep scoring was performed based on a single EEG derivation instead of conventional polysomnography in the present study. Third, since the physiological recordings were performed at home instead of in a temperature-controlled room to avoid psychological stress due to the new environment, differences in the environmental conditions across the subjects might have affected the results. Fourth, since the data in fixed length epochs of 5 min were quantitatively analyzed in the present study, different data during different sleep (REM and NREM) stages could be mixed in the same epochs. Fifth, we recorded only the limited number of the variables; other factors including the serum cytokine levels of the subjects and neural activity in various brain areas controlling sleep-wakefulness and autonomic activity (66, 75) were not measured. Sixth, we used the subjects with relatively short sleep period time (<6 h) in the present study. Nurses in the high fatigue group, who could sleep for longer than 6 h in different shift work situations, could recover from fatigue at bedtime. Seventh, effects of prior shift works were not considered in the present study. Previous studies suggest that balance between NREM and REM sleeps is homeostatically controlled (76, 77), and homeostatic and circadian systems combine to affect awake-sleep cycle (13, 78). Therefore, prior shift works could affect fatigue recovery during sleep through a complex interaction between these two systems. Further studies with a larger number of subjects of different sexes, occupations, and work shift patterns including no shift work as well as those with conventional polysomnography are required in order to generalize the present results of the relationships between fatigue and sleep parameters. Nevertheless, the present results provide clues to the underlying mechanisms and treatment of fatigue after sleep.
Author Contributions
TI and HisN designed research. SG and HisN performed research. SG, TI, JM, YT, EH, YN, TT, TO, and HisN analyzed data. SG, TI, HirN, and HisN wrote the manuscript.
Funding
The study was supported partly by research funds from University of Toyama and KAO Corp.
Conflict of Interest Statement
The authors declare that the research was conducted in the absence of any commercial or financial relationships that could be construed as a potential conflict of interest.
Supplementary Material
The Supplementary Material for this article can be found online at: https://www.frontiersin.org/articles/10.3389/fneur.2019.00066/full#supplementary-material
References
1. Ancoli-Israel S, Moore PJ, Jones V. The relationship between fatigue and sleep in cancer patients: a review. Eur J Cancer Care (2001) 10:245–55. doi: 10.1046/j.1365-2354.2001.00263.x
2. Fossey M, Libman E, Bailes S, Baltzan M, Schondorf R, Amsel R, et al. Sleep quality and psychological adjustment in chronic fatigue syndrome. J Behav Med. (2004) 27:581–605. doi: 10.1007/s10865-004-0004-y
3. Pedersen M, Ekstedt M, Småstuen MC, Wyller VB, Sulheim D, Fagermoen E, et al. Sleep-wake rhythm disturbances and perceived sleep in adolescent chronic fatigue syndrome. J Sleep Res. (2017) 26:595–601. doi: 10.1111/jsr.12547
4. Boneva RS, Decker MJ, Maloney EM, Lin JM, Jones JF, Helgason HG, et al. Higher heart rate and reduced heart rate variability persist during sleep in chronic fatigue syndrome: a population-based study. Auton Neurosci. (2007) 137:94–101. doi: 10.1016/j.autneu.2007.08.002
5. Jackson ML, Bruck D. Sleep abnormalities in chronic fatigue syndrome/myalgic encephalomyelitis: a review. J Clin Sleep Med. (2012) 8:719–28. doi: 10.5664/jcsm.2276
6. Le Bon O, Neu D, Berquin Y, Lanquart JP, Hoffmann R, Mairesse O, et al. Ultra-slow delta power in chronic fatigue syndrome. Psychiatry Res. (2012) 200:742–7. doi: 10.1016/j.psychres.2012.06.027
7. Meeus M, Goubert D, De Backer F, Struyf F, Hermans L, Coppieters I, et al. Heart rate variability in patients with fibromyalgia and patients with chronic fatigue syndrome: a systematic review. Semin Arthritis Rheum. (2013) 43:279–87. doi: 10.1016/j.semarthrit.2013.03.004
8. Sater RA, Gudesblatt M, Kresa-Reahl K, Brandes DW, Sater PA. The relationship between objective parameters of sleep and measures of fatigue, depression, and cognition in multiple sclerosis. Mul Scler J Exp Transl Clin. (2015) 1:2055217315577828. doi: 10.1177/2055217315577828
9. Strober LB. Fatigue in multiple sclerosis: a look at the role of poor sleep. Front Neurol. (2015) 6:21. doi: 10.3389/fneur.2015.00021
10. Roscoe JA, Kaufman ME, Matteson-Rusby SE, Palesh OG, Ryan JL, Kohli S, et al. Cancer-related fatigue and sleep disorders. Oncologist (2007) 12(Suppl. 1):35–42. doi: 10.1634/theoncologist.12-S1-35
11. Berger AM, Mitchell SA. Modifying cancer-related fatigue by optimizing sleep quality. J Natl Compr Canc Netw. (2008) 6:3–13. doi: 10.6004/jnccn.2008.0002
12. Richardson A. Measuring fatigue in patients with cancer. Support Care Cancer (1998) 6:94–100. doi: 10.1007/s005200050141
13. Åkerstedt T. Shift work and disturbed sleep/wakefulness. Occup Med. (2003) 53:89–94. doi: 10.1093/occmed/kqg046
14. Josten EJ, Ng A, Tham JE, Thierry H. The effects of extended workdays on fatigue, health, performance and satisfaction in nursing. J Adv Nurs. (2003) 44:643–52. doi: 10.1046/j.0309-2402.2003.02854.x
15. Chien PL, Su HF, Hsieh PC, Siao RY, Ling PY, Jou HJ. Sleep quality among female hospital staff nurses. Sleep Disord. (2013) 2013:283490. doi: 10.1155/2013/283490
16. Scott LD, Arslanian-Engoren C, Engoren MC. Association of sleep and fatigue with decision regret among critical care nurses. Am J Crit Care (2014) 23:13–23. doi: 10.4037/ajcc2014191
17. Wickwire EM, Geiger-Brown J, Scharf SM, Drake CL. Shift work and shift work sleep disorder: clinical and organizational perspectives. Chest (2017) 151:1156–72. doi: 10.1016/j.chest.2016.12.007
18. Ichiba T, Gorlova S, Nagashima Y, Aitake M, Hori E, Nishijo H. Association between sleep quality and subjective fatigue in night-shift nurses with good and poor sleep. Sleep Vigil. (2018) 2:63–9. doi: 10.1007/s41782-018-0036-y
19. Buysse DJ, Reynolds CFIII, Monk TH, Berman SR, Kupfer DJ. The Pittsburgh Sleep Quality Index: a new instrument for psychiatric practice and research. Psychiatry Res. (1989) 28:193–213. doi: 10.1016/0165-1781(89)90047-4
20. Horne JA, Östberg O. A self assessment questionnaire to determine Morningness Eveningness in human circadian rhythms. Int J Chronobiol. (1976) 4:97–110.
21. Spielberger CD, Gorsuch RL, Lushene R, Vagg PR, Jacobs GA. Manual for the State-Trait Anxiety Inventory. Palo Alto, CA: Consulting Psychologists Press (1983).
22. Mizuno K, Tanaka M, Yamaguti K, Kajimoto O, Kuratsune H, Watanabe Y. Mental fatigue caused by prolonged cognitive load associated with sympathetic hyperactivity. Behav Brain Funct. (2011) 7:17. doi: 10.1186/1744-9081-7-17
23. Mizuno K, Tajima K, Watanabe Y, Kuratsune H. Fatigue correlates with the decrease in parasympathetic sinus modulation induced by a cognitive challenge. Behav Brain Funct. (2014) 10:25. doi: 10.1186/1744-9081-10-25
24. Ellis BW, John MW, Lancaster R, Raptopoulos P, Angelopoulos N, Priest RG. The St. Mary's hospital sleep questionnaire; a study of reliability. Sleep (1981) 4:93–7.
25. Kaida K, Takahashi M, Åkerstedt T, Nakata A, Otsuka Y, Haratani T, et al. Validation of the Karolinska sleepiness scale against performance and EEG variables. Clin. Neurophysiol. (2006) 117:1574–81. doi: 10.1016/j.clinph.2006.03.011
26. van Marken Lichtenbelt WD, Daanen HA, Wouters L, Fronczek R, Raymann RJ, Severens NM, et al. Evaluation of wireless determination of skin temperature using iButtons. Physiol Behav. (2006) 88:489–97. doi: 10.1016/j.physbeh.2006.04.026
27. Matsushita C, Torimoto K, Goto D, Morizawa Y, Kiba K, Shinohara M, et al. Linkage of lower urinary tract symptoms to sleep quality in elderly men with nocturia: a community based study using home measured electroencephalogram data. J Urol. (2017) 197:204–9. doi: 10.1016/j.juro.2016.07.088
28. Nonoue S, Mashita M, Haraki S, Mikami A, Adachi H, Yatani H, et al. Inter-scorer reliability of sleep assessment using EEG and EOG recording system in comparison to polysomnography. Sleep Biol. Rhythms (2017) 15:39–48. doi: 10.1007/s41105-016-0078-2
29. Berry RB, Brooks R, Gamaldo CE, Harding SM, Lloyd RM, Marcus CL, et al. The AASM Manual for the Scoring of Sleep and Associated Events: Rules, Terminology and Technical Specifications, Version 2.1. Darien, IL: American Academy of Sleep Medicine (2014).
30. Nakamura H, Kashiwagi K, Yoshida M. Sleep stage automatic classification with single channel sleep EEG signals (in Japanese). IEICE Tech. Rep. (2011) 111:33–6.
31. Yoda K, Inaba M, Hamamoto K, Yoda M, Tsuda A, Mori K, et al. Association between poor glycemic control, impaired sleep quality, and increased arterial thickening in type 2 diabetic patients. PLoS ONE (2015) 10:e0122521. doi: 10.1371/journal.pone.0122521
32. Monoi N, Matsuno A, Nagamori Y, Kimura E, Nakamura Y, Oka K, et al. Japanese sake yeast supplementation improves the quality of sleep: a double-blind randomised controlled clinical trial. J Sleep Res. (2016) 25:116–23. doi: 10.1111/jsr.12336
33. Jurysta F, van de Borne P, Migeotte PF, Dumont M, Lanquart JP, Degaute JP, et al. A study of the dynamic interactions between sleep EEG and heart rate variability in healthy young men. Clin Neurophysiol. (2003) 114:2146–55. doi: 10.1016/S1388-2457(03)00215-3
34. Kanaya N, Hirata N, Kurosawa S, Nakayama M, Namiki A. Differential effects of propofol and sevoflurane on heart rate variability. Anesthesiology (2003) 98:34–40. doi: 10.1097/00000542-200301000-00009
35. Ullman P, Bentler M. Structural equation modeling. In Weiner IB, editor. Handbook of Psychology, 2nd ed. Hoboken, NJ: John Wiley & Sons, Inc. (2013). p. 661–690. doi: 10.1002/9781118133880.hop202023.
36. Sharma S, Mukherjee S, Kumar A, Dillon WR. A simulation study to investigate the use of cutoff values for assessing model fit in covariance structure models. J Bus Res. (2005) 58:935–43. doi: 10.1016/j.jbusres.2003.10.007
37. Hesterberg TC. What teachers should know about the bootstrap: Resampling in the undergraduate statistics curriculum. Am Statist. (2015) 69:371–86. doi: 10.1080/00031305.2015.1089789
38. Decker MJ, Tabassum H, Lin JM, Reeves WC. Electroencephalographic correlates of Chronic Fatigue Syndrome. Behav Brain Funct. (2009) 5:43. doi: 10.1186/1744-9081-5-43
39. Mignot E, Lin L, Finn L, Lopes C, Pluff K, Sundstrom ML, et al. Correlates of sleep-onset REM periods during the Multiple Sleep Latency Test in community adults. Brain (2006) 129:1609–23. doi: 10.1093/brain/awl079
40. Goldbart A, Peppard P, Finn L, Ruoff CM, Barnet J, Young T, et al. Narcolepsy and predictors of positive MSLTs in the Wisconsin Sleep Cohort. Sleep (2014) 37:1043–51. doi: 10.5665/sleep.3758
41. Toscani L, Gangemi PF, Parigi A, Silipo R, Ragghianti P, Sirabella E, et al. Human heart rate variability and sleep stages. Italian J Neurol Sci. (1996) 17:437–9. doi: 10.1007/BF01997720
42. Bušek P, Vanková J, Opavský J, Salinger J, Nevšímalová S. Spectral analysis of heart rate variability in sleep. Physiol Res. (2005) 54:369–76.
43. Akselrod S, Gordon D, Ubel FA, Shannon DC, Berger RD, Cohen RJ. Power spectrum analysis of heart rate fluctuation: a quantitative probe of beat-to-beat cardiovascular control. Science (1981) 213:220–2. doi: 10.1126/science.6166045
44. Pomeranz B, Macaulay MA, Kurtz I, Adam D, Gordon D, Kilborn KM, et al. Assessment of autonomic function in humans by heart rate spectral analysis. Am J Physiol. (1985) 248:H151–3. doi: 10.1152/ajpheart.1985.248.1.H151
45. Chouchou F, Desseilles M. Heart rate variability: a tool to explore the sleeping brain? Front Neurosci. (2014) 8:402. doi: 10.3389/fnins.2014.00402
46. Eller NH. Total power and high frequency components of heart rate variability and risk factors for atherosclerosis. Auton Neurosci. (2007) 131:123–30. doi: 10.1016/j.autneu.2006.08.002
47. Schmitt L, Regnard J, Desmarets M, Mauny F, Mourot L, Fouillot JP, et al. Fatigue shifts and scatters heart rate variability in elite endurance athletes. PLoS ONE (2013) 8:e71588. doi: 10.1371/journal.pone.0071588
48. Kraüchi K, Wirz-Justice A. Circadian rhythm of heat production, heart rate, and skin and core temperature under unmasking conditions in men. Am J Physiol. (1994) 267(3 Pt 2):R819–29. doi: 10.1152/ajpregu.1994.267.3.R819
49. Kraüchi K, Cajochen C, Wirz-Justice A. A relationship between heat loss and sleepiness: Effects of postural change and melatonin administration. J Appl Physiol. (1997) 83:134–9. doi: 10.1152/jappl.1997.83.1.134
50. Kräuchi K, Deboer T. Body temperature, sleep, and hibernation. In: Kryger MH, Roth T, Dement WC, editors. Principles and Practice of Sleep Medicine. 5th ed. Philadelphia, PA: Elsevier Inc. (2011). p. 323–334. doi: 10.1016/B978-1-4160-6645-3.00028-1
51. Matsumoto T, Miyawaki T, Ue H, Kanda T, Zenji C, Moritani T. Autonomic responsiveness to acute cold exposure in obese and non-obese young women. Int J Obes Relat Metab Disord. (1999) 23:793–800. doi: 10.1038/sj.ijo.0800928
52. Millis RM, Austin RE, Hatcher MD, Bond V, Goring KL. Metabolic energy correlates of heart rate variability spectral power associated with a 900-calorie challenge. J Nutr Metab. (2011) 2011:715361. doi: 10.1155/2011/715361
53. Janszky I, Ericson M, Lekander M, Blom M, Buhlin K, Georgiades A, et al. Inflammatory markers and heart rate variability in women with coronary heart disease. J Intern Med. (2004) 256:421–8. doi: 10.1111/j.1365-2796.2004.01403.x
54. Fairchild KD, Saucerman JJ, Raynor LL, Sivak JA, Xiao Y, Lake DE, et al. Endotoxin depresses heart rate variability in mice: cytokine and steroid effects. Am J Physiol Regul Integr Comp Physiol. (2009) 297:R1019–R1027. doi: 10.1152/ajpregu.00132.2009
55. Papaioannou V, Pneumatikos I, Maglaveras N. Association of heart rate variability and inflammatory response in patients with cardiovascular diseases: current strengths and limitations. Front Physiol. (2013) 4:174. doi: 10.3389/fphys.2013.00174
56. Ye J, Zhu R, He X, Feng Y, Yang L, Zhu X, et al. Association of plasma IL-6 and Hsp70 with HRV at different levels of PAHs metabolites. PLoS ONE (2014) 9:e92964. doi: 10.1371/journal.pone.0092964
57. Schubert C, Hong S, Natarajan L, Mills PJ, Dimsdale JE. The association between fatigue and inflammatory marker levels in cancer patients: a quantitative review. Brain Behav Immun. (2007) 21:413–27. doi: 10.1016/j.bbi.2006.11.004
58. Malekzadeh A, Van de Geer-Peeters W, De Groot V, Teunissen CE, Beckerman H TREFAMS-ACE Study Group. Fatigue in patients with multiple sclerosis: is it related to pro- and anti-inflammatory cytokines? Dis Markers (2015) 2015:758314. doi: 10.1155/2015/758314
59. Montoya JG, Holmes TH, Anderson JN, Maecker HT, Rosenberg-Hasson Y, Valencia IJ, et al. Cytokine signature associated with disease severity in chronic fatigue syndrome patients. Proc Natl Acad Sci USA. (2017) 114:E7150–E7158. doi: 10.1073/pnas.1710519114
60. Steptoe A, Hamer M, Chida Y. The effects of acute psychological stress on circulating inflammatory factors in humans: a review and meta-analysis. Brain Behav Immun. (2007) 21:901–12. doi: 10.1016/j.bbi.2007.03.011
61. Redwine L, Hauger RL, Gillin JC, Irwin M. Effects of sleep and sleep deprivation on interleukin-6, growth hormone, cortisol, and melatonin levels in humans. J Clin Endocrinol Metab. (2000) 85:3597–603. doi: 10.1210/jc.85.10.3597
62. Späth-Schwalbe E, Hansen K, Schmidt F, Schrezenmeier H, Marshall L, Burger K, et al. Acute effects of recombinant human interleukin-6 on endocrine and central nervous sleep functions in healthy men. J Clin Endocrinol Metab. (1998) 83:1573–9. doi: 10.1210/jc.83.5.1573
63. LeMay LG, Vander AJ, Kluger MJ. Role of interleukin 6 in fever in rats. Am J Physiol. (1990) 258(3 Pt 2):R798–803. doi: 10.1152/ajpregu.1990.258.3.R798
64. Mallick HN, Kumar VM. Basal forebrain thermoregulatory mechanism modulates auto-regulated sleep. Front Neurol. (2012) 3:102. doi: 10.3389/fneur.2012.00102
65. McKinley MJ, Yao ST, Uschakov A, McAllen RM, Rundgren M, Martelli D. The median preoptic nucleus: front and centre for the regulation of body fluid, sodium, temperature, sleep and cardiovascular homeostasis. Acta Physiol. (2015) 214:8–32. doi: 10.1111/apha.12487
66. de Zambotti M, Trinder J, Silvani A, Colrain IM, Baker FC. Dynamic coupling between the central and autonomic nervous systems during sleep: a review. Neurosci Biobehav Rev. (2018) 90:84–103. doi: 10.1016/j.neubiorev.2018.03.027
68. Fernandez R, Nardocci G, Navarro C, Reyes EP, Acuña-Castillo C, Cortes PP. Neural reflex regulation of systemic inflammation: potential new targets for sepsis therapy. Front Physiol. (2014) 5:489. doi: 10.3389/fphys.2014.00489
69. Mignot E. Why we sleep: the temporal organization of recovery. PLoS Biol. (2008) 6:e106. doi: 10.1371/journal.pbio.0060106
70. Xie L, Kang H, Xu Q, Chen MJ, Liao Y, Thiyagarajan M, et al. Sleep drives metabolite clearance from the adult brain. Science (2013) 342:373–7. doi: 10.1126/science.1241224
71. Everson CA, Henchen CJ, Szabo A, Hogg N. Cell injury and repair resulting from sleep loss and sleep recovery in laboratory rats. Sleep (2014) 37:1929–40. doi: 10.5665/sleep.4244
72. Nakanishi H, Sun Y, Nakamura RK, Mori K, Ito M, Suda S, et al. Positive correlations between cerebral protein synthesis rates and deep sleep in Macaca mulatta. Eur J Neurosci. (1997) 9:271–9. doi: 10.1111/j.1460-9568.1997.tb01397.x
73. Sakamoto I, Igaki M, Ichiba T, Suzuki M, Kuriyama K, Uchiyama M. Effects of bedtime periocular warming on sleep status in adult female subjects: a pilot study. Evid Based Compl Alternat Med. (2017) 2017:6419439. doi: 10.1155/2017/6419439
74. Igaki M, Suzuki M, Sakamoto I, Ichiba T, Kuriyama K, Uchiyama M. Effects of bedtime periocular and posterior cervical cutaneous warming on sleep status in adult male subjects: a preliminary study. Sleep Biol Rhythms (2018) 16:77–84. doi: 10.1007/s41105-017-0129-3
75. Nobili L, De Gennaro L, Proserpio P, Moroni F, Sarasso S, Pigorini A, et al. Local aspects of sleep: observations from intracerebral recordings in humans. Prog Brain Res. (2012) 199:219–32. doi: 10.1016/B978-0-444-59427-3.00013-7
76. Benington JH, Heller HC. REM-sleep timing is controlled homeostatically by accumulation of REM-sleep propensity in non-REM sleep. Am J Physiol Regul Integr Comp Physiol. (1994) 266:R1992–2000. doi: 10.1152/ajpregu.1994.266.6.R1992
77. Phillips AJK, Robinson PA, Klerman EB. Arousal state feedback as a potential physiological generator of the ultradian REM/NREM sleep cycle. J Theor Biol. (2013) 319:75–87. doi: 10.1016/j.jtbi.2012.11.029
Keywords: subjective fatigue, electroencephalography, slow-wave sleep, delta wave, heart rate variability, total power
Citation: Gorlova S, Ichiba T, Nishimaru H, Takamura Y, Matsumoto J, Hori E, Nagashima Y, Tatsuse T, Ono T and Nishijo H (2019) Non-restorative Sleep Caused by Autonomic and Electroencephalography Parameter Dysfunction Leads to Subjective Fatigue at Wake Time in Shift Workers. Front. Neurol. 10:66. doi: 10.3389/fneur.2019.00066
Received: 15 September 2018; Accepted: 17 January 2019;
Published: 05 February 2019.
Edited by:
Ahmed S. BaHammam, King Saud University, Saudi ArabiaReviewed by:
Liborio Parrino, University of Parma, ItalyHruda N. Mallick, All India Institute of Medical Sciences, India
Kamalesh K. Gulia, Sree Chitra Tirunal Institute for Medical Sciences and Technology (SCTIMST), India
Copyright © 2019 Gorlova, Ichiba, Nishimaru, Takamura, Matsumoto, Hori, Nagashima, Tatsuse, Ono and Nishijo. This is an open-access article distributed under the terms of the Creative Commons Attribution License (CC BY). The use, distribution or reproduction in other forums is permitted, provided the original author(s) and the copyright owner(s) are credited and that the original publication in this journal is cited, in accordance with accepted academic practice. No use, distribution or reproduction is permitted which does not comply with these terms.
*Correspondence: Hisao Nishijo, bmlzaGlqb0BtZWQudS10b3lhbWEuYWMuanA=