 Xiao Liu1†
 Wei Shan1,2,3†
 Xiaobin Zhao3,4
 Jiechuan Ren1,3
 Guoping Ren1,3
 Chao Chen1,3
 Weixiong Shi1,3
 Ruijuan Lv1,3Zhimei Li1,3
 Yaou Liu3,5Lin Ai3,4*
 Qun Wang1,2,3*
- 1Department of Neurology, Beijing Tiantan Hospital, Capital Medical University, Beijing, China
- 2Beijing Institute for Brain Disorders, Beijing, China
- 3China National Clinical Research Center for Neurological Diseases, Beijing, China
- 4Department of Nuclear Medicine, Beijing Tiantan Hospital, Capital Medical University, Beijing, China
- 5Department of Radiology, Beijing Tiantan Hospital, Capital Medical University, Beijing, China
Purpose: The metabolic patterns of 18F-fluoro-2-deoxy-d-glucose positron emission tomography (18F-FDG-PET) in autoimmune encephalitis associated with leucine-rich glioma-inactivated 1 antibody (LGI1 AE) are still unclear. We performed a cohort study to investigate the clinical metabolic characteristics and diagnostic value based on 18F-FDG-PET in patients with LGI1 AE.
Materials and Methods: A total of 34 patients including 18 patients (53%) in the acute phase and 16 patients (47%) in the chronic phase who were diagnosed with LGI1 AE were retrospectively analyzed from October 2014 to June 2018 at the Department of Neurology in Beijing Tiantan Hospital, the Capital Medical University. The clinical data were collected by searching through electronic medical records.
Results: The initial 18F-FDG-PET scan indicated a significant abnormal metabolic pattern in 31 LGI1 AE patients (91%), whereas only 20 patients (59%) showed an abnormal MRI signal (P < 0.05). The 18F-FDG-PET metabolic pattern was reversible after treatment; most of the patients showed an almost normal uptake of 18F-FDG-PET after discharge. Regarding the spatial distribution, the abnormal metabolic pattern in LGI1 AE subjects exhibiting hypermetabolism was specifically located in the basal ganglia (BG) and medial temporal lobe (MTL). BG hypermetabolism was observed in 28 subjects (82%), and 68% of patients showed MTL hypermetabolism. A total of 17 patients (50%) exhibited faciobrachial dystonic seizures (FBDS), and the remaining subjects showed non-FBDS symptoms (50 and 50%). BG-only hypermetabolism was detected in seven subjects in the FBDS subgroup (7/16) but in only one subject in the non-FBDS subgroup (1/15) (44 vs. 7%, P < 0.05).
Conclusion: 18F-FDG-PET imaging was more sensitive than MRI in the diagnosis of LGI1 AE. Isolated BG hypermetabolism was more frequently observed in subjects with FBDS, suggesting the potential involvement of the BG.
Introduction
Autoimmune encephalitis (AE) associated with leucine-rich glioma-inactivated 1 (LGI1) antibody, described a decade ago, is a potentially treatable and recidivistic subtype of AE (1). It has been characterized as a subacute or rapidly progressive cognitive impairment accompanied by seizures, faciobrachial dystonic seizures (FBDS), and neuropsychiatric symptoms but rarely cancer (2). FBDS are highly specific and often appear as an initial symptom of LGI1 AE (3), which mainly presents with very frequent (medially 50 times per day) and brief involuntary movements of the ipsilateral face and limbs (usually <3 s for every episode) (4). However, whether FBDS should be treated as epileptic seizures is still controversial (5). Only certain studies have classified FBDS as epileptic-origin tonic seizures based on a detectable generalized electrodecremental event during the episode on ictal electroencephalogram (EEG) (6). However, other studies of LGI1 AE patients with FBDS have detected BG abnormalities on magnetic resonance imaging (MRI) that were not detected in subjects without FBDS, suggesting that FBDS might be a form of movement disorder (7). Hence, it is still difficult to confirm the origin or nature of FBDS.
For LGI1 AE patients, early diagnosis and treatment can prevent the development of the disease syndrome (8, 9). MRI is a preferred radiological modality in the early diagnosis of LGI1 AE, especially when antibody testing is negative or not available (10). Nevertheless, individual patients with LGI1 AE have been shown to exhibit negligible MRI findings, notably during the development of FBDS (4, 11, 12). Thus, it is necessary to find a novel or distinctive imaging pattern to expedite the early diagnosis of LGI1 AE (13). 18F-Fluoro-2-deoxy-d-glucose positron emission tomography (18F-FDG-PET) is a functional imaging modality for in vivo evaluation of the pathophysiology of the brain via application of 18F-FDG; it has been reported to reveal abnormal metabolism patterns in AE subjects, such as typical medial temporal lobe (MTL) hypermetabolism, especially in AE patients with a negative MRI, thus implying that 18F-FDG-PET has higher sensitivity than MRI in the diagnosis of AE subjects (14, 15). However, the 18F-FDG-PET pattern of patients with LGI1 AE is not well characterized or established. Regional basal ganglia (BG) or MTL hypermetabolism on 18F-FDG-PET has been observed in LGI1 AE patients (16–18). To date, only a limited number of isolated cases have been studied in subjects with LGI1 AE using 18F-FDG-PET.
Thus, we conducted a retrospective study and reviewed the 18F-FDG-PET data of 34 patients with a definite diagnosis of LGI1 AE based on symptoms, EEG, and LGI1 antibody testing. We evaluated the diagnostic value of 18F-FDG-PET in LGI1 AE subjects, especially those with unremarkable MRI alterations, and we also aimed to interpret the localization of FBDS by showing different metabolic abnormalities of 18F-FDG-PET in LGI1 AE patients with or without FBDS.
Materials and Methods
Standard Protocol, Approvals, and Patients' Consents
The study was approved by the Ethics Committee of the Beijing Tiantan Hospital, which was affiliated with the Capital Medical University of the People's Republic of China. The study was conducted in accordance with the Declaration of Helsinki, and all patients and controls provided informed consent for the use of their medical records.
Study Participants
A total of 34 patients with LGI1 AE were retrospectively identified between October 2014 and June 2018 at the Department of Neurology in the Beijing Tiantan Hospital of the Capital Medical University. The inclusion criteria were based on representative clinical symptoms of LGI1 AE and the presence of positive LGI1 antibodies in the serum or cerebrospinal fluid (CSF). All included patients had undergone MRI and 18F-FDG-PET scans for neurological assessment during clinical evaluation. The demographic, clinical presentation, laboratory testing, EEG, and neuroimaging data were reviewed by searching the electronic medical records.
The 34 patients included 18 patients (53%) in the acute phase and 16 patients (47%) in the chronic phase when they take PET examination based on the previous definition of the acute phase (within 3 months) and chronic phase (over 3 months) in the diagnosis of AE (10).
The patients were divided into two subgroups based on the presence of FBDS, namely, FBDS and non-FBDS. We compared the 18F-FDG-PET findings in these two subgroups, analyzed the 18F-FDG-PET hypermetabolic states in the BG of the subjects, and then inferred the possible etiology or nature of FBDS.
In this study, we randomly selected additional 20 age- and gender-matched controls (14 men and 6 women; median age 62.5 years; range, 25–83 years) for the quantitative analysis of FDG-PET based on volume of interest (VOI). The inclusion criteria are the following: (1) no brain diseases, (2) no mental disorders reported in the medical records, (3) no other diseases that indicated the brain function had been affected, (4) no abnormalities reported by the neuroradiologist, (5) adjustment for gender and age and random pickup of the control subjects.
Laboratory Detection
All patients underwent serum and CSF antibody detection, including N-methyl-D-aspartate receptor (NMDAR), LGI1, contactin-associated protein-2 (CASPR2), α-amino-3-hydroxy-5-methyl-4-isoxazolepropionic acid receptor (AMPAR), and γ-aminobutyric acid type B (GABAB). Serum and CSF samples were tested for the presence of LGI1 antibodies, using both cell-based assays (Euroimmun, Lübeck, Germany) and immunohistochemical analyses in the neuroimmunology laboratory of the Peking Union Medical College Hospital.
18F-FDG-PET Acquisition
18F-FDG-PET images were acquired using a PET/computed tomography (CT) scanner (Elite Discovery, GE HealthCare, Fairfield, Connecticut, USA). All patients (with a median age of 61 years, ranging from 31 to 78 years) fasted for at least 6 h, and blood glucose levels could not exceed 8 mmol/L. No patients received neuroleptic drugs to undergo FDG-PET. 18F-FDG was intravenously injected at a dose of 3.7–5.0 MBq/kg within 1 min, and subsequent uptakes required that patients be in a quiet resting status for 1 h prior to scanning in a dedicated room after 18F-FDG injection. First, a low-dose CT scan was performed, and the CT parameters for attenuation correction were 120 kV, pitch 0.984, automated tube current 60–180 mA, and slice thickness 3.75 mm. The PET scan was subsequently performed in 3D-TOF mode; for the LGI1 patients, a whole-body (including the brain region) FDG-PET scanning was acquired for approximately 30–35 min. The brain imaging data were reconstructed into trans-axial slices with a matrix size of 128 × 128 and a slice thickness of 3.3 mm, using an OSEM (ordered subset expectation maximization) algorithm.
Voxel-Based Analysis of Statistical Parametric Mapping
For statistical parametric mapping (SPM) analysis, 22 age-matched, healthy volunteers served as control subjects. PET data were analyzed by SPM8 software (Wellcome Department of Cognitive Neurology, University College, London, UK) running on Matlab 2014b (MathWorks Inc., Sherborn, MA, USA). First, PET images were co-registered with the SPM template T1-weighted MR. Co-registered PET images were then spatially normalized into a common Montreal Neurological Institute (MNI) atlas anatomical space following a 12-parameter affine transformation and non-linear transformations, yielding images composed of 2 mm × 2 mm × 2 mm voxels. Third, normalized images were smoothed using an isotropic Gaussian kernel to increase the signal-to-noise ratio. Subsequently, preprocessed PET image values were corrected to a mean value of 50 ml/dl/min by “proportional scaling” to reduce individual variation. A two-sample t-test, based on the specified 22 age- and gender-matched controls, was applied between included patient PET data and the control group and to best reduce the impact of age and gender. The regions were considered significant at a corrected level of P < 0.01 for a minimum cluster size of 100 contiguous voxels (8 mm3 per voxel size). We purposefully chose a low threshold to detect any regions in which VT/f P was more significant in patients.
Data Analysis Based on VOI of Standardized Uptake Max Value
For these reported data, the region of interest (ROI) refers to the structure in 2D space (e.g., on a slice), and VOI refers to the structure in 3D space (i.e., a combination of ROIs of adjacent slices in two dimensions was labeled as a VOI). The value for radioactivity in each structure for each participant is the maximum of all pixels in all ROIs assayed for that structure, yielding a VOI. In our study, we selected three consecutive axial sections to define a certain volume (parameters included length, width, and height) to obtain the SUVmax (AW work station, GE HealthCare, USA). We calculated the SUVmax in three VOIs on FDG-PET based on the visual analysis, including the frontal cortex, BG, and MTL. The size of VOIs we selected was fixed, the center coordinate referred to the central location of VOIs, and they were individualized. One of the representative parameters of the individual was as follows: For the frontal cortex, the size of the volume was 25 * 20 * 9.9 mm, and the center coordinate of the volume was 72, 135, 30. For the BG, it was 40 * 30 * 9.9 mm, and the center coordinate was 109, 110, 23. For the MTL, the size of volume was 40 * 25 * 9.9 mm, and the center coordinate of volume was 112, 103, 18 (Supplementary Figure 1). The steps of quantitative comparison were as follows. (1) In the brain, the cubic VOIs were placed manually in the lesion. The SUVmax in the BG, MTL, and the frontal cortex was measured by three experienced neuroradiologists and nuclear imaging specialists (Lin Ai, Xiaobin Zhao, and Yaou Liu). All three specialists were blinded from clinical information of the conditions of either patients or controls, and in case of obvious discordance in their initial evaluations, an informed consensus statement was reached. The kappa coefficient of the three specialists was 0.88. (2) For normalization of SUVmax in the BG and MTL, the respective uptake values were divided by the values measured in the frontal VOI, which was chosen as the internal reference, as it was not expected to be altered in activity in LGI1 AE. Finally, we made a statistical comparison between 20 age- and gender-matched controls and 34 patients. (3) Receiver operating characteristic (ROC) curve analyses of normalized SUVmax in the BG and MTL for controls and patients were performed, and accordingly, optimal threshold values were set to 1.8 for BG and 1.3 for MTL.
Literature Review
An extensive literature search was performed for the terms “positron emission tomography” and “encephalitis” from January 2007 to October 2018. The reported results were reviewed and summarized. The primary search identified 112 publications on PubMed, and any studies and case reports that showed abnormal metabolism on brain PET in patients with AE were included. The subtypes of AE included NMDAR, LGI1, CASPR2, and GABAB. Ultimately, 19 studies and case series were reviewed (Table 4).
Statistical Analysis
Continuous variables with a normal distribution are presented as the mean ± standard deviation, and non-normal variables are expressed as the median (interquartile range, IQR). Continuous variables were compared using the t-test or non-parametric Mann–Whitney U-test. Categorical variables were compared and analyzed by Fisher's exact test. A two-tailed P < 0.05 was considered statistically significant. SPSS Statistics 23.0 software package for Windows (IBM Corp., Armonk, NY) was used for statistical analyses.
Results
Clinical Characteristics
A total of 34 patients (24 men; a median age of 61 years, IQR 54–65 years old; age range, 31–78 years) with LGI1 AE were identified, and their clinical characteristics were reviewed (Table 1). A total of 33 patients (97%) exhibited epileptic seizures, and the remaining one subject presented only with FBDS. Complex partial seizures (CPS) and generalized tonic–clonic seizures (GTCS) were the two main patterns of epileptic seizures. A total of 17 patients (50%) presented with distinctive FBDS, which involved both the arm and ipsilateral face (71%), and only 24% of patients experienced disturbances of awareness. Other symptoms were memory loss (88%), psychiatric disorders (depression, 9%; hallucinations, 26%, disorder of behavior, 24%), somnipathy (50%), and hallucinations (26%). Only one patient (3%) exhibited colorectal adenoma, and the remaining 33 patients did not present with a tumor after a median follow-up of 1.55 years (range, 0.3–4 years).
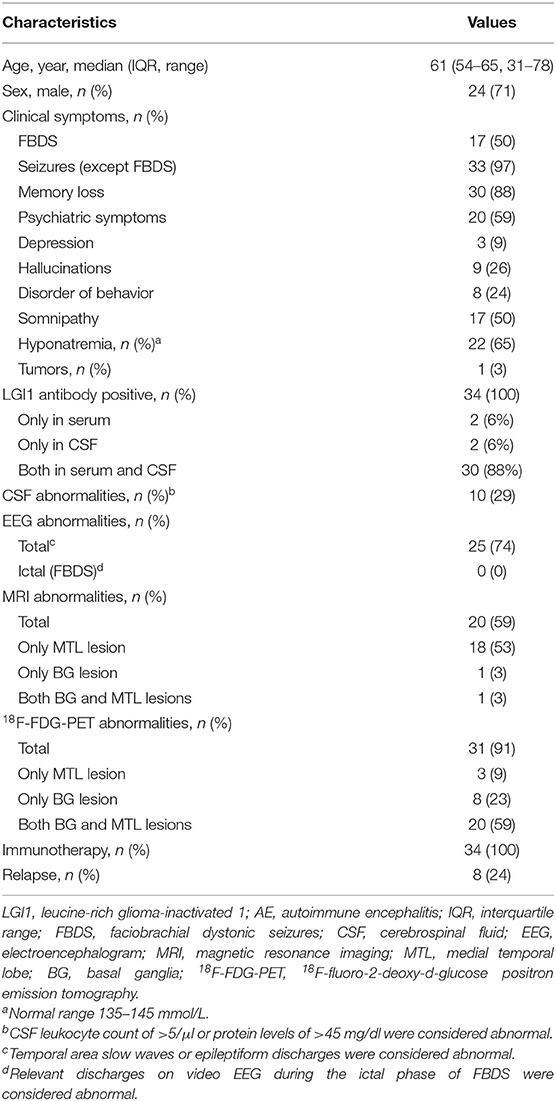
Table 1. Summary of the clinical characteristics of patients with LGI1 AE (n = 34).
Laboratory Testing
All 34 patients (100%) were positive for antibodies against the LGI1 protein (Table 1). LGI1 antibodies were commonly detectable in serum (94%) and CSF (94%), although two patients (6%) had positive LGI1 antibodies only in the CSF and in the serum (one patient each). Hyponatremia was reported for 22 patients (65%) (Table 1). A total of 10 out of 34 patients (29%) exhibited CSF pleocytosis (median, 7 white blood cells/μl; range, 6–16) and an increased protein concentration (median, 65 mg/dl; range, 49–73 mg/dl).
Brain Image Review of LGI1 AE Patients
A total of 20 patients (59%) exhibited T2-weighted image (T2WI) or fluid-attenuated inversion recovery (FLAIR) hyperintensity on MRI. No subjects exhibited abnormal signals on T1-weighted image (T1WI). Increased signals were noted only in the MTL for 18 out of 34 patients (53%). A single subject (3%) showed isolated BG hyperintensity, and the remaining one (3%) had hyperintensity in both the MTL and BG.
A total of 31 patients (91%) showed an abnormal metabolism as determined by 18F-FDG-PET, and all of them (100%) presented with pure hypermetabolism. MTL and BG were two distinct metabolic targets in LGI1 AE patients (Figures 2A,C). Three patients (9%) exhibited increased glucose metabolism only in the MTL, whereas eight patients (23%) demonstrated BG-only hypermetabolism. The remaining 20 patients (59%) had increased metabolism in both the MTL and BG brain regions. Therefore, BG hypermetabolism was observed in 28 subjects (82%), and 68% of patients showed MTL hypermetabolism.
Concerning the diagnosis of LGI1 AE, a comparison was made between the MRI and 18F-FDG-PET methods (Figure 1). Our diagnostic tracking showed that the sensitivity of 18F-FDG-PET was apparently superior to that of MRI (91 vs. 59%, P < 0.05), but no significant difference was noted between the two imaging modalities in regard to the median time from onset to the initial scan (82.5 vs. 75 days, P > 0.05). 18F-FDG-PET exhibited 100% metabolic changes when the MRI scans were positive; 11 out of 14 patients (79%) had altered glucose metabolism as demonstrated by 18F-FDG-PET in the presence of normal or unremarkable MRI scans (Figure 2B), and seven of them (64%) had isolated BG hypermetabolism.
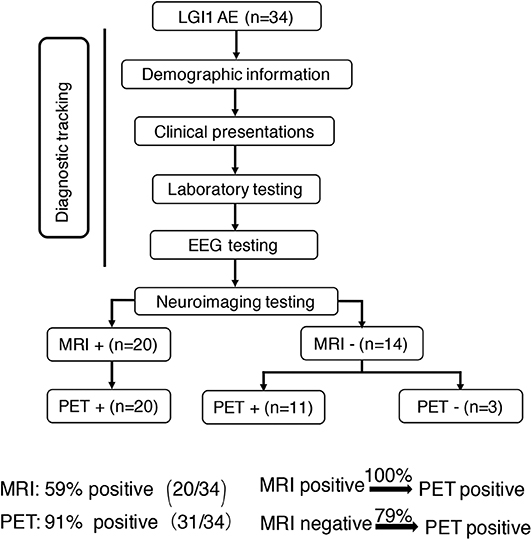
Figure 1. Neuroimaging testing in the diagnostic tracking of LGI1 AE. Neuroimaging testing plays an essential role in the diagnosis of LGI1 AE. The sensitivity of 18F-FDG-PET was higher than that of MRI; the 18F-FDG-PET scan was always positive when the MRI was positive, but when the MRI scan was negative for the diagnosis of LGI1 AE, 79% of the patients were still positive on the 18F-FDG-PET scan. LGI1, leucine-rich glioma-inactivated 1; AE, autoimmune encephalitis; EEG, electroencephalogram; MRI, magnetic resonance imaging; PET, 18F-fluoro-2-deoxy-d-glucose positron emission tomography; +, positive; –, negative.
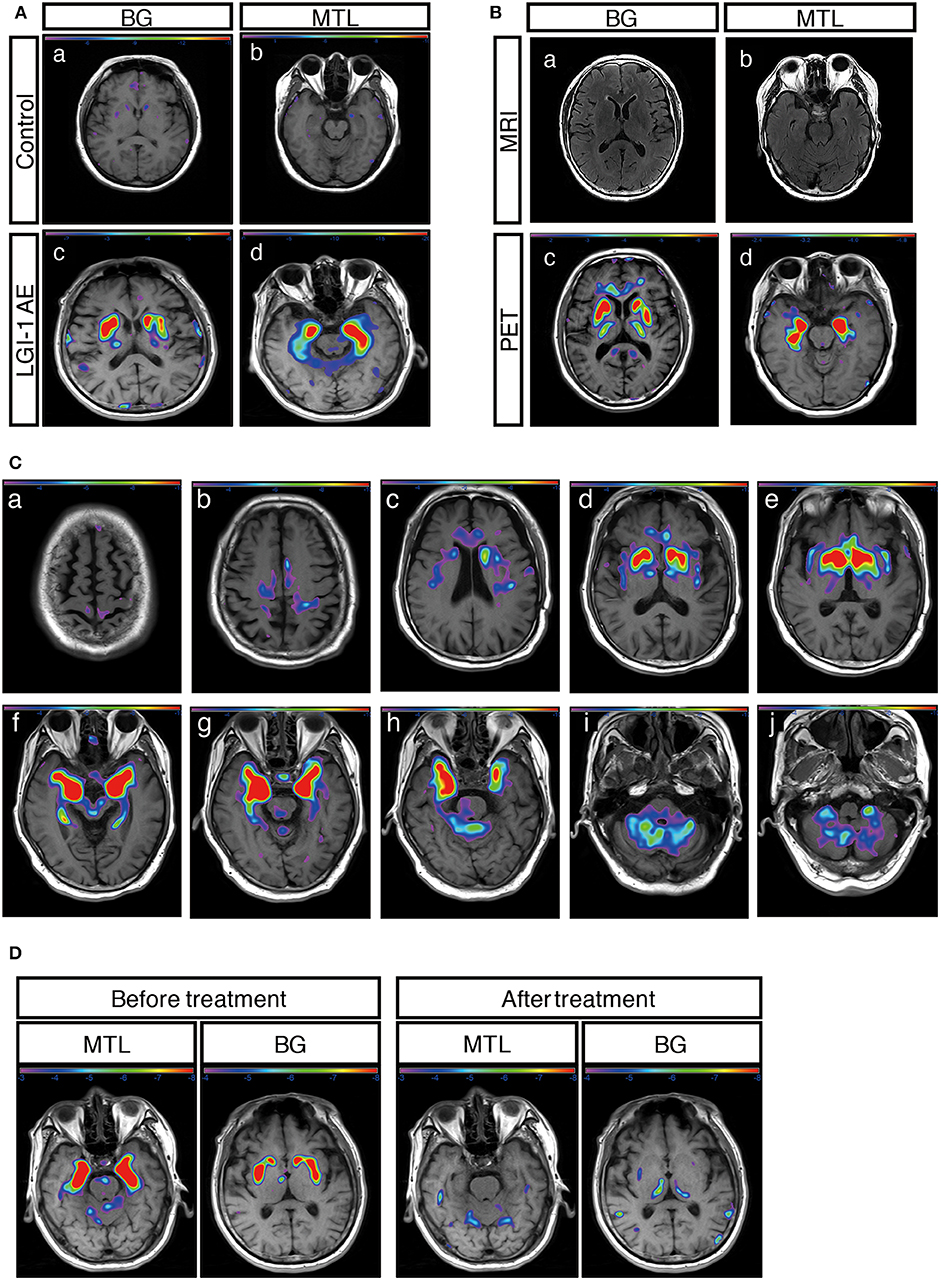
Figure 2. 18F-FDG-PET metabolic pattern in patients with LGI1 AE. (A) Typical BG and MTL hypermetabolism based on 18F-FDG-PET in patients with LGI1 AE. Age-matched control patients with colorectal cancer in the absence of central nervous system lesions indicating healthy metabolism in the BG (a) and MTL (b). Representative increased metabolism in the BG (c) and MTL (d) in a patient with LGI1 AE. (B) MRI-negative and PET-positive metabolic patterns in LGI1 AE subjects. The axial fluid-attenuated inversion recovery image indicates a normal signal in the BG (a) and MTL (b), whereas 18F-FDG-PET reveals hypermetabolism in the identical location from the same patient with LGI1 AE (c,d). (C) The brain sequences in 18F-FDG-PET with LGI1 AE patients. Total brain 18F-FDG-PET mapping indicates the BG and MTL as two distinctive targets in LGI1 AE patients (d–h). (D) The reversible metabolic pattern in LGI1 AE. 18F-FDG-PET indicates increased 18F-FDG uptake in the BG and MTL. Furthermore, the 18F-FDG PET scan shows markedly decreased 18F-FDG uptake in the BG and MTL during the 3-month follow-up period. LGI1, leucine-rich glioma-inactivated 1; AE, autoimmune encephalitis; MRI, magnetic resonance imaging; PET, 18F-fluoro-2-deoxy-d-glucose positron emission tomography; MTL, medial temporal lobe; BG, basal ganglia.
A total of 12 subjects (35%) received a follow-up by 18F-FDG-PET, and all of them showed markedly decreased or normal uptake of 18F-FDG compared with the initial degree of metabolism; follow-ups occurred 68 ± 10 days following clinical treatment (Figure 2D).
18F-FDG-PET Pattern Among Subtypes of LGI1 AE Patients
The patients were divided into two subgroups as follows: FBDS (n = 17) and non-FBDS (n = 17). The imaging data are summarized in Tables 2, 3. In the FBDS subgroup, 18F-FDG-PET was more sensitive than MRI (94 vs. 53%, P < 0.05). A similar result was noted in the non-FBDS subgroup, although this did not reach statistical significance (88 vs. 65%, P = 0.12). For the analysis of the MRI-negative patients, the sensitivity of 18F-FDG-PET in the FBDS subgroup was significantly higher than that of the subjects in the non-FBDS subgroup (50 vs. 29%, P < 0.05; Figure 3A).
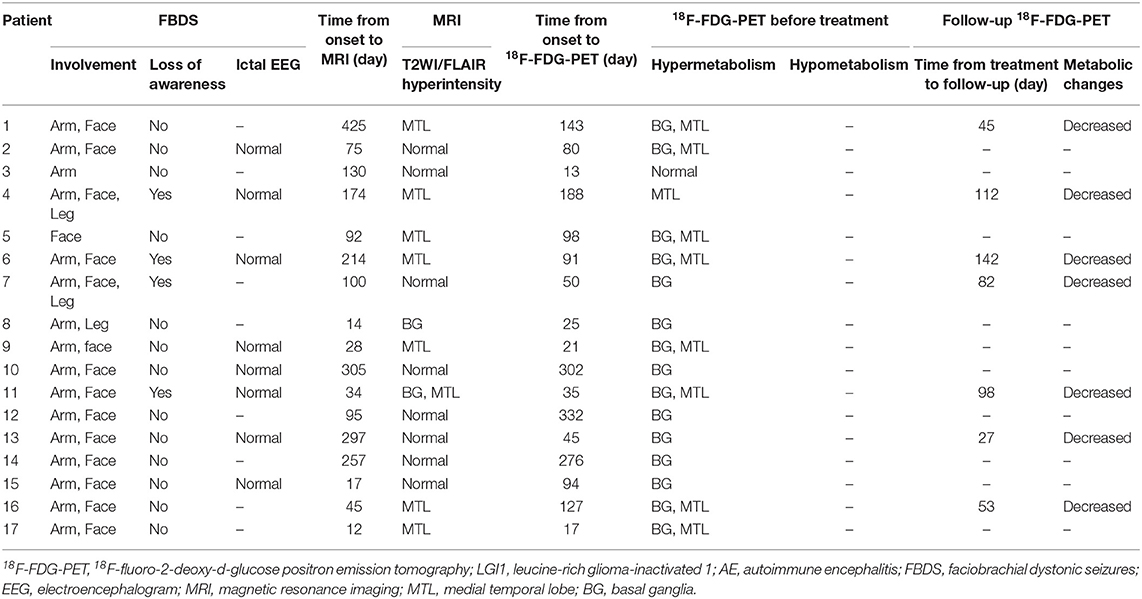
Table 2. 18F-FDG-PET characteristics of LGI1 AE patients with FBDS (n = 17).
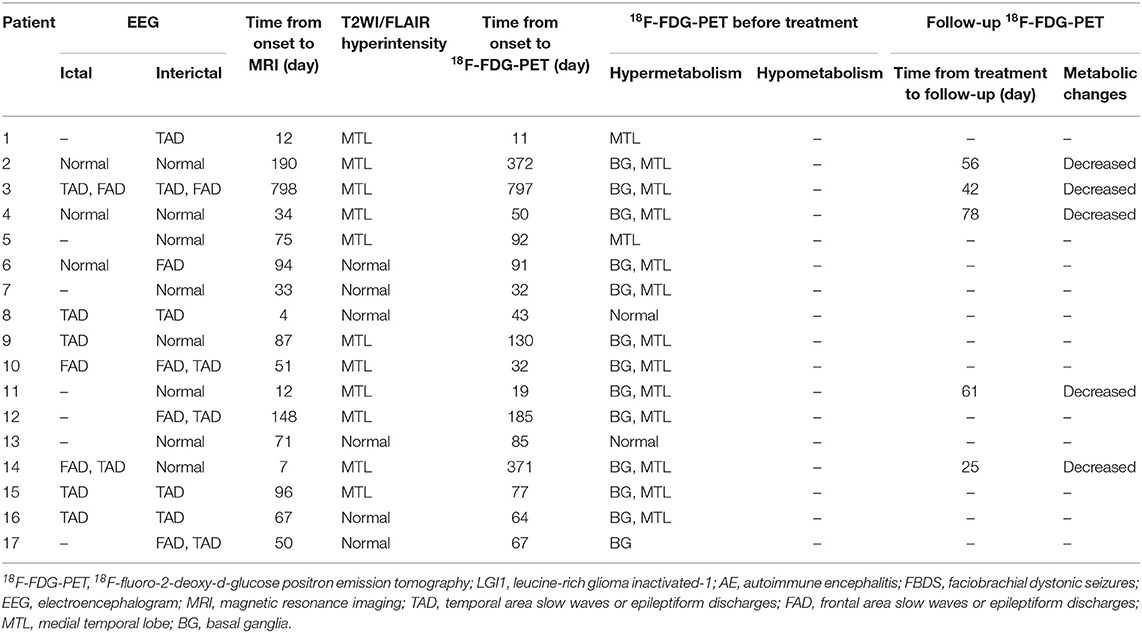
Table 3. 18F-FDG-PET features of LGI1 AE patients with non-FBDS (n = 17).
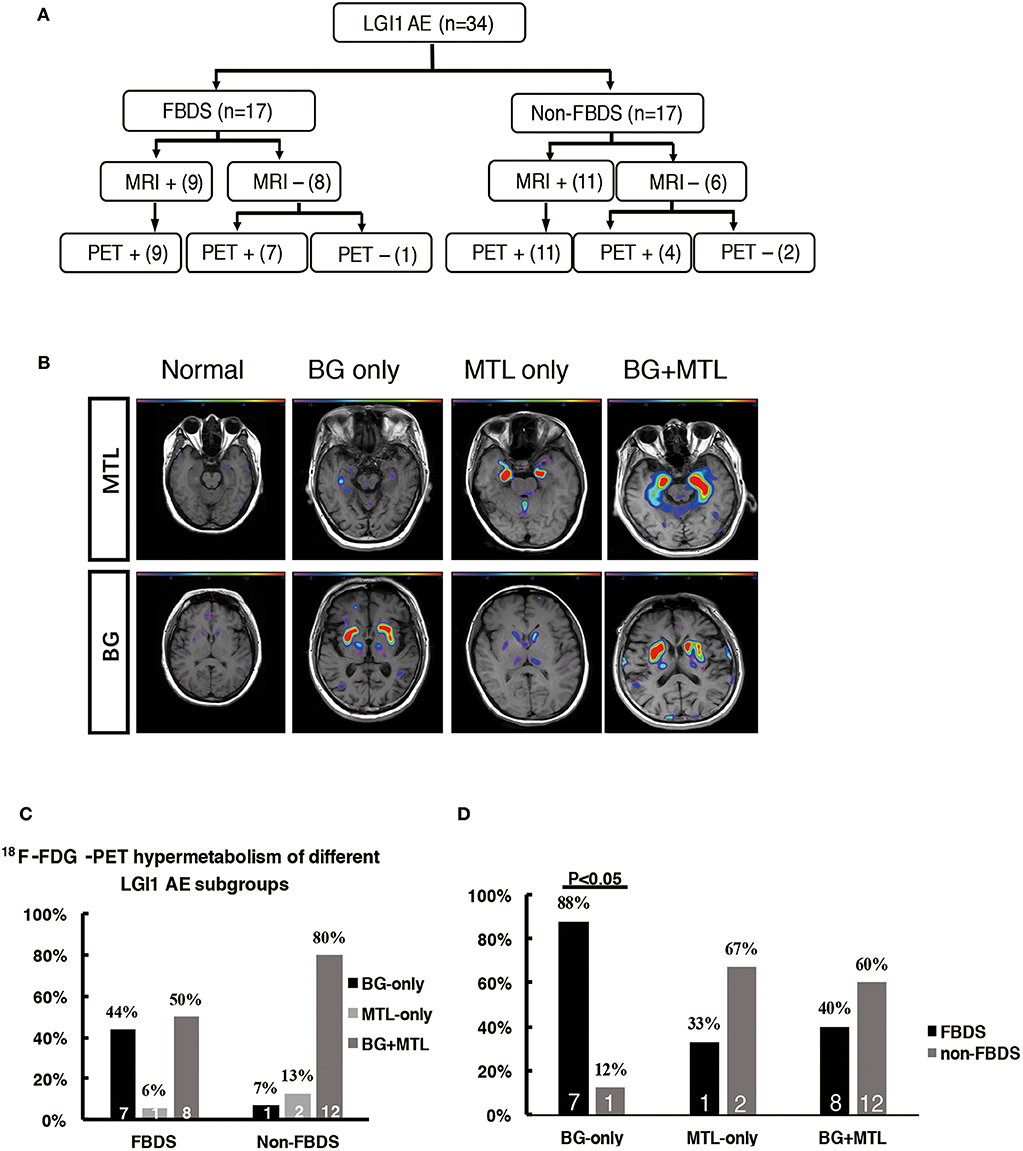
Figure 3. 18F-FDG-PET hypermetabolism in LGI1 AE patients with FBDS. (A) Neuroimaging comparison of the subgroups of LGI1 AE. (B) Representative 18F-FDG-PET hypermetabolism among different subgroups after SPM (P < 0.01) analysis. (C) The comparison of the 18F-FDG-PET hypermetabolic pattern between FBDS and non-FBDS. In the FBDS group, the abnormal PET signal more often appeared in the BG-only group and the BG + MTL group. However, in the non-FBDS group, the abnormal PET signal significantly appeared in the BG + MTL group. (D) A comparison of the 18F-FDG-PET hypermetabolic pattern in FBDS and non-FBDS. In the BG-only group, the frequency of FBDS was higher than that of non-FBDS (P < 0.001). LGI1, leucine-rich glioma-inactivated 1; AE, autoimmune encephalitis; FBDS, faciobrachial dystonic seizures; MRI, magnetic resonance imaging; PET, 18F-fluoro-2-deoxy-d-glucose positron emission tomography; MTL, medial temporal lobe; BG, basal ganglia. +, positive; –, negative.
A total of 31 patients (FBDS = 16, non-FBDS = 15) demonstrated increased metabolic changes as demonstrated by 18F-FDG-PET analysis. We classified the metabolic pattern of the patients into three types (BG only, MTL only, and BG + MTL) based on the location of the lesions in every subgroup (Figures 3B–D). BG-only hypermetabolism was detected in 7 out of 16 subjects (44%) with FBDS, but this pattern was detected in only one patient with non-FBDS (1/15) (44 vs. 7%, P < 0.05; Figure 3C). In the subgroup of BG only, a total of seven patients (88%) presented with FBDS, and one subject manifested with non-FBDS (P < 0.05; Figure 3D). No significant differences were noted between the two subgroups regarding the time from onset to initial 18F-FDG-PET scan (70.5 vs. 72 days, P = 0.53).
Literature Review on 18F-FDG-PET Findings in Subtypes of AE
A total of 124 subjects with AE and PET scans were reviewed as shown in Table 4. For anti-NMDAR encephalitis, 18F-FDG-PET mainly presented with hypometabolism in the occipital (63%) and parietal (42%) areas, in the BG (33%) and the temporal lobe (29%) (14, 19–27). Patients with CASPR2 and GABAB showed no specific metabolic pattern due to the limitations regarding the number of cases (19, 30–32). However, abnormal metabolism in the BG and temporal lobe was observed in 77 and 62%, respectively, of subjects with LGI1 AE, and this pattern was relatively specific compared to the results in other subtypes of AE (4, 11, 17–19, 21, 28, 29).
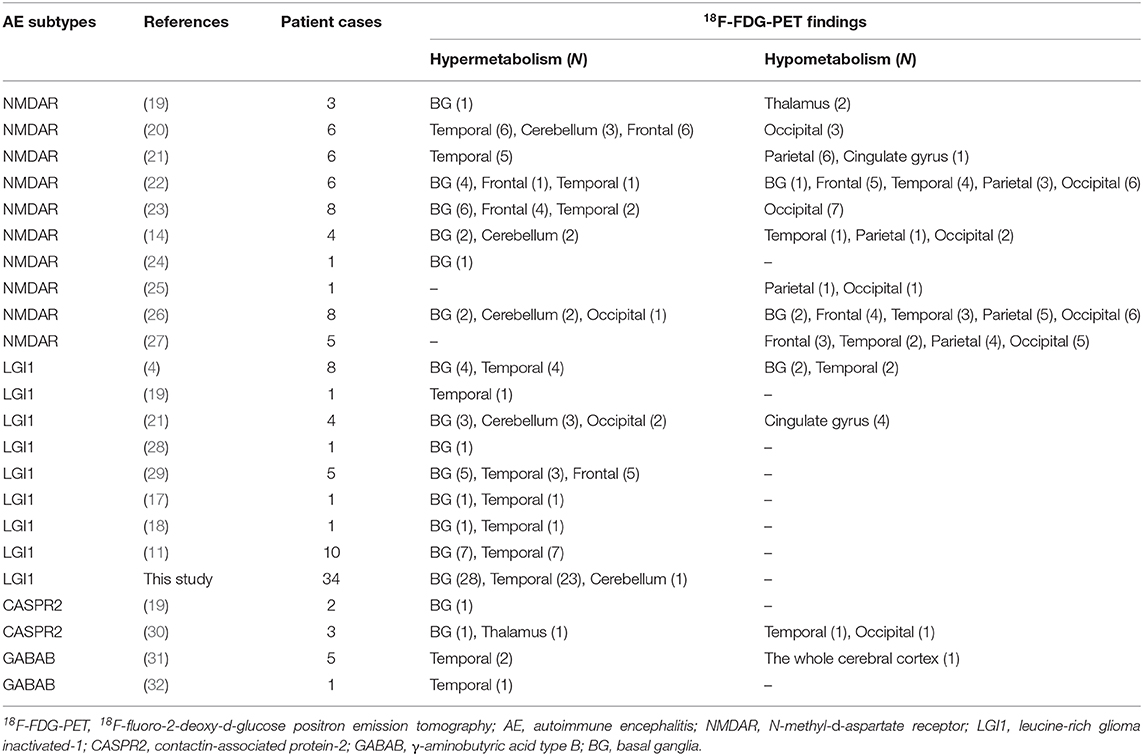
Table 4. Literature review of 18F-FDG-PET pattern in subtypes of AE.
Semiquantitative Analysis Based on the 18F-FDG-PET Normalized SUVmax Value
To support the SPM voxel-based analysis results (P < 0.01) shown in our figures, we also performed a VOI standardized uptake max value (SUVmax) data analysis. We showed different raw metabolism patterns in different cases, such as normal, BG only, MTL only, and BG + MTL (Figure 4A), and quantified the normalized SUVmax value (Figure 4B). For the BG threshold, the ROC statistical results showed that the area under the curve (AUC) value was 0.973, that sensitivity was 91.2%, that specificity was 100%, and that the best cutoff value was 1.8. For the MTL threshold, the ROC analysis showed that the AUC value was 0.938, that sensitivity was 82.4%, that specificity was 95%, and that the best cutoff value was 1.3. Our semiquantitative analysis results showed that the normalized SUVmax value in the BG and MTL was higher than that in controls, which suggested that the metabolism of BG and MTL was indeed increased and further supported our SPM data.
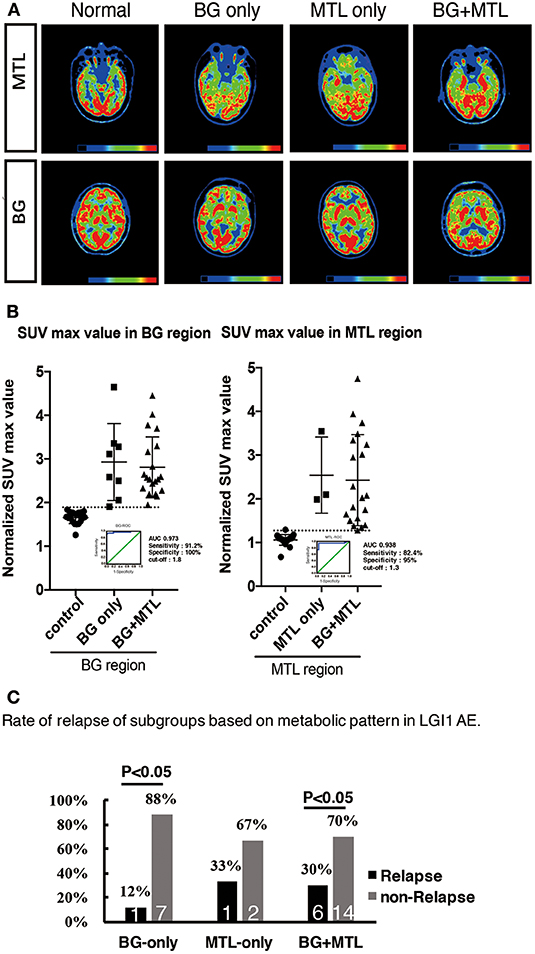
Figure 4. 18F-FDG-PET hypermetabolism in eight patients with LGI1 AE recurrence. (A) Representations of the distribution of metabolic patterns without SPM analysis. (B) Normalized SUVmax value in different brain regions and the threshold of BG and MTL based on ROC. (C) The rate of relapse of the subgroups based on the metabolic pattern. The findings showed that patients presenting with BG-only or BG + MTL hypermetabolism had a lower rate of relapse (P < 0.05). LGI1, leucine-rich glioma-inactivated 1; AE, autoimmune encephalitis; 18F-FDG-PET, 18F-fluoro-2-deoxy-d-glucose positron emission tomography; BG, basal ganglia; MTL, medial temporal lobe.
18F-FDG-PET Characteristics of LGI1 AE Patients in Different Clinical Phases
Eighteen patients (53%) were in the acute phase, and 16 patients (47%) were in the chronic phase at the time of PET. In the acute phase, patients with LGI1 AE on FDG-PET mainly presented with hypermetabolism in the BG (median normalized SUVmax = 2.5, IQR 2.2–3.4) and MTL (median normalized SUVmax = 1.5, IQR 1.3–3.2) compared with 20 normal subjects. BG (median normalized SUVmax = 2.3, IQR 2.1–3.1) and MTL (median normalized SUVmax = 1.4, IQR 1.3–2.1) on FDG-PET showed still a hypermetabolism in the chronic phase. FDG-PET hypermetabolism was specifically located in the BG and MTL, whether it was in the acute phase or chronic phase (P < 0.001). However, there was no statistical metabolic change between acute and chronic phases for BG and MTL (Figure 5).
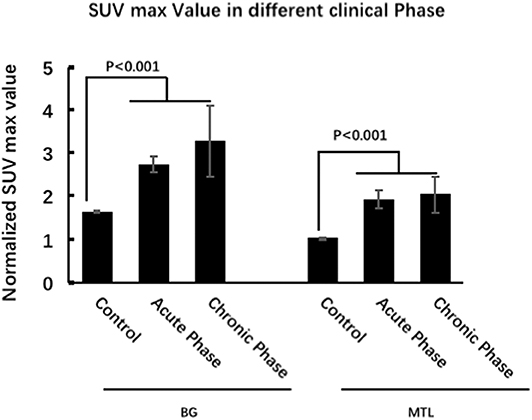
Figure 5. 18F-FDG-PET characteristics of LGI1 AE patients in different clinical phases. FDG-PET hypermetabolism was specifically located in the BG and MTL, whether it was in the acute phase or chronic phase, and there is no statistical metabolic change between acute and chronic phases for BG and MTL. LGI1, leucine-rich glioma-inactivated 1; AE, autoimmune encephalitis; 18F-FDG-PET, 18F-fluoro-2-deoxy-d-glucose positron emission tomography; BG, basal ganglia; MTL, medial temporal lobe.
EEG Features
The EEG characteristics of all subjects during the ictal and interictal phases were reviewed. A total of 25 patients (74%) experienced EEG abnormalities, which mainly included ictal or interictal EEG with slow wave activities and epileptic discharge in the temporal and frontal regions. However, no rhythmic discharges related to FBDS were noted except for artifacts of movements that were observed at the onset of dystonic seizures in eight patients with FBDS during the ictal phase. One subject with FBDS showed questionable low voltages in the right central and parietal areas around 5 s from onset (Figure 6A), and postictal EEG demonstrated rhythmic slow wave activity in the left temporal region after the termination of FBDS, which was accompanied by hand automatism (Figure 6B).
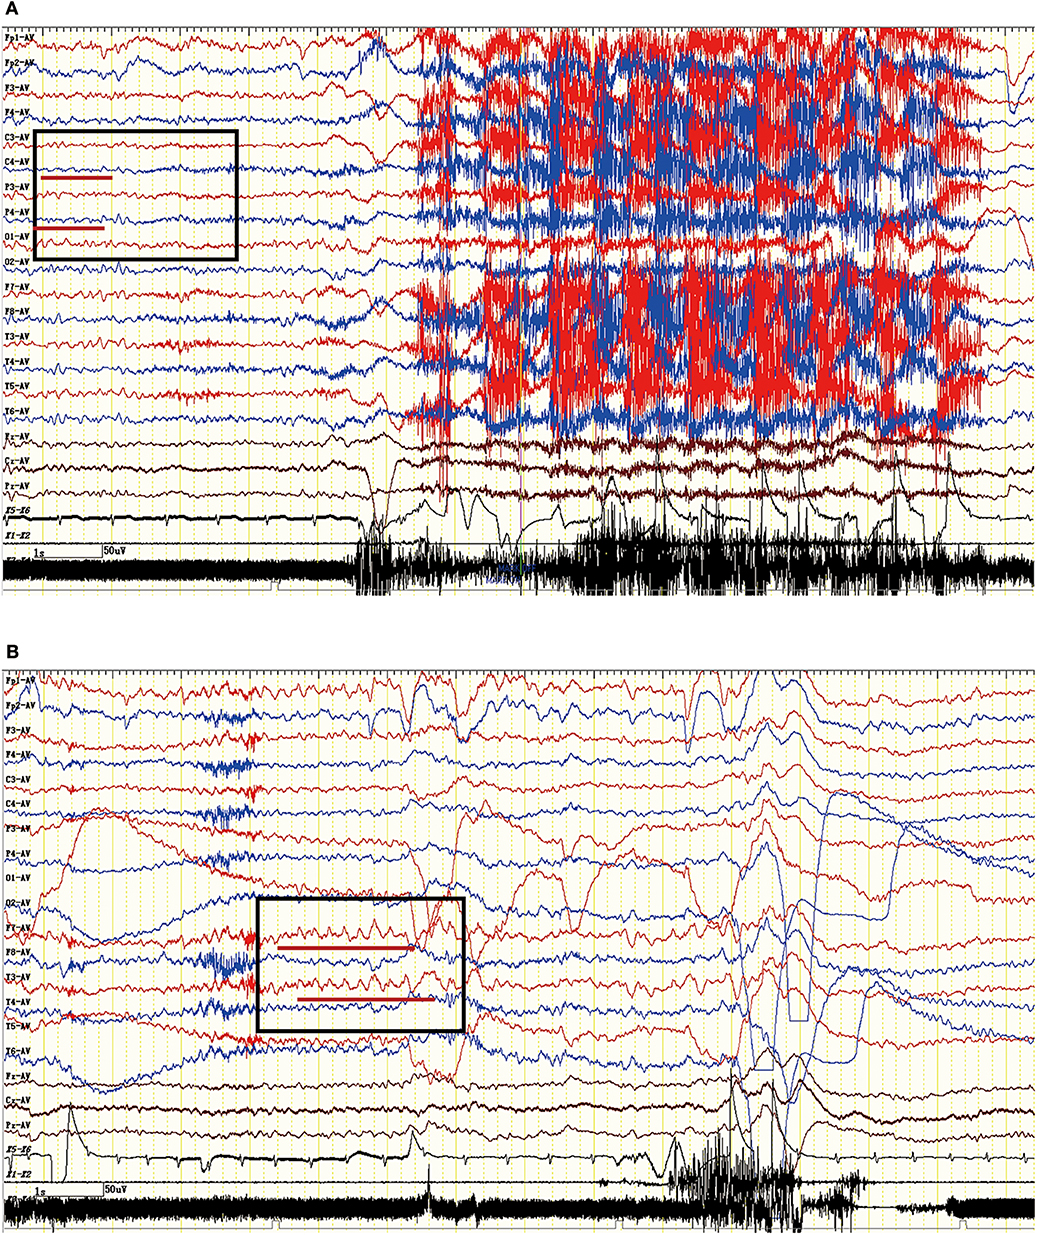
Figure 6. Ictal EEG pattern in an LGI1 AE patient with FBDS. (A) The ictal EEG of a 50-year-old woman with FBDS. No significant rhythm changes were noted except for artifacts of movements that were observed at the onset of the dystonic seizures. However, the EEG indicated low voltage in the right central and parietal areas before 5 s from onset (square frame). (B) The postictal EEG of the patient with FBDS. The EEG demonstrated rhythmic slow wave activity in the left temporal region (square frame) after the termination of FBDS, which was accompanied by hand automatism. LGI1, leucine-rich glioma-inactivated 1; AE, autoimmune encephalitis; FBDS, faciobrachial dystonic seizures; EEG, electroencephalogram.
Treatment and Follow-Up
All 34 patients (100%) were treated with first-line immunotherapy, including IV immunoglobulin (IVIG), IV methylprednisolone (IVMP), and oral steroids (for at least 6 months). A total of 26 patients (76%) were administered IVIG in combination with IVMP, whereas three patients (9%) used isolated IVIG and five patients (15%) received IVMP alone. Only one patient was administered azathioprine and mycophenolate mofetil (MMF) owing to the progression of the disease. Modified Rankin scores (mRS) were applied to evaluate the treatment response. Most patient conditions were improved following immunomodulatory therapies (mRS ≤ 2).
However, eight patients (24%) had a recurrence after a median follow-up of 1.55 years (range, 0.3–4 years). The distribution of metabolic patterns in the eight patients who relapsed is shown in Figure 4C. In the group with BG-only hypermetabolism, only one subject (12%) had a recurrence, and the remaining seven patients did not experience a relapse (P < 0.05). One patient (33%) who demonstrated MTL-only hypermetabolism experienced recurrence after a follow-up of 1 year. Six patients (30%) experienced a relapse, and 14 subjects did not relapse in the group with hypermetabolism in both the BG and MTL (P < 0.05). This showed that patients presenting with BG-only or BG + MTL hypermetabolism had a lower rate of relapse (P < 0.05).
Discussion
In this study, we demonstrated that MRI plays a significant role in the diagnosis of anti-LGI1 encephalitis, whose main features are MTL or BG hyperintensities on T2WI/FLAIR. MRI was abnormal in 59% of subjects with LGI1 AE. We also described a specific metabolic pattern of 18F-FDG-PET among a cohort of subjects with anti-LGI1 encephalitis and further compared functional PET imaging with structural MRI regarding the diagnosis of LGI1 AE. The rate of abnormal brain metabolism based on 18F-FDG-PET imaging was 91%, and 18F-FDG-PET imaging was diagnostically more sensitive than MRI in patients with LGI1 AE, with 79% of subjects exhibiting altered glucose metabolism on 18F-FDG-PET in the absence of any abnormal MRI findings. The associated locations of the abnormal metabolism mainly included the BG and MTL, and the rate of abnormal findings in the BG and MTL was 82 and 68%, respectively. Our results suggest that 18F-FDG-PET abnormalities may support the evidence for a clinical diagnosis of subjects with anti-LGI1 encephalitis. In addition, this study introduces a novel 18F-FDG-PET pattern consisting of isolated striatal hypermetabolism in subjects with LGI1-mediated FBDS. Isolated striatal hypermetabolism was detected in 44% of subjects with FBDS but only in 7% of patients without FBDS. As a subject without FBDS exhibited isolated striatal hypermetabolism, we concluded that the BG might also be involved in the development of FBDS to a certain extent.
Brain glucose metabolism is closely associated with neuronal activity. Regional hypermetabolism may reflect exuberant neuronal activities induced by the inflammatory lesions of encephalitis. Furthermore, abnormalities in brain metabolic dysfunction usually change dynamically and currently precede structural changes. Our results primarily showed hypermetabolism or a healthy metabolism based on 18F-FDG-PET scans in LGI1 AE subjects at first hospitalization, which was potentially consistent with prior studies (4, 11). In addition, similar to previous studies (16, 17), 18F-FDG-PET indicated a reversible metabolic pattern in 12 patients who received follow-up. This observation supported the finding that 18F-FDG-PET exhibited an optimal correlation with disease severity and the hypothesis that it might be used to evaluate treatment response in LGI1 AE patients.
Our results mainly showed an abnormal metabolic pattern among LGI1 AE subjects in the BG and MTL. However, we also found abnormal hypermetabolism in the striatal, cerebellar, and cortex areas in some individual cases (data not shown) (21, 29). Furthermore, prior reports showed that BG and MTL hypermetabolism was also found in some individual cases in other subtypes of AE (20, 21). However, this observation was not specific to the metabolic pattern of anti-LGI1 encephalitis; our study reviewed 18F-FDG-PET patterns in AE and found that the BG and MTL were two distinctive targets in subjects with LGI1 AE compared to other subtypes of AE. Therefore, we may need more prospective studies to illustrate the metabolic pattern of other AE subtypes and to further evaluate the clinical value of striatal hypermetabolism for LGI1 AE subjects.
The origin of FBDS has been extensively debated, but no definite conclusions have been reached to date. Ictal EEG and neuroimaging examinations are the two main methods in current clinical use for explaining the etiology or localization of FBDS. On the one hand, ictal EEG mainly suggests an epileptic origin for FBDS, showing slow waves or epileptiform discharges in the temporal area during FBDS (4, 6, 33). On the other hand, neuroimaging examinations primarily suggest a BG localization, based on the evidence that the structural and functional changes in the striatum are easily detected in subjects with LGI1-associated FBDS (7, 18). Our study showed that pure BG hypermetabolism accounted for a higher proportion of FBDS, and it rarely appeared in subjects without FBDS in terms of functional 18F-FDG-PET. Furthermore, ictal EEG simultaneously indicated no rhythmic epileptic discharges during the ictal phase of FBDS. Hence, this study suggests that abnormalities of the BG might be involved in the etiology of FBDS and further supports the hypothesis that LGI1-associated FBDS is more likely a form of movement disorder rather than an epileptic disease in nature. However, some authors also hypothesize that FBDS might originate from a network dysfunction between the cortical and subcortical areas (28). Thus, future studies are crucial to provide more evidence to settle this controversy by correlating quantitative FDG metabolic uptake values in the BG with the severity of FBDS and further evaluating the existence of lateralized correlations between striatal metabolic changes and the physical aspects of FBDS.
The main limitations of this study are as follows. (1) The study is retrospective in nature: as not all subjects diagnosed with LGI1 AE during the observation period consented to performing an 18F-FDG-PET examination, a potential selection bias due to the small sample size may have been introduced. (2) Not all subtypes of AE were represented to be evaluated for an FDG pattern. (3) At the time point of the study, the diagnosis of LGI1 AE was mainly based on detection of antibodies, which might not necessarily match the final definite diagnosis in the further course of the disease. Therefore, our study was exploratory, and confirmatory tests should be taken with caution. Extensive prospective studies are required to verify the metabolism patterns of LGI1 AE, and a standardized 18F-FDG-PET protocol is also needed to meet the requirements for diagnosing LGI1-associated AE.
Conclusion
18F-FDG-PET imaging was more sensitive than MRI in the diagnosis of anti-LGI1 encephalitis, and BG and MTL hypermetabolism are two distinctive targets for LGI1 AE compared to other subtypes of AE. Isolated BG hypermetabolism was more frequently observed in subjects with FBDS and potentially suggests the involvement of BG.
Data Availability Statement
The datasets generated for this study are available on request to the corresponding author.
Ethics Statement
The studies involving human participants were reviewed and approved by this study was approved by the Ethics committee of the Beijing Tiantan hospital that was affiliated to the Capital Medical University of the People's Republic of China. The patients/participants provided their written informed consent to participate in this study.
Author Contributions
XL, WSha, and QW recruited, diagnosed, and assessed patients. XL, WSha, QW, XZ, JR, GR, CC, WShi, RL, ZL, and YL worked on the establishment of the separate databases. XL and WSha drafted a significant portion of the manuscript or figures. LA and QW reanalyzed and interpreted all final data. All authors contributed to the current version of the paper regarding conception or design, data analysis or editing, and read and approved the final manuscript.
Funding
This study was supported by the National Key R&D Program of China 2017YFC1307500, Beijing-Tianjin-Hebei Cooperative Basic Research Program H2018206435, Capital Healthy Development Research Funding 2016-1-2011, the National Natural Science Foundation of China (Grant Nos. 81801280 and 81601126), Beijing Postdoctoral Research Foundation (ZZ 2019-09), and China Postdoctoral Science Foundation (No. 2019M660719).
Conflict of Interest
The authors declare that the research was conducted in the absence of any commercial or financial relationships that could be construed as a potential conflict of interest.
Acknowledgments
The authors also thank the patients for their participation, all referring physicians, and Yanxue Zhao and Wei Zhang for technical assistance.
Supplementary Material
The Supplementary Material for this article can be found online at: https://www.frontiersin.org/articles/10.3389/fneur.2020.00418/full#supplementary-material
Supplementary Figure 1. The volume of quantitative 18F-FDG-PET based on VOI in one representative subject. For the frontal cortex, the size of the volume was 25 * 20 * 9.9mm, and the center coordinate of the volume was 72, 135, 30. For the MTL, the size of the volume was 40 * 25 * 9.9mm, and the center coordinate of the volume was 112, 103, 18. For the BG, it was 40 * 30 * 9.9mm, and the center coordinate was 109, 110, 23. 18F-FDG-PET, 18F-fluoro-2-deoxy-d-glucose positron emission tomography; VOI, volume of interest; MTL, medial temporal lobe; BG, basal ganglia.
Abbreviations
18F-FDG-PET, 18F-Fluoro-2-deoxy-d-glucose positron emission tomography; AE, autoimmune encephalitis; AMPAR, α-amino-3-hydroxy-5-methyl-4-isoxazolepropionic acid receptor; BG, basal ganglia; CASPR2, contactin-associated protein-2; CSF, cerebrospinal fluid; CT, computed tomography; EEG, electroencephalogram; FBDS, faciobrachial dystonic seizures; GABAB, γ-aminobutyric acid type B; LGI1, leucine-rich glioma-inactivated 1; MTL, medial temporal lobe; MRI, magnetic resonance imaging; NMDAR, N-methyl-D-aspartate receptor; SPM, statistical parametric mapping; SUVmax, standardized uptake max value.
References
1. Lai M, Huijbers MGM, Lancaster E, Graus F, Bataller L, Balice-Gordon R, et al. Investigation of LGI1 as the antigen in limbic encephalitis previously attributed to potassium channels: a case series. Lancet Neurol. (2010) 9:776–85. doi: 10.1016/s1474-4422(10)70137-x
2. van Sonderen A, Thijs RD, Coenders EC, Jiskoot LC, Sanchez E, de Bruijn MA, et al. Anti-LGI1 encephalitis: clinical syndrome and long-term follow-up. Neurology. (2016) 87:1449–56. doi: 10.1212/WNL.0000000000003173
3. Simabukuro MM, Nobrega PR, Pitombeira M, Cavalcante WCP, Grativvol RS, Pinto LF, et al. The importance of recognizing faciobrachial dystonic seizures in rapidly progressive dementias. Dement Neuropsychol. (2016) 10:351–7. doi: 10.1590/s1980-5764-2016dn1004016
4. Irani SR, Michell AW, Lang B, Pettingill P, Waters P, Johnson MR, et al. Faciobrachial dystonic seizures precede LGI1 antibody limbic encephalitis. Ann Neurol. (2011) 69:892–900. doi: 10.1002/ana.22307
5. Striano P. Faciobrachial dystonic attacks: seizures or movement disorder? Ann Neurol. (2011) 70:179–80. doi: 10.1002/ana.22470
6. Andrade DM, Tai P, Dalmau J, Wennberg R. Tonic seizures: a diagnostic clue of anti-Lgi1 encephalitis? Neurology. (2011) 76:1355–7. doi: 10.1212/WNL.0b013e3182152808
7. Flanagan EP, Kotsenas AL, Britton JW, McKeon A, Watson RE, Klein CJ, et al. Basal ganglia T1 hyperintensity in LGI1-autoantibody faciobrachial dystonic seizures. Neurol Neuroimmunol Neuroinflamm. (2015) 2:e161. doi: 10.1212/NXI.0000000000000161
8. Thompson J, Bi M, Murchison AG, Makuch M, Bien CG, Chu K, et al. The importance of early immunotherapy in patients with faciobrachial dystonic seizures. Brain. (2018) 141:348–56. doi: 10.1093/brain/awx323
9. Irani SR, Stagg CJ, Schott JM, Rosenthal CR, Schneider SA, Pettingill P, et al. Faciobrachial dystonic seizures: the influence of immunotherapy on seizure control and prevention of cognitive impairment in a broadening phenotype. Brain. (2013) 136(Pt 10):3151–62. doi: 10.1093/brain/awt212
10. Graus F, Titulaer MJ, Balu R, Benseler S, Bien CG, Cellucci T, et al. A clinical approach to diagnosis of autoimmune encephalitis. Lancet Neurol. (2016) 15:391–404. doi: 10.1016/S1474-4422(15)00401-9
11. Shin YW, Lee ST, Shin JW, Moon J, Lim JA, Byun JI, et al. VGKC-complex/LGI1-antibody encephalitis: clinical manifestations and response to immunotherapy. J Neuroimmunol. (2013) 265:75–81. doi: 10.1016/j.jneuroim.2013.10.005
12. Heine J, Pruss H, Bartsch T, Ploner CJ, Paul F, Finke C. Imaging of autoimmune encephalitis–relevance for clinical practice and hippocampal function. Neuroscience. (2015) 309:68–83. doi: 10.1016/j.neuroscience.2015.05.037
13. Morbelli S, Arbizu J, Booij J, Chen MK, Chetelat G, Cross DJ, et al. The need of standardization and of large clinical studies in an emerging indication of [(18)F]FDG PET: the autoimmune encephalitis. Eur J Nucl Med Mol Imaging. (2017) 44:353–7. doi: 10.1007/s00259-016-3589-9
14. Probasco JC, Solnes L, Nalluri A, Cohen J, Jones KM, Zan E, et al. Abnormal brain metabolism on FDG-PET/CT is a common early finding in autoimmune encephalitis. Neurol Neuroimmunol Neuroinflamm. (2017) 4:e352. doi: 10.1212/NXI.0000000000000352
15. Morbelli S, Djekidel M, Hesse S, Pagani M, Barthel H. Role of 18F-FDG-PET imaging in the diagnosis of autoimmune encephalitis. Lancet Neuro. (2016) 15:1009–10. doi: 10.1016/s1474-4422(16)30140-5
16. Park S, Choi H, Cheon GJ, Wook Kang K, Lee DS. 18F-FDG PET/CT in anti-LGI1 encephalitis: initial and follow-up findings. Clin Nucl Med. (2015) 40:156–8. doi: 10.1097/RLU.0000000000000546
17. Kunze A, Drescher R, Kaiser K, Freesmeyer M, Witte OW, Axer H. Serial FDG PET/CT in autoimmune encephalitis with faciobrachial dystonic seizures. Clin Nucl Med. (2014) 39:e436–8. doi: 10.1097/RLU.0000000000000372
18. Lopez Chiriboga AS, Siegel JL, Tatum WO, Shih JJ, Flanagan EP. Striking basal ganglia imaging abnormalities in LGI1 ab faciobrachial dystonic seizures. Neurol Neuroimmunol Neuroinflamm. (2017) 4:e336. doi: 10.1212/NXI.0000000000000336
19. Baumgartner A, Rauer S, Mader I, Meyer PT. Cerebral FDG-PET and MRI findings in autoimmune limbic encephalitis: correlation with autoantibody types. J Neurol. (2013) 260:2744–53. doi: 10.1007/s00415-013-7048-2
20. Leypoldt F, Buchert R, Kleiter I, Marienhagen J, Gelderblom M, Magnus T, et al. Fluorodeoxyglucose positron emission tomography in anti-N-methyl-D-aspartate receptor encephalitis: distinct pattern of disease. J Neurol Neurosurg Psychiatry. (2012) 83:681–6. doi: 10.1136/jnnp-2011-301969
21. Wegner F, Wilke F, Raab P, Tayeb SB, Boeck AL, Haense C, et al. Anti-leucine rich glioma inactivated 1 protein and anti-N-methyl-D-aspartate receptor encephalitis show distinct patterns of brain glucose metabolism in 18F-fluoro-2-deoxy-d-glucose positron emission tomography. BMC Neurol. (2014) 14:136. doi: 10.1186/1471-2377-14-136s
22. Lagarde S, Lepine A, Caietta E, Pelletier F, Boucraut J, Chabrol B, et al. Cerebral (18)FluoroDeoxy-glucose positron emission tomography in paediatric anti N-methyl-D-aspartate receptor encephalitis: a case series. Brain Dev. (2016) 38:461–70. doi: 10.1016/j.braindev.2015.10.013
23. Yuan J, Guan H, Zhou X, Niu N, Li F, Cui L, et al. Changing brain metabolism patterns in patients with ANMDARE: serial 18F-FDG PET/CT findings. Clin Nucl Med. (2016) 41:366–70. doi: 10.1097/RLU.0000000000001164
24. Maeder-Ingvar M, Prior JO, Irani SR, Rey V, Vincent A, Rossetti AO. FDG-PET hyperactivity in basal ganglia correlating with clinical course in anti-NDMA-R antibodies encephalitis. J Neurol Neurosurg Psychiatry. (2011) 82:235–6. doi: 10.1136/jnnp.2009.198697
25. Moubtakir A, Dejust S, Godard F, Messaoud L, Morland D. 18F-FDG PET/CT in Anti-NMDA receptor encephalitis: typical pattern and follow-up. Clin Nucl Med. (2018) 43:520–1. doi: 10.1097/RLU.0000000000002098
26. Probasco JC, Solnes L, Nalluri A, Cohen J, Jones KM, Zan E, et al. Decreased occipital lobe metabolism by FDG-PET/CT: an anti-NMDA receptor encephalitis biomarker. Neurol Neuroimmunol Neuroinflamm. (2018) 5:e413. doi: 10.1212/NXI.0000000000000413
27. Solnes LB, Jones KM, Rowe SP, Pattanayak P, Nalluri A, Venkatesan A, et al. Diagnostic value of (18)F-FDG PET/CT versus MRI in the setting of antibody-specific autoimmune encephalitis. J Nucl Med. (2017) 58:1307–13. doi: 10.2967/jnumed.116.184333
28. Boesebeck F, Schwarz O, Dohmen B, Graef U, Vestring T, Kramme C, et al. Faciobrachial dystonic seizures arise from cortico-subcortical abnormal brain areas. J Neurol. (2013) 260:1684–6. doi: 10.1007/s00415-013-6946-7
29. Navarro V, Kas A, Apartis E, Chami L, Rogemond V, Levy P, et al. Motor cortex and hippocampus are the two main cortical targets in LGI1-antibody encephalitis. Brain. (2016) 139(Pt 4):1079–93. doi: 10.1093/brain/aww012
30. Chen Y, Xing XW, Zhang JT, Wang RX, Zhao W, Tan QC, et al. Autoimmune encephalitis mimicking sporadic creutzfeldt-jakob disease: a retrospective study. J Neuroimmunol. (2016) 295–296:1–8. doi: 10.1016/j.jneuroim.2016.03.012
31. Kim TJ, Lee ST, Shin JW, Moon J, Lim JA, Byun JI, et al. Clinical manifestations and outcomes of the treatment of patients with GABAB encephalitis. J Neuroimmunol. (2014) 270:45–50. doi: 10.1016/j.jneuroim.2014.02.011
32. Su M, Xu D, Tian R. (18)F-FDG PET/CT and MRI findings in a patient with anti-GABA(B) receptor encephalitis. Clin Nucl Med. (2015) 40:515–7. doi: 10.1097/RLU.0000000000000676
Keywords: LGI1, 18F-FDG-PET, FBDS, basal ganglia, medial temporal lobe
Citation: Liu X, Shan W, Zhao X, Ren J, Ren G, Chen C, Shi W, Lv R, Li Z, Liu Y, Ai L and Wang Q (2020) The Clinical Value of 18F-FDG-PET in Autoimmune Encephalitis Associated With LGI1 Antibody. Front. Neurol. 11:418. doi: 10.3389/fneur.2020.00418
Received: 25 September 2019; Accepted: 21 April 2020;
Published: 05 June 2020.
Edited by:
Freimut Dankwart Juengling, Universität Bern, SwitzerlandReviewed by:
Valentina Garibotto, Geneva University Hospitals (HUG), SwitzerlandTino Prell, University Hospital Jena, Germany
Copyright © 2020 Liu, Shan, Zhao, Ren, Ren, Chen, Shi, Lv, Li, Liu, Ai and Wang. This is an open-access article distributed under the terms of the Creative Commons Attribution License (CC BY). The use, distribution or reproduction in other forums is permitted, provided the original author(s) and the copyright owner(s) are credited and that the original publication in this journal is cited, in accordance with accepted academic practice. No use, distribution or reproduction is permitted which does not comply with these terms.
*Correspondence: Lin Ai, YWlsaW5AYmp0dGgub3Jn; Qun Wang, d2FuZ3FAY2NtdS5lZHUuY24=
†These authors have contributed equally to this work