 Mingming Gao
 Xiaoping Yun1,2
- 1School of Rehabilitation Medicine, Capital Medical University, Beijing, China
- 2Department of Rehabilitation Evaluation, China Rehabilitation Research Center, Beijing Bo'ai Hospital, Beijing, China
- 3Neurorehabilitation Center, China Rehabilitation Research Center, Beijing Bo'ai Hospital, Beijing, China
Objective: To investigate the effect of using Vibration Sensory Analyzer-3000 (VSA-3000) in patients with impaired vibration sensation caused by central nervous system injury.
Design: Prospective observational study.
Setting: A university hospital for the research and clinical practice of rehabilitation.
Subjects: Sixty patients (30 stroke and 30 spinal cord injury) were recruited, aged between 20 and 71 years old, under stable medication.
Interventions: Not applicable.
Main Measure: VSA-3000 threshold test, tuning fork test and somatosensory evoked potential (SSEP) measurement.
Results: Test-retest reliability was determined based on data collected from 60 subjects, and the intraclass correlation coefficient (ICC) for vibration perception thresholds (VPTs) was in the “substantial” range. The kappa value between VSA-3000 and SSEP was 0.877, which was higher than that of tuning fork (κ = 0.732). VSA-3000 had good diagnostic accuracy with a sensitivity of 94.8%, specificity of 92.9%, and positive-predictive value of 93.8% and negative-predictive value of 94.0%, each value was higher than that of tuning fork. The area under the receiver operating characteristic curve (AUC) of VSA-3000 was 0.95 (95% CI: 0.91 to 0.98) and that of tuning fork was 0.89 (95% CI: 0.85 to 0.95), and there was a significant difference between the two values (P = 0.0216). The types of injury and age were the independent correlates of the VPTs.
Conclusion: The present study provides preliminary evidence that VSA-3000 is a non-invasive and convenient quantitative testing instrument with good diagnostic accuracy, and it may be useful as a screening tool for assessing impaired vibration sensation caused by central nerve injury.
Introduction
Symptoms of proprioceptive disorder are common in diseases of the central nervous system (CNS). Previous studies indicated that in 70 first stroke patients, 34–64% had impaired proprioception (1). About 50–80% of patients with spinal cord injury (SCI) have pressure ulcers caused by sensory (including proprioception) loss (2). In particular, diminished vibration sensation is an important finding in the diagnosis of disorders affecting the dorsal column-medial lemniscus pathways in the CNS and may also be an early sign of CNS diseases (3).
Traditionally, a tuning fork is used for the evaluation of the vibration sense in patients with CNS diseases. This simple instrument has the advantage of being economical, portable, and quick for gross assessment of the sensory system (4), but unfortunately does not quantitatively provide the degree of dysfunction of vibration sense. It is of clinical importance that the vibration sense should be measured quantitatively and consistently. For this purpose, electrophysiology tests have been developed (5, 6), but they are invasive, time consuming, expensive, non-portable and requires a high standard of training to perform (4).
Recently vibration perception threshold (VPT) by quantitative sensory testing (QST) has been proposed as a method to assess the somatosensory pathways in clinical trials (7, 8). Multiple studies showed that VPT was a sensitive measure of peripheral neuropathy (9–17). The QST method for measuring VPTs has shown higher reliability than the tuning fork testing (7). Meanwhile it is painless and only requires brief training in comparison with electrophysiological testing (7, 18).
As one of QST computerized devices, the Vibration Sensory Analyzer VSA-3000 (Medoc) was designed to assess vibration. VPT assessed by VSA-3000 has been most commonly used in detecting peripheral neuropathy (9, 12–14, 19–23). Recent studies showed that QST using VSA-3000 (or other devices) was also a useful adjunct measurement with good reliability of detection thresholds in central nervous system diseases (6, 24–28). However a specific analysis of its diagnostic accuracy with VSA-3000, especially as diagnostic outcome measures in patients with stroke and SCI, has not been fully established.
Therefore, this study has two aims: (1) to estimate the diagnostic accuracy of the QST using VSA-3000 in evaluating VPT, in patients with CNS injury, against the reference standard of somatosensory evoked potential (SSEP) measurements, and (2) to assess whether the VSA-3000 device offers superior accuracy compared with other routine test (e.g., the tuning fork) for impaired vibration sensation caused by CNS diseases.
Methods
Subjects
Individuals with stroke and SCI were recruited through advertisements posted at China Rehabilitation Research Center (CRRC) and Capital Medical University School of Rehabilitation Medicine, and by word of mouth (from May 2015 to March 2018). The study was approved by the Ethical Committee of CRRC.
Participants had to be: (a) age 18 years or older; (b) first-ever stroke (29) patients with unilateral sensory disturbance and with lesions in basal ganglia detected on radiological means, or patients with a thoracic or lumbar SCI; (c) medically stable conditions (patients' disease has not progressed within 1 week), ability to give informed consent and understand and cooperate with the testing. The exclusion criteria were presence of diabetes or other diseases involving neurologic impairments.
General Protocol
Subjects with stroke and SCI who met the inclusion criteria were scheduled for their first study visit. After informed consent was obtained, a neurological examination was conducted and a second visit was scheduled. During the second visit, three types of measurements (VSA-3000, tuning fork and SSEP) were conducted. Sixty participants (30 stroke and 30 SCI) in all completed an identical VSA-3000 test session ~1 to 4 weeks later to provide data for the test-retest analysis portion of the present study.
Clinical Characteristics
Each participant's age, height, course of disease, and sex were recorded in the interview. For SCI patients, additional questions regarding the cause of injury were included [falls 14 (46.7%), violence 7 (23.3%), vehicle crashes 5 (16.7%), and others 4 (13.3%)]. For each participant with stroke, an experienced physician conducted a physical examination, to assess neurological status and to diagnose the type of the stroke according to the classification of cerebrovascular disorders of World Health Organization (29). For each participant with SCI, a physician with extensive SCI experience conducted a physical examination, including the American Spinal Injury Association (ASIA) standard examination (30), to assess neurological status and determine the severity (complete or incomplete) of injury.
The demographic characteristics of subjects were shown in Table 1 and the distribution of neurological level of SCI participants was shown in Figures 1, 2.
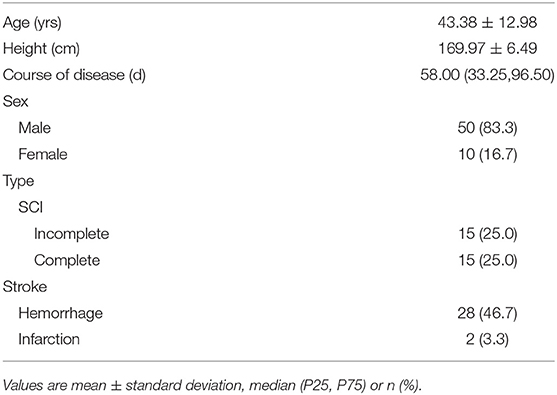
Table 1. Demographic characteristics of subjects (n = 60).
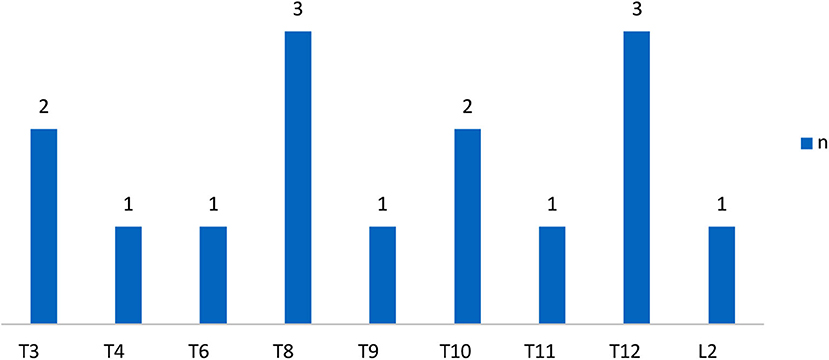
Figure 1. Distribution of neurologic levels of injury in complete SCI patients. T, thoracic levels; L, lumbar levels; (30) n, numbers.
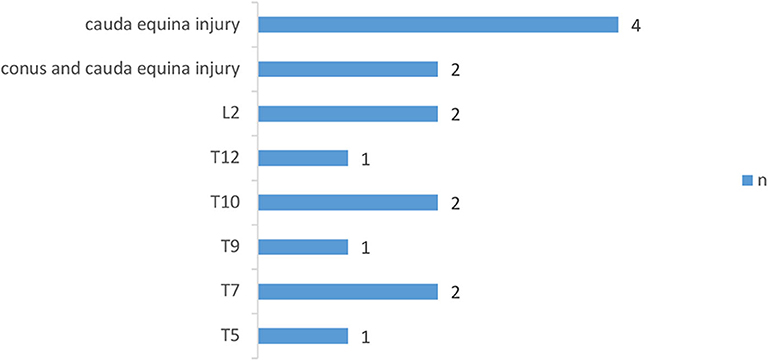
Figure 2. Distribution of neurologic levels of injury in incomplete SCI patients. T, thoracic levels; L, lumbar levels; (30) n, numbers.
Tests
All the tests were performed by experienced physicians in a quiet room with an approximate temperature between 22 and 24°C. Subjects were tested in their own wheelchair to complete the tests of VSA-3000 and tuning fork, and lying prone relaxed for SSEP tests. Before testing, the examiner explained the procedures and several pilots were performed so that subjects could be familiar with the tests.
Figure 3 outlines the sequential tests.
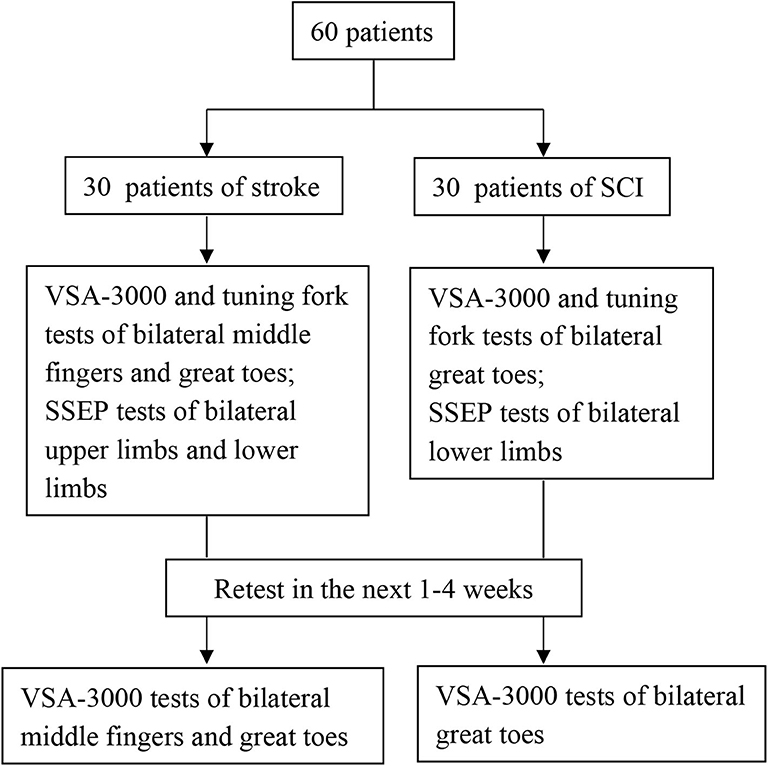
Figure 3. Flow chart of the sequential tests.
Quantitative Sensory Testing Using VSA-3000
Quantitative VPT was measured using the VSA-3000 vibratory sensory analyzer (Medoc Ltd., Israel) (Figure 4) following published protocols (31). The diameter of the stimulating probe was 1.2 cm and the vibratory stimulus was delivered at 100 Hz. The stimulating surface of the vibratory probe was placed on the hand (the palm side of the middle finger) and the foot (the plantar side of the great toe) (32).
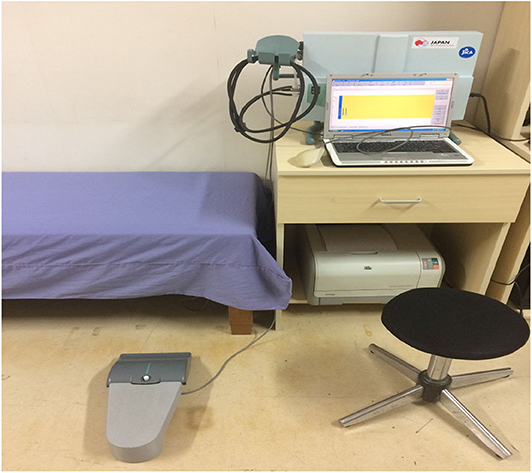
Figure 4. VSA-3000 (Medoc, Israel).
The vibratory thresholds were measured by the method of limits (33). The device delivered the stimulus with increasing intensity starting from the baseline (0 μm) at a rate of 0.8 μm/s (lower limb) or a rate of 0.4 μm/s (upper limb) until the subject indicated that the stimulus was felt or until the maximum amplitude of 130 μm was reached. Subjects were asked to indicate by clicking the mouse as soon as they felt the vibratory sensation. The next trial started again from the baseline value, with the average of three successive trials (separated by 10 s each) (25) taken as the vibration perception threshold (VPT) for each site. To include data for analyses at sites where no sensation was evoked during testing, we recorded the maximum amplitude of the vibratory stimulus (cutoff value) (VPT=130 μm) (25). According to the standard of normal values specified by the VSA-3000 manufacturer, VPTs were divided into three groups (normal, decreased, and undetected) (Table 2).
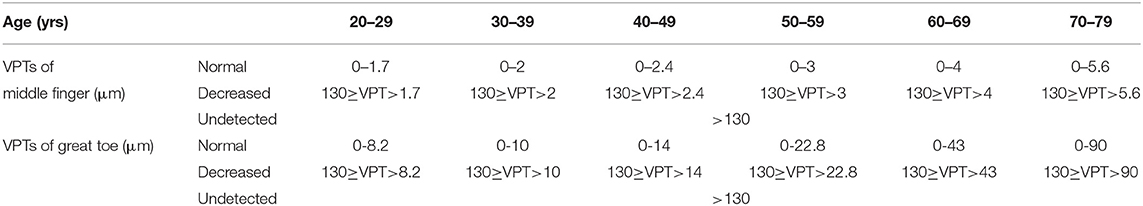
Table 2. Vibration perception thresholds (VPTs) of VSA-3000.
Physical Examination Testing Using 128 Hz Tuning Fork
The vibratory sensation was tested with a 128-Hz tuning fork at the same sites as those in the VSA-3000 test. The examiner energized the tuning fork by fully opposing the two blades together where blades touched each other, rapidly released by slipping the fingers off the blade ends (34), and then immediately placed the base of the tuning fork on the test sites. The first measurements were taken at the palm side of the right middle finger of SCI subjects or at the palm side of the unaffected side middle finger of stroke subjects as a reference vibratory sensation (regarded as normal), then testing progressed to other sites, including the plantar side of bilateral great toes of all subjects and the palm side of the affected side middle fingers of stroke subjects. In this manner, we could ask subjects to compare the quality of the sensation to the quality evoked at the reference hand. Appreciation of vibratory sensation at each site was separately scored on a 0-10 numerical rating scale scale (25, 35), with 0 = “undetected,” 1–9 = “decreased,” 10 = “normal.”
Electrophysiology Testing Using Evoked Potential Instrument
Somatosensory evoked potential (SSEP) measurements were performed by a conventional EMG machine (Dantec Keypoint, Denmark). The tibial and median SSEP were elicited by electrical stimulation (square-wave stimulation of 0.2 ms at a frequency of 3 Hz) at the ankle or wrist with the cathodes placed 2 to 3 cm proximal to the anode (36). Stimulus intensity was adjusted to produce a clear muscular response (max 30 mA) in order to assess all sensory fibers (37).
According to the international nomenclature, in the waveforms of SSEP, positive peaks are represented by downward deflections and labeled P and negative peaks are represented by upward deflections and labeled N (38). The lower limb response elicited by electrical stimulation of the tibial nerve has a main positive peak with a latency of ~40 ms labeled as P40, and the upper limb response elicited by electrical stimulation of the median nerve has a main negative peak with a latency of ~20 ms labeled as N20.
For recording, scalp electrodes (0.5 cm silver plate electrodes) were applied at Cz′/Fz and C3′/C4′/Fz using the International 10/20 electrode system (39). The electrode impedance was maintained below 5 kΩ. The amplifier was set at 5 μv/division, frequency bandpass was set at 30–3,000 Hz. Three sets of 200 responses were averaged and superimposed to ensure consistency. The P40 and N20 latencies were recorded and used for statistical analysis.
Statistical Analysis
Test-retest reliability, a measure of the stability of a test when it is administered across time without changes in other variables, was evaluated separately for SCI and stroke subjects for VSA-3000 test by using intraclass correlation coefficients (ICCs) (one-way random effects model) (40). The assessment of the level of reliability was based on Shrout's recommendations: (41) an ICC of 0.21 to 0.4 indicate “slight,” an ICC of 0.41 to 0.60 indicate “fair,” an ICC of 0.61 to 0.80 indicate “moderate,” and an ICC of 0.81 to 1.00 indicate “substantial.”
Kappa values and 95% confidence intervals (CI) were calculated to determine the degree of agreement between the data from VSA-3000 and tuning fork, VSA-3000 and SSEP, tuning fork and SSEP, respectively. Kappa values were used to test agreement between sets of results, which vary between 0 and 1 (0–0.50: slight to moderate agreement; 0.51–0.60: acceptable agreement; 0.61–0.80: substantial agreement; 0.81–1.00: almost perfect agreement) (42).
The sensitivity (ability of the test to correctly identify proprioception impairment), specificity (ability of the test to correctly identify proprioception spared), positive predictive value (proportion of positive test results that were from proprioception impaired patients), and negative predictive value (proportion of negative test results that were from proprioception spared patients) of VSA-3000 and tuning fork tests were calculated, using the results of SSEP tests as the criteria, and presented with 95% CI.
To compare the diagnostic accuracy of two types of tests against the reference standard of SSEP measurement, receiver operating characteristic (ROC) curve were constructed for each test (43), using the full range of possible thresholds per test. Areas under the receiver operating characteristic curve (AUC) are a measure of the performance of a test in predicting the outcome of interest. Generally, AUC values of 0.5 indicate that a test performs no better than chance, values between 0.70 and 0.79 indicate fair performance, values between 0.80 and 0.89 indicate good performance, and values ≥0.9 indicate excellent test performance (10). Statistical significance of the difference between the AUCs were tested with the method of DeLong et al. (44).
Stepwise multiple linear regression analysis (45) was used to examine the relationship between VPTs and age, height, gender, groups (stoke or SCI), types, and locations of injury of the patients. Types of injury were assessed by replacing types with dummy variables (cerebral hemorrhage, cerebral infarction, complete SCI, or incomplete SCI). Likewise, locations of injury were assessed by replacing locations with dummy variables (basal ganglia, SCI of thoracic levels, or SCI of lumbar levels and cauda equina injury and conus and cauda equina injury).
All analyses were performed using the version of SPSS 17.0. The significance level was set at P < 0.05.
Results
Data of VPTs and Tuning Fork
We described the VPTs measured with VSA-3000 (according to the age groups) and the tuning fork scores in Table 3. Four sites per one patient for 30 stroke patients and two sites per one patient for 30 SCI patients, therefore, in total 60 participants with 180 sites of data.
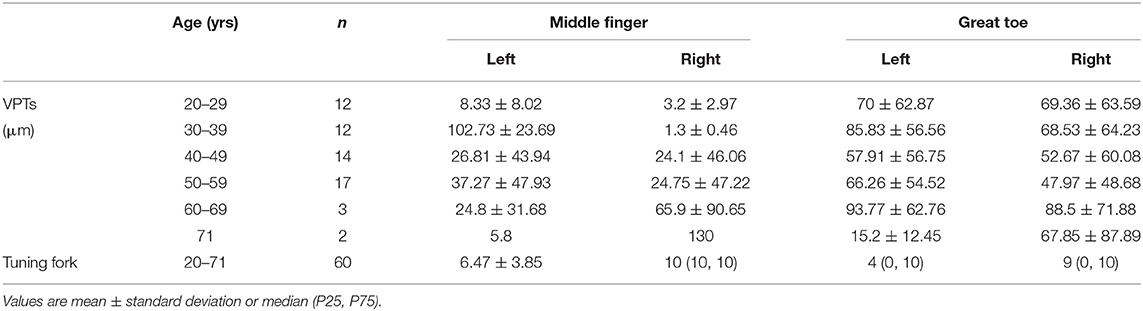
Table 3. VPTs measured with VSA-3000 and tuning fork scores.
Test-Retest Reliability
Participants in the reliability of the study completed two identical VSA-3000 test sessions with ~1 to 4 weeks between each session (mean interval = 15.7 days) (Table 4). The VPTs showed substantial reliability as the ICC is 0.91 (95% CI, 0.88~0.93).
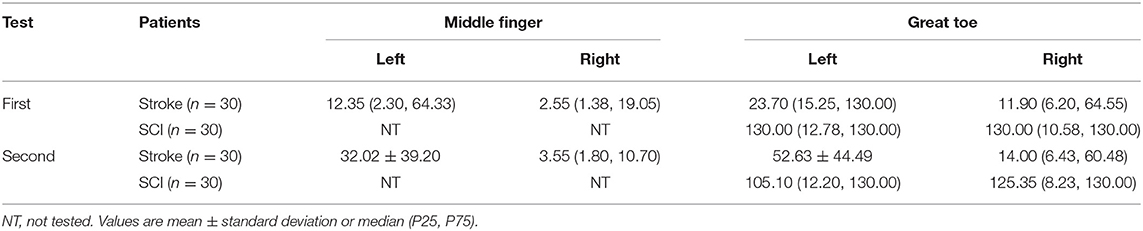
Table 4. VPT results of test–retest.
Consistency
With regard to the test results of tuning fork and VSA-3000, the kappa value was 0.731 (95% CI: 0.647 to 0.815, P < 0.001) (Table 5), indicating that the consistency of the two test results was not good enough.
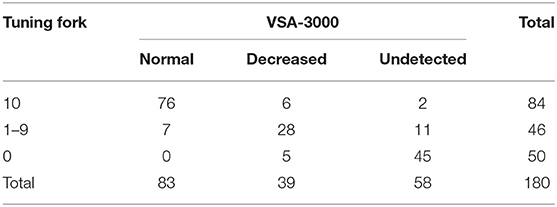
Table 5. Consistency for tuning fork and VSA-3000.
When the consistency between the test results of VSA-3000 and SSEP was examined, the kappa value was 0.877 (95% CI: 0.806 to 0.948, P < 0.001) (Table 6), indicating that there was nearly perfect agreement between the two test results.
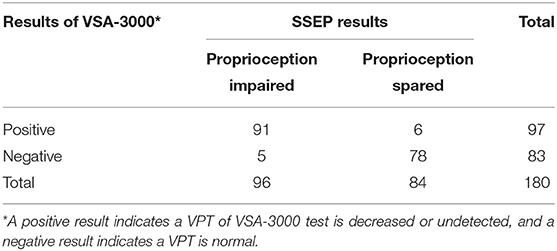
Table 6. Results for 180 sites that were tested with VSA-3000 to distinguish between proprioception impaired and spared.
Level of consistency between the test results of tuning fork and SSEP (kappa value, 0.732; 95% CI, 0.632 to 0.832; P < 0.001) (Table 7) was much lower than that between VSA-3000 and SSEP, which suggested that the test results of VSA-3000 were much closer to the SSEP test results than that of tuning fork.
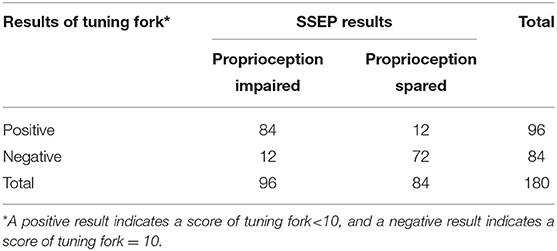
Table 7. Results for 180 sites that were tested with tuning fork to distinguish between proprioception impaired and spared.
Validity
The VSA-3000 test had a sensitivity (i.e., its ability to correctly detect proprioception impaired patients) of 94.8% (95% CI, 87.7 to 98.1%; Table 6) and a specificity (i.e., ability to correctly detect proprioception spared patients) of 92.9% (95% CI, 84.5 to 97.1%). The positive-predictive value of VSA-3000 (i.e., correctly identifying a proprioception impaired patient) was 93.8% (95% CI, 86.5 to 97.5%) and the negative-predictive value (i.e., correctly identifying a proprioception spared patient) was 94.0% (95% CI, 85.9 to 97.8%).
The tuning fork test had a sensitivity of 87.5% (95% CI, 78.8 to 93.1%) and a specificity of 85.7% (95% CI, 76.0 to 92.1%; Table 7), which were both lower than that of VSA-3000. The positive-predictive value was 87.5% (95% CI, 78.8 to 93.1%) and the negative-predictive value was 85.7% (95% CI, 76.0 to 92.1%), which were also lower than VSA-3000.
The diagnostic performance of the VSA-3000 and tuning fork (using continuous VPT outputs and tuning fork scores) in detecting proprioception perception impairment against the SSEP test results is given in the AUC using ROC curve analysis (Figure 5). The AUC for VSA-3000 is 0.95 (SE: 0.017, 95% CI: 0.91 to 0.98, P < 0.001) and the AUC for tuning fork is 0.89 (SE: 0.025, 95% CI: 0.85 to 0.95, P < 0.001). The diagnostic accuracy of VSA-3000 was significantly better than that of tuning fork (P = 0.0216 < 0.05).
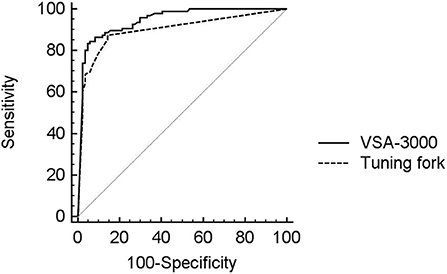
Figure 5. ROC curve analysis was used to evaluate the diagnostic performance of VSA-3000 (black line) and tuning fork (dashed line) in detecting proprioception perception impairment against SSEP results using the evoked potential instrument. The gray line is the null value of the ROC curve.
Relationship Between VPTs and Demographic Characteristics
To investigate the relationship between VPTs and demographic characteristics of subjects, we performed a stepwise multiple regression analysis (n = 60) with VPTs as the dependent variables and age, height, gender, groups (stoke or SCI), types and locations of injury of the patients as independent variables. The types of injury (complete SCI vs. other types) and age were significantly related to VPTs (R2 = 0.389, P < 0.001). None of the other factors significantly added to the model. Regression results are shown in Table 8.
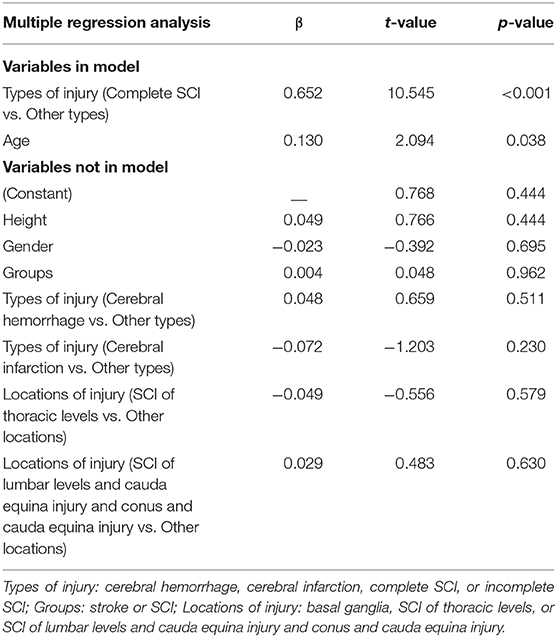
Table 8. Multiple regression analyses predicting VPTs for participants with stroke and SCI.
Discussion
The present study determined the use of VSA-3000 as potential diagnostic testing instrument for patients with CNS injury. Specifically, our primary aims were to determine the diagnostic accuracy of VSA-3000 against the reference standard of SSEP and to evaluate the superior accuracy compared with tuning fork in patients with CNS injury. Although the sample size was relatively small, this study provides preliminary support for the reliability and validity and the superior of this methodology in persons with stroke and SCI.
Reliability
In our sample of individuals with stroke and SCI, the test-retest reliability of threshold measures for vibratory detection showed substantial reliability (0.91). This result is consistent with studies in healthy, non-disabled subjects and in other patient populations (31, 46). A study by Felix and Widerström-Noga examined vibration thresholds across two test sessions in a sample of SCI patients with neuropathic pain and a sample of non-disabled control subjects, and the results showed that the ICCs were in the substantial range (0.86–0.90) (25). Two other studies have remarked on the stability of VPTs obtained in persons with SCI (24, 47). Krassioukov et al. found that the ICC in incomplete SCI patients for VPT was in the range 0.76–0.90 (24). A recent article aimed to determine the psychometric properties of the Graph-DCK Scale in people with SCI and neuropathic pain, involving detection of VPT in the test procedures, noted that ICCs for VPT were 0.83 and 0.85 for at-level assessment and below-level assessment, respectively (47). The previous studies results agree with our results, suggesting reasonable reliability of VPTs between sessions in patients with stroke and SCI.
Consistency
The high kappa value between VSA-3000 and SSEP reported in this study (0.877) indicated that there was excellent consistency between the two test results, which was higher than that between tuning fork and SSEP (0.732). Therefore, compared with tuning fork, the test results of VSA-3000 showed a higher degree of similarity to SSEP test results.
Some previous studies have focused on the relationships between VTPs and other measurements. Hayes et al.'s study found significant kappa values (denoted by κ) obtained from incomplete SCI patients for the association between VPT and light touch values for the right L4 (κ = 0.25) and left L4 (κ = 0.29) dermatomes and also a significant correlation between VPT and pinprick for the right L4 dermatome (κ = 0.33) (6). In addition, Santos et al. investigated the relationship between VPT and neuropathic signs of patients with type two diabetes, and found a clear trend toward progressively greater VPT in patients with mild and moderate/severe signs in contrast to patients with absent neuropathic signs (12).
Validity
In addition to the examination of reliability and consistency of VPTs in persons with stroke and SCI, a preliminary analysis of the validity of VSA-3000 test as diagnostic and outcome measures was also examined.
The present study used the sensitivity, specificity, positive- and negative-predictive values and ROC curves, as used by Martin et al. (10), to evaluate the utility of VPT to predict proprioception impairment.
The sensitivity and negative-predictive value of VPT obtained in our study compared favorably to Martin et al.'s study (sensitivities between 72 and 93% and negative-predictive values between 58 and 91%), however, the specificities (47–63%) and positive-predictive values (37–80%) of Martin et al.'s were lower than our study (10). The ROC curves demonstrate the clear tradeoff between sensitivity and specificity when VPT is used as a predictor of proprioception impairment. The areas under the ROC curve (AUC) suggest that VPT performance is excellent (0.95), which is higher than Martin et al.'s study of using VPT as a measure of distal symmetrical peripheral neuropathy in type 1 diabetes (0.71–0.83) (10). Two other studies have showed fairly good predictive performance of VPT. Santos et al. found the AUC of VPT for detection of diabetic peripheral neuropathy (DPN) in patients with type two diabetes was 0.71 (12), and Pritchard et al.'s study showed the AUC for diagnosis of 4-year incident DPN in type 1 diabetes was 0.74 (14).
The discrepancies between previous studies and our study may be attributed to applying in different type of diseases. The previous studies investigated VPT as a measure of peripheral neuropathy, and found VPT might provide important, clinically meaningful information about large nerve fiber dysfunction in diabetes (10). The present study used the VPT as a measure of proprioception impairment in central nervous system injury, in relation to electrophysiological testing (SSEP) as reference standard, as both measures are believed to reflect integrity of the dorsal columns (6).
In addition, the sensitivity, specificity, positive- and negative-predictive values and ROC curve of tuning fork were also evaluated, which were all lower than VPT. These results suggest that the degree of validity of tuning fork in persons with CNS diseases is similar to that seen in other patient populations. We noticed that Arshad and Alvi's study (48) showed that the tuning fork test, in patients with type 2 diabetes, had high specificity (93.70%), but low sensitivity (55.88%), the positive- and negative-predictive value were 70.37 and 88.81%, respectively, and the AUC for tuning fork is 0.75.
Relationship Between VPTs and Demographic Characteristics
Results from the multiple linear regression analysis in the present study suggest that the types of injury (complete SCI vs. other types) and age may significantly influence the VPTs, regardless of the height, gender, groups and locations of injury.
We show that the types of injury (complete SCI vs. other types) were the factor highly correlated with the VPTs. The possible reason for this result may be that most of the complete SCI patients had no sensation and therefore would artificially increase the correlations as the tests showed absent responses. Although Felix and Widerström-Noga's study showed the severity of injury (complete vs. incomplete) was not significantly related to Neuropathic Pain Symptom Inventory total intensity score (25), the participants of their study were SCI-related neuropathic pain and the relationship they investigated was between somatosensory thresholds and severity of neuropathic pain symptoms.
The current report indicates that vibratory thresholds changed linearly with age, which is not unexpected. Association between age and VPT has been previously shown in general populations (31, 49), and in diabetic patients (10, 12, 50). Many factors may contribute to decline of vibration sensitivity, such as age-related reduction in the receptor density, morphological modifications of the remaining receptors, and possible degeneration of corresponding peripheral nerves fibers (12).
Since height is highly correlated with latencies of cortical SSEPs (51–53), we include height in our methodology. Previous studies had reported that VPT, especially measured at the lower extremity, positively correlated with height (31, 54–60). However, we found no significant correlation between height and VPT in our patients with CNS injury. A possible cause for such interesting issue is that subject heights in our group were normally distributed with a standard deviation of only 6.49 cm; therefore, very few participants lay far from the mean to give strength to an analysis of height in this context (61). Although the lack of correlation should not be over interpreted in this relatively small sample, our findings are consistent with some studies in healthy subjects and in other patient populations that showed similar results (61–65).
All the results from this analysis should be viewed with a modest degree of caution, as the data available for this analysis were relatively small (n = 60). Although most other variables included in the regression analysis (height, gender, groups, and locations of injury) displayed non-significant relationships with the dependent variable, the lack of a mediating effect of these variables is inconclusive as a result of the low power.
Limitations and Future Research
The present study must be interpreted in the context of its potential limitations. We use latencies of SSEP, rather than amplitudes, as the reference criteria based on a consideration that “latencies seem to be more reliable in reflecting real damage, whereas amplitudes vary inter-individually and depend more on the quality of the peripheral nerve stimulation” (37). However, some studies have been made to analyze both latencies and amplitudes for different research purposes (66, 67). The multiple linear regression analysis in the present study showed that the types of injury (complete SCI vs. other types) and age were the factor highly correlated with the VPTs, especially complete vs. incomplete spinal lesions. Studies in the past addressed this situation by either excluding complete SCI patients from the study or at least stratifying the population, with and without complete SCI correlations (6, 68). Therefore, the findings in this study need to be replicated in a larger study to further detail the reliability and validity of VSA-3000 test in people with stroke and SCI, and the amplitudes of SSEP will be incorporated in the evaluations and the SCI population will be stratified, with and without complete SCI correlations, in the future works.
Conclusion
Based on the results of the present study, VSA-3000 appears to provide a reliable and accurate assessment of impaired vibration sensation caused by central nerve injury. Use of VSA-3000 as a diagnostic and/or outcome measurement strategy may provide new motivations for its applications in the clinic and large-scale clinical trial researches.
Clinical Messages
1. VSA-3000 has good diagnostic accuracy for assessing impaired vibration sensation caused by central nerve injury.
2. VSA-3000 is a non-invasive and convenient QST instrument that may provide a new method to quantitatively test vibration sense in clinic.
Data Availability Statement
All datasets generated for this study are included in the article/Supplementary Material.
Ethics Statement
The studies involving human participants were reviewed and approved by Ethical Committee of the China Rehabilitation Research Center. The patients/participants provided their written informed consent to participate in this study.
Author Contributions
All authors listed have made a substantial, direct and intellectual contribution to the work, and approved it for publication.
Funding
This research received funding from China Rehabilitation Research Center (No. 2014-Q5).
Conflict of Interest
The authors declare that the research was conducted in the absence of any commercial or financial relationships that could be construed as a potential conflict of interest.
Acknowledgments
We thank sincerely the reviewers for their insightful comments and helpful suggestions which have greatly improved the paper. We acknowledge all patients, physicians, and participants for their contributions in this study.
Supplementary Material
The Supplementary Material for this article can be found online at: https://www.frontiersin.org/articles/10.3389/fneur.2020.00936/full#supplementary-material
References
1. Connell LA, Lincoln NB, Radford KA. Somatosensory impairment after stroke: frequency of different deficits and their recovery. Clin Rehabil. (2008) 22:758–67. doi: 10.1177/0269215508090674
2. Estores IM. The consumer's perspective and the professional literature: what do persons with spinal cord injury want? J Rehabil Res Dev. (2003) 40(4 Suppl. 1):93–8. doi: 10.1682/JRRD.2003.08.0093
3. Calne DB, Pallis CA. Vibratory sense: a critical review. Brain. (1966) 89:723–746. doi: 10.1093/brain/89.4.723
4. O'Neill J, McCann SM, Lagan KM. Tuning fork (128 Hz) versus neurothesiometer: a comparison of methods of assessing vibration sensation in patients with diabetes mellitus. Int J Clin Pract. (2006) 60:174–8. doi: 10.1111/j.1742-1241.2005.00650.x
5. Nuwer MR. Fundamentals of evoked potentials and common clinical applications today. Electroencephalogr Clin Neurophysiol. (1998) 106:142–8. doi: 10.1016/S0013-4694(97)00117-X
6. Hayes KC, Wolfe DL, Hsieh JT, Potter PJ, Krassioukov A, Durham CE. Clinical and electrophysiologic correlates of quantitative sensory testing in patients with incomplete spinal cord injury. Arch Phys Med Rehabil. (2002) 83:1612–9. doi: 10.1053/apmr.2002.35101
7. Bril V, Kojic J, Ngo M, Clark K. Comparison of a neurothesiometer and vibration in measuring vibration perception thresholds and relationship to nerve conduction studies. Diabetes Care. (1997) 20:1360–2. doi: 10.2337/diacare.20.9.1360
8. Bril V, Perkins BA. Comparison of vibration perception thresholds obtained with the Neurothesiometer and the CASE IV and relationship to nerve conduction studies. Diabet Med. (2002) 19:661–6. doi: 10.1046/j.1464-5491.2002.00759.x
9. Ponirakis G, Odriozola MN, Odriozola S, Petropoulos IN, Azmi S, Fadavi H, et al. NerveCheck: an inexpensive quantitative sensory testing device for patients with diabetic neuropathy. Diabetes Res Clin Pract. (2016) 113:101–7. doi: 10.1016/j.diabres.2015.12.023
10. Martin CL, Waberski BH, Pop-Busui R, Cleary PA, Catton S, Albers JW, et al. Vibration perception threshold as a measure of distal symmetrical peripheral neuropathy in type 1 diabetes: results from the DCCT/EDIC study. Diabetes Care. (2010) 33:2635–41. doi: 10.2337/dc10-0616
11. Brown JJ, Pribesh SL, Baskette KG, Vinik AI, Colberg SR. A comparison of screening tools for the early detection of peripheral neuropathy in adults with and without type 2 diabetes. J Diabetes Res Volume. (2017) 2017:1467213. doi: 10.1155/2017/1467213
12. Santos TRM, Melo JV, Leite NC, Salles GF, Cardoso CRL. Usefulness of the vibration perception thresholds measurement as a diagnostic method for diabetic peripheral neuropathy: Results from the Rio de Janeiro type 2 diabetes cohort study. J Diabetes Complications. (2018) 32:770–6. doi: 10.1016/j.jdiacomp.2018.05.010
13. Lee K. Effects of whole-body vibration therapy on perception thresholds of type 2 diabetic patients with peripheral neuropathy: a randomized controlled trial. J Phys Ther Sci. (2017) 29:1684–8. doi: 10.1589/jpts.29.1684
14. Pritchard N, Edwards K, Russell AW, Perkins BA, Malik RA, Efron N. Corneal confocal microscopy predicts 4-year incident peripheral neuropathy in type 1 diabetes. Diabetes Care. (2015) 38:671–5. doi: 10.2337/dc14-2114
15. Mayfield JA, Sugarman JR. The use of the Semmes-Weinstein monofilament and other threshold tests for preventing foot ulceration and amputation in persons with diabetes. J Fam Pract. (2000) 49(11 Suppl):S17–29.
16. Goel A, Shivaprasad C, Kolly A, Sarathi HAV, Atluri S. Comparison of electrochemical skin conductance and vibration perception threshold measurement in the detection of early diabetic neuropathy. PLoS ONE. (2017) 12:e0183973. doi: 10.1371/journal.pone.0183973
17. Shakoor N, Agrawal A, Block JA. Reduced lower extremity vibratory perception in osteoarthritis of the knee. Arthritis Rheum. (2008) 59:117–21. doi: 10.1002/art.23241
18. Zaslansky R, Yarnitsky D. Clinical applications of quantitative sensory testing (QST). J Neurol Sci. (1998) 153:215–38. doi: 10.1016/S0022-510X(97)00293-1
19. Pritchard N, Edwards K, Vagenas D, Russell AW, Malik RA, Efron N. Corneal sensitivity is related to established measures of diabetic peripheral neuropathy. Clin Exp Optom. (2012) 95:355–61. doi: 10.1111/j.1444-0938.2012.00729.x
20. Selvarajah D, Kar D, Khunti K, Davies MJ, Scott AR, Walker J, et al. Diabetic peripheral neuropathy: advances in diagnosis and strategies for screening and early intervention. Lancet Diabetes Endocrinol. (2019) 7:938–48. doi: 10.1016/S2213-8587(19)30081-6
21. Lange-Maia BS, Newman AB, Cauley JA, Boudreau RM, Jakicic JM, Caserotti P, et al. Sensorimotor peripheral nerve function and the longitudinal relationship with endurance walking in the health, aging and body composition study. Arch Phys Med Rehabil. (2016) 97:45–52. doi: 10.1016/j.apmr.2015.08.423
22. Aulich J, Cho YH, Januszewski AS, Craig ME, Selvadurai H, Wiegand S, et al. Associations between circulating inflammatory markers, diabetes type and complications in youth. Pediatr Diabetes. (2019) 20:1118–27. doi: 10.1111/pedi.12913
23. Palaniswamy V, Ng SK, Manickaraj N, Ryan M, Yelland M, Rabago D, et al. Relationship between ultrasound detected tendon abnormalities, and sensory and clinical characteristics in people with chronic lateral epicondylalgia. PLoS ONE. (2018) 13:e0205171. doi: 10.1371/journal.pone.0205171
24. Krassioukov A, Wolfe DL, Hsieh JT, Hayes KC, Durham CE. Quantitative sensory testing in patients with incomplete spinal cord injury. Arch Phys Med Rehabil. (1999) 80:1258–63. doi: 10.1016/S0003-9993(99)90026-6
25. Felix ER, Widerström-Noga EG. Reliability and validity of quantitative sensory testing in persons with spinal cord injury and neuropathic pain. J Rehabil Res Dev. (2009) 46:69–83. doi: 10.1682/JRRD.2008.04.0058
26. Lefaucheur JP, Drouot X, Ménard-Lefaucheur I, Keravel Y, Nguyen JP. Motor cortex rTMS in chronic neuropathic pain: pain relief is associated with thermal sensory perception improvement. J Neurol Neurosurg Psychiatry. (2008) 79:1044–9. doi: 10.1136/jnnp.2007.135327
27. Lee YS, Jung DI, Kim KY. Quantitative sensory testing on edema of upper extremity for Stroke Patients. J Korea Contents Assoc. (2013) 13:851–9. doi: 10.5392/JKCA.2013.13.12.851
28. Seo TH, Yoon YJ, Lee DW. The effect of somatosensory and task-oriented training on sensory recovery of upper limbs in chronic stroke. J Korea Entertainment Industry Assoc. (2018) 12:371–9. doi: 10.21184/jkeia.2018.10.12.7.371
29. World Health Organization. Cerebrovascular Disorders: A Clinical and Research Classification. Offset Publication No. 43. Geneva: World Health Organization (1978).
30. Kirshblum SC, Burns SP, Biering-Sorensen F, Donovan W, Graves DE, Jha A, et al. International standards for neurological classification of spinal cord injury (revised 2011). J Spinal Cord Med. (2011) 34:535–46. doi: 10.1179/204577211X13207446293695
31. Lin YH, Hsieh SC, Chao CC, Chang YC, Hsieh ST. Influence of aging on thermal and vibratory thresholds of quantitative sensory testing. J Peripher Nerv Syst. (2005) 10:269–81. doi: 10.1111/j.1085-9489.2005.10305.x
32. Miscio G, Guastamacchia G, Brunani A, Priano L, Baudo S, Mauro A. Obesity and peripheral neuropathy risk: a dangerous liaison. J Peripher Nerv Syst. (2005) 10:354–8. doi: 10.1111/j.1085-9489.2005.00047.x
33. The Health Aging and Body Composition (Health ABC) operation manual Vol. VI Chapter 2O “peripheral neuropathy: Vibration Perception Threshold”. Available online at: https://healthabc.nia.nih.gov/sites/default/files/PNvpt.om4_0.pdf
34. Temlett JA. An assessment of vibration threshold using a biothesiometer compared to a C128-Hz tuning fork. J Clin Neurosci. (2009) 16:1435–8. doi: 10.1016/j.jocn.2009.03.010
35. Zhang JW, Wang Q, Wang XF, Gao MM, Yun XP, Wu HF, et al. Sensory thresholds at different sites of the foot: a valuable reference for neurologic examinations. Spinal Cord. (2017) 55:396–8. doi: 10.1038/sc.2016.167
36. Curt A, Dietz V. Traumatic cervical spinal cord injury: relation between somatosensory evoked potentials, neurological deficit, and hand function. Arch Phys Med Rehabil. (1996) 77:48–53. doi: 10.1016/S0003-9993(96)90219-1
37. Spiess M, Schubert M, Kliesch U, EM-SCI Study group; Halder P. Evolution of tibial SSEP after traumatic spinal cord injury: baseline for clinical trials. Clin Neurophysiol. (2008) 119:1051–61. doi: 10.1016/j.clinph.2008.01.021
38. Strahm C, Min K, Boos N, Ruetsch Y, Curt A. Reliability of perioperative SSEP recordings in spine surgery. Spinal Cord. (2003) 41:483–9. doi: 10.1038/sj.sc.3101493
39. Klem GH, Lüders HO, Jasper HH, Elger C. The ten-twenty electrode system of the International Federation. The International Federation of Clinical Neurophysiology. Electroencephalogr Clin Neurophysiol Suppl. (1999) 52:3–6.
40. Shrout PE, Fleiss JL. Intraclass correlations: uses in assessing rater reliability. Psychol Bull. (1979) 86:420–8. doi: 10.1037/0033-2909.86.2.420
41. Shrout PE. Measurement reliability and agreement in psychiatry. Stat Methods Med Res. (1998) 7:301–17. doi: 10.1177/096228029800700306
42. Löfstedt RM, Vanleeuwen JA. Evaluation of a commercially available luteinizing hormone test for its ability to distinguish between ovariectomized and sexually intact bitches. J Am Vet Med Assoc. (2002) 220:1331–5. doi: 10.2460/javma.2002.220.1331
43. Carter JV, Pan J, Rai SN, Galandiuk S. ROC-ing along: evaluation and interpretation of receiver operating characteristic curves. Surgery. (2016) 159:1638–45. doi: 10.1016/j.surg.2015.12.029
44. DeLong ER, DeLong DM, Clarke-Pearson DL. Comparing the areas under two or more correlated receiver operating characteristic curves: a nonparametric approach. Biometrics. (1988) 44:837–45. doi: 10.2307/2531595
45. Strotmeyer ES, de Rekeneire N, Schwartz AV, Faulkner KA, Resnick HE, Goodpaster BH, et al. The relationship of reduced peripheral nerve function and diabetes with physical performance in older white and black adults: the Health, Aging, and Body Composition (Health ABC) study. Diabetes Care. (2008) 31:1767–72. doi: 10.2337/dc08-0433
46. Bird SJ, Brown MJ, Spino C, Watling S, Foyt HL. Value of repeated measures of nerve conduction and quantitative sensory testing in a diabetic neuropathy trial. Muscle Nerve. (2006) 34:214–24. doi: 10.1002/mus.20577
47. Wong ML, Tibbett J, Adedolapo T, Widerstrom-Noga E. The Graph-DCK Scale: a measure of dorsal column function after spinal cord injury. Spinal Cord. (2019) 57:412–8. doi: 10.1038/s41393-018-0236-2
48. Arshad AR, Alvi KY. Diagnostic accuracy of clinical methods for detection of diabetic sensory neuropathy. J Coll Physicians Surg Pak. (2016) 26:374–9.
49. Deshpande N, Metter EJ, Ling S, Conwit R, Ferrucci L. Physiological correlates of age-related decline in vibrotactile sensitivity. Neurobiol Aging. (2008) 29:765–73. doi: 10.1016/j.neurobiolaging.2006.12.002
50. Tjon-A-Tsien AM, van Dijk JG, van der Velde EA, Kamzoul BA, Lemkes HH. Determinants of vibration perception thresholds in IDDM and NIDDM patients. Diabetes Res Clin Pract. (1995) 27:211–9. doi: 10.1016/0168-8227(95)01049-J
51. Chu NS. Somatosensory evoked potentials: correlations with height. Electroencephalogr Clin Neurophysiol. (1986) 65:169–76. doi: 10.1016/0168-5597(86)90051-1
52. Chabot R, York DH, Watts C, Waugh WA. Somatosensory evoked potentials evaluated in normal subjects and spinal cord-injured patients. J Neurosurg. (1985) 63:544–51. doi: 10.3171/jns.1985.63.4.0544
53. Poornima S, Ali SS, Balaji PA, Shankar V, Kutty K. Median nerve somatosensory evoked potentials in medical students: normative data. Adv Biomed Res. (2013) 2:56. doi: 10.4103/2277-9175.115797
54. Hwu CM, Chang HY, Chen JY, Wang SL, Ho LT, Pan WH. Quantitative vibration perception thresholds in normal and diabetic chinese: influence of age, height and body mass index. Neuroepidemiology. (2002) 21:271–8. doi: 10.1159/000065526
55. Hodge AM, Dowse GK, Zimmet PZ, Gareeboo H, Westerman RA, Tuomilehto J, et al. Factors associated with impaired vibration perception in Mauritians with normal and abnormal glucose tolerance. Mauritius NCD Study Group. J Diabetes Complications. (1995) 9:149–57. doi: 10.1016/1056-8727(94)00037-O
56. Skov T, Steenland K, Deddens J. Effect of age and height on vibrotactile threshold among 1,663 U. S. workers. Am J Ind Med. (1998) 34:438–44. doi: 10.1002/(SICI)1097-0274(199811)34:5<438::AID-AJIM4>3.0.CO;2-M
57. Bartlett G, Stewart JD, Tamblyn R, Abrahamowicz M. Normal distributions of thermal and vibration sensory thresholds. Muscle Nerve. (1998) 21:367–74. doi: 10.1002/(SICI)1097-4598(199803)21:3<367::AID-MUS11>3.0.CO;2-X
58. Wiles PG, Pearce SM, Rice PJ, Mitchell JM. Vibration perception threshold: influence of age, height, sex, and smoking, and calculation of accurate centile values. Diabet Med. (1991) 8:157–61. doi: 10.1111/j.1464-5491.1991.tb01563.x
59. Gerr F, Hershman D, Letz R. Vibrotactile threshold measurement for detecting neurotoxicity: reliability and determination of age- and height-standardized normative values. Arch Environ Health. (1990) 45:148–54. doi: 10.1080/00039896.1990.9936708
60. Sorensen L, Molyneaux L, Yue DK. Insensate versus painful diabetic neuropathy: the effects of height, gender, ethnicity and glycaemic control. Diabetes Res Clin Pract. (2002) 57:45–51. doi: 10.1016/S0168-8227(02)00010-4
61. Karpul D, McIntyre S, van Schaik A, Breen PP, Heckmann JM. Vibrotactile sensitivity of patients with HIV-related sensory neuropathy: an exploratory study. Brain Behav. (2019) 9:e01184. doi: 10.1002/brb3.1184
62. Weintrob N, Amitay I, Lilos P, Shalitin S, Lazar L, Josefsberg Z. Bedside neuropathy disability score compared to quantitative sensory testing for measurement of diabetic neuropathy in children, adolescents, and young adults with type 1 diabetes. J Diabetes Complications. (2007) 21:13–9. doi: 10.1016/j.jdiacomp.2005.11.002
63. Duke J, McEvoy M, Sibbritt D, Guest M, Smith W, Attia J. Vibrotactile threshold measurement for detecting peripheral neuropathy: defining variability and a normal range for clinical and research use. Diabetologia. (2007) 50:2305–12. doi: 10.1007/s00125-007-0813-y
64. Hilz MJ, Axelrod FB, Hermann K, Haertl U, Duetsch M, Neundörfer B. Normative values of vibratory perception in 530 children, juveniles and adults aged 3-79 years. J Neurol Sci. (1998) 159:219–25. doi: 10.1016/S0022-510X(98)00177-4
65. Chuang HY, Schwartz J, Tsai SY, Lee ML, Wang JD, Hu H. Vibration perception thresholds in workers with long term exposure to lead. Occup Environ Med. (2000) 57:588–94. doi: 10.1136/oem.57.9.588
66. Tzvetanov P, Rousseff RT, Milanov I. Lower limb SSEP changes in stroke-predictive values regarding functional recovery. Clin Neurol Neurosurg. (2003) 105:121–7. doi: 10.1016/S0303-8467(02)00132-4
67. Hanson C, Lolis AM, Beric A. SEP montage variability comparison during intraoperative neurophysiologic monitoring. Front Neurol. (2016) 7:105. doi: 10.3389/fneur.2016.00105
Keywords: VSA-3000, vibration perception thresholds, quantitative sensory testing, central nervous system, stroke, spinal cord injury
Citation: Gao M, Yun X and Zhang T (2020) VSA-3000: A Quantitative Vibration Sensation Testing Device for Patients With Central Nervous System Injury. Front. Neurol. 11:936. doi: 10.3389/fneur.2020.00936
Received: 30 January 2020; Accepted: 20 July 2020;
Published: 08 September 2020.
Edited by:
Marcello Moccia, University of Naples Federico II, ItalyReviewed by:
Rayaz A. Malik, Weill Cornell Medicine- Qatar, QatarTalal Salame, Lebanese University, Lebanon
Copyright © 2020 Gao, Yun and Zhang. This is an open-access article distributed under the terms of the Creative Commons Attribution License (CC BY). The use, distribution or reproduction in other forums is permitted, provided the original author(s) and the copyright owner(s) are credited and that the original publication in this journal is cited, in accordance with accepted academic practice. No use, distribution or reproduction is permitted which does not comply with these terms.
*Correspondence: Tong Zhang, VG9tNjExQDEyNi5jb20=