 Ted L. Rothstein
- Department of Neurology, Multiple Sclerosis Clinical Care and Research Center, George Washington University School of Medicine, Washington, DC, United States
Background: Multiple Sclerosis (MS) lesions in white matter (WM) are easily detected with conventional MRI which induce inflammation thereby generating contrast. WM lesions do not consistently explain the extent of clinical disability, cognitive impairment, or the source of an exacerbation. Gray matter (GM) structures including the cerebral cortex and various deep nuclei are known to be affected early in Primary Progressive Multiple Sclerosis (PPMS) and drive disease progression, disability, fatigue, and cognitive dysfunction. However, little is known about how rapidly GM lesions develop and accumulate over time.
Objective: The purpose of this study is to analyze the degree and rate of progression in 25 patients with PPMS using voxel-based automated volumetric quantitation.
Methods: This is a retrospective single-center study which includes a cohort of 25 patients with PPMS scanned utilizing NeuroQuant® 3 dimensional voxel-based morphometry (3D VBM) automated analysis and database and restudied after a period of ~1 year (11–14 months). Comparisons with normative data were acquired for whole brain, forebrain parenchyma, cortical GM, hippocampus, thalamus, superior and inferior lateral ventricles. GM volume changes were correlated with their clinical motor and cognitive scores using Extended Disability Status Scales (EDSS) and Montreal Cognitive Assessments (MoCA).
Results: Steep reductions occurred in cerebral cortical GM and deep GM nuclei volumes which correlated with each patient's clinical and cognitive impairment. The median observed percentile volume losses were statistically significant compared with the 50th percentile for each GM component. Longitudinal assessments of an unselected sample of one dozen patients involved in the PPMS study showed prominent losses occurring mainly in cortical GM and hippocampus which were reflected in their EDSS and MoCA. The longitudinal results were compared with a similar sample of patients having Relapsing MS (RMS) whose GM values were largely in normal range, annualized volume GM changes were much less, while WM hyperintensities were in abnormal range in half the unselected cases.
Conclusions: Knowledge of the degree and rapidity with which cortical atrophy and deep GM volume loss develops clarifies the source of progressive cognitive and clinical decline in PPMS.
Introduction
WM abnormalities obtained on routine Brain and Spinal Cord MRI often fail to explain the source of an MS exacerbation, or the degree of cognitive and physical impairment that MS patients experience, a circumstance described as the “clinico-radiological paradox” (1, 2) Histopathologic analysis has demonstrated a substantial burden of pathology in the cerebral cortex (3–5) and deep GM structures (6) and is independent of WM demyelination (2, 6–9). Evidence has accumulated that GM and WM pathology appear to be separate, independent, and distinct (6–12). Lesions in the cerebral cortex have been visualized before WM lesions develop, and regional comparisons found cortical demyelination to be much more extensive than in WM (6, 7, 9) GM lesions, in contrast with WM, lack parenchymal lymphocyte infiltration or blood brain barrier disruption, and accumulate greater deposition of complement proteins and antibodies (13).
There is a revised understanding of the role and importance of GM changes and brain atrophy in MS largely as the result of the development of quantitative imaging techniques which provide measurements more precisely than can be done by just viewing the images. The aim of this study was to utilize NeuroQuant® 3D VBM MRI to analyze and clarify the degree and longitudinal evolution of volumetric reductions that were contributing to cognitive and clinical dysfunction in each of 25 PPMS patients. Until recently, GM lesions have been difficult to detect using conventional MRI techniques such as T2-weighted spin-echo or FLAIR images, due to the low contrast they produce as they have little T-cell related inflammation (3, 4, 14–17) or disruption of the blood brain barrier (18). Further, focal cortical lesions fail to be visualized using these conventional MR images because they tend to be small, and are difficult to distinguish from surrounding normal appearing GM (19). They also tend to have partial volume effects with WM and CSF (20). Visible cortical lesions therefore represent only “the tip of the pathologic iceberg” (21). For example, only 5% of histopathological cortical lesions were identified with standard FLAIR and T2 MRI sequences (3).
PPMS is defined among those MS patients who have insidious and inexorable progressive worsening in their clinical or cognitive function for a minimum of 12 months without recovery or remission (22, 23). The progressive worsening of disability in PPMS results from the combination of neurodegeneration and various complex immune mechanisms (23). When compared with RMS, PPMS is associated with whole brain atrophy, cortical and subpial demyelination, oxidative stress, excitotoxicity, diffuse axonal injury and microglial activation with failure to repair damaged parenchyma (24–27). Other distinguishing pathologic features which contribute to a less favorable prognosis involve exhaustion of functional compensation, lack of trophic support, and altered expression of ion channels in demyelinated axons (26). PPMS represents about 15% of the total MS patient population and, in contrast to RMS, tends to develop ~10 years later (28). Males and females are equally affected in PPMS while 70% of RMS are women (28). Histopathologic studies in PPMS have demonstrated widespread involvement of GM structures including the cerebral cortex, hippocampus, thalamus, basal ganglia, cerebellum, and spinal cord (15, 25–29).
Methods
Study Population
This is a retrospective longitudinal study involving a cohort of 25 PPMS patients acquired from George Washington University's Multiple Sclerosis Clinical Care database obtained between 2011 and 2020 and analyzed with 3D VBM NeuroQuant® software (NeuroQuant® v2.3, CorTechs Laboratories, San Diego, California). The patient's results were compared with a NeuroQuant® database and studied on the same MRI platform to avoid variability in findings. All the patients were restudied at ~1 year (11–14 months). They all received EDSS assessment (30) and MoCA scores (31) within 14 days of MRI acquisition. EDSS examination was performed by a single, specially trained and certified examining Neurologist. The series included 16 women, mean age of onset 30.16 ± 9.0 (13–43) years; mean disease duration 16.11 ± 11.9 (2–50) years; EDSS range between 3.0 and 6.5 at screening: mean 5.87 ± 2.59; Some patients had received other disease modifying treatments during the study period, and all patients who were participating after March, 2017 were eventually treated with ocrelizumab (32). MoCA was obtained on each subject with mean 21.32 ± 11.91 (11–28). Patients were not included who were receiving steroids or psychoactive therapy. Since all patients in the study received MR imaging as outpatients, their degree of hydration could not be standardized, and may have contributed to some of the variability in GM quantification. Similarly, as a retrospective analysis, comorbidity and daily fluctuations in brain volumes could not be factored into the results. PPMS patients were excluded who were under age 18, had EDSS <3.0, or those with other known neurological or psychiatric disorders. Screening criteria beginning at minimum of 3.0 EDSS were used based on standards established in the ocrelizumab treatment trial (32).
MRI Acquisition
Recognizing the importance of GM pathology in PPMS, reliable methods for assessing the degree of GM pathology has become essential. 3D VBM is an advanced MRI technique which accurately quantifies brain volumes of GM structures reflecting the neurodegenerative aspects of MS, and identifies underlying structural changes not apparent with conventional MRI (14–17, 20, 33–39). These techniques have proved to be a highly reproducible means to measure brain volumes of various GM structures. There are a variety of post processing techniques using voxels available to accomplish this purpose including NeuroQuant®, which has been shown to be at statistical agreement in assessing brain volumes when compared with other validated methods such as Structural Imaging Evaluation of Normalized Atrophy (SIENAX) (40) and FreeSurfer (41). NeuroQuant® is an automated software package that provides objective quantitative analysis of regional GM volumes compared to cohort matched normative data. 3D volumetric MR imaging studies utilizes an 8 channel phased array head coil. Image acquisition includes a 3 plane localizer sequence and 3D volumetric T1 weighted gradient echo sequence. The protocol includes a 3D T1 weighted fast spoiled gradient echo sequence for volumetric measurements. Each sagittal 3D T1 volumetric image was acquired according to listed protocol https://www/cortechslabs.com/resources/technical-information/recommended-scanner-settings/ for volumetric post-processing by NeuroQuant®. Proprietary automated segmentation methods used by NeuroQuant® are evolved from widely used semi-automated methods relying on probabilistic atlas based methods to provide volumetric analysis of each segmental structure (37, 39, 40). The segmentation procedure assigns a neuroanatomic label to each voxel on the basis of probabilistic information automatically estimated from several atlases. The labeling of each point in space is achieved by finding segmentation for each voxel that maximizes the probability of input given the previous probabilities from the atlases. The software deletes non-brain tissue using active contour models and separates a number of anatomic structures using the same probabilistic atlas. The automated program compares individual volumes to a normative database taken as a percentage of total intracranial volume which is adjusted for age, and gender (37, 39, 40) allowing objective comparisons of patients with varying morphology to determine statistically significant deviations from normal for each individual. NeuroQuant® MRI automated technique quantifies whole brain, forebrain parenchyma, cortical and deep GM nuclei volumes including measures of hippocampus, thalamus, superior and inferior lateral ventricles for which age based Normative Data was available. Cerebellar volumes are available but normative data is not provided and is only included in longitudinal analysis. Quantification of WM lesion volume and Normative Data are obtained directly from the NeuroQuant® dataset and identified as WM hypointensities.
An example of NeuroQuant® numeric data acquisition and morphometry results which track GM volumes and ventricular size with progression over time is shown in Table 1 and Figure 1. Representative axial, coronal, and sagittal MRI images of case 1 from 2015 are shown in Figure 2.
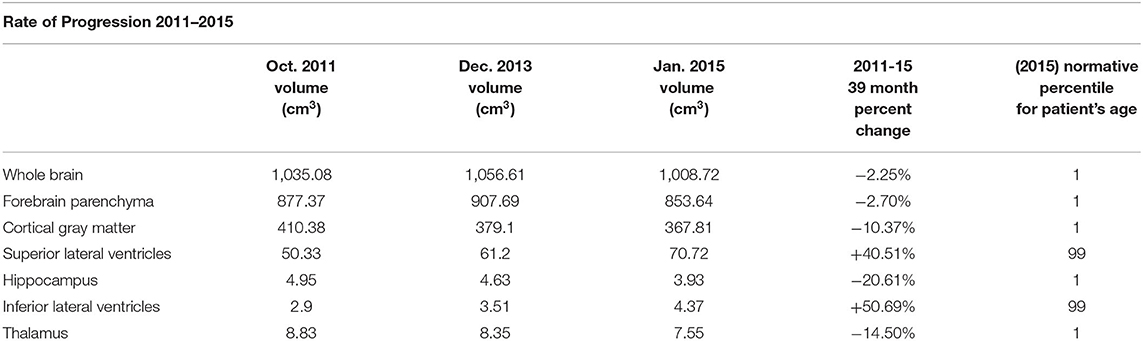
Table 1. NeuroQuant® Volumetric and Normative Data from a patient acquired between October, 2011 and January, 2015 showing degree and progression of volume loss in GM brain structures and increase in ventricular size over time.
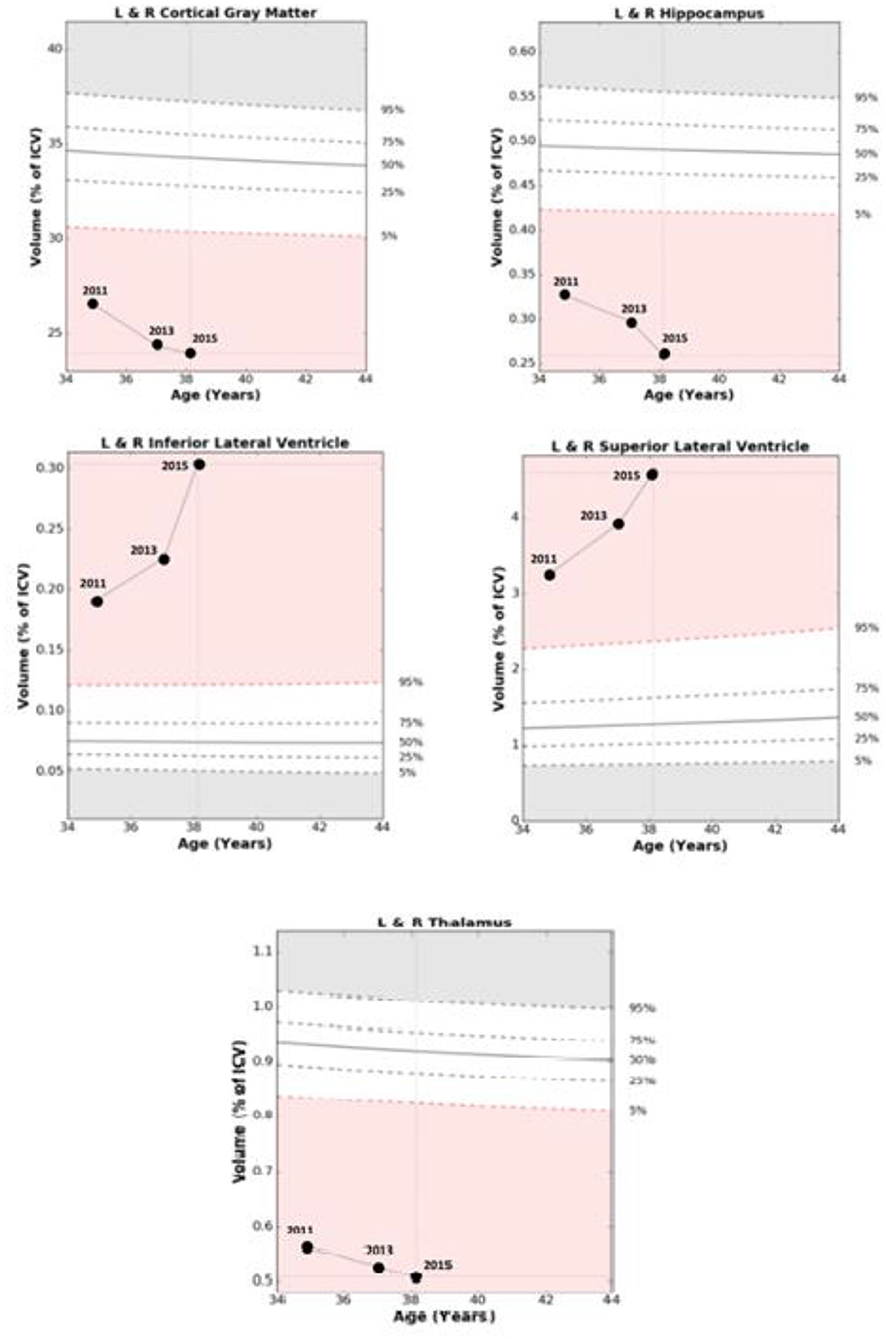
Figure 1. Comparisons of age related Normative Data based on percentage of intracranial volume with relative changes over 39 months in Case 1. Abnormal range is defined as out of the white zone at the 5th percentile or less, or 95th percentile or more based at a given age.
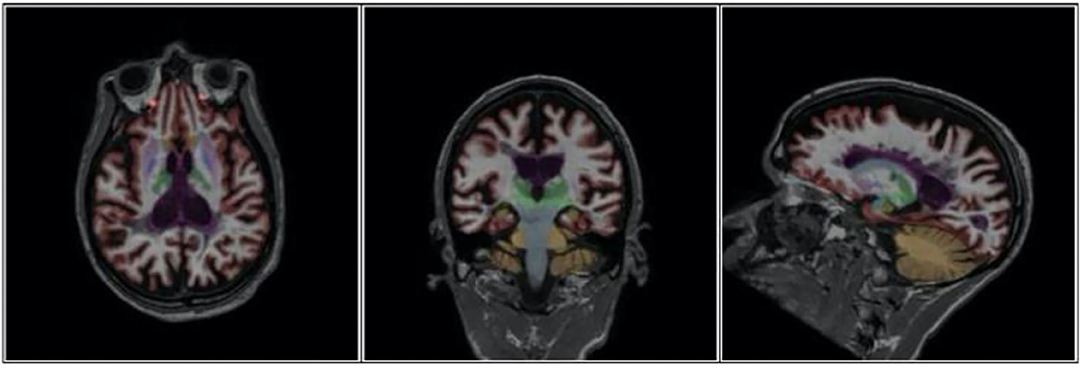
Figure 2. Axial, Coronal and Sagittal images of Case 1 demonstrating extent of brain atrophy as documented in 2015.
Statistical Analysis (Table 2)
Non-parametric 1-sample sign test was used to examine the difference between the median of the observed percentile scores and the expected score at the 50th percentile. The findings were that the median observed percentiles differed in a statistically significant value from the 50th percentile for each GM structure, as well as the size of the ventricles, where normative data was available
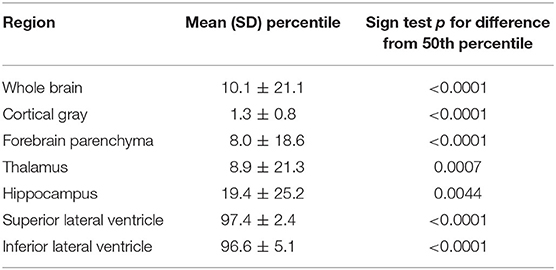
Table 2. Sign test NORMATIVE results by brain region.
Results (Table 3)
Cross Sectional Analysis
The most notable results in this study were the abnormal GM Normative Data present in all 25 PPMS patients. Among these study patients, those that were found to have GM structure volumes out of the normal range at or less than the 5th percentile for their age were: whole brain 14; cortical GM 23; forebrain parenchyma 17; and thalamus 21. There were 10 patients with hippocampal volumes at or less than the 5th percentile, but another 5 were minimally above the abnormal range at 6, 9, and three at 11th percentile. Cerebellar results are not reported as Normative Data is not available in the NeuroQuant® database but longitudinal change in values is presented in 12 randomly selected patients in Supplement A. The superior and inferior lateral ventricles were both found to be out of the normal range at or greater than the 95th percentile in 20 patients. There was a rough correlation between EDSS scores and the volume of white matter hyperintensities with 18 patients with values at or exceeding the 95th percentile.
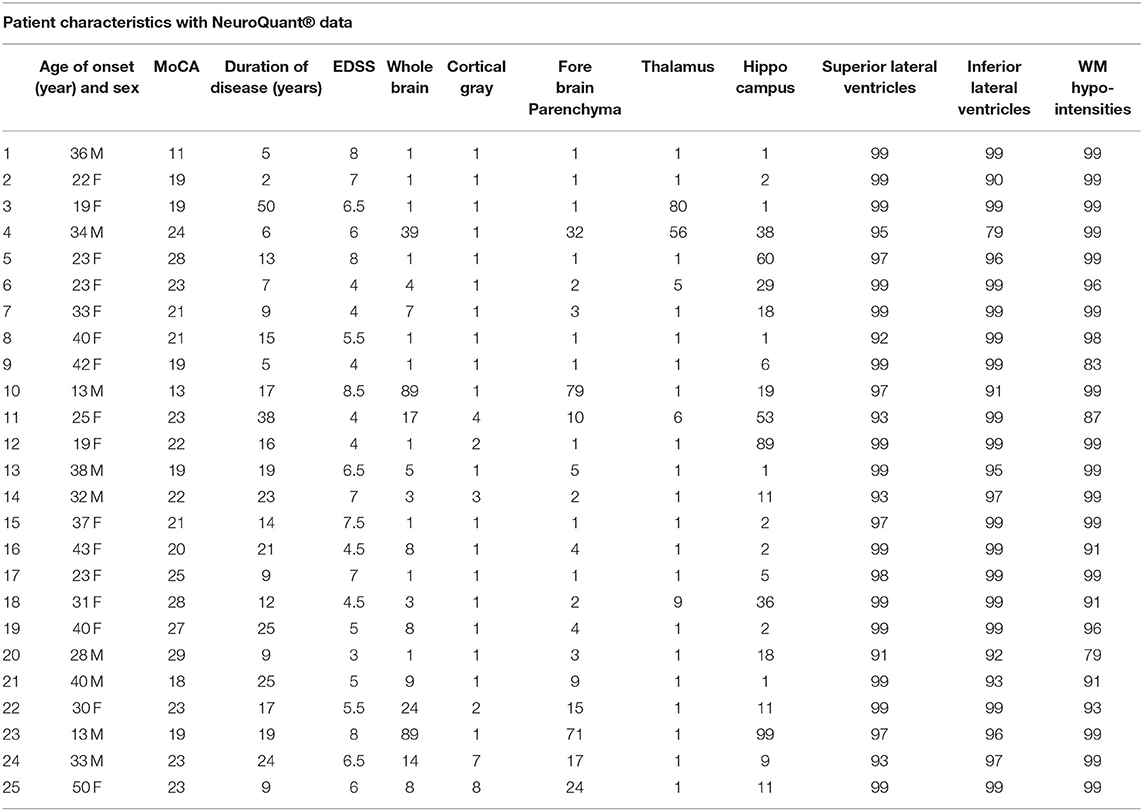
Table 3. Summary of 25 PPMS patient's clinical characteristics and Normative Range results using their most recent NeuroQuant® database.
Longitudinal Analysis (Supplements A,B)
Over 1 year of longitudinal data collection, patients with PPMS showed a % decrease in volume in a number of GM structures, but losses were most prominent in cortical GM (−7.7 SD 10.2) and hippocampus (−6.6 SD 8.2).
Supplement A provides details of a longitudinal analysis for a random group of 12 PPMS study patients, and in Supplement B, a similar number of unselected RMS cases collected over a number of years for comparison. The results provide a striking contrast as RMS patients have GM values mostly in normal range when compared to PPMS and relatively small annualized volume changes. The major variant from normal among these RMS patients is that half were found to have white matter hypointensities at or in excess of the 95th percentile which generally tended to correlate with their EDSS.
Discussion
WM pathology has been the major focus of MS clinical assessment and research because of the ease of detection on standard MRI despite aspects such as physical disability, cognitive impairment, fatigue and seizures which link to GM dysfunction (42). Conventional neuroimaging techniques may not provide adequate explanations for the existing symptomatology, or the clinical evolution of the disease (1–3). Amiri et al. emphasized that a keener understanding of the neuropathological correlates resulting from whole brain and deep GM atrophy is urgently required (38). They concluded that advanced 3D VBM neuroimaging techniques have allowed for the assessment of GM pathology in vivo which correlates closely with clinical disability and cognitive impairment and overcomes many of the limitations of conventional neuroimaging (38).
Neocortical neuronal loss has been shown to be “massive” in post mortem examination of the brains of PPMS patients and strongly correlates with reductions of cortical volume (9, 13). Histopathologic study identified neuro-axonal loss and neuronal shrinkage as the source for regional cortical atrophy (9). Cortical atrophy appeared to be unrelated to the degree of myelin loss although such loss can be extensive in PPMS (3, 9).
GM atrophy, involving both cortical and deep GM structures, progresses more rapidly than WM atrophy, and is mainly responsible for losses in whole brain volume (33, 43, 44). Atrophy of GM structures were detected at the earliest stages of PPMS (33, 45). Whole brain atrophy, occurs at a faster pace, is more severe, extensive, and a stronger predictor of disability than WM atrophy (45–48). It is unknown is whether GM volume loss occurs independently, or results from WM axonal transection with retrograde degeneration (49). Both cortical lesions and GM atrophy are independent predictors of cognitive impairment (50–54), epilepsy (55), fatigue (56, 57), depression (58), and disability (59–62). Assessment of baseline cognitive function was of less value in predicting the probability of future cognitive decline as were MRI measures (61–63). In a serial study involving 1214 MS patients afflicted with all phenotypes and with average follow up of 2.42 years, deep GM volume loss was their main source of disability (45). The decline in deep GM volumes among their 125 patients with PPMS was found to be 1.66% annually (45).
The magnitude of whole brain atrophy in PPMS was found to be more pronounced than in RMS which was more reflective of GM atrophy rather than WM loss (29, 43, 64). Whole brain atrophy results from permanent and irreversible loss of brain parenchyma, which increases with the decline in clinical and cognitive functions (43).
Eijlers et al. demonstrated that cortical atrophy proceeded 1.8 times faster in progressive forms of MS as compared to RMS with higher regional atrophy rates for the parietal, occipital and frontal lobes (54). Cortical GM is an independent predictor of cognitive impairment and disability (52, 54, 65, 66). The most remarkable aspect of the present study is the vulnerability of cortical GM in all but two of our 25 PPMS patients with each having documented volumes below the normative range at or less than 5th percentile.
The hippocampus plays a crucial role in episodic memory formation and retrieval, and hippocampal cell loss can account for the cognitive decline present in over half of MS patients (67).
The extent of lesions involving the hippocampus has correlated with impaired visuospatial memory performance (68, 69). Recent studies have reported substantial atrophy with neuronal loss in the hippocampus of all phenotypes of MS patients (70–72). In a study among 45 patients with PPMS, a majority of hippocampal lesions had synaptic loss that was more extensive than neuronal reduction and independent of focal demyelination (73). Hippocampal volumes were smaller in MS patients when compared to healthy controls, and consistent with the degree of depression that MS patients were experiencing (70). One of our study patients experienced a remarkable 20.61% decline in hippocampal volume over 39 months (Table 1). Overall, the ~1 year longitudinal studies of our 25 PPMS patients showed an average 6.6 % loss in hippocampal volume (Figure 3).
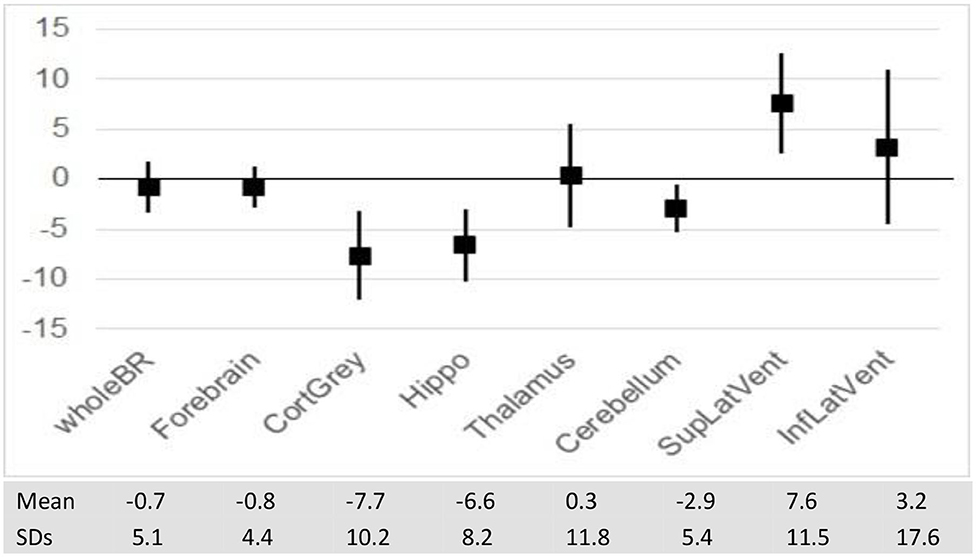
Figure 3. Mean per-cent change in Brain volumes and ventricular size over 1 year (with SD).
The thalamus is involved in all major functional circuits in the brain and mediates a variety of cognitive activities (74–80). Therefore, thalamic volume loss is one of the most clinically relevant consequences of the disease (67, 72) and dysfunction or atrophy of thalamus can result in cognitive dysfunction and fatigue (74–80). Thalamic involvement is associated with a wide variety of other clinical manifestations including motor deficits, chronic pain syndromes, and abnormalities in control of eye movements (74–80). Thalamic atrophy can be one of the earliest and most evident signs of MS pathology (79, 81) and the rate of atrophy remains high throughout the course of the disease in PPMS (81). Some studies demonstrated worsening disability proportional to the extent of thalamic damage (74–80). 3D VBM MRI scanning was used to assess GM structures including thalamic volumes in 79 MS patients and compared with 16 healthy controls (77). There was a 16.8% reduction in thalamic volume in MS patients which correlated with their impaired cognitive performance. 3D VBM analysis was used to examine regional distribution of GM atrophy in 31 patients with PPMS and identified increased thalamic atrophy compared with healthy controls (74). Pontillo et al. showed that PPMS patients had more significant reductions in thalamus when compared to RMS largely due to local microstructural damage and was the most accurate predictor of cognitive impairment (81). Thalamic and cortical gray atrophy have been implicated in objective cognitive impairment as determined by NeuroQuant® analysis in a study by Kletenik et al. (75) They found that among 158 patients who completed Quality of Life in Neurologic Disorders Measures (Neuro-QoL), those with cognitive concerns were associated with reduced thalamic and cortical GM volumes. No other analyzed areas of interest correlated with cognitive issues.
Conclusions
The importance of GM integrity in preserving clinical and cognitive function makes it essential to have an accurate means of measuring the degree of GM pathology. New techniques employing 3D VBM MRI have improved specificity and sensitivity in monitoring the anatomic substrate for a patient's clinical condition (20, 37, 38, 40, 41, 72, 82–84). These quantitative MR applications have allowed precise measurements of GM tissue damage that lead to disability accumulation. Automated 3D VBM techniques have been shown to perform as well as, or better than, manual segmentation performed by expert Neuroradiologists, Radiologists and Neurologists, who have had specialized training and expertise in anatomic labeling of MR images (40, 41, 82, 84). NeuroQuant® was able to provide a precise and reproducible means of measuring volumes of cortical GM and deep GM nuclei, with an easily interpretable imaging technique (37, 40, 41). NeuroQuant® analysis documented widespread atrophy occurring in whole brain, cortical GM, forebrain parenchyma, hippocampus, and thalamus for which Normative Data was available, and which correlated with each patient's clinical and cognitive status. Upon analyzing the Normative Data from 25 PPMS patients, most had statistically significant abnormal GM volumes measuring at or less than the 5th percentile, as well as enlargement of superior and inferior ventricular volumes at or greater than the 95th percentile for their age (Table 2). These results suggest that 3D VBM thereby reduced some of the uncertainty associated with the “clinico-radiological paradox” (1, 2).
Over a period of ~1 year (11–14 months) longitudinal analysis disclosed reductions in cortical GM and hippocampus volumes when compared to baseline values. A longitudinal sample of unselected RMS patients were compared, and differed considerably as their GM volumes were largely preserved, had much lower annualized changes, and their only variance was that the levels of white matter hypointensities were out of normal range in half the patients (Supplement B). These results warrant further research and verification by studying cerebral cortical GM and deep GM nuclei atrophy in larger cohorts of PPMS and RMS patients.
Serial 3D VBM study could be utilized to assess efficacy in experimental MS disease modifying drug trials. In a clinical setting, longitudinal GM volume analysis would help to establish whether patients meet the criteria for “No Evidence of Disease Activity (NEDA)” which has emerged as the therapeutic target for disease modifying therapies (85).
This study has some limitations. Serious shortcomings are identified in the segmentation of deep GM structures using automated techniques (44, 48, 71, 86). There are biologic confounders which could influence the analysis of GM volumes including the introduction of disease modifying therapies, physiologic factors such as state of hydration, normal aging, comorbidities, and daily fluctuations in brain volumes (12, 86). The sample size is small and requires confirmation by encompassing larger numbers of PPMS patients utilizing NeuroQuant® or other 3D VBM automated techniques. Nevertheless, the results of this study are of interest because they underscore the statistically significant GM volume losses outside the normal range for each individual PPMS patient.
In conclusion, the use of 3D VBM MRI analysis and longitudinal study has contributed to a fuller understanding of PPMS pathophysiology in vivo and the prominent role of GM involvement. Knowledge of the degree and rapidity with which cortical atrophy and deep GM volume loss develops clarifies the source of progressive cognitive and clinical decline in PPMS.
Data Availability Statement
The raw data supporting the conclusions of this article will be made available by the authors, without undue reservation.
Ethics Statement
The studies involving human participants were reviewed and approved by George Washington University Institutional Review Board. Written informed consent for participation was not required for this study in accordance with the national legislation and the institutional requirements.
Author Contributions
TR is responsible for all aspects of this manuscript.
Conflict of Interest
The author declares that the research was conducted in the absence of any commercial or financial relationships that could be construed as a potential conflict of interest.
Acknowledgments
The author wishes to thank Mohammad Abu-Rub MD and Ms. Lindsey Covington for technical assistance, Dr. Richard Amdur, who performed the statistical analysis, and Dr. Chris Airriess who reviewed the NeuroQuant® methodology.
Supplementary Material
The Supplementary Material for this article can be found online at: https://www.frontiersin.org/articles/10.3389/fneur.2020.581537/full#supplementary-material
References
1. Barkhof F. The clinico-radiological paradox in multiple sclerosis revisited. Curr Opin Neurol. (2002) 15:239–45. doi: 10.1097/00019052-200206000-00003
2. Bö L, Geurts JJ, van der Valk P, Polman C, Barkhof F. Lack of correlation between cortical demyelination and white matter pathologic changes in multiple sclerosis. Arch Neurol. (2007) 64:76–80. doi: 10.1001/archneur.64.1.76
3. Geurts JJ, Bö L, Pouwels PJW, Castelijns JA, Polman CH, Barkhof F. Cortical lesions in multiple sclerosis: combined postmortem MR imaging and histopathology. AJNR Am J Neuroradiol. (2005) 26:572–7.
4. Peterson JW, Bö L, Mork S, Chang M, Trapp BD. Transected neurites, apoptotic neurons, and reduced inflammation in cortical multiple sclerosis lesions. Ann Neurol. (2001) 50:389–400. doi: 10.1002/ana.1123
5. Kolasinski J, Stagg CJ, Chance SA, DeLuca GC, Esiri MM, Chang E-H, et al. A combined post-mortem magnetic resonance imaging and quantitative histological study of multiple sclerosis pathology. Brain. (2012) 135:2938–51. doi: 10.1093/brain/aws242
6. Bendfeldt K, Blumhagen JO, Egger H, Loetscher P, Denier N, Muelle-Lenke N, et al. Spatiotemporal distribution pattern of white matter lesion volumes and their association with regional grey matter volume reductions in relapsing-remitting multiple sclerosis. Hum Brain Mapp. (2010) 31:1542–55. doi: 10.1002/hbm.20951
7. Chard DT, Griffin CM, Rashid W, Davies GR, Altmann DR, Kapoor R, et al. Progressive gray matter atrophy in clinically early relapsing-remitting multiple sclerosis. Mult Scler. (2004) 10:387–91. doi: 10.1191/1352458504ms1050oa
8. Calabrese M, Gallo P. Magnetic resonance evidence of cortical onset of multiple sclerosis. Mult Scler J. (2009) 15:933–41. doi: 10.1177/1352458509106510
9. Popescu BFG, Klaver R, Voorn P, Galis-de GY, Knol DL, Twisk JW, et al. What drives MRI-measured cortical atrophy in multiple sclerosis. Mult Scler. (2015) 21:1280–90. doi: 10.1177/1352458514562440
10. De Stefano N, Matthews PM, Filippi M, Agosta F, De Luca M, Bartolozzi ML, et al. Evidence of early cortical atrophy in MS. Relevance to white matter changes and disability. Neurology. (2013) 60:1157–62. doi: 10.1212/01.WNL.0000055926.69643.03
11. Steenwijk MD, Daams M, Pouwels PJW, Balk LJ, Tewarie PK, Killestein J, et al. What explains gray matter atrophy in long-standing multiple sclerosis? Radiology. (2014) 272:832–42. doi: 10.1148/radiol.14132708
12. Calabrese M, Magliozzi R, Ciccarelli O, Geurts JJG, Reynolds R, Martin R. Exploring the origins of grey matter damage in multiple sclerosis. Nat Rev Neurosci. (2015) 16:147–58. doi: 10.1038/nrn3900
13. Carassiti D, Altmann DR, Petrova N, Pakkenberg B, Scaravilli F, Schmierer K. Neuronal loss, demyelination and volume change in the multiple sclerosis cortex. Neuropathol Appl Neurobiol. (2018) 44:377–90. doi: 10.1111/nan.12405
14. Miller DH, Grossman RI, Reingold SC, McFarland H. The role of magnetic resonance techniques in understanding and managing multiple sclerosis. Brain. (1988) 121:3–24. doi: 10.1093/brain/121.1.3
15. Miller DH, Barkhof F, Frank JA, Parker GJM, Thompson AJ. Measurement of atrophy in multiple sclerosis: pathological basis, methodological aspects and clinical relevance. Brain. (2002) 125:1676–95. doi: 10.1093/brain/awf177
16. Tiberio M, Chard DT, Altmann DR, Davies G, Griffin CM, Rashid W, et al. Grey and white matter volume change in early relapsing-remitting multiples sclerosis. A two year longitudinal study. Neurology. (2005) 64:1001–7. doi: 10.1212/01.WNL.0000154526.22878.30
17. Fisher E, Lee JC, Nakamura K, Rudick RA. Gray matter atrophy in multiple sclerosis: a longitudinal study. Ann Neurol. (2008) 64:255–65. doi: 10.1002/ana.21436
18. Van Horssen J, Brink BP, de Vries HE, Helga E, van der Valk P, Bö L. The blood-brain barrier in cortical multiple sclerosis lesions. J Neuropathol Exp Neurol. (2007) 66:321–8. doi: 10.1097/nen.0b013e318040b2de
19. Rovaris M, Judica E, Gallo A, Benedetti B, Sormani MP, Caputo D, et al. Grey matter damage predicts the evolution of primary progressive multiple sclerosis at 5 years. Brain. (2006) 129:2628–34. doi: 10.1093/brain/awl222
20. Whitwell JL. Voxel-based morphometry: an automated technique for assessing structural changes in the brain. J Neurosci. (2009) 29:9661–4. doi: 10.1523/JNEUROSCI.2160-09.2009
21. Seewan A, Vrenken H, Kooi E-J, van der Volk P, Knol DL, Polman CH, et al. Imaging the tip of the iceberg: visualization of cortical lesions in multiple sclerosis. Mult Scler. (2011) 17:1202–10. doi: 10.1177/1352458511406575
22. Thompson AJ, Banwell BL, Barkhof F, Carroll WM, Coetzee T, Comi G, et al. Diagnosis of multiple sclerosis: 2017 revisions of the McDonald criteria. Lancet Neurol. (2018) 17:162–73. doi: 10.1016/S1474-4422(17)30470-2
23. Macaron G, Ontaneda D. Diagnosis and management of progressive multiple sclerosis. Biomedicines. (2019) 7:56–79. doi: 10.3390/biomedicines7030056
24. Brück W, Lucchinetti CF, Lassman H. The pathology of primary progressive multiple sclerosis Mult Scler. (2002) 8:93–7. doi: 10.1191/1352458502ms785rr
25. Lucchinetti CF, Rauschka H, Bergmann M, Schmidbauer M, Kutzelnigg A, Parisi JE, et al. Cortical demyelination and diffuse white matter injury in multiple sclerosis. Brain. (2005) 128:2705–12. doi: 10.1093/brain/awh641
26. Lassman H, van Horssen J, Mahad D. Progressive multiple sclerosis. Pathology and pathogenesis. Nat Rev Neurol. (2012) 8:647–56. doi: 10.1038/nrneurol.2012.168
27. Mahad DH, Trapp BD, Lassman H. Pathological mechanisms in progressive multiple sclerosis. Lancet Neurol. (2015) 14:183–93. doi: 10.1016/S1474-4422(14)70256-X
28. Miller DH, Leary SM. Primary progressive multiple sclerosis. Lancet Neurol. (2007) 6:903–12. doi: 10.1016/S1474-4422(07)70243-0
29. Rovaris M, Gallo A, Valsasina P, Benedetti B, Caputo D, Ghezzi A, et al. Short term accrual of gray matter pathology in patients with progressive multiple sclerosis: an in vivo study using diffusion tensor MRI. NeuroImage. (2005) 24:1139–46. doi: 10.1016/j.neuroimage.2004.10.006
30. Kurtzke, JF. Rating neurologic impairment in multiple sclerosis: an expanded disability status scale (EDSS). Neurology. (1983) 33:1444–52. doi: 10.1212/WNL.33.11.1444
31. Freitas S, Batista S, Alfonso AC, Simöes MR, de Sousa L, Cunha L, et al. The Montreal Cognitive Assessment (MoCA) as a screening test for cognitive dysfunction in multiple sclerosis. Appl Neuropsychol Adult. (2018) 25:57–70. doi: 10.1080/23279095.2016.1243108
32. Montalban X, Hauser L, Kappos L, Arnold DL, Bar-Or A, Comi G, et al. Ocrelizumab versus placebo in primary progressive multiple sclerosis. N Engl J Med. (2017) 376:209–20. doi: 10.1056/NEJMoa1606468
33. Sepulcre J, Sastre-Garriga J, Cercignani M, Ingle GT, Miller DH, Thompson AJ. Regional gray matter atrophy in early primary progressive multiple sclerosis: a voxel-based morphometry study. Arch Neurol. (2006) 63:1175–80. doi: 10.1001/archneur.63.8.1175
34. Prinster A, Quarantelli M, Orefice G, Lanzillo R, Brunetti A, Mollica C, et al. Gray matter loss in relapsing-remitting multiple sclerosis: a voxel-based morphometry study. NeuroImage. (2006) 29:859–67. doi: 10.1016/j.neuroimage.2005.08.034
35. Ceccarelli A, Rocca MA, Pagani E, Columbo B, Martinelli V, Comi G, et al. A voxel based morphometry study of gray matter loss in MS patients with different clinical phenotypes. NeuroImage. (2008) 42:315–22. doi: 10.1016/j.neuroimage.2008.04.173
36. Hutton C, De VE, Ashburner J, Deichmann R, Turner R. Voxel-based cortical thickness measurements in MRI. NeuroImage. (2008) 40:1701–10. doi: 10.1016/j.neuroimage.2008.01.027
37. Brewer JB. Fully automated volumetric MRI with normative ranges: translation to clinical practice. Behav Neurol. (2009) 21:21–8. doi: 10.1155/2009/616581
38. Amiri H, de Sitter A, Bendfeldt K, Battaglini M, Claudia AM, Wheeler-Kingshott G, et al. Urgent challenges in quantification and interpretation of grey matter atrophy in individual MS patients using MRI. NeuroImage Clin. (2018) 19:466–75. doi: 10.1016/j.nicl.2018.04.023
39. Bodini B, Louapre C, Stankoff N. Advanced imaging tools to investigate multiple sclerosis pathology. Presse Med. (2015) 44:e159–67. doi: 10.1016/j.lpm.2015.02.011
40. Wang C, Beadnall, Hatton SN, Bader G, Tomic D, Silva DG, et al. Automated brain volumetrics in multiple sclerosis: a step closer to clinical application. J Neurol Neurosurg Psychiatr. (2016) 87:745–57. doi: 10.1136/jnnp-2015-312304
41. Ross DE, Ochs AL, Tate DF, Tokac U, Seabaugh J, Abildskov TJ, et al. High correlations between MRI brain volume measurement based on NeuroQuant® and FreeSurfer. Psychiatr Res Neuroimag. (2018) 278:69–76. doi: 10.1016/j.pscychresns.2018.05.007
42. Cotrell DA, Kremerchutzky M, Rice GPA, Koopman WJ, Hader W, Baskerville J, et al. The natural history of multiple sclerosis: a geographically based study. 5. The clinical features and natural history of primary progressive multiple sclerosis. Brain. (1999) 122:625–39. doi: 10.1093/brain/122.10.1941
43. Losseff NA, Wang L, Lai HM, Yoo DS, Gawne-Cain ML, McDonald WI, et al. Progressive cerebral atrophy in multiple sclerosis: a serial MRI study. Brain. (1996) 119:2009–19. doi: 10.1093/brain/119.6.2009
44. Inglese M, Oesingmann N, Casacia P. Progressive multiple sclerosis and grey matter pathology. An MRI perspective. Mt Sinai J Med. (2011) 78:258–67. doi: 10.1002/msj.20247
45. Eshaghi A, Prado F, Brownlee W, Altmann DR, Tur C, Cardoso MJ, et al. Deep grey matter drives disability worsening in multiple sclerosis. Ann Neurol. (2018) 83:210–22. doi: 10.1002/ana.25145
46. Khaleeli Z, Cercignani M, Audoin B, Ciccarelli D, Miller DH, Thompson AJ. Localized grey matter damage in early primary progressive multiple sclerosis contributes to disability. NeuroImage. (2007) 37:253–61. doi: 10.1016/j.neuroimage.2007.04.056
47. Sanfilipo MP, Benedict RH, Sharma J, Weinstock-Guttman B, Bakshi R. The relationship between whole brain volume and disability in multiple sclerosis. A comparison of normalized gray vs. white matter with misclassification correction. NeuroImage. (2005) 26:1068–77. doi: 10.1016/j.neuroimage.2005.03.008
48. Roosendaal SD, Bendfeldt K, Vrenken H, Polman CH, Borgwardt S, Radie EW, et al. Grey matter volume in a large cohort of MS patients: relation to MRI parameters and disability. Mult Scler J. (2011) 17:1098–106. doi: 10.1177/1352458511404916
49. Bö L, Geurts JJ, Mork S, van der Valk P. Grey matter pathology in multiple sclerosis. Acta Neurol Scand Suppl. (2006) 183:45–50. doi: 10.1111/j.1600-0404.2006.00615.x
50. Rovaris M, Filippi M, Minicucci L, Iannucci G, Santuccio G, Possa F, et al. Cortical/subcortical disease burden and cognitive impairment in patients with multiple sclerosis. AJNR Am J Neuroradiol. (2000) 21:402–8.
51. Rovaris M, Filippi M. MRI correlates of cognitive dysfunction in multiple sclerosis patients. J Neurovirol. (2000) 6:172–5.
52. Staff N, Lucchinetti CF, Keegan M. Multiple sclerosis with predominant severe cognitive impairment. Arch Neurol. (2009) 66:1139–43. doi: 10.1001/archneurol.2009.190
53. Nocentini U, Bossali M, Spano B, Cercignani M, Serra L, Basile B, et al. Exploration of the relationships between regional grey matter atrophy and cognition in multiple sclerosis. Brain Imaging Behav. (2014) 8:378–86. doi: 10.1007/s11682-012-9170-7
54. Eijlers AJC, van Geest Q, Dekker I, Steenwijk M, Heijer KA Hulst HE, et al. Predicting cognitive decline in multiple sclerosis: a five year follow-up study. Brain. (2018) 141:2605–18. doi: 10.1093/brain/awy202
55. Spatt J, Chaix R, Mamoli E. Epileptic and non-epileptic seizures in multiple sclerosis. J Neurol. (2001) 248:2–9. doi: 10.1007/s004150170262
56. Riccitelli G, Rocca MA, Forn C, Colombo B, Comi G, Filippi M. Voxel-wise assessment of regional damage in the brains of patients with multiple sclerosis and fatigue. AJNR Am J Neuroradiol. (2011) 32:874–7. doi: 10.3174/ajnr.A2412
57. Seamon BA, Harris-Love MO. Clinical assessment of fatigability in multiple sclerosis: a shift from perception to performance. Front Neurol. (2016) 7:194. doi: 10.3389/fneur.2016.00194
58. Feinstein A. Multiple sclerosis and depression. Mult Scler J. (2012) 17:1276–81. doi: 10.1177/1352458511417835
59. Calabrese M, Poretto V, Favoretto A, Alessio S, Bernardi V, Romualdi C, et al. Cortical lesion load associates with progression of disability in multiple sclerosis. Brain. (2012) 135:2952–61. doi: 10.1093/brain/aws246
60. Pitteri M, Romualdi C, Magliozzi R, Monaco S, Calabrese M. Cognitive impairment predicts disability progression and cortical thinning in MS: an 8-year study. Mult Scler J. (2017) 23:848–54. doi: 10.1177/1352458516665496
61. Filippi M, Preziosa P, Copetti M, Riccitelli G, Horsfield MA, Martinelli V, et al. Gray matter damage predicts the accumulation of disability 13 years later in MS. Neurology. (2013) 81:1759–67. doi: 10.1212/01.wnl.0000435551.90824.d0
62. Filippi M. MRI measures of neurodegeneration in multiple sclerosis: implications for disability, disease monitoring, and treatment. J Neurol. (2015) 262:1–6. doi: 10.1007/s00415-014-7340-9
63. Rocca MA, Sormani MP, Rovaris M, Caputi D, Ghezzi A, Montanari E, et al. Long term disability progression in primary progressive multiple sclerosis. Brain. (2017) 140:2814–8. doi: 10.1093/brain/awx250
64. Sastre-Garriga J, Ingle GT, Chard DT. Grey and white matter volume changes in early primary progressive multiple sclerosis: a longitudinal study. Brain. (2005) 28:1454–60. doi: 10.1093/brain/awh498
65. Calabrese M, Filippi M, Gallo P. Cortical lesions in multiple sclerosis. Nat Rev Neurol. (2010) 6:438–44. doi: 10.1038/nrneurol.2010.93
66. Fisniku LK, Chard DT, Jackson JS, Anderson VM, Altmann DR, Miszkiel K, et al. Gray matter atrophy is related to long term disability in multiple sclerosis. Ann Neurol. (2008) 64:247–54. doi: 10.1002/ana.21423
67. Squire LR, Stark CE, Clark RE. The medial temporal lobe. Ann Revu Neurosci. (2004) 27:279–306. doi: 10.1146/annurev.neuro.27.070203.144130
68. Bird CM, Burgess N. The hippocampus and memory: insights from spatial processing. Nat Rev Neurosci. (2008) 9:182–94. doi: 10.1038/nrn2335
69. Burgess N, Macguire EA, O'Keefe J. The human hippocampus and spatial and episodic memory. Neuron. (2002) 35:625–41. doi: 10.1016/S0896-6273(02)00830-9
70. Geurts JJ, Bö L, Roosendaal SD, Hazes T, Daniëls R, Barkhof F, et al. Extensive hippocampal demyelination in multiple sclerosis. J Neuropath Exp Neurol. (2007) 66:819–27. doi: 10.1097/nen.0b013e3181461f54
71. Anderson VM, Fisniku LK, Khaleeli Z, Summers MM, Penny SA, Altmann DR, et al. Hippocampal atrophy in relapsing-remitting and primary progressive MS: a comparative study. Mult Scler. (2010) 16:1083–90. doi: 10.1177/1352458510374893
72. Damjanovic D, Valsasina P, Rocca MA, Stomillo ML, Gallo A, Tewarie PK, et al. Hippocampal and deep gray matter nuclei atrophy is relevant for explaining cognitive impairment in MS: a multicenter study. AJNR Am J Neuroradiol. (2017) 38:18–24. doi: 10.3174/ajnr.A4952
73. Papadopoulos D, Dukes S, Patel R, Nicholas R, Vora A, Reynolds R. Substantial archaeocortical atrophy and neuronal loss in multiple sclerosis. Brain Pathol. (2009) 19:238–53. doi: 10.1111/j.1750-3639.2008.00177.x
74. Azvedo CJ, Cen SY, Khadka S, Liu S, Kornak J, Yonggang S, et al. Thalamic atrophy in multiple sclerosis: a magnetic imaging marker of neurodegeneration throughout disease. Ann Neurol. (2008) 83:223–34. doi: 10.1002/ana.25150
75. Kletenik I, Alvarez E, Honce JM, Valdez B, Vollmer TL, Medina LD. Subjective cognitive concern in multiple sclerosis is associated with reduced thalamic and cortical gray matter volumes. Mult Scler J Exp Transl Clin. (2019) 5:2055217319827618. doi: 10.1177/2055217319827618
76. Stein T, Moritz C, Quigley M, Cordes D, Haughton V, Meyerand E. Functional connectivity in the thalamus and hippocampus studied with functional MR imaging. AJNR Am J Neuroradiol. (2000) 21:1397–401.
77. Houtchens MK, Benedict RHB, Killiany R, Sharma J, Jaisani Z, Singh B, et al. Thalamic atrophy and cognition in multiple sclerosis. Neurology. (2007) 69:1213–23. doi: 10.1212/01.wnl.0000276992.17011.b5
78. Rocca MA, Mesaros S, Pagani E, Sormani MP, Comi G, Filippi M. Thalamic damage and long-term progression of disability in multiple sclerosis. Radiology. (2010) 257:463–9. doi: 10.1148/radiol.10100326
79. Mesaros S, Rocca MA, Pagani E, Sormani MP, Petrolini M, Comi G, Filippi M. Thalamic damage predicts the evolution of primary-progressive multiple sclerosis at 5 years. AJNR Am J Neuroradiol. (2011) 32:1016–20. doi: 10.3174/ajnr.A2430
80. Schoonheim MM, Hulst HE, Brandt RB, Strik M, Wink AM, Uitdehaag BM, et al. Thalamus structure and function determine severity of cognitive impairment in multiple sclerosis. Neurology. (2015) 84:776–83. doi: 10.1212/WNL.0000000000001285
81. Pontillo G, Cocozza S, Lanzillo R, Russo C, Stasi MD, Paolella C, et al. Determinants of deep grey matter in multiple sclerosis: a multimodal MRI study. AJNR Am J Neuroradiol. (2019) 40:99–106. doi: 10.3174/ajnr.A5915
82. Derakshan M, Caramanos Z, Giacomini PS, Narayanan S, Maranzano J, Francis SJ, et al. Evaluation of automated techniques for the quantification of grey matter atrophy in patients with multiple sclerosis. NeuroImage. (2010) 52:1261–7. doi: 10.1016/j.neuroimage.2010.05.029
83. Jasperse B, Valsasina P, Neascu V, Knol DL, De Stefano N, Enzinger C, et al. Intercenter agreement of brain atrophy measurement in MS patients using manually edited SIENA and SIENAX. J Magn Reson Imaging. (2007) 26:881–5. doi: 10.1002/jmri.21101
84. Kuchling J, Friedemann P. Visualizing the central nervous system: imaging tools of multiple sclerosis and neuromyelitis optica. Front Neuro. (2020) 11:450. doi: 10.3389/fneur.2020.00450
85. Kappos L, De Stefano N, Freedman MS, Cree BAC, Radue E-W, Till Springer M, et al. Inclusion of brain volume loss in a revised measure of “no evidence of disease activity” (NEDA-4) in relapsing remitting multiple sclerosis. Mult Scler J. (2016) 22:1297–305. doi: 10.1177/1352458515616701
Keywords: primary progressive multiple sclerosis, voxel based morphometry, MR imaging, gray matter, memory deficit
Citation: Rothstein TL (2020) Gray Matter Matters: A Longitudinal Magnetic Resonance Voxel-Based Morphometry Study of Primary Progressive Multiple Sclerosis. Front. Neurol. 11:581537. doi: 10.3389/fneur.2020.581537
Received: 13 July 2020; Accepted: 14 October 2020;
Published: 12 November 2020.
Edited by:
Maria Pia Amato, University of Florence, ItalyReviewed by:
Izumi Kawachi, Niigata University, JapanSeema Kalra, University Hospitals of North Midlands NHS Trust, United Kingdom
Copyright © 2020 Rothstein. This is an open-access article distributed under the terms of the Creative Commons Attribution License (CC BY). The use, distribution or reproduction in other forums is permitted, provided the original author(s) and the copyright owner(s) are credited and that the original publication in this journal is cited, in accordance with accepted academic practice. No use, distribution or reproduction is permitted which does not comply with these terms.
*Correspondence: Ted L. Rothstein, dHJvdGhzdGVpbkBtZmEuZ3d1LmVkdQ==