 Lee J. Martin1,2,3,4*
 Margaret Wong1
- 1Division of Neuropathology, Department of Pathology, Johns Hopkins University School of Medicine, Baltimore, MD, United States
- 2Pathobiology Graduate Training Program, Johns Hopkins University School of Medicine, Baltimore, MD, United States
- 3Department of Neuroscience, Johns Hopkins University School of Medicine, Baltimore, MD, United States
- 4Department of Anesthesiology and Critical Care Medicine, Johns Hopkins University School of Medicine, Baltimore, MD, United States
Amyotrophic lateral sclerosis (ALS) is a fatal heterogeneous neurodegenerative disease that causes motor neuron (MN) loss and skeletal muscle paralysis. It is uncertain whether this degeneration of MNs is triggered intrinsically and is autonomous, or if the disease initiating mechanisms are extrinsic to MNs. We hypothesized that skeletal muscle is a primary site of pathogenesis in ALS that triggers MN degeneration. Some inherited forms of ALS are caused by mutations in the superoxide dismutase-1 (SOD1) gene, that encodes an antioxidant protein, so we created transgenic (tg) mice expressing wild-type-, G37R-, and G93A-human SOD1 gene variants only in skeletal muscle. Presence of human SOD1 (hSOD1) protein in skeletal muscle was verified by western blotting, enzyme activity gels, and immunofluorescence in myofibers and satellite cells. These tg mice developed limb weakness and paresis with motor deficits, limb and chest muscle wasting, diaphragm atrophy, and age-related fatal disease with a lifespan shortening of 10–16%. Brown and white adipose tissue also became wasted. Myofibers of tg mice developed crystalline-like inclusions, individualized sarcomere destruction, mitochondriopathy with vesiculation, DNA damage, and activated p53. Satellite cells became apoptotic. The diaphragm developed severe loss of neuromuscular junction presynaptic and postsynaptic integrity, including decreased innervation, loss of synaptophysin, nitration of synaptophysin, and loss of nicotinic acetylcholine receptor and scaffold protein rapsyn. Co-immunoprecipitation identified hSOD1 interaction with rapsyn. Spinal cords of tg mice developed gross atrophy. Spinal MNs formed cytoplasmic and nuclear inclusions, axonopathy, mitochondriopathy, accumulated DNA damage, activated p53 and cleaved caspase-3, and died. Tg mice had a 40–50% loss of MNs. This work shows that hSOD1 in skeletal muscle is a driver of pathogenesis in ALS, that involves myofiber and satellite cell toxicity, and apparent muscle-adipose tissue disease relationships. It also identifies a non-autonomous mechanism for MN degeneration explaining their selective vulnerability as likely a form of target-deprivation retrograde neurodegeneration.
Introduction
Amyotrophic lateral sclerosis (ALS) is a fatal neurodegenerative disease that causes skeletal muscle paralysis, respiratory failure, and death generally within 3–5 years after symptom onset (1, 2). Muscle weakness and fasciculations are early clinical signs. The cause of the morbidity is progressive skeletal muscle loss of function and degeneration of upper motor neurons (MNs) in cerebral cortex and lower MNs in brainstem and spinal cord (2, 3). Aging and heterogeneous gene mutations are risk factors for ALS. Most ALS cases are sporadic with no known inheritance pattern. The driving molecular mechanisms of the disease are unknown, and there are no effective treatments (2). Inherited or familial forms of ALS (fALS) have autosomal dominant or autosomal recessive patterns and make up ~10% or less of all ALS cases (2, 4). Heterozygous mutations in the superoxide dismutase-1 (SOD1) gene account for ~20% of all fALS cases (~2% of all ALS cases) (5, 6). SOD1 (copper/zinc SOD) is ubiquitous in most tissues (7) and is a metalloenzyme that functions as a ~32 kDa non-covalently assembled homodimer of ~16 kDa subunits that bind one copper ion and one zinc ion (8). This enzyme detoxifies and maintains intracellular superoxide anion (O2−) concentration in the low femtomolar range by catalyzing the dismutation of O2− to molecular oxygen and hydrogen peroxide (8). SOD1 mutants appear to gain a toxic property or function, rather than losing O2− scavenging activity (5, 9, 10), and wild-type SOD1 can become toxic through oxidative post-translation modification and zinc deficiency (11–14).
Nearly three decades have elapsed since the discovery of hSOD1 linkage to fALS (5, 6); yet, the triggering events for MN injury and degeneration in ALS are still not understood, and the apparent early preferential vulnerability of MNs remains unexplained. Many etiologies have been implicated, including neurotrophin deprivation, axonopathy, neuronal hyperexcitability and excitotoxicity, DNA damage, nuclearopathy, protein aggregation and proteasome dysfunction, mitochondriopathy, and oxidative stress (2, 15–17). Many of these mechanisms are consistent with SOD1 biology and its proneness to proteinopathy and aberrant oxidative chemistry being disease drivers (18). Notwithstanding, the extent to which specific intrinsic abnormalities within MNs and other spinal cord cells contribute to the pathogenesis of ALS is controversial. MN degeneration was not observed in transgenic (tg) mice expressing human mutant SOD1 selectively in neurons by a Thy1 promoter (19, 20); however, neuron-specific expression of human mutant SOD1 was sufficient to induce MN degeneration in other tg mice (21, 22). Tg mice with astrocyte-specific expression of human mutant SOD1 did not develop disease (23), but cell culture studies indicate that mutant SOD1 in astrocytes can cause degenerative changes in wild-type MNs and worsen toxicity of mutant SOD1 within MNs (24). Human mutant SOD1 expressed in microglia might also be toxic to MNs in tg mice (25, 26) and in cell culture (27); furthermore, degeneration of MNs expressing mutant SOD1 in wild-type astrocyte or microglia environments delayed or prevented in chimeric mice (28) and in mice with wild-type neural progenitor cell transplants (29). However, elimination of proliferating microglia-expressing human mutant SOD1 in mice did not affect MN degeneration (30).
Cells and tissues outside the CNS are diseased in human ALS, including lymphocytes (31), fibroblasts (32, 33), skeletal muscle (34, 35), and adipose (36). Emerging evidence suggests a negative systemic metabolic syndrome in ALS (37, 38), with a third to about half of all ALS patients having hypermetabolic resting energy expenditure (39, 40). Skeletal muscle pathology and early functional abnormalities occur in patients with sporadic ALS (41–43) and fALS (44, 45) and in mutant SOD1 tg mice (38, 46, 47), but abnormalities in skeletal muscle are interpreted often as secondary to CNS disease (42, 48). However, tg mice expressing ALS-causing mutant hSOD1 in only skeletal muscle develop motor deficits and skeletal muscle disease involving myofiber atrophy and mitochondrial perturbations (49) and also oxidative stress and increased protein nitration and MN degeneration, even with low copy number of transgene (50). These latter mice were examined at young to mid-life, but critical later-life phenotype assessments were not done (50) to fully test the hypothesis that skeletal muscle is a primary site of pathogenesis that manifests as an ALS-like disease. This study shows that aged tg mice expressing wild-type-, G37R-, and G93A-human SOD1 gene variants only in skeletal muscle develop a fatal ALS-like disease phenotype involving prominent skeletal muscle and spinal cord pathology, suggesting a skeletal muscle disease triggered, MN non-autonomous degeneration in ALS driven by DNA damage and retrograde neurodegeneration.
Materials and Methods
Transgene Design and Creation of hSOD1mus tg Mice
All mouse experiments complied with regulations of the Animal Care and Use Committee at Johns Hopkins University School of Medicine in accordance with the laws of the State of Maryland and the United States of America. A 247 bp ClaI/XmaI fragment containing the chicken skeletal muscle αsk actin promoter from plasmid CLA12-191αACTCAT1 (51) was cloned into the ClaI/XmaI multiple cloning site of the pBluescript IISK(+) phagemid (Stratagene). This short xeno-promoter has been used to create several lines of tg mice with skeletal muscle-specific expression of exogenous proteins (51–54). The G37R and G93A point mutations were introduced into the wild-type (WT) hSOD1 gene coding sequence within entry clone IOH4089 (Invitrogen) using the QuikChange II Site-Directed Mutagenesis kit (Stratagene). PCR was used to amplify wild-type and mutant hSOD1 cDNA sequences from the entry clones using 5′and 3′ primers flanked by BamHI restriction sites. The 3′ primer also contained ATTAAA, the poly adenylation signal 5′ to the BamHI site. The amplified 555 bp product was cloned into the BamHI cloning site in pBluescript that was 3′ to the chicken αsk actin promoter (51). All sequences were directly confirmed by sequencing in both forward and reverse directions.
To create tg mice, the 3 different transgene-containing plasmids were digested with ApaLI, resulting in a 2.5 Kb fragment. The fragments were given to the Johns Hopkins Transgenic Core Facility for injection into B6SJLF1 mouse embryos. Tg mouse positives were confirmed by PCR analysis of tail genomic DNA using 3 different primer pairs. Mouse tails were digested using DirectPCR Lysis Reagent (Viagen Biotech) and DNA was extracted from the lysate by precipitation with isopropanol. The presence of the transgene was confirmed by PCR using primers described (50). All PCR products contained the coding region of the hSOD1 gene. Southern blot analysis was used to determine the presence of transgene and copy number. In this study, the tg mouse lines used for longitudinal assessments were: G37R-hSOD1mus (lines 25 and 73); G93A-hSOD1mus (lines 98 and 112); and WT-hSOD1mus (lines 125 and 224). The mouse generations were F9, F10, and F11.
Assessment of Neurologic Deficits in hSOD1mus tg Mice
Tg hSOD1mus mice and age-matched non-tg littermate controls were examined longitudinally beginning at the day of birth to the end of their lives. Older mice were checked daily in the vivarium. All mice were barcoded and genotyped from tail genomic DNA at 1 month of age. They were assessed for neurologic deficits beginning at 1 month of age until life ending. Neurologic test results from 6 to 12 months of age have been reported (50). Here, we report data from 1 to 2 years of age. Mice were assessed using a wire hang-time test, as described (50), and a swimming test. The swimming test is a novel assessment. A plastic rectangular pool (14” × 17”) filled with 3.5” of water (35–40°C) was used. This water level was enough to allow mice to climb out of the pool onto side of the pool. The bottom of the pool was divided into four quadrants. Test mice were placed gently by their tail into the center of the pool (identified by intersecting lines on the pool bottom) and were videotaped by a central overhead camera for 2-min episodes. Swimming videos were evaluated and scored on a point range of +25 (best possible) to −25 (worst possible). Mice were assigned positive scores for using individual limbs and corresponding negative scores for not using individual limbs; similarly, positive scores for time in active swimming or negative scores for body freezing/floating. Coordinated tail use for swimming was also scored. If the mice were observed to be struggling and at risk for submersion, they were quickly removed from the pool. If mice were at risk of submersion immediately after being placed into the pool, they were quickly removed and assigned a score of −25. The tests and analyses were done blinded to genotype. At least 2 trials were done for each mouse and then averaged.
Anatomical Pathology
All mice had thorough necropsies, including mice that were killed for fresh tissue harvesting and those that were perfusion-fixed with 4% paraformaldehyde and used for anatomical pathology studies. Mice were examined grossly externally and internally for evidence of malignancy. They were stripped of their skin, and chest circumference was measured (in mm) consistently at the manubrium articulation with the xyphoid process. Interscapular white adipose tissue (WAT) and the underlying brown adipose tissue (BAT) located deep between the scapulae were collected and weighed. The hindlegs were cut from the body precisely between the two trochanters, felt by palpation on the femur, and weighed. The diaphragms were carefully cut using iridectomy scissors away from the vertebra, costal margins, and xyphoid process, weighed, and broadest point diameters were measured including left and right muscle flanks and central tendon. The brains and spinal cord were removed from the skull and vertebral column intact from the frontal poles anteriorly to the spinal cord conus posteriorly. The spinal cord was transected at cervical level C1 and weighed.
Nitric Oxide (NO) Tracking in Skeletal Muscle
NO production in myofibers in vivo was tracked using 1,2-diaminoanthraquinone (DAA, Invitrogen Molecular Probes). DAA is a non-fluorescent aromatic vicinal diamine that reacts selectively with NO to yield a fluorescent product (55, 56). Tracer was prepared in Influx (Invitrogen Molecular Probes) pinocytic cell-loading reagent. Myofibers were loaded in vivo by injection of DAA (50 μM, 10 μl boluses) into the gastrocnemius along its midline length. Injections (100 μl boluses) were also made into the thoracic cavity through the intercostal muscles. DAA with loading reagent is endocytosed (57, 58). One day later mice were overdosed with anesthesia and perfused with paraformaldehyde. As a negative control, NG-nitro-L-arginine methyl ester (L-NAME) was injected (50 mg/kg, ip) to inhibit all forms of nitric oxide synthase (NOS). Gastrocnemius muscles were cryoprotected and frozen sectioned transversely into 40 μm sections that were mounted on glass microscope slides. Diaphragms were evaluated as whole mounts. NO histochemical preparations were analyzed for fluorescence intensity quantitatively using methods described (59, 60).
Immunoblotting, Immunoprecipitation, Biochemistry, and In-Gel Activity Assays
Western blot analysis was done on skeletal muscles and spinal cord to examine the levels of several target proteins (Table 1), including hSOD1 and other proteins broadly categorized as markers for the neuromuscular junction (NMJ), MNs and their injury response, cell death and DNA damage response (DDR), and oxidative stress. hSOD1mus tg mice 1.5–2.2 years old (n = 18 for each genotype) and age-match non-tg littermate control mice (n = 20) were used. Some comparisons also included tissues from mice (n = 20 per genotype) <1.5 years of age as reported before (50). The mice received a lethal dose of anesthetic and were decapitated for harvesting forelimb and hindlimb skeletal muscle (triceps, quadriceps femoris, biceps femoris, gastrocnemius, and tibialis anterior), diaphragm, brain, and spinal cord which were quickly frozen on dry ice.

Table 1. Primary antibodies used.
These samples were minced or pulverized and homogenized with a Brinkmann polytron in ice-cold 20 mM Tris HCl (pH 7.4) containing 10% (wt/vol) sucrose, 200 mM mannitol, complete protease inhibitor cocktail (Roche), 0.1 mM phenylmethylsulfonyl fluoride, 10 mM benzamidine, 1 mM EDTA, and 5 mM EGTA. Crude homogenates were sonicated for 15 s and then centrifuged at 1,000 gav for 10 min (4°C). The supernatant was centrifuged at 54,000 gav for 20 min (4°C) to yield soluble (S2) and membrane-enriched pellet (P2) fractions. This subcellular fractionation protocol has been verified (61). The pellet fraction was washed (twice) by trituration in homogenization buffer followed by centrifugation and then finally resuspended in homogenization buffer (without sucrose) supplemented with 20% (wt/vol) glycerol. Protein concentrations were measured by a Bio-Rad protein assay with bovine serum albumin as a standard.
Proteins from skeletal muscle and spinal cord were subjected to sodium dodecyl sulfate polyacrylamide gel electrophoresis (SDS-PAGE) and transferred to nitrocellulose membrane by electroelution as described (61). For immunoprecipitation (IP) prior to SDS-PAGE, skeletal muscle protein extract (500 μg) was input for 5 μg hSOD1 antibody (Table 1) followed by agarose-conjugated protein A (Pierce) for capture. Negative control conditions for IP experiments were homogenates from non-tg mice, IP with isotype specific non-immune IgG, IP with PBS, and IP with no homogenate input. Final IP samples were subjected to SDS-PAGE and western blot. The reliability of sample loading and electroblotting for every blot was evaluated by staining nitrocellulose membranes with Ponceau S before immunoblotting. If transfer was not uniform, blots were discarded, and gels were run again. Ponceau S stained membranes were imaged and used as protein loading controls. Blots were blocked with 2.5% non-fat dry milk with 0.1% Tween 20 in 50 mM Tris-buffered saline (pH 7.4), then incubated overnight at 4°C with primary antibody (Table 1). The antibodies were used at concentrations for visualizing protein immunoreactivity within the linear range as described (62). After primary antibody incubation, blots were washed, and incubated with horseradish peroxidase-conjugated secondary antibody (0.2 μg/ml), developed with enhanced chemiluminescence (Pierce), and exposed to x-ray film or digital imaging. After careful verification of immunoreactive band identity using positive and negative controls, immunoreactivities of target proteins were measured by densitometry.
The biochemical activity for catalase was determined in skeletal muscle extracts using a spectrophotometric assay (Sigma-Aldrich). Soluble protein fractions from age-matched non-tg mice and hSOD1mus tg mice (n = 6/group) at 1.5 years of age were used as input. Bovine catalase was used as a positive control. Copper sulfate was used as a catalase inhibitor negative control. Enzymatic reactions were read at 520 nm.
For in-gel SOD activity assays, native SDS-PAGE was done on skeletal muscle extracts from tg and non tg mice. Purified human SOD1 (Sigma) was loaded as a positive control. A two-step procedure using nitroblue tetrazolium and riboflavin was done (63). Potassium cyanide was used as an inhibitor to determine the specificity of enzyme visualization.
Histology and Immunohistochemistry
After perfusion-fixation, forelimb triceps muscle, hindlimb biceps femoris muscle, and CNS were removed from each mouse, and the tissues were cryoprotected (20% glycerol) before they were frozen-sectioned (40 μm) using a sliding microtome. Serial tissue sections were stored individually in 96-well plates. The diaphragm was removed intact for studying as a whole mount. Skeletal muscle sections were used for terminal deoxynucleotidyl nick-end labeling (TUNEL) to visualize DNA damage (DNA double-strand breaks)-cell death as described (59, 64) and immunofluorescence to study the localizations of hSOD1 and satellite cell markers (65) as described (60, 66). Spinal cord sections were used for Nissl (cresyl violet, CV) and silver staining, TUNEL, and immunohistochemistry (IHC). CV staining was done on every 10th section of lumbar and cervical spinal cord. Silver staining was used to visualize degenerating neurons in every 11th spinal cord section using the FD NeuroSilver kit (FD Neurotechnologies Inc, Baltimore, MD). Immunoperoxidase IHC, with diaminobenzidine (DAB) as chromogen, was done on spinal cord sections to localize ubiquitin, TDP-43, SOD2, phospho-p53, and cleaved caspase-3. Counterstaining with CV was done for cellular and neuroanatomical perspective.
Cell Counting and Pathology Measurements
Profile counting was used to estimate the numbers of: [1] TUNEL-positive nuclei in skeletal muscle and spinal cord ventral horn; [2] morphologically normal spinal MNs in CV-stained sections; [3] chromatolytic MNs and axonal swellings in TDP-43 IHC sections; [4] cleaved caspase-3- and phospho-p53-positive MNs in IHC sections; and [5] MN perikaryal mitochondria in SOD2 IHC sections. For all counting, sections were selected with a random start and then systematically sampled (every 10th section) to generate a subsample of sections from each mouse muscle or spinal cord that were mounted on glass slides for evaluation. MNs were counted at 400x magnification using strict morphological criteria. These criteria included a round, open, pale nucleus (not condensed and darkly stained), globular Nissl staining of the cytoplasm, and a diameter of ~25–40 μm. With these criteria, astrocytes, oligodendrocytes, and microglia were excluded from the counts. Axonal swellings were counted in the lumbar spinal cord ventral funiculus at 400x. MN perikaryal SOD2-positive mitochondria were counted at the base of the primary dendrites near the nucleus at 1000x.
Neuromuscular Junction (NMJ) Analysis
To study the NMJ, motor endplates in diaphragms were visualized using fluorescent-conjugated α-bungarotoxin (BTX) that binds irreversibly to postsynaptic acetylcholine receptors on the skeletal muscle plasma membrane (67). Motor endplates were visualized with Alexa 594-conjugated α-BTX (Invitrogen) as described (29). MN axons were visualized in two ways. We generated double tg mice by crossing hSOD1mus tg mice with B6.Cg-tg Hlxb9-gfp1Tmj/j mice expressing eGFP driven by the mouse Hb9 promoter (68). Dual labeling was also done to visualize MN distal axons and their synaptic terminals in skeletal muscle by immunofluorescent detection of either neurofilament protein or synaptophysin (Table 1). The immunofluorescent labeling for neurofilament was used to determine whether the endplates were innervated. Sections were analyzed using a Zeiss Axiphot epifluorescence microscope or an LSM 410 confocal microscope. The BTX staining patterns were used to assess quantitatively endplate structure in age-matched hSODmus tg and non-tg mice. Endplates were scored as innervated or denervated.
Comet Assay
We used the comet assay to measure DNA damage in diaphragm myonuclei and spinal cord MN nuclei of hSOD1mus tg mice and age-matched controls. Whole diaphragm cell nuclei were isolated from fresh tissue as described (66). MN nuclei were isolated from fresh lumbar spinal cord using differential centrifugation as described (69, 70). The alkaline comet assay was used to detect DNA single-strand breaks (DNA-SSBs) and the percentage of nuclei with comet tails as described (69, 70).
Electron Microscopy (EM)
Age-matched non-tg and hSOD1mus-G37R, -G93A, and -wild-type tg mice (15–17 months of age) received an anesthetic overdose and were perfused transcardially with 2% paraformaldehyde/2% glutaraldehyde. The group sizes were 2 mice per genotype. Tissue samples of left and right biceps femoris were taken from each mouse and processed and embedded in plastic for conventional transmission EM as described (71). Tissue samples were cut in the transverse plane at 0.5 μm for high-resolution light microscopy at 1000x magnification, and then thin sections were cut and collected on copper grids for EM. These sections were viewed and imaged using a Phillips CM12 electron microscope. Digital electron micrographs from each mouse genotype were used to examine and quantify myofiber sarcomeres, inclusions, mitochondria, and satellite cells in at least twenty images per mouse.
Data Analysis
Analyses were done using Excel and GraphPad Prism 8. Group means and variances were evaluated statistically by one-way ANOVA and a Newman-Keuls post-hoc test or a Kruskal-Wallis one-way analysis of variance by ranks and a post-hoc Dunn's multiple comparison test. P values of < 0.05 were considered significant.
Photography and Figure Construction
The original images used for figure construction were generated using digital microscopic photography or scanning x-ray films. Digital images from the microscope were captured as TiF files using a SPOT digital camera and SPOT Advanced software (Diagnostic Instruments) or a Nikon digital camera (DXM1200) and ACT-1 software. Images were adjusted for brightness and contrast using Adobe Photoshop software without changing the content and actual result. Figure composition was done using CorelDraw Suite 2019 software with final figures being converted to TiF files. Files of composite figures were adjusted for brightness and contrast in Adobe Photoshop.
Results
Mice With Skeletal Muscle-Restricted Expression of hSOD1 Develop Motor Deficits and Paralysis and Have a Shortened Lifespan
We created and characterized at young ages tg mice expressing wild-type (WT)-, G37R-, and G93A-hSOD1 gene variants only in skeletal muscle (50, 66). These mice express hSOD1 transgene variants at ~ 50–110% of endogenous mouse SOD1 in striated skeletal muscles (50, 66), importantly the diaphragm (Figure 1A). With previous earlier generations of tg mice, we showed that hSOD1 was not in any spinal cord or brain neural cells and other organ systems and tissue types (50, 66). In subsequent later generations, the restricted expression of hSOD1 in skeletal muscle and the absence of hSOD1 in brain and spinal cord is maintained (Supplementary Figure 1). One tissue type was a notable exception. hSOD1 was detected in the heart of one WT-hSOD1 line and one G37R-hSOD1 line at old age (Supplementary Figure 1).
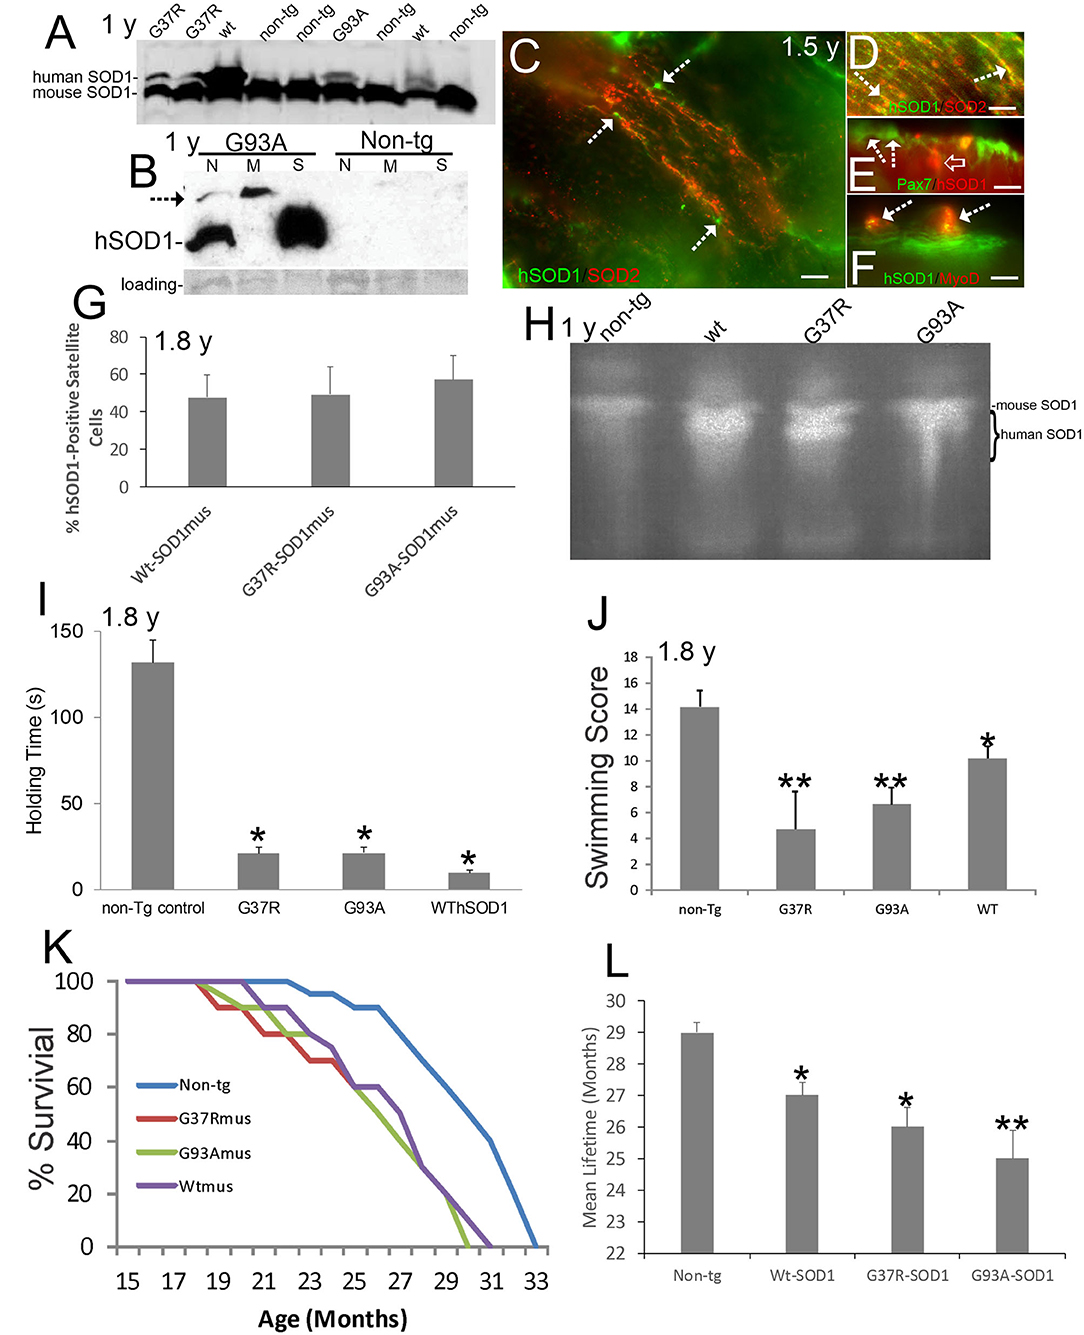
Figure 1. Verification and neurological phenotypes of hSOD1mus mice. Ages are identified on panels where appropriate. (A) Western blot of mouse diaphragm extracts demonstrating the presence of Wt-, G37R-, and G93A-hSOD1 in tg mice but not in non-tg mice. An antibody that detects both mouse and hSOD1 was used. (B) Western blot of leg muscle subcellular fractions with hSOD1-specific antibody showing highest enrichment of monomer hSOD1 in the soluble fraction (S), lesser enrichment in the nuclear fraction (N), and barely detectable to low presence in the mitochondrial fraction. Oligomeric hSOD1 (arrow) was highest in the mitochondrial fraction, lesser in the nuclear fraction, and not seen in the soluble fraction. Extracts for non-tg skeletal muscle were negative for hSOD1. Ponceau staining of membrane shows protein loading. (C) Localization of hSOD1 (green) and mitochondrial marker SOD2 (red) in hSOD1mus mouse myofibers. hSOD1 was localized diffusely throughout myofibers and was found at the myofiber periphery apparently localizing the satellite cells (arrows). Scale bar = 22.5 μm. (D) Some hSOD1 was localized to mitochondria (arrows, yellow). (E,F) hSOD1 was present in satellite cells (E, arrows) and co-localized with skeletal muscle satellite cell markers (E, Pax7, yellow cell) and MyoD (F, arrows). hSOD1 also formed cytoplasmic intramyofiber inclusions (E, open arrow, red). Scale bars = 9 μm. (G) Graph showing the percentages of satellite cell positive for hSOD1 in tg mice. Values are mean ± SD. (H) Enzymatic activity gel for SOD showing the functional activity of hSOD1 in tg mouse skeletal muscle. (I) Muscle strength holding time test showed marked weakness in hSOD1mus mice (*p < 0.001). (J) Swimming testing showed significant deficit (*p < 0.05) in Wt-hSOD1mus mice and greater deficit (**p < 0.01) in G37R- and G93A-hSOD1mus mice. (K) Kaplan-Meier curves showing the survival of non-tg mice and hSOD1mus mice. (L) Graph of mean (± SD) lifespan of non-tg and hSOD1mus mice (*p < 0.05; **p < 0.01).
Subcellular fractions of skeletal muscle revealed hSOD1 in the soluble protein compartment (Figure 1B), as anticipated (8), and in nuclear and mitochondrial-enriched compartments (Figure 1B). In the mitochondrial-enriched fraction of ~15-month-old mice, hSOD1 was mostly present in an oligomer form (Figure 1B, arrow). hSOD1 was found as monomer and oligomer in the nuclear compartment (Figure 1B) as was seen in 8–12-month-old mice (72). Subcellular fractions of non-tg mouse skeletal muscle had no detectable bands of any size, demonstrating the transgenic state of the hSOD1mus mice and specificity of the antibody for detecting hSOD1 as monomers and oligomers.
Immunofluorescence for hSOD1 in tg mouse skeletal muscle revealed hSOD1 in the myofiber cytoplasm as diffuse and particulate immunoreactivities (Figure 1C). Within myofiber cytoplasm, hSOD1 had partial colocalization with mitochondrial marker SOD2 (Figure 1D), consistent with the presence of hSOD1 in the mitochondrial fraction determined by western blotting (Figure 1B). Some hSOD1 immunoreactivity was visualized as large apparent inclusions (Figure 1E). hSOD1 also was present in apparent satellite cells (Figure 1C). This was confirmed by hSOD1 colocalization with satellite cell markers (65) Pax7 (Figure 1E) and MyoD (Figure 1F). hSOD1 was present in ~ 50% of skeletal muscle satellite cells in all tg mouse lines (Figure 1G). SOD activity gels demonstrated protein functional enzyme activity in skeletal muscle above that of mouse SOD1 in all hSOD1 tg variants (Figure 1H).
Our previous work on the anatomical and histological pathology of our hSOD1mus tg mice focused on subjects at 1.0–1.5 years of age (50, 66). Here, we study these mice at mostly 1.5 years of age to end of life. As expected for longitudinal studies of mouse aging, various cancers were seen in older hSOD1mus tg and non-tg mouse cohorts, but mice with confounding co-morbidities were excluded from this analysis. No histopathological studies are reported here on the identities of these cancers. Mice that were studied here were cancer-free, defined as no overt enlargement, malformation, discoloration, liquefaction, and hardening of any organ, including thymus and lymphoid tissues, spleen, lung, liver, gut, mesenteries, kidney, connective tissues, ovary, and testes.
hSOD1mus mice at 1.5–1.8 years showed significant (p < 0.001) deficits in motor function detected in the holding/hanging test (Figure 1I) and significant (p < 0.01) deficits in a swimming test (Figure 1J). Earlier generations of younger mice also showed deficits on the holding/hanging tests and on running tests (50). Aging affected mice showed progressive limb weakness and paresis with motor deficits, paralysis, and shortened lifespan (Figure 1K; Supplementary Video 1). All hSOD1mus tg mice became clinical with weakness and limb paresis; however, the paralysis phenotype was not fully penetrant, consistent with some human ALS patient cohorts (73). About 37% of mice became fully paralyzed between 1.5 years to end of life (Figure 1K and Supplementary Video 1). In all tg lines, lifespan was significantly (p < 0.05 or 0.01) shortened 10–16% (Figure 1L).
The Skeletal Muscle System in hSOD1mus tg Mice Develops Prominent Disease in Late Life
hSOD1mus tg mice at 1 year of age showed subtle skeletal muscle atrophy, myofiber loss, and histochemical changes in ATPase and cytochrome c oxidase (50). At 2.0–2.25 years of age the body skeletal musculature appeared wasted in hSOD1mus tg mice (Figures 2A,C,E). Hindlegs were grossly atrophied and reduced in mass compared to old age-matched non-tg littermate mice (Figure 2B). G93A-hSOD1mus mice were the most severely affected hSOD1mus tg mice (Figure 2B) but were not as affected as the non-conditional G93A-hSOD1high tg mouse line (Figure 2B). All major leg muscle groups were affected (Figure 2B). The ribcages of all hSOD1mus tg mouse lines were grossly atrophic and showed reductions in low thorax circumference measured at the xiphoid process (Figures 2C,D). The isolated diaphragms of hSOD1mus tg mice had reduced mass at mid-stage to end-stage disease (Figure 2E), and striated muscle flanks of the diaphragm were replaced by expansion of non-myofiber central tendon (Figure 2F).
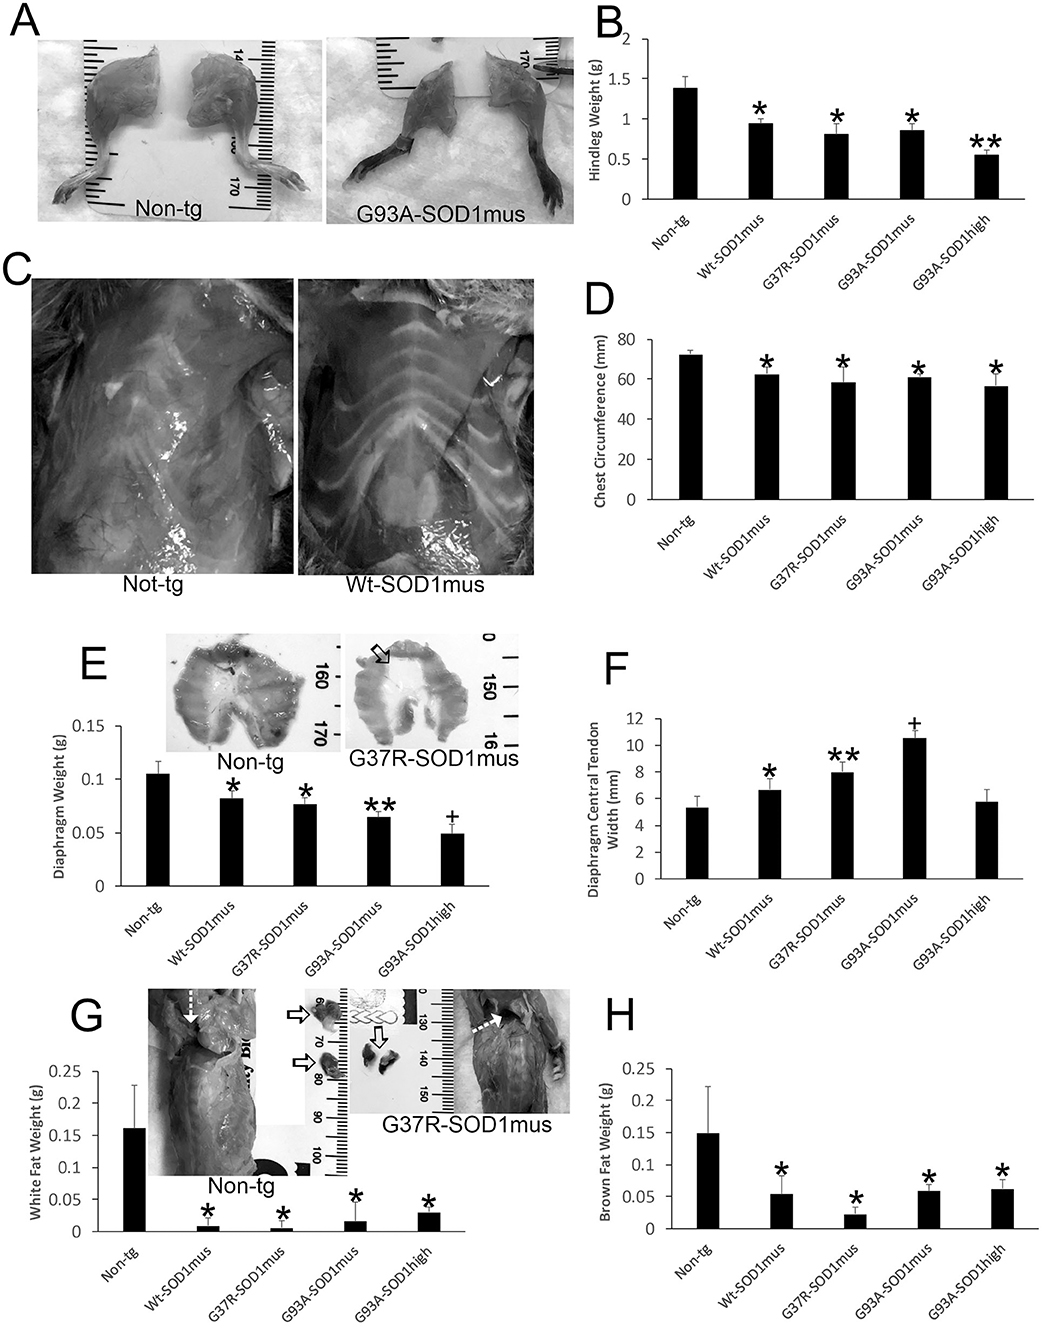
Figure 2. Gross anatomical pathology of hSOD1mus mice. (A) Hindlegs of non-tg mice and hSOD1mus mice showing the gross atrophy of the latter. (B) Graph of hindleg weights (mean ± SD) in age-matched non-tg mice and hSOD1mus mice. Non-age-matched G93A-hSOD1high expressing mice (74) were used as a comparator (*p < 0.01; **p < 0.001). (C) Ventral view of the thorax of age-matched non-tg and hSOD1mus mice showing pectoral and intercostal muscle wasting. (D) Graph of chest circumference (mean ± SD) in age-matched non-tg mice and hSOD1mus mice *p < 0.05. (E) Isolated diaphragms of non-tg mice and hSOD1mus mice showing the gross atrophy and graph of diaphragm weights. Non-age-matched hSOD1-G93Ahigh expressing mice were used as a comparator (*p < 0.05; **p < 0.01; +p < 0.005). (F) Graph of diaphragm central tendon widths (mean ± SD) in age-matched non-tg mice and hSOD1mus mice (*p < 0.05; **p < 0.01; +p < 0.005). (G,H) Images showing the backs of non-tg and hSOD1mus mice. Hatched arrows identify interscapular regions. Isolated interscapular white adipose tissue (WAT) and brown adipose tissue (BAT) of non-tg mice (left, open arrows) and hSOD1mus mice (right, open arrows) showing the gross atrophy and graphs of weights. WAT (G) was significantly depleted in all lines (*p < 0.001). BAT was significantly depleted in all lines (*p < 0001).
The Adipose System in hSOD1mus tg Mice Is Abnormal
In our previous studies (50, 66), we did not work on the body adipose system. However, full necropsies of our mice were done during later disease. During the gross pathological examinations of hSOD1mus tg mice and age-match non-tg mice, differences in body fat distributions were observed. Both white adipose tissue (WAT) and brown adipose tissue (BAT) appeared attritional in tg mice compared to non-tg mice. WAT appeared depleted in many areas throughout the body of old hSOD1mus tg mice at end-stage disease, including the legs, thorax, and back (Figure 2G). The back was particularly noteworthy for the loss of interscapular WAT mass (Figure 2G). While examining interscapular WAT deposits, the deeper BAT was found overtly attritional with loss of mass in hSOD1mus tg mice (Figure 2H).
Skeletal Myofiber Degeneration, Mitochondriopathy, and Satellite Cell Apoptosis Are Significant in hSOD1mus tg Mice
We used plastic sections (0.5 μm thick) and EM to directly identify skeletal muscle degeneration in hSOD1mus tg mice (Figure 3). Inclusion formation, sarcomere singularities, mitochondriopathy, and satellite cell apoptosis were prominent phenotypes of these tg mice seen at higher resolution. Intramyofibrillar inclusions seen in longitudinal profile were up to 100 μm in length (Figure 3A). In cross-sectional profile, intramyofibrillar inclusions were 5–20 μm in width and seen as clusters (Figure 3B). EM revealed that these inclusions were crystalline lattices with elementary units arrayed as groupings in different planes (Figures 3C,D). Another prominent aspect of disease in hSOD1mus tg mice was damage to individual sarcomeres extending from Z-band to Z-band (Figures 3E–H). Sarcomeres appeared swollen with banding disruption and tubule dilation and vesiculation in H zones (Figure 3F) and Z-bands (Figure 3H). This pathology was found in all hSOD1mus tg mouse genotypes (Figure 3G) but was negligible in non-tg age-matched control mice (Figure 3G). In previous work, we found that subsarcolemmal mitochondrial numbers were lower in all three genotypes of hSOD1mus tg mice at 15 months of age (66). Here, we show that disease also manifests in skeletal muscle as mitochondriopathy seen as mitochondrial vesiculation (Figures 3I,J) and swelling (Figures 3K,M). Lastly, satellite cell apoptosis was significant in all hSOD1mus tg mouse genotypes (Figures 3K,L).
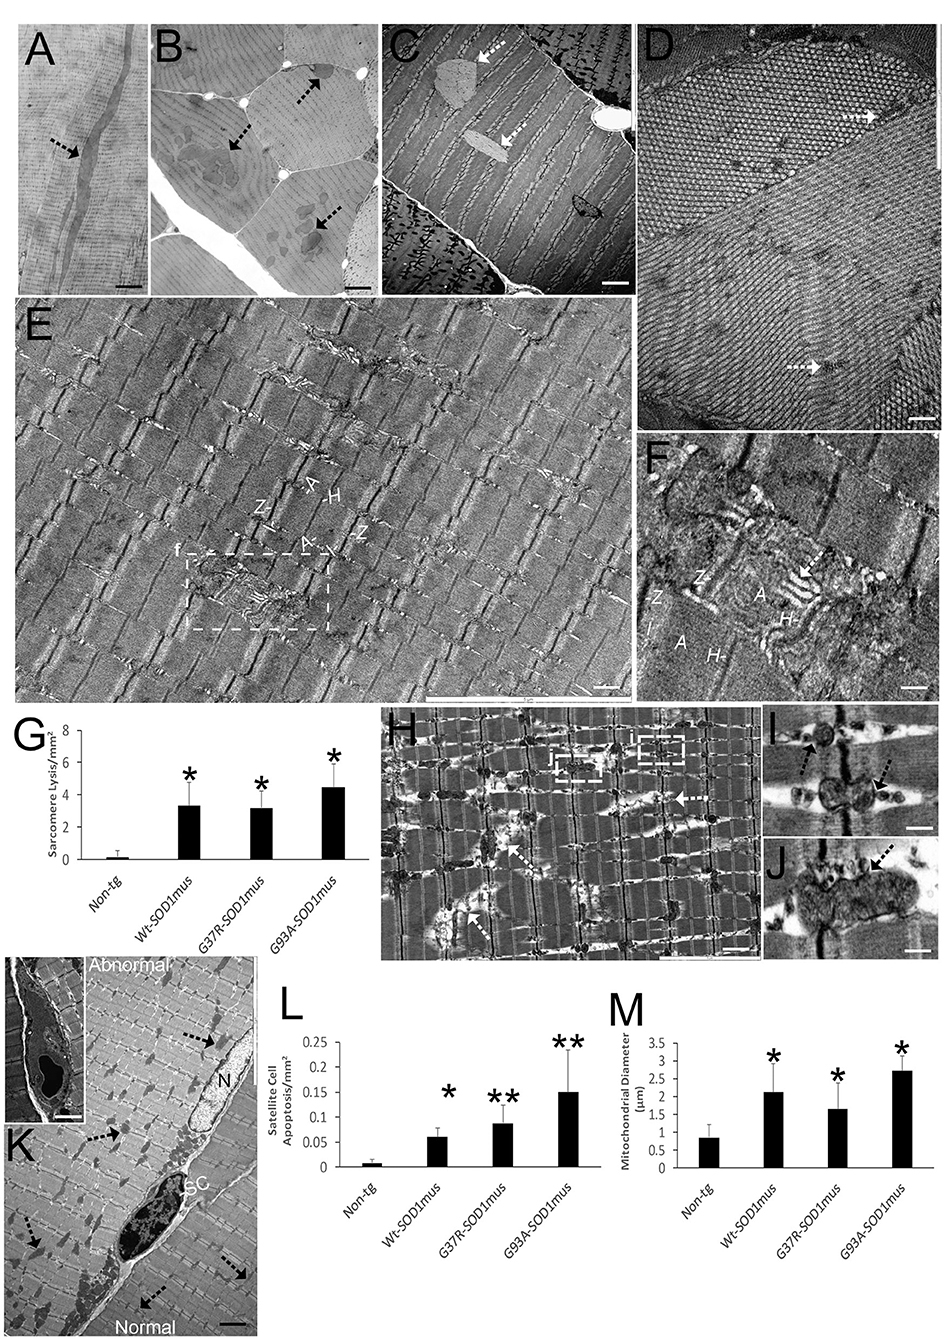
Figure 3. EM shows that skeletal muscle of hSOD1mus mice develops myofiber inclusions, sarcomere degeneration, mitochondriopathy, and satellite cell apoptosis. (A,B) Plastic sections (0.5 μm thick) showing intramyofibrillar inclusions (arrows) in longitudinal (A) and cross-section (B) profiles. Scale bars = 225 μm (A) and 75 μm (B). (C) Electron micrograph of hSOD1mus mouse with two intramyofiber inclusions (arrows). Scale bar = 4.5 μm. (D) Electron micrograph of myofiber showing the crystalline-like arrays containing islands of cytoplasm (arrows). Scale bar = 2.25 μm. (E) Low magnification micrograph of a myofiber showing the sarcomere arrangement with distinguishing Z-bands, I-bands, A-bands, and H zones. Box of injured sarcomere is shown in (F). Scale bar = 3 μm. (F) Early individualized sarcomere destruction is typified by dissolution of clear band patterns and sarcoplasmic reticulum cistern swelling (white arrow). Scale bar = 0.5 μm. (G) Graph of swollen/lytic sarcomeres (mean ± SD) in gastrocnemius of age-matched non-tg mice and hSOD1mus mice (*p < 0.01). (H) Electron micrograph of many sarcomeres with advanced lysis (arrows) and mitochondriopathy (boxes shown in I and J). Scale bar = 2.25 μm. (I,J) Z-band mitochondria vesiculation (arrows). Scale bar = 0.4 μm. (K) Satellite cell (SC) nascent apoptosis as suggested by the chromatin clumping and nuclear envelop margination. A normal myonucleus is nearby (N). The myofiber on left has florid mitochondrial swelling (arrows), while the myofiber on right has normal appearing mitochondria (arrows). Inset shows a fully apoptotic SC. Scale bar = 11 μm (inset, 4.5 μm). (L) Satellite cell apoptosis (mean ± SD) in gastrocnemius of age-matched non-tg mice and hSOD1mus mice (*p < 0.05; **p < 0.01). (M) swollen mitochondria (seen as mitochondrial diameters) (mean ± SD) in gastrocnemius of age-matched non-tg mice and hSOD1mus mice (*p < 0.01).
We examined the histological and biochemical pathology of skeletal muscles in hSOD1mus tg mice and age-matched non-tg mice. Previously, we qualitatively reported on myofiber cell death detected by TUNEL in 12-month-old mice (50). Here, we show in greater depth the TUNEL identified cell death of individual myofibers and satellite cells of hSOD1mus tg mice (Figure 4A). TUNEL thus corroborated the EM findings (Figures 3K,L). The accumulation of TUNEL-positive nuclei in diaphragm was age-dependent (Figure 4B). While TUNEL detects DNA double-strand breaks (75), we used the alkaline comet assay to detect DNA-SSBs. DNA damage accumulation determined by comet assay was not part our previous work (50, 66). Florid DNA-SSBs accumulated in skeletal muscle as seen by comet profiles in hSOD1mus tg mice but not in age-matched controls (Figures 4C,D). The accumulation of nuclei in diaphragm with DNA-SSBs was age-dependent (Figure 4E). DNA-SSBs are potent inducers of p53 activation (76). Western blotting of skeletal muscle extracts identified significant increases in the levels of phosphorylated p53 (Figures 4F,G). These changes in DNA damage were antedated by high molecular weight aggregation of the complex IV enzyme cytochrome c oxidase subunit I (Figures 4H,I) in hSOD1mus tg mice at non-symptomatic and early symptomatic disease compared to age-matched non-tg control littermate mice. Catalase enzyme activity in skeletal muscle was similar in age-matched non-tg mice and hSOD1mus tg mice (data not shown).
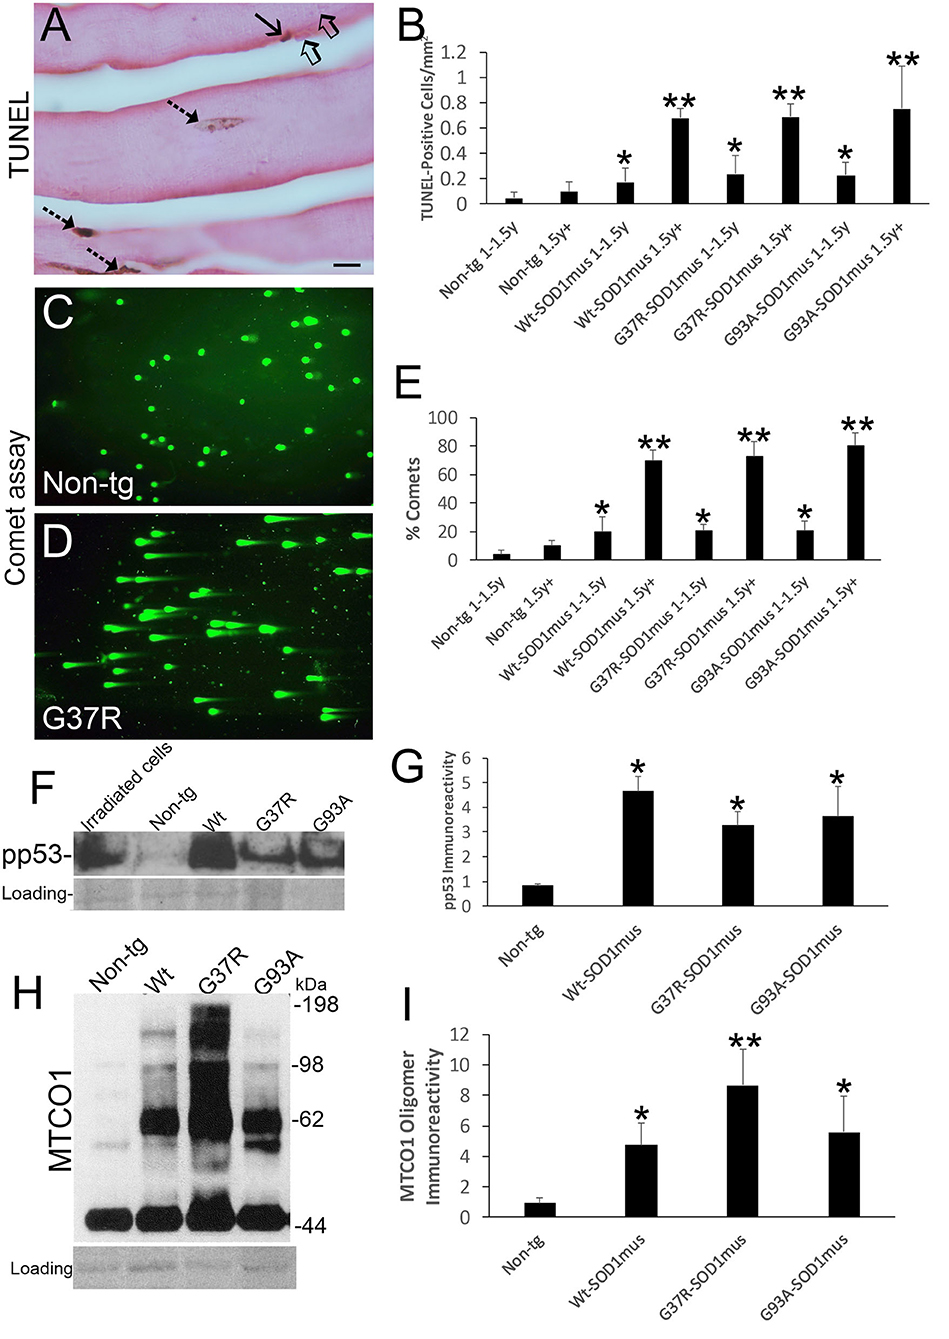
Figure 4. DNA damage, p53 activation, and mitochondrial complex IV proteinopathy occur in skeletal muscle of hSOD1mus mice. (A) TUNEL visualized DNA-DSB accumulation in myonuclei (hatched arrows) and a putative satellite cell (solid arrow). Unlabeled nuclei are present (open arrows). Scale bar = 15 μm. (B) TUNEL positive nucleus accumulation in skeletal muscle is age-related in hSOD1mus mice (mean ± SD, *p < 0.05; **p < 0.001). (C,D) Alkaline comet assay shows marked age-related accumulation of DNA-SSBs (SYBR green comets) in hSOD1mus mice compared to non-tg age-matched controls. (E) Graph showing the age-related accumulation of nuclei with DNA-SSBs (mean ± SD, *p < 0.05; **p < 0.01). (F,G) Western blotting shows prominent p53 activation in skeletal muscle of hSOD1mus mice. (H,I) Western blotting shows prominent accumulation of aggregated mitochondrial cytochrome c oxidase subunit 1 (MTCO1). Ponceau S stained membrane shows protein loading. Graph shows quantification of MTCO1 high molecular species (*p < 0.01, **p < 0.001).
NMJ Pathology Emerges Early During Disease in hSOD1mus tg Mice
We evaluated NMJ integrity using histological and biochemical approaches. The diaphragm of hSOD1mus tg mice at different stages of disease and age-matched non-tg mice was examined using motor endplate visualization with BTX and motor neuron axon innervation of the endplate by neurofilament immunofluorescence and genetic expression of eGFP (Figures 5A–C). Previously we evaluated endplate occupancy at 12 months of age and found a reduction in G37R-hSOD1mus mice (50). Here we confirm this finding and further show this NMJ abnormality in older mice of all our hSOD1mus lines. Significant unoccupancy of motor endplates was observed beginning around 1–1.5 years of age in G37R-, G93A-, and WT-hSOD1mus tg mouse genotypes (Figure 5D), and denervation was progressive through older ages (Figure 5D). hSOD1 immunoreactivity was detected at ~50% of motor endplates (Figures 5E,F), and, unlike the diffuse cytoplasmic labeling seen within myofibers, hSOD1 at motor endplates appeared aggregated (Figure 5E). Western blotting of skeletal muscle extracts detected significant loss of presynaptic marker synaptophysin (Figure 5G). Immunoprecipitation of skeletal muscle synaptophysin followed by 3-nitrotyrosine western blotting identified nitrated synaptophysin accumulation in hSOD1mus tg mice but not in age-matched non-tg mice (Figure 5H). Skeletal muscle calcineurin and rapsyn did not show increased nitration in hSOD1mus tg mice (data not shown).
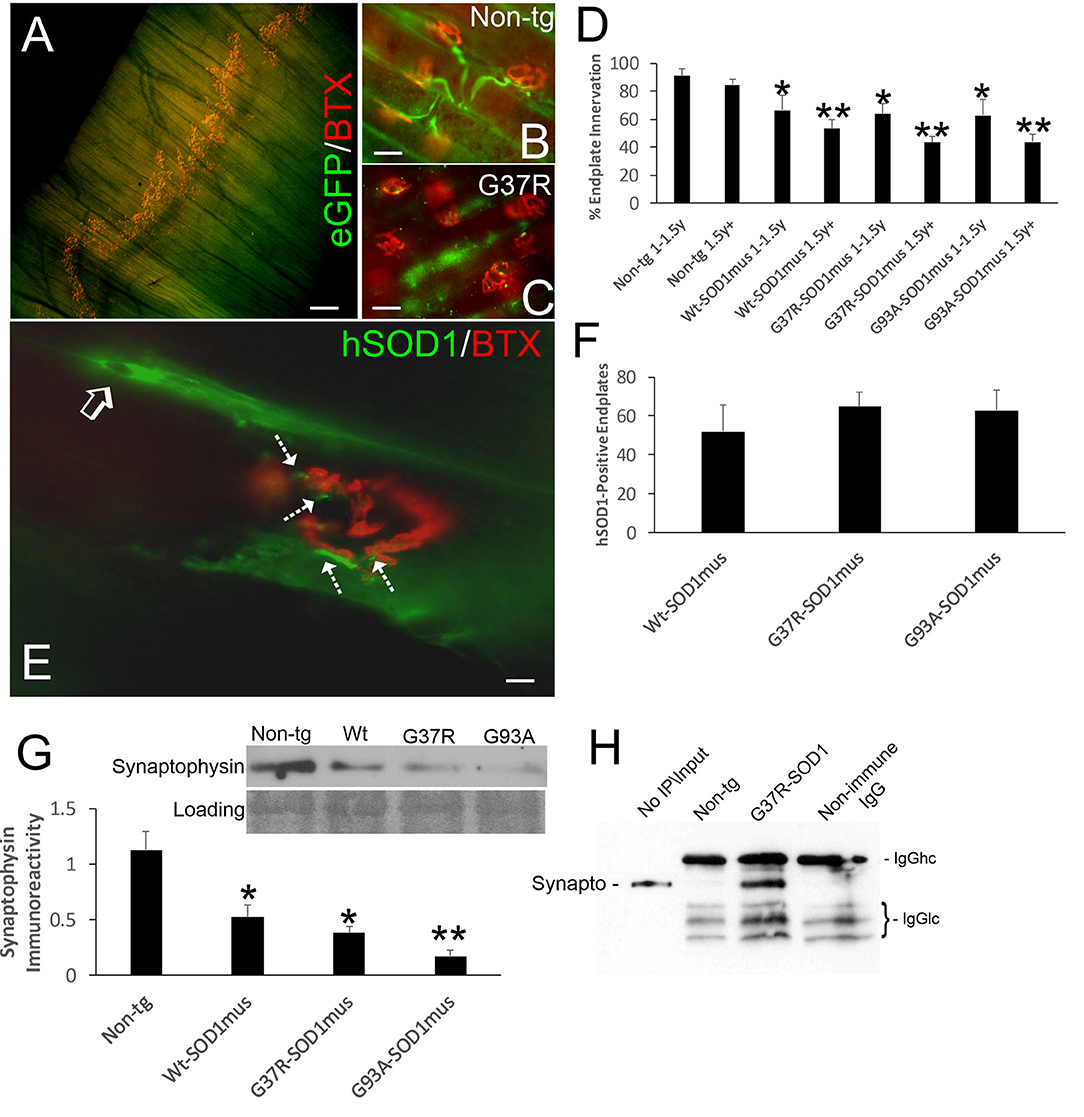
Figure 5. Structural and molecular pathology occur at the NMJ in skeletal muscle of hSOD1mus mice. (A) Whole mount of a mouse diaphragm showing the distribution pattern of NMJ/motor endplates (red, α-bungarotoxin, BTX). Scale bar = 18 μm. (B) Motor endplate (red, BTX) innervation by ventral horn motor neuron axons (green, Hb9-egfp) in non-tg mouse diaphragm. Scale bar = 30 μm. (C) Motor endplate denervation and axonopathy (swollen dystrophic axons, green) in hSOD1mus mouse diaphragm. Scale bar = 30 μm. (D) Graph showing the age-related loss of diaphragm motor endplate innervation (mean ± SD, *p < 0.05; **p < 0.01). (E) hSOD1 aggregates (arrows, green) near motor endplates. (F) About 50% of motor endplates are associated with hSOD1 aggregates by midlife in hSOD1mus mouse diaphragm. Scale bar = 9 μm. (G) Western blotting revealed a loss of presynaptic terminal synaptophysin in hSOD1mus mouse diaphragm. Ponceau S stained membrane shows protein loading. (H) Immunoprecipitation of synaptophysin in diaphragm extract followed by western blotting for 3-nitrotyrosine shows increased nitration of synaptophysin in hSOD1mus mouse but comparatively sparse in age-matched non-tg mice.
Because NMJ presynaptic anomalies were observed in hSOD1mus tg mice, and hSOD1 was detected at motor endplates (Figure 5E), we examined NMJ postsynaptic components (Figure 6). Loss of postsynaptic NMJ marker nicotinic acetylcholine receptor (nAchR) (Figure 6A) was detected within 12–15 months of age in hSOD1mus tg mice compared to age-matched non-tg mice. Loss of NMJ scaffold protein rapsyn (Figure 6B) was seen in the diaphragm (Figure 6B) and hindleg muscles (Figure 6C) in hSOD1mus tg mice at the same age. Co-immunoprecipitation identified that hSOD1 interacts with rapsyn (Figure 6D), consistent with the visualization of hSOD1 at motor endplates and its apparent aggregation (Figure 5E).
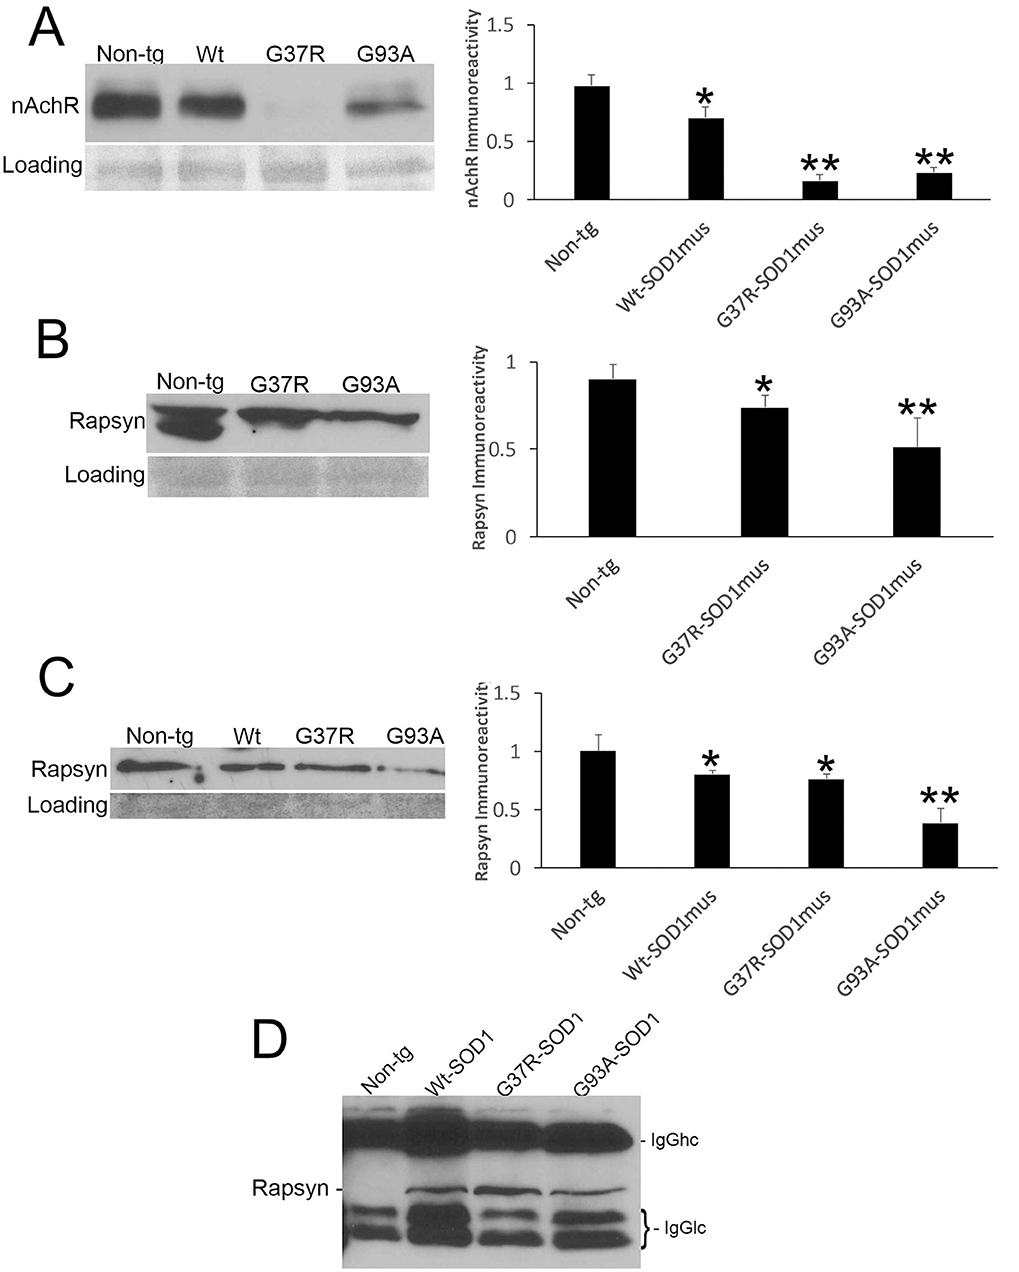
Figure 6. Molecular pathology is prominent at the postsynaptic compartment of the NMJ of hSOD1mus mice. (A) Western blotting showed depletion of nicotinic acetylcholine receptor (nAchR) in hindleg skeletal muscle of WT, G37R, and G93A mutant mice (mean ± SD, p < 0.05; **p < 0.01). Ponceau S stained membrane shows protein loading. (B) Scaffold protein rapsyn in diaphragm of G37R and G93A mutant mice (mean ± SD, p < 0.05; **p < 0.01). Ponceau S stained membrane shows protein loading. (C) Western blotting showed depletion of the scaffold protein rapsyn in hindleg skeletal muscle of WT, G37R, and G93A mutant mice (mean ± SD, *p < 0.05; **p < 0.01). Ponceau S stained membrane shows protein loading. (D) Immunoprecipitation of hSOD1 in hindleg skeletal muscle extracts followed by western blotting for rapsyn showed co-precipitation of hSOD1 and rapsyn in tg mice.
NO Signaling Is Upregulated in Skeletal Muscle of hSOD1mus tg Mice
Western blotting detected significant increases in the levels of NOS1 and NOS2 in skeletal muscle extracts of hSOD1mus tg mice at 12–15 months of age compared to age-matched non-tg mice (Figures 7A–C). All hSOD1 variants showed an upregulation (Figures 7B,C). In situ assessments of NO production by injections of DAA into skeletal muscle and thorax of live mice followed by a 24 h survival revealed increased NO production in the gastrocnemius and diaphragm of hSOD1 mice compared to age-matched non-tg mice (Figures 7D,E). To confirm this in vivo result, we fingerprinted peroxynitrite production by western blotting for protein nitration. Protein nitration in soluble protein and mitochondrion-enriched fractions was increased in WT-, G37R-, and G93A-hSOD1mus tg mice between 12 and 15 months of age compared to age-matched non-tg mice (Figures 7F–H).
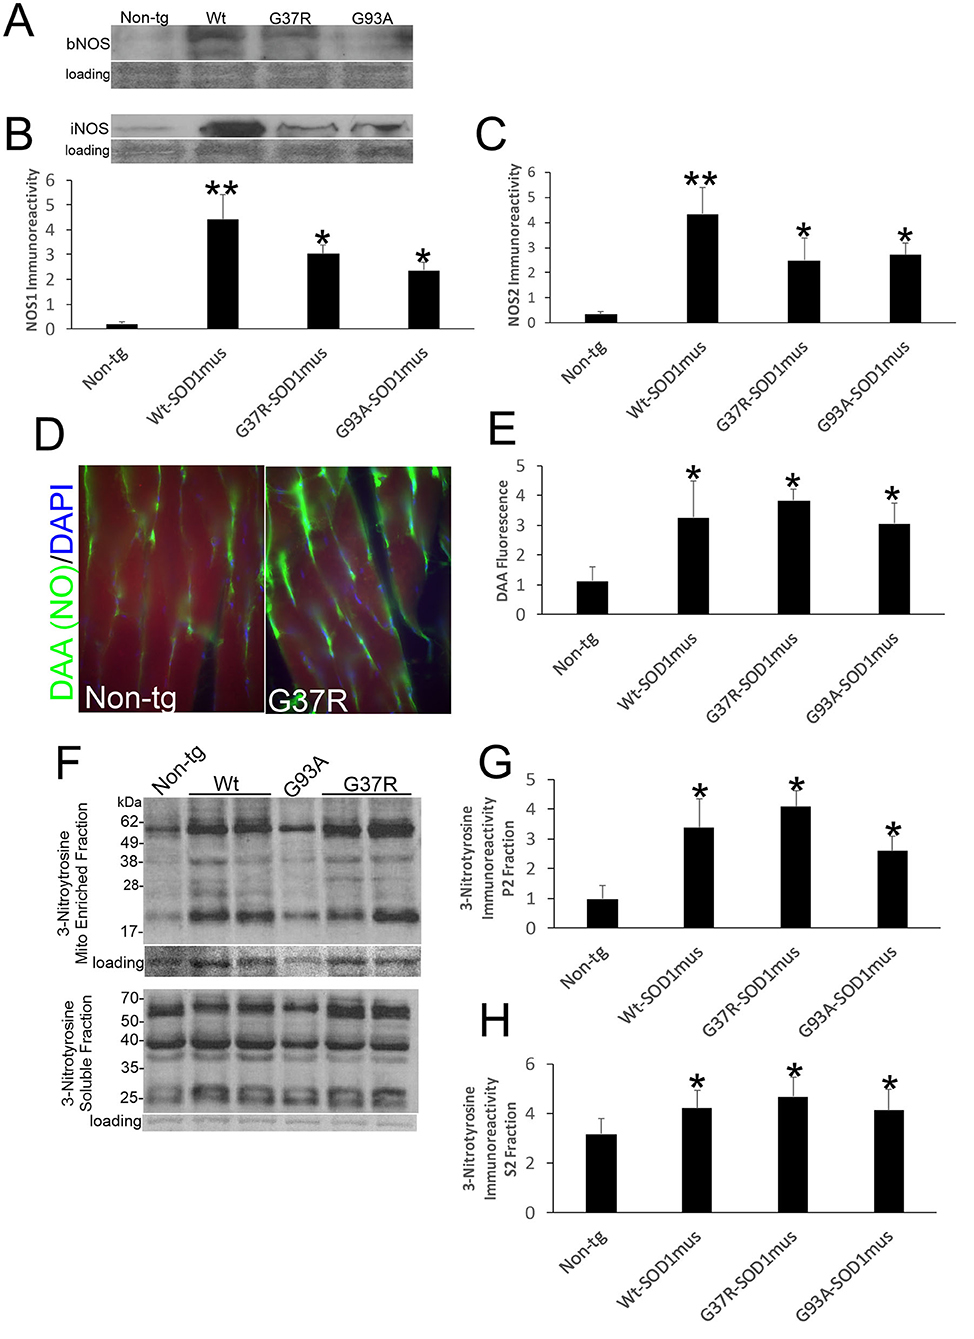
Figure 7. Nitric oxide signaling is upregulated in skeletal muscle of hSOD1mus mice. (A,B) Western blotting showed upregulation of NOS1 (bNOS) and NOS2 (iNOS) in hindleg of hSOD1mus mice. Ponceau S stained membrane shows protein loading. (B) Graph for NOS1 immunodensity demonstrating significantly elevated levels in Wt, G37R, and G93A tg mice (mean ± SD, *p < 0.01; **p < 0.001). (C) Graph for NOS2 immunodensity demonstrating significantly elevated levels in Wt, G37R, and G93A tg mice (mean ± SD, *p < 0.01, **p < 0.005). (D) In vivo imaging of NO production (green) with DAA injection into gastrocnemius of non-tg and G37R- hSOD1mus mice. Scale bar = 45 μm. (E) Graph demonstrating significantly elevated DAA fluorescence in gastrocnemius sections of Wt, G37R, and G93A tg mice. (F) Western blotting showed increased protein 3-nitrotyrosine immunoreactivity in mitochondrial (Mito)-enriched fractions and in soluble fractions of tg mice. Ponceau S stained membrane shows protein loading. (G,H) Graphs demonstrating significantly elevated protein nitration in the mitochondrial-enriched protein fraction (G) and soluble protein fraction (H). Graphs demonstrating significantly elevated protein nitration in hindleg of Wt, G37R, and G93A tg mice (mean ± SD, *p < 0.05).
hSOD1mus tg Mice Develop ALS-like Pathology in Spinal Cord and MN Loss
Anatomic and microscopic neuropathology was done on the spinal cord of hSOD1mus tg mice and age-matched controls (Figure 8). The spinal cords of hSOD1mus tg mice at end-stage disease showed gross atrophy (Figure 8A), including prominent atrophy of nerve roots and nodulation in the lumbosacral region, and significant loss of total spinal cord (plus conus medullaris) mass (Figure 8B). Histologically, in cresyl violet-stained sections of lumbar spinal cord, counts of large, Nissl-rich, multipolar MNs were reduced 40–50% in each line (Figures 8C–F). Previously in younger mice at 12 months of age we found a lesser loss of MNs in G37R and G93A mice and no significant loss in WT-hSOD1mus mice (50). Thus, the degeneration of MNs in WT-hSOD1mus mice appears slower than in the mutant hSOD1 lines. Subsets of remaining spinal MNs contained nuclear inclusions (Figure 8G) and exhibited different forms of cell body degeneration including apoptotic-like attrition (Figure 8H) and necrotic-like vacuolation of the cell body and dendrites with apparently maintained somal size (Figure 8I) or somal atrophy (Figure 8J).
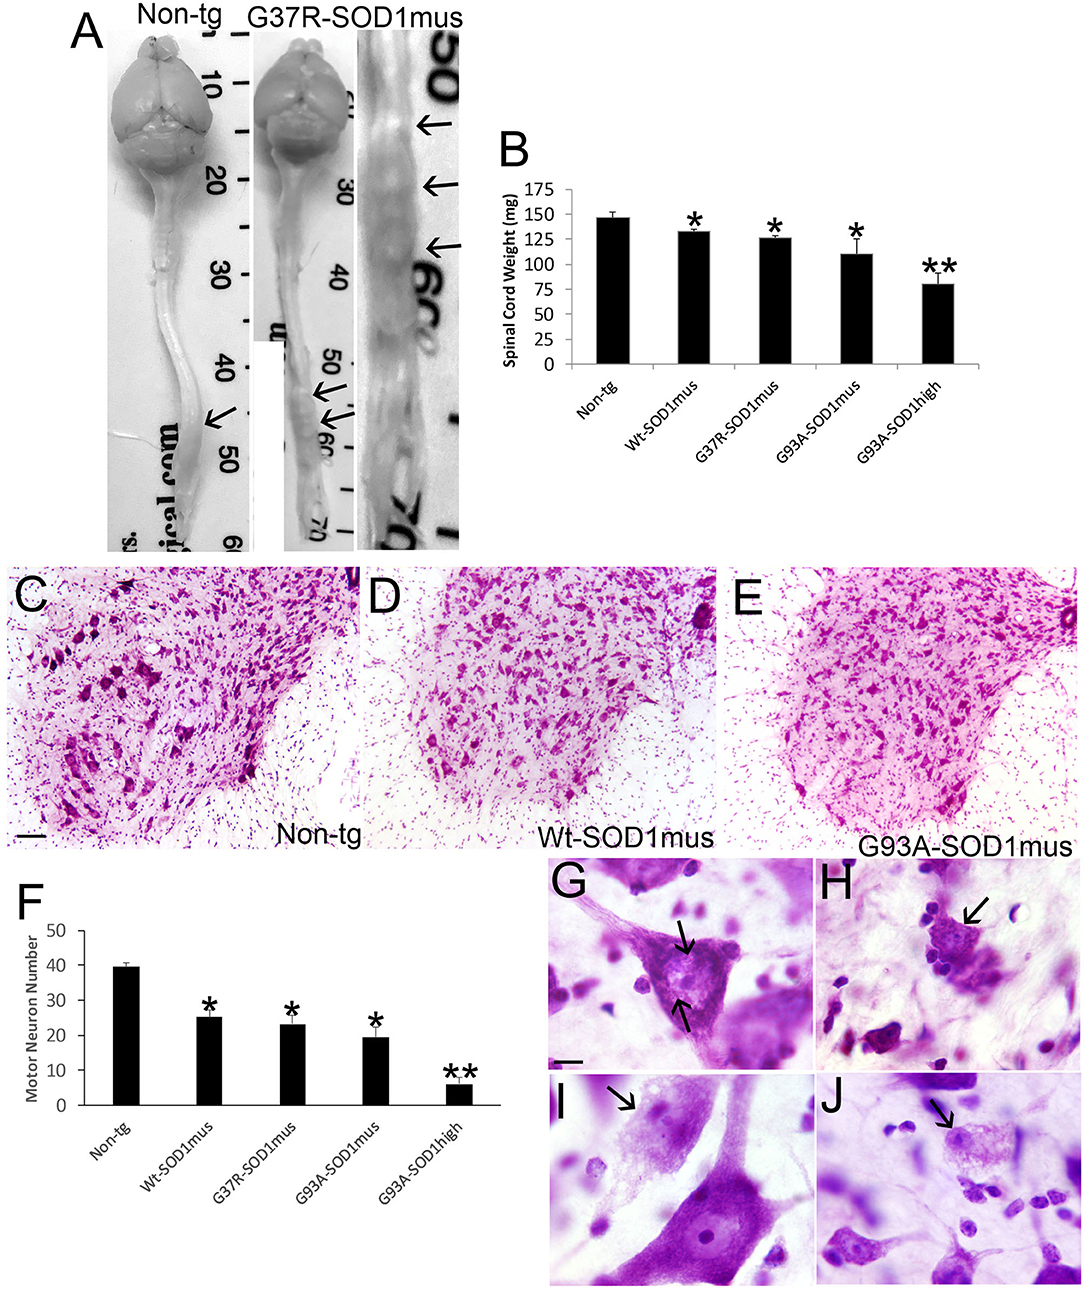
Figure 8. Spinal cord atrophy and motor neuron degeneration occur in hSOD1mus mice. (A) Isolated brain and spinal cord of age-matched non-tg and G37R-hSOD1mus mice. Lumbar spinal cord enlargements are identified (arrows). The non-tg cord is smooth and uniformly tapering. The tg cord is irregular, atrophic, and nodular (right panel). (B) Graph of spinal cord weights (mean ± SD) in age-matched non-tg mice and hSOD1mus mice at endstage disease. Non-age-matched G93A-hSOD1high expressing mice (74) were used as a comparator (*p < 0.01; **p < 0.001). (C–E) Representative examples of Nissl-stained lumbar spinal cord sections of age-matched non-tg and hSOD1mus (Wt and G93A variants) mice showing apparent loss of large motor neurons. Scale bar in C = 10.5 μm [same for (D,E)]. (F) Graph of lumbar spinal cord motor neuron counts at L4-5 (mean ± SD) in age-matched non-tg mice and hSOD1mus mice at endstage disease. Non-age-matched G93A-hSOD1high expressing mice (74) were used as a comparator (*p < 0.01; **p < 0.001). (G,H) Nissl staining showing motor neurons in G37R- hSOD1mus lumbar spinal cord with degenerative features, including small round nuclear inclusions [(G), arrows], apoptotic somal attrition [(H), arrow], cell body cytoplasm vacuolation with somal and nuclear attrition [(I), black arrow], and cell body cytoplasm and dendrite vacuolation [(J), arrow]. Scale bar in G = 7.5 μm [same for (H–J)].
MN loss in WT-, G37R-, and G93A-hSOD1mus tg mice was confirmed with cell death determinations using in situ DNA fragmentation analysis (TUNEL), silver staining, immunostaining for cleaved caspase-3, and western blotting for the cholinergic MN marker ChAT (Figure 9). In spinal cord sections, large ventral horn cells were found to be TUNEL-positive in each mouse line (Figures 9A–C). MNs in hSOD1mus tg mice were also strongly positive for ubiquitin (Figure 9A, inset) compared to age-matched control MNs (Figure 9A, inset). Silver staining identified MNs in tg mice with degenerating apoptotic-like nuclei (Figure 9D) that were not seen in age-matched control spinal cord (Figure 9E). Neuritic abnormalities were also seen in the spinal cord neuropil of tg mice (Figure 9D). MNs with less advanced degeneration showed silver-positive nuclear strands (Figure 9D, inset) that were not seen in the nucleus of control MNs (Figure 9E, inset). MNs positive for cleaved caspase-3 immunoreactivity were present in tg mouse spinal cord (Figures 9F,H) but infrequently in age-matched non-tg mice (Figures 9G,H). Consistent with MN loss seen histologically, ChAT level was reduced significantly in western blots of hSOD1mus tg mouse spinal cord as early as mid-stage disease (Figures 9I,J). Previously we qualitatively described an apparent loss of ChAT in spinal cord by western blotting (50).
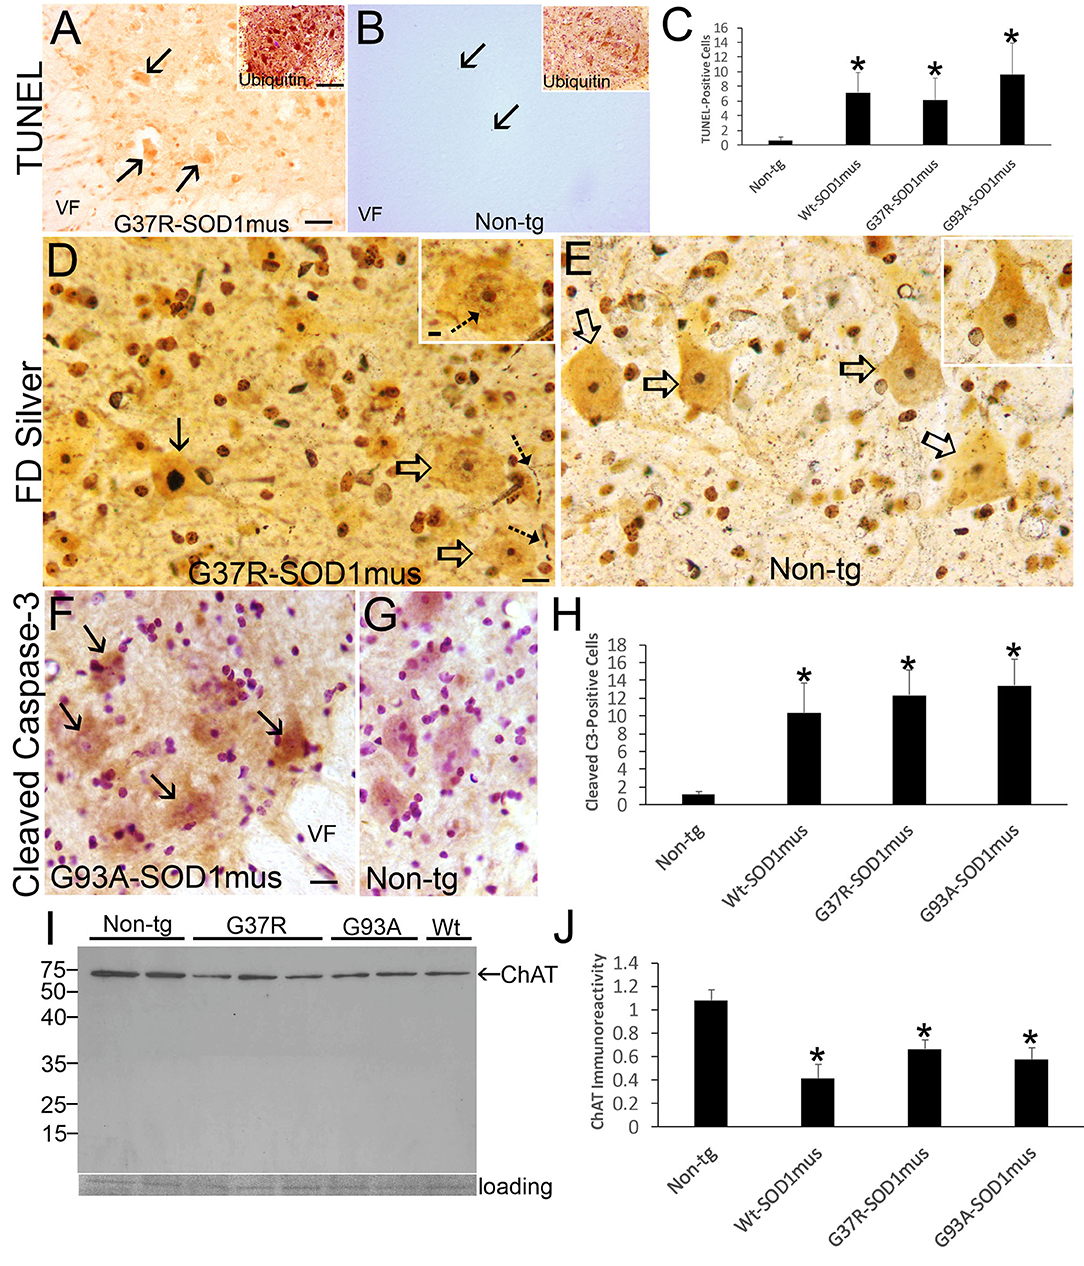
Figure 9. Motor neuron cell death in hSOD1mus mice is an apoptotic-like process. (A) TUNEL visualized DNA-DSB accumulation in nuclei of dying motor neurons (arrows) in G37R-hSOD1mus mouse lumbar spinal cord. Inset shows strong accumulation of ubiquitin in motor neurons. VF, ventral funiculus. Scale bar = 45 μm (same for B); A inset scale bar = 42 μm [same for (B) inset]. (B) Motor neurons in age-matched control mouse lumbar spinal cord were TUNEL-negative. A few TUNEL-positive small cell nuclei were detected (arrows). Inset shows ubiquitin immunoreactivity is less apparent compared to G37R-hSOD1mus mouse [(A), inset]. (C) Graph of lumbar spinal cord TUNEL-positive cells (all sizes) at L4-5 (mean ± SD) in age-matched non-tg mice and hSOD1mus mice at endstage disease (*p < 0.01). (D) FD silver staining identified motor neurons in hSOD1mus mice with apoptotic condensation of the nucleus (black arrow) as distinct from motor neurons with an open nucleus (open arrows), but these latter neurons also had nascent condensation of nuclear chromatin (inset, hatched arrow). Degenerating neurites were also present in the neuropil (hatched arrows). Scale bar in D = 15 μm [same for (E)]; D inset scale bar = 5 μm [same for (E) inset]. (E) In age-matched non-tg mice, motor neuron nuclei were essentially silver negative, except for the nucleolus (open arrows, and inset). (F,G) Immunohistochemistry showed cleaved caspase-3 immunoreactivity enrichment in hSOD1mus mouse motor neurons (F), with accumulation in the nucleus [(F), arrows]. In age-matched control motor neurons, while sometimes showing cytoplasmic cleaved caspase-3, the nucleus was generally unlabeled (G). VF, ventral funiculus. Scale bar in F = 22.5 μm [same for (G)]. (H) Graph of the number of lumbar motor neurons positive for nuclear cleaved caspase-3 in L4-5 (mean ± SD) of age-matched non-tg mice and hSOD1mus mice at endstage disease (*p < 0.001). (I,J) Western blotting for the motor neuron marker ChAT (I) revealed prominent reductions in the levels in hSOD1mus compared to controls [(J), mean ± SD, *p < 0.01].
hSOD1mus tg Mouse Spinal MNs Develop TDP-43 Pathology, Axonopathy, and Mitochondriopathy
TDP-43 pathology was seen in hSOD1mus tg mice but not in age-matched controls (Figure 10). In aged control mouse MNs, TDP-43 immunoreactivity was mostly in the nucleus, while cytoplasmic immunoreactivity was distinctly lower in comparison to the nucleus (Figure 10A), but in tg mouse MNs TDP-43 immunoreactivity was nuclear and, more prominently, cytoplasmic and was seen in the spinal cord neuropil (Figure 10B). hSOD1mus tg mice formed large swollen and dystrophic axons that were prominent in the ventral funiculus near the ventral root exit zones (Figure 10C, inset) and were positive for TDP-43 (Figure 10C, inset). Consistent with axonopathy was the accumulation of chromatolytic MNs seen by Nissl staining and TDP-43 (Figure 10D). In chromatolytic MNs, TDP-43 immunoreactivity was mostly cleared from the cytoplasm (Figure 10D). Perikaryal mitochondria, detected by SOD2 immunostaining, were depleted in hSOD1mus MNs (Figures 10E–G).
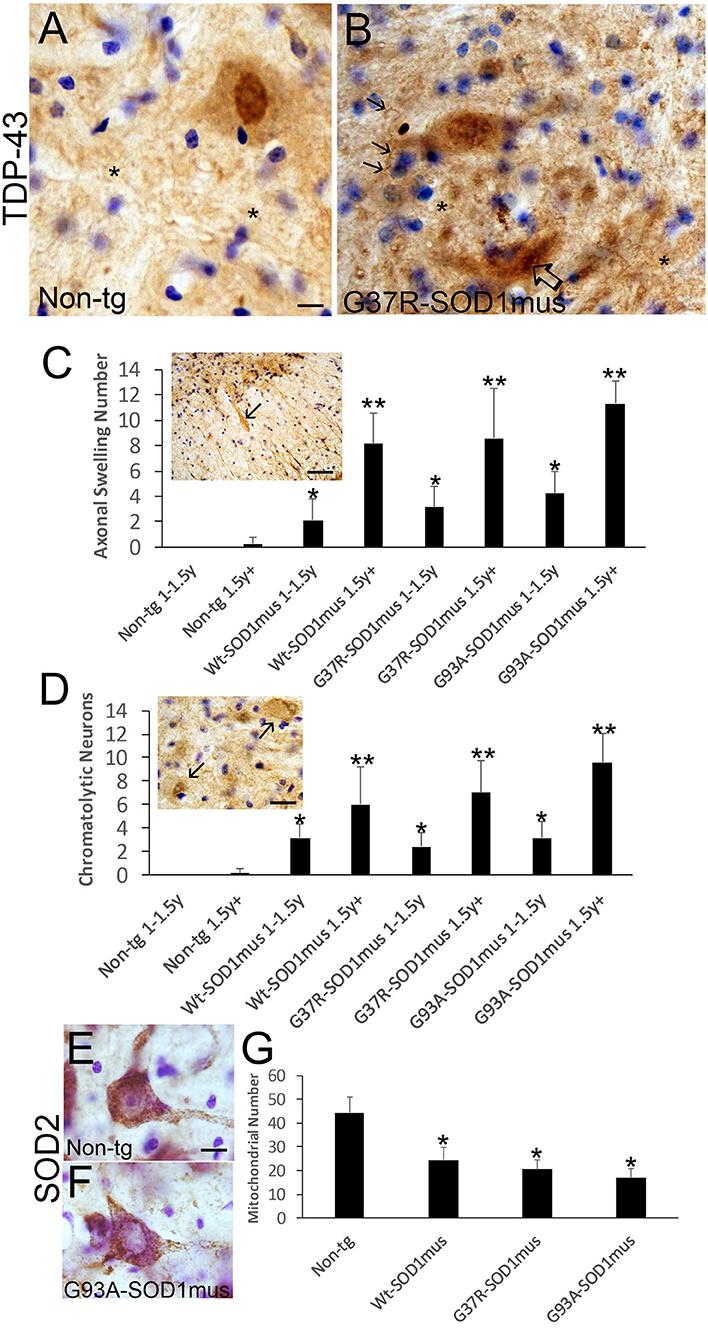
Figure 10. Motor neurons in hSOD1mus mice develop TDP-43 abnormalities, axonopathy, and mitochondrial depletion. (A,B) TDP-43 immunostaining of motor neurons in non-tg (A) and hSOD1mus (B) mice. At about midlife (12 months), in normal motor neurons (A), TDP-43 is highly enriched in the nucleus compared to the cytoplasm, but in hSOD1mus mice (B), the distinction between distributions of TDP-43 immunoreactivity in the nucleus and cytoplasm becomes less obvious, and MNs in mutant mice form TDP-43 inclusions [(B), open arrow]. In mutants, there is also enhanced immunoreactivity for TDP-43 in the neuropil (*) with the presence of neuritic abnormalities [(B), arrows]. Scale bar in A = 7.5 μm [same for (B)]. (C) TDP-43-positive motor neuron axonal swellings develop in aging hSOD1mus mice. Scale bar = 90 μm. Graph showing the age-dependent increase in axonal swellings (arrows) in hSOD1mus mice (mean ± SD, p < 0.05; **p < 0.01). (D) As axonal swellings accumulate, there is an age-related increase in the number of chromatolytic motor neurons seen by TDP-43 staining (arrows). Scale bar = 22.5 μm. (E,F) Mitochondrial SOD2 staining in hSOD1mus mice is characterized by loss of mitochondrial density in the perikaryal-proximal dendrite domains. Scale bar = 15 μm. (G) Graph of mitochondrial number (mean ± SD) age-matched non-tg mice and hSOD1mus motor neuron at endstage disease (*p < 0.01).
hSOD1mus tg Mouse Spinal MN Cell Death Signatures Are Consistent With DNA Damage-Driven Apoptosis
Group VII, VIII, and IX MNs were found in various stages of chromatolysis (Figure 10D) that is typical of axonal injury (Figure 10C) and generally antecedent to retrograde apoptosis of MNs in rodent models (77, 78) and, putatively, in human (79). We found that subsets of ventral horn MNs were immunopositive for phosphorylated p53 (Figures 11A–C), and western blotting identified significant increases in phospho-p53 in spinal cord homogenates of hSOD1mus tg mice compared to age-matched non-tg littermates (Figures 11D,E). Alkaline comet assays on isolated lumbar MNs from mid-stage (1.5 years) and end-stage (2+ years) disease hSOD1mus mice showed significant age-dependent accumulation of DNA-SSBs compared to spinal MNs of non-tg age-matched control mice (Figures 11F–H).
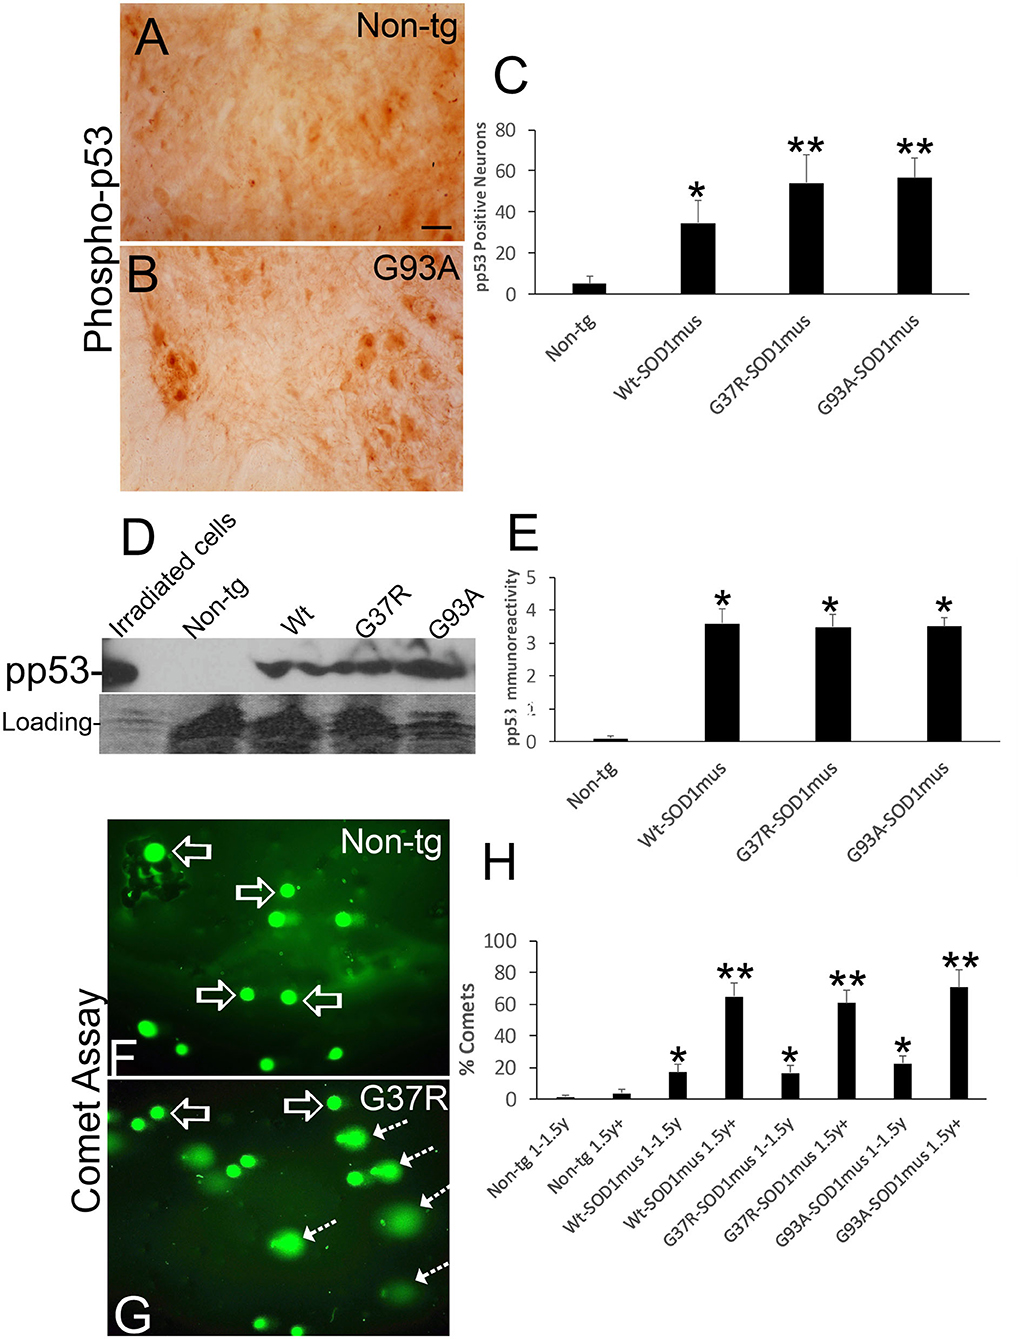
Figure 11. DNA damage and p53 activation occur in motor neurons of hSOD1mus mice. (A,B) Immunohistochemistry showing apparent accumulation of p-p53 positive spinal motor neurons in hSOD1mus mice [(B), arrows] compared to age-matched controls (A). Scale bar in A = 22.5 μm [same for (B)]. (C) Graph of p-p53 positive spinal motor neurons (mean ± SD) in age-matched non-tg mice and hSOD1mus motor neurons at 1.5–2 years of age (*p < 0.01, **p < 0.001). (D) Western blotting showed upregulation of p-p53 in spinal cord of hSOD1mus mice. (E) Graph of p-p53 immmunoreactivity (mean ± SD) in western blots of age-matched non-tg and hSOD1mus spinal cord at midlife (*p < 0.001). (F,G) Alkaline comet assay on isolated spinal motor neurons shows marked presence of DNA-SSBs (SYBR green comets) in hSOD1mus mice compared to non-tg age-matched controls. (H) Graph showing the age-dependent accumulation of motor neurons with nuclear DNA-SSBs (mean ± SD, p < 0.05; **p < 0.01).
Discussion
Previously we have shown that skeletal muscle-restricted expression of hSOD1 can cause MN degeneration (50), but this earlier study was not a longitudinal aging study of clinical and pathological outcomes. Here, we extend our studies of mechanisms of ALS with the major finding that restricted expression of WT and mutant (G37R, G93A) hSOD1 in skeletal musculature is enough to cause an age-related ALS-like phenotype in older mice. The disease phenotype included a plethora of clinical, anatomic pathology and histopathological, and biochemical features. Clinically, mice developed deficits in motor function, some developed fulminant paralysis, and lifespan was shortened compared to non-tg mice. The anatomic pathology was wasting of the somatic musculature, including the diaphragm, attrition of adipose tissue, and spinal cord atrophy. Histopathologically, these mice had myofiber and satellite cell degeneration, myofiber inclusions, mitochondriopathy, and loss of diaphragm motor innervation; furthermore, in spinal cord, MNs were depleted, formed cytoplasmic and nuclear inclusions and TDP-43 pathology, accumulated cleaved caspase-3, and exhibited florid axonopathy. Biochemically, skeletal muscles had an upregulation of NOS isoforms and enhanced NO production; molecular dismantling of the NMJ, including presynaptic and postsynaptic pathology; skeletal muscle nuclei accumulated DNA-SSBs; and activated p53. Similarly, in spinal cord, MNs accumulated DNA-SSBs and activated p53. This work shows that hSOD1 in skeletal muscle is a driver of disease in mouse ALS and identifies a non-autonomous mechanism for MN degeneration explaining their selective vulnerability as likely being a form of target deprivation-induced retrograde neurodegeneration.
These hSOD1mus tg mice thus develop a robust disease phenotype of neurologic, anatomic, and histopathologic abnormalities reminiscent of human ALS (1). Importantly, they develop older-age fatal disease that includes paralysis, wasting of the somatic skeletal musculature, and MN degeneration. hSOD1mus tg mice could be a physiologically more relevant small animal model of ALS than other hSOD1 tg mouse models reported to date when considering their low hSOD1 transgene copy number (50), clinical course, and pathology. Other tg hSOD1 mice with lifespans longer than the most commonly used G93Ahigh copy number mouse (74) are G37R mice (72, 80), but these mice cannot be used to identify CNS vs. skeletal muscle disease causality because both tissues express the mutant hSOD1 transgene. The prolonged disease course in our mice could be related to the level of restricted expression of hSOD1 in different skeletal muscle groups which might be insufficient to drive rapid onset and clinical course of disease. However, we suspect that the level of hSOD1 expression in diaphragm is a critical determinant of lifespan because we have seen some hSOD1mus tg mice become moribund with possible respiratory problems and die at 1.0–1.5 years of age without overt wasting of skeletal musculature and adipose tissue or other forms of overt disease. Leaky promoter effects in heart in some tg hSOD1mus lines is also a consideration. A possible respiratory phenotype in our mice is interesting because some human ALS cases have respiratory onset disease (4). Another possibility is that the endogenous satellite cell-driven regenerative capacity of skeletal muscle is enough to prolong the disease course in our mice, despite the presence of hSOD1 in satellite cells, and thus making aging a critical risk factor for disease onset because reserve and resiliency is depleted. These effects in our mice would be relevant physiologically to human ALS with an onset age range of 47–52 years for fALS and 58–63 years for sporadic ALS (1, 4).
Thus, disease in skeletal muscle could be a pathologic trigger in ALS as suggested by others (81). In tg non-conditional G93A-hSOD1 mice, muscle hypertrophy induced by muscle-specific expression of IGF-1 conveys significant extension of life (49), and muscle IGF-1 variant attenuates the pathology in spinal cord (82). We find that WT and mutant (G37R and G93A) hSOD1 is toxic to skeletal muscle cells in vivo. The precise toxic mechanisms are still uncertain. Our EM work showed the formation of large intramyofibrillar crystalline-like inclusions very similar to those found in inclusion body disease (83). We also identified in these mice individualized sarcomere-scale destruction with sentinel events occurring in the sarcoplasmic reticulum t-tubule/triad system and mitochondria. Diseased intramyofibrillar mitochondria showed significant swelling and extraordinary vesiculation and apparent extrusion of cristae. We reported previously subsarcolemmal mitochondrial accumulation in younger mice (66). A nuclear presence of hSOD1 in myonuclei and satellite cells also could be part of the disease instigating process. Nuclear localization of hSOD1 in spinal MNs has been seen in tg mouse models with CNS expression (72). Nuclear hSOD1 can impact transcriptional control (84) and DNA repair (85). Our data suggest the possibility that sequestration of rapsyn from the NMJ by hSOD1 interaction might be a sentinel, progressive and age-related, event in the disease linking skeletal to spinal cord by causing a postsynaptic molecular dysfunction of nAchR leading to motor endplate loss of function. A hSOD1-rapsyn interaction is present in 12–15-month-old mice, but we are unsure its inception. Interestingly while NMJ proteins were depleted, NOS1 and NOS2 were upregulated. This upregulation could be meaningful to ALS pathogenesis because genetic deletion of NOS2 (64) and systemic pharmacological inhibition of NOS2 (86) extend the lifespan of non-conditional hSOD1-G93A tg mice. Importantly, this NOS upregulation could drive the increased NO production in skeletal muscle that we have discovered. These events may promote aberrant oxidative chemistry, evidenced by increased protein carbonyl formation (50), and nitrative stress evidenced here by increased protein nitration in different subcellular fractions, synaptophysin nitration in diaphragm, and DNA damage accumulation. However, these events seem to be occurring in the absence of changes in catalase. NO is a potent inducer of DNA-SSBs and DNA-DSBs in MNs (70). Because there is no hSOD1 in spinal MNs or in other CNS cells in this mouse system, yet spinal MNs degenerate and subsets (40–50%) are eliminated, the disease instigation is likely extrinsic to MNs and could involve NO in skeletal muscle.
There is growing evidence that WT SOD1 can be pathogenic in ALS (7, 12, 13, 87–89). Interestingly, our WT hSOD1mus tg mice developed disease. There is precedent for WT hSOD1 causing disease. In human ALS tissues, misfolded SOD1 has been detected in sporadic ALS (87). In cell culture, oxidized WT hSOD1 can cause dose-dependent cell death, like mutant hSOD1 variants (12). Moreover, zinc deficiency can render WT SOD1 toxic to MNs in culture through mechanisms involving a gain in redox reactivity and catalysis of tyrosine nitration in proteins (13). Our tg mice expressing WT and mutant hSOD1 show evidence for oxidative stress and severe protein nitration in skeletal muscle consistent with the possibility that WT hSOD1 might acquire toxic properties through redox chemistry, thereby contributing to skeletal muscle damage, and thus MN disease. However, WT hSOD1 presence in mouse skeletal muscle did not significantly alter the catalase component of the antioxidant network.
Retrograde neurodegeneration of MNs could be an integral part of ALS pathogenesis in a target deprivation type of scenario (75, 90). Neurogenic denervation atrophy could also play into this pathological process (91) once disease is instigated in MNs through retrograde signaling mechanisms involving mitochondria (64) and perturbations in neurotrophin signaling (49, 92). Primary pathology in skeletal muscle, including NMJ-motor unit injury, could set up the target deprivation of MNs (93). Distal NMJ dismantling has garnered considerable attention as a mechanism of disease in ALS (93–95). The MN pathology seen here, and shown elsewhere (50, 57, 70), including axonopathy, chromatolysis, perinuclear mitochondrial abnormalities, DNA-SSB accumulation, p53 activation, and cell death, are consistent with distal axon-target pathology and target deprivation. Thus, MN degeneration in hSOD1mus tg mice might follow muscle disease and be a form of retrograde dying-back, apoptotic-like degeneration with similarities to human ALS (90, 96). These findings add to the justification of revisiting neurotrophins and exploring microneurotrophins for the treatment of ALS (97).
We studied interscapular WAT and BAT in hSOD1mus tg mice and found a loss in older life. This result is interesting because higher pre-diagnostic body fat (98), subcutaneous fat (99), and serum leptin, an energy regulating hormone produced by adipocytes (100), are all associated with decreased risk of ALS clinically. Several epidemiological dietary studies of populations in different countries show that higher fat consumption decreases risk of developing ALS (101–104). In the commonly used disease-aggressive non-conditional G93A-hSOD1 tg mouse model, high-fat diets extend lifespan (38, 105). While more work needs to be done (106), evidence is accruing suggesting that human ALS is a systemic metabolic and energy imbalance disorder (34), including data showing that the expenditure of energy exceeds energy uptake, possibly causing depletion of fat stores (101), and that most ALS patients are hypolipidemic (107) and have perturbed carbohydrate metabolism (108). Skeletal muscle (psoas) is hypermetabolic in ALS (109). Studies in rodents after axotomy and target deprivation have shown that neurons, including MNs, become hypermetabolic at the chromatolytic stage of degeneration (70, 78, 110); moreover, spinal MNs in non-conditional G93A-hSOD1 tg mice show high metabolic activity prior to mitochondrial failure and MN degeneration (64). During disease and body stress when energy demands are high and fuels are low, the skeletal musculature is a critical regulator of energy metabolism in many organs because of its ability of mobilize amino acids through proteolysis and to regulate glucose homeostasis (111). Our finding connects, albeit through uncertain mechanisms, the presence of ALS-causing hSOD1 only in the skeletal musculature and interscapular WAT and BAT in tg mice. A change in BAT is significant because this adipose organ is closely related to skeletal muscle, functions in thermogenesis and glucose homeostasis, and is enriched in mitochondria (112), introducing the possibility that the skeletal musculature and BAT may both be targets for disease modification and therapeutics in ALS. Interestingly, more physically fit men have a higher risk of dying at an early age from ALS than men with less physical capacity (113).
p53 has been implicated in the mechanism of MN degeneration in ALS (79, 114) (Martin and Liu, 2002). We found in hSOD1mus tg mice, p53 activation in skeletal muscle and spinal cord. We also found the accumulation of DNA-SSB in myofiber nuclei and MN nuclei in these mice. Given that DNA-SSBs are a potent stimulus for p53 activation (76), these results are congruent with recent observations that DNA damage response and repair mechanisms are strongly activated in human ALS MNs in postmortem tissues and in human iPS cell-derived MNs with fALS SOD1 mutations (114).
Conclusions
We tested the hypothesis that skeletal muscle is a primary site of pathogenesis in ALS that triggers MN degeneration by creating tg mice expressing WT, G37R-, and G93A-human SOD1 gene variants only in skeletal muscle. The mice developed phenotypes, including shortened lifespan, anatomical pathology of skeletal muscle, adipose tissue, and spinal cord, and a microscopic pathology involving skeletal muscle stem cell apoptosis, aberrant mitochondria, and sarcomere degeneration, thus showing that hSOD1 in skeletal muscle is a driver of pathogenesis in ALS. The spinal MN degeneration involved inclusion formation, axonopathy, mitochondriopathy, DNA damage accumulation, and p53 activation and apoptosis suggesting a non-autonomous skeletal muscle driven mechanism for MN degeneration in ALS explaining their selective vulnerability as a form of target-deprivation retrograde neurodegeneration.
Data Availability Statement
The original contributions presented in the study are included in the article/Supplementary Materials, further inquiries can be directed to the corresponding author/s.
Ethics Statement
The animal study was reviewed and approved by JHU Animal Use and care Committee.
Author Contributions
LM and MW: study concept and design, data acquisition and analysis, and manuscript writing. MW: tg mouse generation. All authors edited and approved the final version of the manuscript.
Funding
This work was supported by NIH-NINDS grants NS034100 and NS052098.
Conflict of Interest
The authors declare that the research was conducted in the absence of any commercial or financial relationships that could be construed as a potential conflict of interest.
Acknowledgments
The authors thank Antoinette Price for her work on the histology and immunohistochemistry. The authors are particularly grateful to Edward Roberts for his outstanding work on the EM.
Supplementary Material
The Supplementary Material for this article can be found online at: https://www.frontiersin.org/articles/10.3389/fneur.2020.592851/full#supplementary-material
Supplementary Figure 1. Western blot showing the presence or absence of hSOD1 and presence of mouse SOD1 in different tissues of hSOD1mus tg mice in generation F10. A very long exposure is shown to ensure the absence of hSOD1 in some lanes. The positive control was a G93A-hSOD1high expresser mouse line (G1H). hSOD1 was detected in skeletal muscle (hind leg) of all genotypes of hSOD1mus tg mice. hSOD1 was not detected in CNS tissue (spinal cord). In two mouse lines (only one shown here) hSOD1 was detected in heart.
Supplementary Video 1. Video clip of a live mouse that is a wildtype (WT)- hSOD1mus tg showing definite complete hind-limb paralysis and hindquarter and lower truncal muscle wasting and kyphosis.
Abbreviations
ALS, amyotrophic lateral sclerosis; BAT, brown adipose tissue; DDR, DNA damage response; hSOD1, human superoxide dismutase; MN, motor neuron; NMJ, neuromuscular junction; NO, nitric oxide; tg, transgenic; WAT, white adipose tissue.
References
1. Rowland LP, Shneider NA. Amyotrophic lateral sclerosis. N Engl J Med. (2001) 344:1688–700. doi: 10.1056/NEJM200105313442207
2. Petrov D, Mansfield C, Moussy A, Hermine O. ALS clinical trials review: 20 years of failure. Are we any closer to registering a new treatment? Front Aging Neurosci. (2017) 9:68. doi: 10.3389/fnagi.2017.00068
3. Price DL, Martin LJ, Clatterbuck RE, Koliatsos VE, Sisodia SS, Walker LC, et al. Neuronal degeneration in human diseases and animal models. J Neurobiol. (1992) 23:1277–94. doi: 10.1002/neu.480230916
4. Nowicka N, Juranek J, Juranek JK, Wojtkiewicz J. Risk factors and emerging therapies in amyotrophic lateral sclerosis. Int J Mol Sci. (2019) 20:2616. doi: 10.3390/ijms20112616
5. Deng H-X, Hentati A, Tainer JA, Iqbal Z, Cayabyab A, Hung W-Y, et al. Amyotrophic lateral sclerosis and structural defects in Cu,Zn superoxide dismutase. Science. (1993) 261:1047–51. doi: 10.1126/science.8351519
6. Rosen DR, Siddique T, Patterson D, Figiewicz DA, Sapp P, Hentati A, et al. Mutations in Cu/Zn superoxide dismutase gene are associated with familial amyotrophic lateral sclerosis. Nature. (1993) 362:59–62. doi: 10.1038/362059a0
7. Rakhit R, Crow JP, Lepock JR, Kondejewski LH, Cashman NR, Chakrabartty A. Monomeric Cu, Zn-superoxide dismutase is a common misfolding intermediate in the oxidation models of sporadic and familial amyotrophic sclerosis. J Biol Chem. (2004) 279:15499–504. doi: 10.1074/jbc.M313295200
9. Borchelt DR, Lee MK, Slunt HH, Guarnieri M, Xu Z-S, Wong PC, et al. Superoxide dismutase 1 with mutations linked to familial amyotrophic lateral sclerosis possesses significant activity. Proc Natl Acad Sci USA. (1994) 91:8292–6. doi: 10.1073/pnas.91.17.8292
10. Yim MB, Kang J-H, Yim H-S, Kwak H-S, Chock PB, Stadtman ER. A gain-of-function of an amyotrophic lateral sclerosis-associated Cu,Zn-superoxide dismutase mutant: an enhancement of free radical formation due to a decrease in Km for hydrogen peroxide. Proc Natl Acad Sci USA. (1996) 93:5709–14. doi: 10.1073/pnas.93.12.5709
11. Banks CJ, Andersen JL. Mechanisms of SOD1 regulation by post-translational modifications. Redox Biol. (2019) 26:101270. doi: 10.1016/j.redox.2019.101270
12. Ezzi SA, Urushitani M, Julien J-P. Wild-type superoxide dismutase acquires binding and toxic properties of ALS-linked mutant forms through oxidation. J Neurochem. (2007) 102:170–8. doi: 10.1111/j.1471-4159.2007.04531.x
13. Estévez AG, Crow JP, Sampson JB, Reiter C, Zhuang Y, Richardson GJ, et al. Induction of nitric oxide-dependent apoptosis in motor neurons by zinc-deficient superoxide dismutase. Science. (1999) 286:2498–500. doi: 10.1126/science.286.5449.2498
14. Rotunno MN, Bosco DA. An emerging role for misfolded wild-type SOD1 in sporadic ALS pathogenesis. Front Cell Neurosci. (2013) 7:253. doi: 10.3389/fncel.2013.00253
15. Martin LJ. Mitochondrial and cell death mechanisms in neurodegenerative disease. Pharmaceuticals. (2010) 3:839–915. doi: 10.3390/ph3040839
16. Price DL, Koo EH, Sisodia SS, Martin LJ, Koliatsos VE, Muma NA, et al. Neuronal responses to injury and aging: lessons from animal models. Prog Brain Res. (1990) 86:297–308. doi: 10.1016/S0079-6123(08)63186-6
17. Rothstein JD, Martin LJ, Kuncl RW. Decreased glutamate transport by the brain and spinal cord in amyotrophic lateral sclerosis. N Engl J Med. (1992) 326:1464–8. doi: 10.1056/NEJM199205283262204
18. Beckman JS, Carson M, Smith CD, Koppenol WH. ALS, SOD and peroxynitrite. Nature. (1993) 364:548. doi: 10.1038/364584a0
19. Lino MM, Schneider C, Caroni P. Accumulation of SOD1 mutants in postnatal motoneurons does not cause motoneuron pathology or motoneuron disease. J Neurosci. (2002) 22:4825–32. doi: 10.1523/JNEUROSCI.22-12-04825.2002
20. Pramatarova A, Laganière J, Roussel J, Brisebois K, Rouleau GA. Neuron-specific expression of mutant superoxide dismutase 1 in transgenic mice does not lead to motor impairment. J Neurosci. (2001) 21:3369–74. doi: 10.1523/JNEUROSCI.21-10-03369.2001
21. Jaarsma D, Teuling E, Haasdijk ED, Zeeuw CI, Hoogenraad CC. Neuron-specific expression of mutant superoxide dismutase is sufficient to induce amyotrophic lateral sclerosis in transgenic mice. J Neurosci. (2008) 28:2075–88. doi: 10.1523/JNEUROSCI.5258-07.2008
22. Wang L, Sharma K, Deng H-X, Siddique T, Grisotti G, Liu E, et al. Restricted expression of mutant SOD1 in spinal motor neurons and interneurons induces motor neuron pathology. Neurobiol Dis. (2008) 29:400–8. doi: 10.1016/j.nbd.2007.10.004
23. Gong YH, Parsadanian AS, Andreeva A, Snider WD, Elliott JL. Restricted expression of G86R Cu/Zn superoxide dismutase in astrocytes results in astrocytosis but does not cause motoneuron degeneration. J Neurosci. (2000) 20:660–5. doi: 10.1523/JNEUROSCI.20-02-00660.2000
24. Nagai M, Re DB, Nagata T, Chalazonitis A, Jessell TM, Wichterle H, et al. Astrocytes expressing ALS-linked mutated SOD1 release factors selectively toxic to motor neurons. Nat Neurosci. (2007) 10:615–22. doi: 10.1038/nn1876
25. Beers DR, Henkel JS, Xiao Q, Zhao W, Wang J, Yen AA, et al. Wild-type microglia extend survival in PU.1 knockout mice with familial amyotrophic lateral sclerosis. Proc Natl Acad Sci USA. (2006) 103:16021–6. doi: 10.1073/pnas.0607423103
26. Boillée S, Yamanaka K, Lobsiger CS, Copeland NG, Jenkins NA, Kassiotis G, et al. Onset and progression in inherited ALS determined by motor neurons and microglia. Science. (2006) 312:1389–92. doi: 10.1126/science.1123511
27. Xiao Q, Zhao W, Beers DR, Yen AA, Xie W, Henkel JS, et al. Mutant SOD1G93Amicroglia are more neurotoxic relative to wild-type microglia. J Neurochem. (2007) 102:2008–19. doi: 10.1111/j.1471-4159.2007.04677.x
28. Clement AM, Nguyen MD, Roberts EA, Garcia ML, Boillée S, Rule M, et al. Wild-type nonneuronal cells extend survival of SOD1 mutant motor neurons in ALS mice. Science. (2003) 302:113–7. doi: 10.1126/science.1086071
29. Martin LJ, Liu Z. Adult olfactory bulb neural precursor cell grafts provide temporary protection from motor neuron degeneration, improve motor function, and extend survival in amyotrophic lateral sclerosis mice. J Neuropathol Exp Neurol. (2007) 66:1002–18. doi: 10.1097/nen.0b013e318158822b
30. Gowing G, Philips T, Van Wijmeersch B, Audet J-N, Dewil M, Van Den Bosch L, et al. Ablation of proliferating microglia does not affect motor neuron degeneration in amyotrophic lateral sclerosis caused by mutant superoxide dismutase. J Neurosci. (2008) 28:10234–44. doi: 10.1523/JNEUROSCI.3494-08.2008
31. Cova E, Cereda C, Galli A, Cyrti D, Finotti C, Di Poto C, et al. Modified expression of Bcl-2 and SOD1 proteins in lymphocytes from sporadic ALS patients. Neurosci Lett. (2006) 399:186–90. doi: 10.1016/j.neulet.2006.01.057
32. Aguirre T, Van Den Bosch L, Goetschalckx K, Tilkin P, Mathijs G, Cassiman JJ, et al. Increased sensitivity of fibroblasts from amyotrophic lateral sclerosis patients to oxidative stress. Ann Neurol. (1998) 43:452–7. doi: 10.1002/ana.410430407
33. McEachern G, Kassovska-Bratinova S, Raha S, Tarnopolsky MA, Turnbull J, Bourgeois J, et al. Manganese superoxide dismutase levels are elevated in a proportion of amyotrophic lateral sclerosis patient cell lines. Biochem Biophys Res Comm. (2000) 273:359–63. doi: 10.1006/bbrc.2000.2933
34. Dupuis L, Gonzalez de Aguilar JL, Echaniz-Laguna A, Loeffler JP. Mitochondrial dysfunction in amyotrophic lateral sclerosis also affects skeletal muscle. Muscle Nerve. (2006) 34:253–4. doi: 10.1002/mus.20566
35. Wiedemann FR, Winkler K, Kuznetsov AV, Bartels C, Vielhaber S, Feistner H, et al. Impairment of mitochondrial function in skeletal muscle of patients with amyotrophic lateral sclerosis. J Neurol Sci. (1998) 156:65–72. doi: 10.1016/S0022-510X(98)00008-2
36. Palamiuc L, Schlagowski A, Ngo ST, Vernay A, Dirrig-Grosch S, Henriques A, et al. A metabolic switch toward lipid use in glycolytic muscle is an early pathologic event in a mouse model of amyotrophic lateral sclerosis. EMBO Mol Med. (2015) 7:526–46. doi: 10.15252/emmm.201404433
37. Ahmed RM, Dupuis L, Kiernan MC. Paradox of amyotrophic lateral sclerosis and energy metabolism. J Neurol Neurosurg Psychiatry. (2018) 89:1013–4. doi: 10.1136/jnnp-2018-318428
38. Dupuis L, Oubart H, René F, Gonzalez de Aguilar JL, Loeffler JP. Evidence for defective energy homeostasis in amyotrophic lateral sclerosis: benefit of a high-energy diet in a transgenic mouse model. Proc Natl Acad Sci USA. (2004) 101:11159–64. doi: 10.1073/pnas.0402026101
39. Desport JC, Torny F, Lacoste M, Preux PM, Couratier P. Hypermetabolism in ALS: correlations with clinical and paraclinical parameters. Neuro-Degenerat Dis. (2005) 2:202–7. doi: 10.1159/000089626
40. Steyn FJ, Ioannides ZA, van Eijk RPA, Heggie S, Thorpe KA, Ceslis A, et al. Hypermetabolism in ALS is associated with greater functional decline and shorter survival. J Neurol Neurosurg Psychiatry. (2018) 89:1016–23 doi: 10.1136/jnnp-2017-317887
41. Echaniz-Laguna A, Zoll J, Ponsot E, N'Guessan B, Tranchant C, Loeffler JP, et al. Muscular mitochondrial function in amyotrophic lateral sclerosis is progressively altered as the disease develops: a temporal study in man. Exp Neurol. (2006) 198:25–30. doi: 10.1016/j.expneurol.2005.07.020
42. Krasnianski A, Deschauer M, Neudecker S, Gellerich FN, Müller T, Schoser B, et al. Mitochondrial changes in skeletal muscle in amyotrophic lateral sclerosis and other neurogenic atrophies. Brain. (2005) 128:1870–6. doi: 10.1093/brain/awh540
43. Vielhaber S, Winkler K, Kirches E, Kunz D, Büchner M, Feistner H, et al. Visualization of defective mitochondrial function in skeletal muscle fibers of patients with sporadic amyotrophic lateral sclerosis. J Neurol Sci. (1999) 169:133–9. doi: 10.1016/S0022-510X(99)00236-1
44. Comi GP, Bordoni A, Salani S, Franceschina L, Sciacco M, Prelle A, et al. Cytochrome c oxidase subunit I microdeletion in a patient with motor neuron disease. Ann Neurol. (1998) 43:110–6. doi: 10.1002/ana.410430119
45. Corti S, Donadoni C, Ronchi D, Bordoni A, Fortunato F, Santoro D, et al. Amyotrophic lateral sclerosis linked to a novel SOD1 mutation with muscle mitochondrial dysfunction. J Neurosci. (2009) 276:170–4. doi: 10.1016/j.jns.2008.09.030
46. Derave W, Van Den Bosch L, Lemmens G, Eijnde BO, Robberecht W, Hespel P. Skeletal muscle properties in a transgenic mouse model for amyotrophic lateral sclerosis: effects of creatine treatment. Neurobiol Dis. (2003) 13:264–72. doi: 10.1016/S0969-9961(03)00041-X
47. Mahoney DJ, Kaczor JJ, Bourgeois J, Yasuda N, Tarnopolsky MA. Oxidative stress and antioxidant enzyme upregulation in SOD1-G93A mouse skeletal muscle. Muscle Nerve. (2006) 33:809–16. doi: 10.1002/mus.20542
48. Schoser BGH, Wehling S, Blottner D. Cell death and apoptosis-related proteins in muscle biopsies of sporadic amyotrophic lateral sclerosis and polyneuropathy. Muscle Nerve. (2001) 24:1083–9. doi: 10.1002/mus.1114
49. Dobrowolny G, Giacinti C, Pelosi L, Nicoletti C, Winn N, Barberi L, et al. Muscle expression of a local Igf-1 isoform protects motor neurons in an ALS mouse model. J Cell Biol. (2005) 168:193–9. doi: 10.1083/jcb.200407021
50. Wong M, Martin LJ. Skeletal muscle-restricted expression of human SOD1 causes motor neuron degeneration in transgenic mice. Hum Mol Genet. (2010) 19:2284–302. doi: 10.1093/hmg/ddq106
51. Petropoulos CJ, Rosenberg MP, Jenkins NA, Copeland NG, Hughes SH. The chicken skeletal muscle α-actin promoter is tissue specific in transgenic mice. Mol Cell Biol. (1989) 9:3785–92. doi: 10.1128/MCB.9.9.3785
52. Rao MV, Donoghue MJ, Merlie JP, Sanes JR. Distinct regulatory elements control muscle-specific fiber-type-selective, and axially graded expression of a myosin light-chain gene in transgenic mice. Mol Cell Biol. (1996) 16:3909–22. doi: 10.1128/MCB.16.7.3909
53. Bosque PJ, Ryou C, Telling G, Peretz D, Legname G, DeArmond SL, et al. Prions in skeletal muscle. Proc Natl Acad Sci USA. (2002) 99:3812–7. doi: 10.1073/pnas.052707499
54. Liang J, Wang W, Sorensen D, Medina S, Ilchenko S, Kiselar J, et al. Cellular prion protein regulates its own α-cleavage through ADAM8 in skeletal muscle. J Biol Chem. (2012) 287:16510–20. doi: 10.1074/jbc.M112.360891
55. Heiduschka P, Thanos S. NO production during neuronal cell death can be directly assessed by a chemical reaction in vivo. NeuroRep. (1998) 9:4051–7.
56. Von Bohlen und Halbach O, Albrecht D, Heinemann U, Schuchmann S. Spatial nitric oxide imaging using 1,2-diaminoanthraquione to investigate the involvement of nitric oxide in long-term potentiation in rat brain slices. NeuroImage. (2002) 15:633–9. doi: 10.1006/nimg.2001.1045
57. Martin LJ, Chen K, Liu Z. Adult motor neuron apoptosis is mediated by nitric oxide and Fas death receptor linked by DNA damage and p53 activation. J Neurosci. (2005) 25:6449–59. doi: 10.1523/JNEUROSCI.0911-05.2005
58. Martin LJ, Adams NA, Pan Y, Price A, Wong M. The mitochondrial permeability transition pore regulates nitric oxide-mediated apoptosis of neurons induced by target deprivation. J Neurosci. (2011) 31:359–70. doi: 10.1523/JNEUROSCI.2225-10.2011
59. Fayzullina S, Martin LJ. Skeletal muscle DNA damage precedes spinal motor neuron DNA damage in a mouse model of spinal muscular atrophy. (SMA). PLoS ONE. (2014) 9:e93329. doi: 10.1371/journal.pone.0093329
60. Fayzullina S, Martin LJ. DNA damage response and DNA repair in skeletal myocytes from a mouse model of spinal muscular atrophy. J Neuropath Exp Neurol. (2016) 75:889–902. doi: 10.1093/jnen/nlw064
61. Martin LJ, Price AC, McClendon KB, Al-Abdulla NA, Subramaniam JR, Wong PC, et al. Early events of target deprivation/axotomy-induced neuronal apoptosis in vivo: oxidative stress, DNA damage, p53 phosphorylation and subcellular redistribution of death proteins. J Neurochem. (2003) 85:234–47. doi: 10.1046/j.1471-4159.2003.01659.x
62. Sze C-I, Troncoso JC, Kawas C, Mouton P, Price DL, Martin LJ. Loss of the presynaptic vesicle protein synaptophysin in hippocampus correlates with cognitive decline in Alzheimer's disease. J Neuropathol Exp Neurol. (1997) 56:933–94. doi: 10.1097/00005072-199708000-00011
63. Chen J-R, Liao C-W, Mao SJT, Chen T-H, Weng C-N. A simple technique for the simultaneous determination of molecular weight and activity of superoxide dismutase using SDS-PAGE. J Biochem Biophys Methods. (2001) 47:233–7. doi: 10.1016/S0165-022X(00)00162-7
64. Martin LJ, Liu Z, Chen K, Price AC, Pan Y, Swaby JA, et al. Motor neuron degeneration in ALS mutant superoxide dismutase-1 transgenic mice: mechanisms of mitochondriopathy and cell death. J Comp Neurol. (2007) 500:20–46. doi: 10.1002/cne.21160
65. Chargé SBP, Rudnicki MA. Cellular and molecular regulation of muscle regeneration. Physiol Rev. (2004) 84:209–38. doi: 10.1152/physrev.00019.2003
66. Wong M, Gertz B, Chestnut BA, Martin LJ. Mitochondrial DNMT3A and DNA methylation in skeletal muscle and CNS of transgenic mouse models of ALS. Front Cell Neurosci. (2013) 7:279. doi: 10.3389/fncel.2013.00279
67. Chang CC. Looking back on the discovery of alpha-bungarotoxin. J Biomed Sci. (1999) 6:368–75. doi: 10.1159/000025412
68. Martin LJ. An approach to experimental synaptic pathology using green fluorescent protein-transgenic mice and gene knockout mice to show mitochondrial permeability transition pore-driven excitotoxicity in interneurons and motoneurons. Toxicol Pathol. (2011) 39:220–33. doi: 10.1177/0192623310389475
69. Liu Z, Martin LJ. Isolation of mature spinal motor neurons and single cell analysis using the comet assay of early low-level DNA damage induced in vitro and in vivo. J Histochem Cytochem. (2001) 49:957–72. doi: 10.1177/002215540104900804
70. Martin LJ, Liu Z. DNA damage profiling in motor neurons: a single-cell analysis by comet assay. Neurochem Res. (2002) 27:1093–104. doi: 10.1023/A:1020961006216
71. Martin LJ, Pardo CA, Cork LC, Price DL. Synaptic pathology and glial responses to neuronal injury precede the formation of senile plaques and amyloid deposits in the aging cerebral cortex. Am J Pathol. (1994) 145:1358–81.
72. Gertz B, Wong M, Martin LJ. Nuclear localization of human SOD1 and mutant SOD1-specific disruption of survival motor neuron protein complex in transgenic amyotrophic lateral sclerosis mice. J Neuropathol Exp Neurol. (2012) 77:162–77. doi: 10.1097/NEN.0b013e318244b635
73. Cooper DN, Krawczak M, Polychronakos C, Tyler-Smith C, Kehrer-Sawatzki H. Where genotype is not predictive of phenotype: towards an understanding of the molecular basis of reduced penetrance in human inherited disease. Hum Genet. (2013) 132:1077–30. doi: 10.1007/s00439-013-1331-2
74. Gurney ME, Pu H, Chiu AY, Dal Canto MC, Polchow CY, Alexander DD, et al. Motor neuron degeneration in mice that express a human Cu,Zn superoxide dismutase mutation. Science. (1994) 264:1772–5. doi: 10.1126/science.8209258
75. Martin LJ. Neuronal cell death in nervous system development, disease, and injury. Int J Mol Med. (2001) 7:455–78. doi: 10.3892/ijmm.7.5.455
76. Jayaraman J, Prives C. Activation of p53 sequence-specific DNA binding by short single strands of DNA requires the p53 C-terminus. Cell. (1995) 81:1021–9. doi: 10.1016/S0092-8674(05)80007-8
77. Martin LJ, Liu Z. Injury-induced spinal motor neuron apoptosis is preceded by DNA single-strand breaks and is p53- and Bax-dependent. J Neurobiol. (2002) 50:181–97. doi: 10.1002/neu.10026
78. Martin LJ, Kaiser A, Price AC. Motor neuron degeneration after sciatic nerve avulsion in adult rat evolves with oxidative stress and is apoptosis. J Neurobiol. (1999) 40:185–201. doi: 10.1002/(SICI)1097-4695(199908)40:2<185::AID-NEU5>3.0.CO;2-%23
79. Martin LJ. p53 is abnormally elevated and active in the CNS of patients with amyotrophic lateral sclerosis. Neurobiol Dis. (2000) 7:613–22. doi: 10.1006/nbdi.2000.0314
80. Martin LJ, Fancelli D, Wong M, Niedzwiecki M, Ballarini M, Plyte S, et al. GNX-4728, a novel small molecule drug inhibitor of mitochondrial permeability transition, is therapeutic in a mouse model of amyotrophic lateral sclerosis. Front Cell Neurosci. (2014) 8:433. doi: 10.3389/fncel.2014.00433
81. Dobrowolny G, Aucello M, Rizzuto E, Beccaficao S, Mammucari C, Bonconpagni S, et al. Skeletal muscle is a primary target of SOD1G93A-mediated toxicity. Cell Metab. (2008) 8:425–36. doi: 10.1016/j.cmet.2008.09.002
82. Riddoch-Contreras J, Yang SY, Dick JR, Goldspink G, Orrell RW, Greensmith L. Mechano-growth factor, an IGF-I splice variant, rescues motoneurons and improves muscle function in SOD1(G93A) mice. Exp Neurol. (2009) 215:281–9. doi: 10.1016/j.expneurol.2008.10.014
83. Wang Y, Melkani GC, Suggs JA, Melkani A, Kronert WA, Cammarato A, et al. Expression of the inclusion body myopathy 3 mutation in Drosophila depresses myosin function and stability and recapitulates muscle inclusions and weakness. Mol Biol Cell. (2012) 23:2057–65. doi: 10.1091/mbc.e12-02-0120
84. Tsang CK, Liu Y, Thomas J, Zhang Y, Zheng XF. Superoxide dismutase 1 acts as a nuclear transcription factor to regulate oxidative stress resistance. Nat Commun. (2014) 5:3446. doi: 10.1038/ncomms4446
85. Sau D, De Biasi S, Vitellaro-Zuccarello L, Riso P, Guarnieri S, Porrini M, et al. Mutation of SOD1 in ALS: a gain of a loss of function. Hum Mol Genet. (2007) 16:1604–18. doi: 10.1093/hmg/ddm110
86. Chen K, Northington FJ, Martin LJ. Inducible nitric oxide synthase is present in motor neuron mitochondria and Schwann cells and contributes to disease mechanisms in ALS mice. Brain Struct Funct. (2009) 214:219–34. doi: 10.1007/s00429-009-0226-4
87. Bosco DA, Morfini G, Karabacak NM, Song Y, Gros-Louis F, Pasinelli P, et al. Wild-type and mutant SOD1 share an aberrant conformation and a common pathogenic pathway in ALS. Nat Neurosci. (2010) 13:1396–403. doi: 10.1038/nn.2660
88. Furukawa Y, Tokuda E. Does wild-type Cu/Zn-superoxide dismutase have pathogenic roles in amyotrophic lateral sclerosis. Transl Neurodegener. (2020) 19:33. doi: 10.1186/s40035-020-00209-y
89. Kabashi E, Valdmanis PN. Oxidized/misfolded superoxide dismutase-1: the cause of all amyotrophic lateral sclerosis? Ann Neurol. (2007) 62:553–9. doi: 10.1002/ana.21319
90. Martin LJ. Neuronal death in amyotrophic lateral sclerosis is apoptosis: possible contribution of a programmed cell death mechanism. J Neuropathol Exp Neurol. (1999) 58:459–71. doi: 10.1097/00005072-199905000-00005
91. Muller FL, Song W, Jang YC, Liu Y, Sabria Y, Richardson A, et al. Denervation-induced skeletal muscle atrophy is associated with increased mitochondrial ROS production. Am J Physiol Regul Integr Comp Physiol. (2007) 293:R1159–68. doi: 10.1152/ajpregu.00767.2006
92. Oppenheim RW. Neurotrophic survival molecules for motoneurons: an embarrassment of riches. Neuron. (1996) 17:195–7. doi: 10.1016/S0896-6273(00)80151-8
93. Dupuis L, Gonzalez de Aguilar JL, Echaniz-Laguna A, Eschbach J, Rene F, Oudart H, et al. Muscle mitochondrial uncoupling dismantles neuromuscular junction and triggers distal degeneration of motor neurons. PLoS ONE. (2009) 4:e5390. doi: 10.1371/journal.pone.0005390
94. Cappello V, Francolini M. Neuromuscular junction dismantling in amyotrophic lateral sclerosis. Int J Mol Sci. (2017) 18:2092. doi: 10.3390/ijms18102092
95. Dobrowolny G, Martini M, Scicchitano BM, Romanello V, Boncompagni S, Nicoletti C, et al. Muscle expression of SOD1 G93A triggers the dismantlement of neuromuscular junction via PKC-theta. Antioxid Redox Signal. (2018) 28:1105–19. doi: 10.1089/ars.2017.7054
96. Fischer LR, Culver DG, Tennant P, Davis AA, Wang M, Castellano-Sanchez A, et al. Amyotrophic lateral sclerosis is a distal axonopathy: evidence in mice and man. Exp Neurol. (2004) 185:232–40. doi: 10.1016/j.expneurol.2003.10.004
97. Bennett JPJr, Boulicault D. A spotlight on microneurotrophins: the future of amyotrophic lateral sclerosis treatment? Neurodegener Dis Manag. (2015) 5:181–5. doi: 10.2217/nmt.15.13
98. Gallo V, Wark PA, Jenab M, Pearce N, Brayne C, Vermeulen R, et al. Prediagnostic body fat and risk of death from amyotrophic lateral sclerosis: the EPIC cohort. Neurology. (2013) 80:829–38. doi: 10.1212/WNL.0b013e3182840689
99. Lindauer E, Dupuis L, Muller HP, Neumann H, Ludolph AC, Kassubek J. Adipose tissue distribution predicts survival in amyotrophic lateral sclerosis. PLoS ONE. (2013) 8:e67783. doi: 10.1371/journal.pone.0067783
100. Nagel G, Peter RS, Rosenbohm A, Koenig W, Dupuis L, Rothenbacher D, et al. Adipokines, C-reactive protein and amyotrophic lateral sclerosis—results from a population based ALS registry in Germany. Sci Rep. (2017) 7:4374. doi: 10.1038/s41598-017-04706-5
101. Huisman MHB, Seelen M, van Doormaal PTC, de Jong SW, de Vries JHM, van der Kooi AJ, et al. Effect of presymptomatic body mass index and consumption of fat and alcohol on amyotrophic lateral sclerosis. JAMA Neurol. (2015) 72:1155–62. doi: 10.1001/jamaneurol.2015.1584
102. Morozova N, Weisskopf MG, McCullough ML, Munger KL, Calle EE, Thun MJ, et al. Diet and amyotrophic lateral sclerosis. Epidemiology. (2008) 19:324–37. doi: 10.1097/EDE.0b013e3181632c5d
103. Okamoto K, Kihira T, Kondo T, Kobashi G, Washio M, Sasaki S, et al. Nutritional status and risk of amyotrophic lateral sclerosis in Japan. Amyotroph Lateral Scler. (2007) 8:300–4. doi: 10.1080/17482960701472249
104. Veldink JH, Kalmijn S, Groeneveld GJ, Wunderink W, Koster A, de Vries JHM, et al. Intake of polyunsaturated fatty acids and vitamin E reduces the risk of developing amyotrophic lateral sclerosis. J Neurol Neurosurg Psychiatr. (2007) 78:367–71. doi: 10.1136/jnnp.2005.083378
105. Mattson MP, Cutler RG, Camandola S. Energy intake and amyotrophic lateral sclerosis. Neuromolecular Med. (2007) 9:17–20. doi: 10.1385/NMM:9:1:17
106. Brito MD, da Silva GFG, Tilieri EM, Araujo BG, Calió ML, Rosenstock TR. Metabolic alteration and amyotrophic lateral sclerosis outcome: a systematic review. Front Neurol. (2019) 10:1205. doi: 10.3389/fneur.2019.01205
107. Yang JW, Kim SM, Kim HJ, Kim JE, Park KS, Kim SH, et al. Hypolipidemia in patients with amyotrophic lateral sclerosis: a possible gender difference? J Clin Neurol. (2013) 9:125–9. doi: 10.3988/jcn.2013.9.2.125
108. Dalakas MC, Hatazawa J, Brooks RA, Di Chiro G. Lowered cerebral glucose utilization in amyotrophic lateral sclerosis. Ann Neurol. (1987) 22:580–6. doi: 10.1002/ana.410220504
109. Bauckneht M, Lai R, Miceli A, Schenone D, Cossu V, Donegani MI, et al. Spinal cord hypermetabolism extends to skeletal muscle in amyotrophic lateral sclerosis: a computational approach to [18F]-fluorodeoxyglucose PET/CT images. EJNMMI Res. (2020) 10:23. doi: 10.1186/s13550-020-0607-5
110. Al-Abdulla NA, Martin LJ. Apoptosis of retrogradely degenerating neurons occurs in association with the accumulation of perikaryal mitochondria and oxidative damage to the nucleus. Am J Pathol. (1998) 153:447–56. doi: 10.1016/S0002-9440(10)65588-5
111. Argilés JM, Campos N, Lopez-Pedrosa JM, Rueda R, Rodriguez-Mañas L. Skeletal muscle regulates metabolism via interorgan crosstalk: roles in health and disease. J Am Med Dir Assoc. (2016) 17:789–96. doi: 10.1016/j.jamda.2016.04.019
112. Farmer SR. Brown fat and skeletal muscle: unlikely cousins? Cell. (2008) 134:726–7. doi: 10.1016/j.cell.2008.08.018
113. Mattsson P, Lönnstedt I, Nygren I, Askmark H. Physical fitness, but not muscle strength, is a risk factor for death in amyotrophic lateral sclerosis at an early age. J Neurol Neurosurg Psychiatry. (2012) 83:390–4. doi: 10.1136/jnnp.2010.218982
114. Kim BW, Jeong YE, Wong M, Martin LJ. DNA damage accumulates and responses are engaged in human ALS brain and spinal motor neurons and DNA repair is activatable in iPSC-derived motor neurons with SOD1 mutations. Acta Neuropathol Commun. (2020) 8:7. doi: 10.1186/s40478-019-0874-4
Keywords: rapsyn, motor neuron, DNA damage, aging, TDP-43
Citation: Martin LJ and Wong M (2020) Skeletal Muscle-Restricted Expression of Human SOD1 in Transgenic Mice Causes a Fatal ALS-Like Syndrome. Front. Neurol. 11:592851. doi: 10.3389/fneur.2020.592851
Received: 10 August 2020; Accepted: 19 November 2020;
Published: 14 December 2020.
Edited by:
Xin-Ming Shen, Mayo Clinic, United StatesReviewed by:
Kinji Ohno, Nagoya University, JapanJean-Philippe Loeffler, Institut National de la Santé et de la Recherche Médicale (INSERM), France
Copyright © 2020 Martin and Wong. This is an open-access article distributed under the terms of the Creative Commons Attribution License (CC BY). The use, distribution or reproduction in other forums is permitted, provided the original author(s) and the copyright owner(s) are credited and that the original publication in this journal is cited, in accordance with accepted academic practice. No use, distribution or reproduction is permitted which does not comply with these terms.
*Correspondence: Lee J. Martin, bWFydGlubEBqaG1pLmVkdQ==