 Bidhan Lamichhane1*
 Andy G. S. Daniel2
 John J. Lee3
 Daniel S. Marcus3
 Joshua S. Shimony3
 Eric C. Leuthardt1,2,4,5,6,7*
- 1Department of Neurological Surgery, Washington University School of Medicine, St. Louis, MO, United States
- 2Department of Biomedical Engineering, Washington University in St. Louis, St. Louis, MO, United States
- 3Mallinckrodt Institute of Radiology, Washington University School of Medicine, St. Louis, MO, United States
- 4Department of Neuroscience, Washington University School of Medicine, St. Louis, MO, United States
- 5Department of Mechanical Engineering and Materials Science, Washington University in St. Louis, St. Louis, MO, United States
- 6Center for Innovation in Neuroscience and Technology, Washington University School of Medicine, St. Louis, MO, United States
- 7Brain Laser Center, Washington University School of Medicine, St. Louis, MO, United States
Glioblastoma multiforme (GBM) is the most frequently occurring brain malignancy. Due to its poor prognosis with currently available treatments, there is a pressing need for easily accessible, non-invasive techniques to help inform pre-treatment planning, patient counseling, and improve outcomes. In this study we determined the feasibility of resting-state functional connectivity (rsFC) to classify GBM patients into short-term and long-term survival groups with respect to reported median survival (14.6 months). We used a support vector machine with rsFC between regions of interest as predictive features. We employed a novel hybrid feature selection method whereby features were first filtered using correlations between rsFC and OS, and then using the established method of recursive feature elimination (RFE) to select the optimal feature subset. Leave-one-subject-out cross-validation evaluated the performance of models. Classification between short- and long-term survival accuracy was 71.9%. Sensitivity and specificity were 77.1 and 65.5%, respectively. The area under the receiver operating characteristic curve was 0.752 (95% CI, 0.62–0.88). These findings suggest that highly specific features of rsFC may predict GBM survival. Taken together, the findings of this study support that resting-state fMRI and machine learning analytics could enable a radiomic biomarker for GBM, augmenting care and planning for individual patients.
Introduction
Glioblastoma multiforme (GBM) is the most frequently occurring brain malignancy. The median survival time is very poor, ranging from 12 to 14.6 months following diagnosis and after receiving the therapeutic standard of care (1, 2). Only 3–5% of GBM patients survive longer than 3 years after diagnosis (3). Facing such abbreviated lifespans, decisions of care balancing aggressiveness of treatment with impacts on quality of life, are critical to patients. As a result, the identification of novel prognostic biomarkers may have substantial and meaningful impact for individual patients making decisions for their terminal care.
Currently, a tissue diagnosis is required for definitive histopathologic confirmation and optimizing the next steps of care. Factors currently known to be associated with survival include age, Karnofsky performance status (KPS) (4), O6-methylguanine–DNA methyltransferase promoter (MGMT) hypermethylation (5), and mutations in isocitrate dehydrogenase (IDH) 1 or 2 (6, 7). Furthermore, gene expression–based molecular classification of GBM (8), epidermal growth factor receptor amplification (EGFR) (9) and CpG island methylator phenotype status have emerged as additional potential predictors of treatment response and outcome (10). Although such molecular information has improved the clinical assessment of GBM and has been used to better inform clinical trials (5–8, 10, 11), there remains unmet clinical need for accessible, non-invasively acquired biomarkers that predict clinical prognosis and response to therapy for individual patients prior to surgical intervention and biopsy.
There are numerous efforts in imaging radiomics to map image features to molecular data. As an example, investigators have correlated quantitative computed tomography (CT) image features to gene expression data of non-small cell lung cancer to predict survival (12, 13). Similarly in GBM, prior work has demonstrated associations between imaging and gene expression (14). These insights have been used to predict response to treatment of gliomas (9). Further, by forming clustering patterns on structural MRI across patients, these patterns can be used to identify GBM phenotypic subtypes (15). In addition to the molecular and genetic features, the synaptic input of neurons on glioblastoma cells has been shown to be a powerful influence of promoting tumor growth (16). Currently, there is no imaging biomarker of this synaptic interaction.
Increasingly, it has become clear that brain networks and their alterations associated with GBM have an impact on survival. Stoecklein et al. demonstrated that resting-state functional connectivity (rsFC) measured by MRI is affected by gliomas throughout the whole brain and this information indicated individual glioma disease burden (17). Daniel et al. took these findings further to show that functionally connected voxels can be routinely found within glioblastoma tumors and that intra-tumor connectivity strength is a prognostic marker for overall survival (18). What is currently lacking is a methodology that leverages these group-level scientific findings and provides an actionable imaging biomarker that can inform and guide clinical care of individual patients.
In this study, we examined whether rsFC between pre-defined regions of interest (ROIs) can enable machine learning algorithms to predict overall survival (OS) for individual patients. For this, we used resting-state functional MRI with blood oxygen level-dependent (BOLD) signals acquired in 64 de novo GBM patients prior to standard of care treatment with surgery and chemoradiation. Retrospectively, patients' clinical course and rsFC between ROIs trained a support vector machine (SVM) to predict OS. In this work we provide evidence that the alterations of functional organization of the brain can provide insights into predicting a GBM patient's oncologic course.
Materials and Methods
Participants
A total of 64 patients with a pathologic diagnosis of GBM were included in this study. Patients were recruited from the neurosurgery brain tumor service, initially as part of a National Institutes of Health (NIH) funded tumor database project (NIH 5R01NS066905). Inclusion criteria stipulated that each patient was newly diagnosed with a brain tumor, that they underwent surgical treatment of the tumor, that the pathology was GBM, and that there was a pre-surgical indication for structural MRI and resting-state functional MRI as determined by the treating neurosurgeon. Exclusion criteria were age <18 years and prior surgery for a brain tumor. All patients provided written informed consent and the study was approved by the Institutional Review Board of the Washington University in St. Louis.
Group Construction and Patient Demographics
GBM patients were classified into two groups with respect to the median duration of OS: 14.6 months (1). Patients surviving <14.6 months were grouped as short-term survival (STS) while those surviving 14.6 months or longer were grouped as long-term survival (LTS). Demographic, clinical and molecular characteristics of STS and LTS groups are summarized in Table 1.
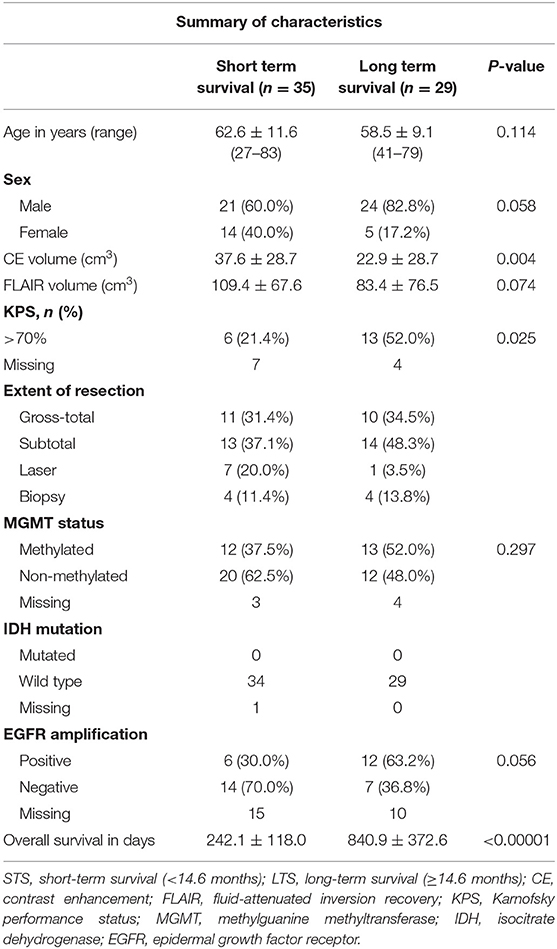
Table 1. Patients' demographic, clinical, and molecular characteristics of patient population by group.
MRI Acquisition
Imaging was done on Siemens Trio or Skyra MRI scanners operating at 3T. Patients were scanned using a standard presurgical tumor protocol. Structural imaging included T1-weighted magnetization prepared rapid acquisition gradient echo (MPRAGE) and T2-weighted fast spin-echo. Resting-state functional MRI was acquired using echo-planar imaging sequences (voxel size = 3 mm cubic; echo time = 27 ms; repetition time = 2.2–2.9 s; field of view = 256 mm; flip angle = 90°) for a total of 320 frames.
Resting-State Functional Connectivity (rsFC) Pre-processing
We used standard pre-processing approaches previously described (19, 20). Denoising methods included slice timing corrections which removed systematic slice intensity differences due to interleaved acquisition, and head motion corrections within and across runs. Atlas transformations were achieved by the composition of affine transforms connecting functional imaging volumes with T2-weighted and T1-weighted structural images. Thereby, we registered volumetric BOLD time series to an isotropic 3 mm atlas space. Additional preprocessing included spatial smoothing (isotropic 6 mm full-width half-maximum Gaussian blur), removal of linear temporal trends from voxels in each scanning run, and temporal low-pass filtering to retain frequencies <0.1 Hz. Spurious variances were reduced by regression of nuisance waveforms derived from head motion correction and time series sampled from regions of white matter and cerebrospinal fluid. The whole-brain (global) signal was removed as a nuisance regressor. Frame censoring was performed to minimize the impact of head motion on FC computations. Thus, for each volumetric frame, if the root-mean-square of voxel intensities within brain regions changed significantly compared to the previous frame, the frame was censored. Significant changes were defined as those that exceeded 0.5% of root-mean-square voxel intensities.
Resting-State Functional Connectivity (rsFC) Analysis
The BOLD time series for pre-defined volumetric ROIs were obtained by averaging the voxel time series within each ROI. The rsFC between any pair of ROIs was then defined as Pearson's product moment correlation coefficient between ROI-specified time series. We used the set of 300 ROIs from the study by Seitzman et al. [see (21), for detail]. Briefly summarized, this set of 300 spherical ROIs comprise 264 previously described ROIs (22) with the addition of subcortical and cerebellar ROIs. Thus, the ROI set comprised 239 cortical, 34 subcortical, and 27 cerebellar ROIs. The cortical ROIs belong to one of 13 resting-state networks (RSNs): the cingulo-opercular network (CO), frontoparietal network (FPN), dorsal attention network (DAN), ventral attention network (VAN), salience (SAL) network, somatomotor dorsal (SMD) network, somatomotor lateral (SML) network, visual (VIS) network, auditory (AUD) network, medial temporal lobe (MTL) network, reward (REW) network, parietomedial (PMe) network, the default-mode network (DMN), and cerebellum regions (all cerebellum ROIs). Finally, we identified a collection of twelve ROIs which overlapped with atlas regions for white matter and tentorium, excluding their assignment to any of the 13-resting state functional network. This was consistent with methodological precedence for avoiding confounding of resting-state inferences by ROIs encompassing non-gray matter (22), also see Supplementary Material. Thus, for each subject, a 288 × 288 functional connectivity (FC) matrix was computed.
Classification Using Machine Learning
We used the Caret package available within RStudio to implement our machine learning classifier [(23), rstudio.com]. We used a support vector machine (SVM) with linear kernel because of its favorable reported predictive performance in medical knowledge discovery with small amounts of training data (24). Because of the limited number of patients in the present study and our aim to minimizing bias in the estimate of classification accuracy, we used the leave-one-out (LOO) cross-validation method. An overview is illustrated in Figure 1. Our use of LOO cross-validation adhered to standard prescriptions for cross-validation implemented in the Caret package. For pedagogical overviews of cross-validation and SVM we recommend the cross-disciplinary textbook by Hastie et al. (25).
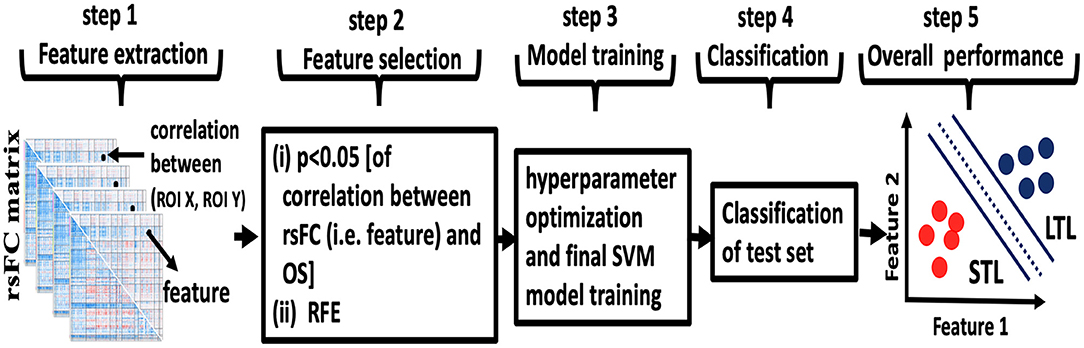
Figure 1. Overview of machine learning. Step 1: the rsFC matrix of size 288 × 288 was computed for each patient. The features were rsFC between pairs of ROIs (for example, the correlation between ROI X and ROI Y represented by dots in step 1). Step 2: feature selection was performed in two steps using only the lower triangular rsFC matrix to exclude self and symmetric connections. First (i), features with correlation with patients' days of overall survival OS (p < 0.05, uncorrected) were selected for heuristic filtering. Then (ii), recursive feature elimination (RFE) was used to select the best predicting feature subset. Step 3: hyperparameter optimization and final SVM model training was performed. Step 4: the trained model from the cross-validation fold was tested against the single held-out subject. Steps 1–4 were repeated for each fold of leave-one-out cross-validation. Step 5: following all cross-validation folds, accuracy, AUC, sensitivity, and specificity for the full sample set were computed.
This analysis included 64 patients, thus 64-folds of LOO cross-validations. For example, for the first cross-validation fold, all data from one patient were withheld and data from the 63 remaining patients were used for feature selection, training the SVM and tuning hyperparameters. Then, the fold-1 model was tested against the held-out data. In the next cross-validation fold, all data from a different patient were withheld and data from the 63 remaining patients were used for feature selection, retraining the SVM and retuning hyperparameters. Then, the fold-2 model was tested against the held-out data and so on until we predicted (tested) all 64-subjects by running such 64-folds.
The Pearson product moment correlation of 288 ROIs specified in section Resting-State Functional Connectivity (rsFC) Analysis is represented by a correlation matrix of size 288 × 288 (Figure 1, step 1). Diagonal matrix elements are exactly unity and non-informative while upper triangular matrix elements are symmetric to lower triangular matrix elements. Consequently, we count the informative correlations over ROIs to be 41,328, equivalent to number of combinations . We defined the Fisher z-transformation of this set of informative correlations to be the original features for rsFC. Since the number of original features, 41,328, is much higher than the number of patients, we used feature selection to avoid overfitting our SVM.
Feature selection was performed in two steps (26, 27) (Figure 1, step 2). First, using all patient training data (except the withheld subject's data), we computed the correlation of original features for rsFC to OS expressed as continuous time of survival. We discarded features with p-value >0.05 (uncorrected) for heuristic filtering. The p-value for correlations was not used for significance testing of any kind. Second, we used recursive feature elimination (RFE) (28) which also ranks features according to their predictive ability. However, features tend to also be correlated with one another and so the multivariate discriminant classifier retains high dimensionality. RFE repeatedly, and recursively, evaluates the rank of features for predictively ability, eliminating the worst performing features. Within the RFE framework, we used 4-fold internal cross-validation (not to be confused with external LOO cross-validation) with ten iterations to obtain ranked selected features for rsFC. Internal cross-validations and iterations are necessary for RFE to correctly eliminate large numbers of features. Using heuristic p-value filtering and RFE, we reduced rsFC features from 41,328 to the best performing features subset. Our strategy submitted these best performing features to SVM.
As with other machine learning algorithms, SVM may perform poorly until hyperparameters are tuned for the problem domain. The caret package enabled tuning SVM scaling and model complexity cost using grid search (Figure 1, step3). Thus, the main parameters, the cost in case of linear SVM, was estimated by using the grid-search algorithm at the scale of c = 1:10. We used 4-fold cross-validation for hyperparameter tuning following feature extraction, feature selection (p-value filtration and RFE), and in model training. Following training on 63 patients of the training set from LOO, we tested classification performance on the single held-out patient of the test set from LOO (Figure 1, step 4). Upon completion of 64 LOO folds, we ascertained the performance of the final classifier, computing accuracy, specificity and sensitivity values using the standard confusion matrix (see Supplementary Material for detail). To evaluate overall model performance, we also performed Receiver-operating Characteristic (ROC) curve analysis.
Results
A total of 64 patients diagnosed with de novo GBM were partitioned into two groups, STS and LTS, based on overall survival (OS). The summary of patient's clinical, molecular, and genetic characteristic of present sample were also reported in Table 1. To test the significance of differences in summary characteristics between two groups, we performed the Mann-Whitney U-test (for the continuous variables; age, CE and FLAIR volume, KPS) and Fisher's exact test (for the categorical variables: Sex, MGMT status, IDH mutation, EGFR) and p-value of resultant test were also reported (Table 1). Furthermore, the heterogeneity of GBM location, size, and morphology is illustrated in Figure 2. These heatmaps represent the distribution of tumor density in the entire patient cohort as defined by contrast-enhanced (CE) T1w boundaries segmented by using the software application ITK-SNAP (29). The distribution shows no systematic asymmetry or focality that could significantly bias the results.
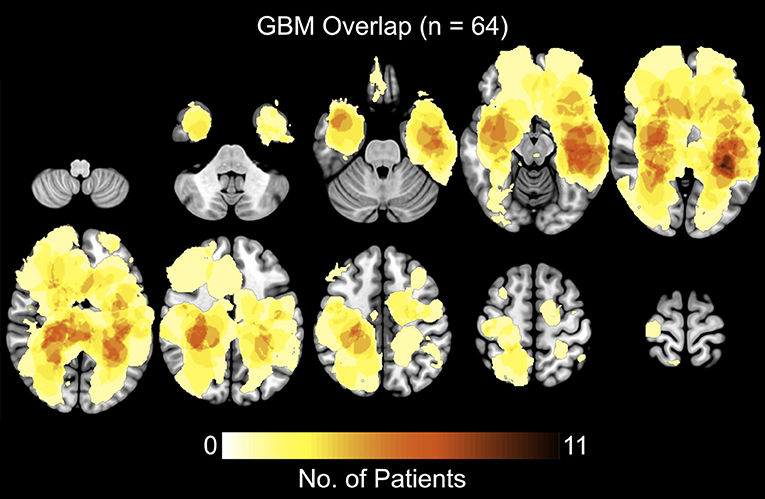
Figure 2. Heatmaps showing the distribution of tumor density, defined by contrast-enhanced (CE) T1w boundaries, in the full sample of 64 patients.
Correlation Between Resting-State Functional Connectivity and Overall Survival (OS)
Figure 3 illustrates how each element of the matrix of canonical functional connectivities correlates with OS. That is, for each element of functional connectivity between ROIs, the vector of measured functional connectivities for 64 patients was correlated with the vector of days of OS for the patients. Please note that the surface color in the Figure 3 represents the correlation between OS and ROI-to-ROI rsFC. Figure 3 demonstrates that there are no obvious patterns by which OS may be inferred directly from rsFC. Matrix elements in red denoting positive correlations with OS intersperse with matrix elements in blue denoting negative correlations with OS. This absence of semantic patterns motivates techniques of feature reduction and inference by machine learning. The strategy of heuristic filtering using uncorrected p-values <0.05 pruned 41,328 unique matrix elements to ~1,550 selected matrix elements (the number may change slightly from the fold to fold of LOO cross-validation). The strategy of wrapping using RFE pruned selected matrix elements to just 60 using a principled feature reduction technique (28). The 60 final matrix elements were given to SVM for classification (also see Supplementary Material for details)
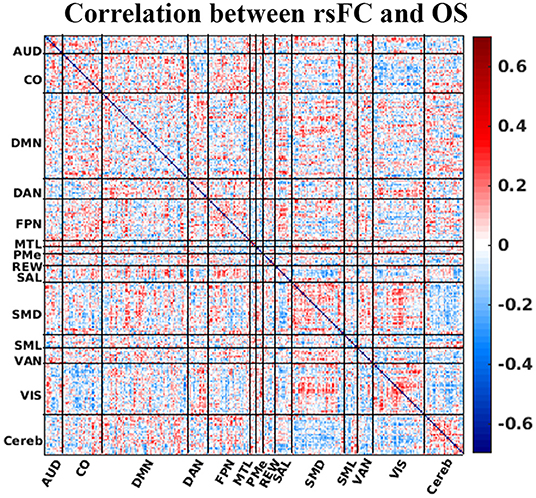
Figure 3. Correlation between rsFC (Fisher's z transformed pairwise ROI correlation) and OS. The horizontal and vertical axis of the plot is the ROI number sorted by the resting-state network. The surface color represents the correlation between OS and ROI-to-ROI rsFC. Correlation strength between ROI pair and OS is represented by colorbar. AUD, auditory; CO, cingulo-opercular; DMN, default-mode network; DAN, dorsal attention network; FPN, frontoparietal network; MTL, medial temporal lobe; PMe, parietomedial network; REW, reward network; SAL, salience network; SMD, somatomotor dorsal network; SML, somatomotor lateral network; VAN, ventral attention network; VIS, visual network; and Cereb, cerebellum regions (all).
Machine Learning Classification of Short-Term Survival (STS) and Long-Term Survival (LTS) GBM Patients
The performance of our classification schemes in predicting short vs. long term survival are presented in Table 2. Briefly; within-patient classification accuracy was 71.88%. Similarly, the sensitivity and specificity were 77.14 and 65.52%, respectively. The area under the curve (AUC) value was 0.752 (95% CI, 0.62–0.88). The receiver operating characteristic (ROC) curves for stratifying patients is shown in Figure 4.
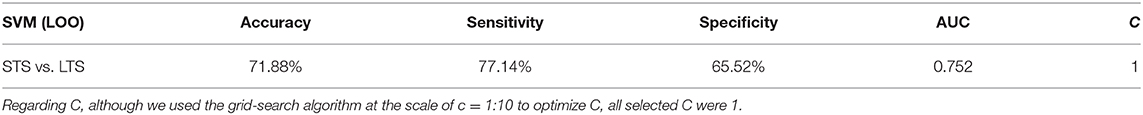
Table 2. Classification performance summary of SVM classifier.
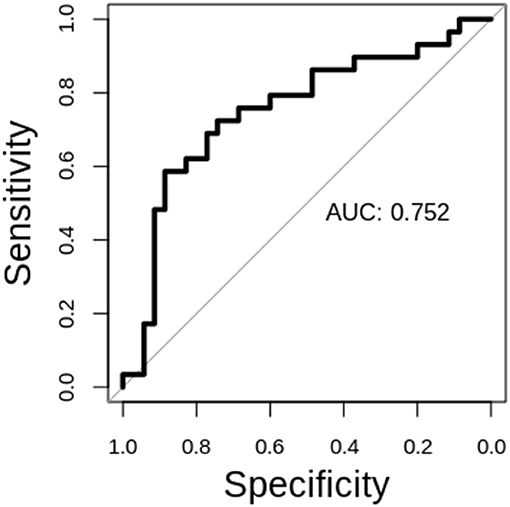
Figure 4. ROC analysis for the STS vs. LTS classification.
The Most Predictive Features
In order to assess the predictive contribution of each features, we sorted the top 60 contributing features as follows. During model training, feature selection was performed on the training set within each LOO fold, producing variations of selected features across cross-validation folds. We stored the 60 top-ranking features from SVM-RFE from each LOO fold. We then sorted features according to their frequency of occurrence in all 64 LOO folds. Figure 5 illustrates, as network adjacency maps, the RSN distribution of the selected features using vertices for ROIs (node) and edges for correlations of selected features with OS. Of the top 60 features, 27 were reproducibly found in all 64 LOO folds, invariant to tumor and physiologic variability across patients [for completeness, anatomical distribution of these top 60 and 27 shared features (separately) were also plotted, see Supplementary Figures 1, 2, respectively].
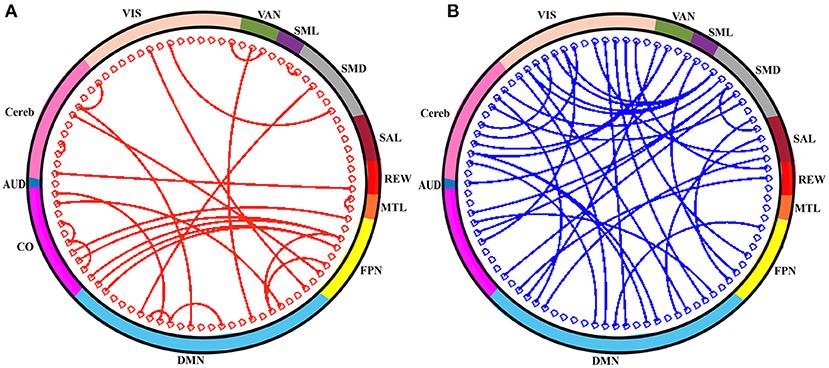
Figure 5. The top-60 frequently selected features are shown in circle. (A) Red connection (line) indicates the positive correlation of connections (i.e., rsFC) with OS and that of negatively correlated connections are in blue (B). The color of the outer sphere represents the resting-state network (RSN) that the ROIs belongs to. AUD, auditory; CO, cingulo-opercular network; DMN, default-mode network; FPN, frontoparietal network; MTL, medial temporal lobe; REW, reward network; SAL, salience network; SMD, somatomotor dorsal network; SML, somatomotor lateral network; VAN, ventral attention network; VIS, visual network; and Cereb, cerebellum regions (all).
Discussion
Anatomic and functional imaging currently is routinely utilized prior to and during the resection of brain tumors. This technology has been shown to improve the extent of tumor resection (30), and as a result, improve survival statistics (31). That said, it is not routine prior to resections to make use of imaging that reflect the functional organization of the brain and its interaction with the tumor to provide insight into long-term prognosis. Beyond, guiding the specific surgery per se, deep insight into the aggressiveness of the tumor informs fundamental decision making about the total course of care. Historically, task-based fMRI has been employed as a means of pre-operatively localizing function (32). During the past decade, it has been shown that the representation of multiple motor, sensory, and cognitive functions can be mapped by analysis of intrinsic brain activity, acquisition of which requires only that the patient hold still during fMRI (33–35). Thus, resting-state fMRI provides a much more complete functional map of the brain than does task-based fMRI; moreover, rs-fMRI is more reliable and much more time-efficient. Finally, the robustness of this mapping modality enables the identification of functional tissue both within a tumor (providing insight into glial-neuronal interactions) and throughout the brain (providing measures of global functional distortions (17, 18, 36–38), What has remained a challenge has been dealing with the complexity and magnitude of the resting-state fMRI data to provide reliable and actionable insights that can enhance clinical care.
Machine learning approaches creates the opportunity to organize large amounts of data to support more generalized and actionable interpretations. In the context of prognostic radiomics for GBM there are several considerations that merit attention. First, in the supervised context, as done in this work, predictions were formulated by direct comparisons of abundant functional data and outcome measurements. Recursive feature elimination (RFE) with support vector machines (SVM) were chosen because they outperformed many popular classification algorithms in a survey of neuroimaging studies of brain disorders: simple thresholding, centroid methods, minimum distance, discriminant function analysis, Gaussian process, spectral clustering, fused lasso, random forests, perceptrons, stacked auto-encoder neural networks, SVM without RFE (39, 40). Second, appropriately selecting features, which determine the dimensionality of a machine learning model, is critical for SVM in the face of limited outcome data, such as the OS of GBM patients. Valid selection of features can help increase prediction accuracies and can also help interpretability. This work made use of a heuristic filtering method that calculated correlations and used uncorrected p-values to prune features. RFE then served as a wrapper method to further prune features that were most appropriate for the problem of predicting OS for GBM patients. Third, a linear SVM provided classification. While our feature selection choices provided limited interpretability of feature subsets (network topographies and patterns in neuroanatomy were not evident), feature selection did improve clinically relevant prediction accuracies. Specifically, this work demonstrated that patients with GBM can be partitioned into short term and long-term survival groups using features extracted from resting-state fMRI (Table 2 and Figure 4). These findings complement previous work demonstrating the potential of rsFC as a biomarker of OS in GBM patients (18). Notably, this work demonstrates predictions of OS for individual patients.
While the prediction of OS is clinically important a caution is warranted in interpreting the features used to make those predictions because of the nature of support vectors in determining decision hypersurfaces in high-dimensional data. The 60 most frequently selected features are plotted in Figure 5 (anatomical distribution of these features is also plotted, see Supplementary Figure 1). Unlike other methods, such as linear discriminant analysis in which features are ascribed shared covariances that occupy the space of dominant features, our use of RFE-SVM selects features which serve as kernel bases optimally separating features which are most ambiguous along the decision boundary. Consequently, while having optimal benefits for generating decision hypersurfaces, our selected features for rsFC in fact visualize anatomy and network adjacencies that are most ambiguous for predicting OS. The difficulty of interpreting features selected by machine learning algorithms is a common problem of neuroimaging research. Many features contribute to the classification of OS because of the complexity of factors that determine OS. Broadly distributed features have been found in many previous investigations of rsFC in GBM patients (41–43).
FC studies have markedly advanced our knowledge of human brain function and its organization. Thus, rsFC has been used to characterize individuals' functional brain organization in patients with a broad range of neurosurgical diseases including GBM. Relatively recently, there were reports of significant alteration of brain functional connectivity in GBM (42, 43). We, for the first time, directly tested the relationship of such changes with OS in GBM patients (Figure 3). We emphasize the advantages of rsFC over task-based MRI. For instance, resting-state functional MRI can be acquired in patients that are unable to cooperate with a task, such as cognitively impaired patients as they do not need to perform a task (20, 44, 45). Moreover, task-based fMRI conventionally is restricted to mapping the representation of motor and speech function, which omits other important functions (e.g., executive function, attention, etc.) and does not perform a whole brain assessment. Even the waking state during fMRI is not required as essentially the same functional maps are obtained even if the patient is asleep or sedated (46–48). Thus, rsFC provides information complementary to that obtained from structural imaging of brain tumors. Notably, rsFC throughout the brain is affected by gliomas, even in the non-lesional hemisphere (41–43). This was one of the key motivations for this study.
To our knowledge, no previous studies have examined correlations between rsFC and individual OS as a filtering heuristic. While weak correlations have no role for testing hypothesis, they can provide intermediate data for consumption by more principled algorithms, such as RFE and SVM. These weak correlative relationships may be interpretable in the context that functional connectivity across networks correlates with a patient's cognitive function (41, 49, 50). In cases of high grade GBM, reports describe marked decline in neurocognitive functioning during the course of a patient's disease (51). Moreover, poorer performance on initial cognitive testing is associated with shorter survival (52). Here we demonstrate that a trained SVM predicts short and long-term survival in GBM patients based on rsFC measures. Previous work in GBM patients have shown that cognitive impairment in GBM patients can be associated with both increases and decreases in rsFC (53, 54).
The ability of several rsFC ROI pairs to predict OS further extends our previous report that intratumor rsFC may be a prognostic marker for overall survival (18). This finding aligned with previous reports that brain tumors can lead to various cognitive deficits and are related to alterations in local and interhemispheric rsFC across functional networks (49, 50, 55, 56). Here we showed that particular ROI-pair dependent reductions and increases in rsFC are associated with OS prediction, suggesting that connectivity alterations at specific cortical locations play an important role in influencing outcomes. Thus, local and global rsFC changes in GBM patients may act as a biomarker for prognosis and disease monitoring.
Limitations
A common deficiency of neuroimaging studies is limitations of sample size in the presence of data with high dimensional sets of features (57). The difficulties of machine learning methods under these restrictions include overfitting and the inability to adequately represent the complexity of the underlying study problem. Feature selection did not account for tumor location, tumor staging, tumor grading, and aspects of patient demography, such as age, sex, and ethnicity. However, inclusion of such additional features in the classifier are likely to improve the performance of the classifier described in this work. There remain issues regarding reproducibility and generalizability of results. Partial solutions include recruiting larger numbers of patients for study and testing models with unseen data. In this work, we used LOO on all available patient data.
Conclusion and Future Work
In summary, our results demonstrate that resting-state functional connectivity provides prognostic biomarkers for individual patients with GBM. This work demonstrates prognostic classification of short-term survival vs. long-term survival and suggests how future work may attain more precise predictions of years of survival for individual patients. Such efforts may require extensive longitudinal data to attain clinical utility but such precision predictions would have substantial and meaningful impact for patients with GBM making decisions for their terminal care.
Data Availability Statement
Tumor data will be made available upon request to Eric C. Leuthardt.
Ethics Statement
The studies involving human participants were reviewed and approved by Institutional Review Board of the Washington University in St. Louis. The patients/participants provided their written informed consent to participate in this study.
Author Contributions
BL and EL designed the study. AD, BL, and DM collected and assembled the data. JL and JS assisted in pre-processing of the data. BL and AD performed the post-processing data analysis. BL prepared the first draft. All authors critically reviewed and edited the manuscript.
Funding
This research was supported by the National Cancer Institute of the National Institute for Health via grant R01CA203861.
Conflict of Interest
EL has equity in Neurolutions, Inner Cosmos, and Sora Neuroscience. Washington University has equity in Neurolutions. DM owns stock in Radiologics and Sora Neuroscience.
The remaining authors declare that the research was conducted in the absence of any commercial or financial relationships that could be construed as a potential conflict of interest.
Acknowledgments
We would like to thank EL's, JS's, and DM's lab team for helpful input and discussions regarding the data analysis of this study.
Supplementary Material
The Supplementary Material for this article can be found online at: https://www.frontiersin.org/articles/10.3389/fneur.2021.642241/full#supplementary-material
References
1. Stupp R, Mason WP, van den Bent MJ, Weller M, Fisher B, Taphoorn MJB, et al. Radiotherapy plus concomitant and adjuvant temozolomide for glioblastoma. N Engl J Med. (2005) 352:987–96. doi: 10.1056/NEJMoa043330
2. Stupp R, Hegi ME, Mason WP, van den Bent MJ, Taphoorn MJ, Janzer RC, et al. Effects of radiotherapy with concomitant and adjuvant temozolomide versus radiotherapy alone on survival in glioblastoma in a randomised phase III study: 5-year analysis of the EORTC-NCIC trial. Lancet Oncol. (2009) 10:459–66. doi: 10.1016/S1470-2045(09)70025-7
3. Krex D, Klink B, Hartmann C, Von Deimling A, Pietsch T, Simon M, et al. Long-term survival with glioblastoma multiforme. Brain. (2007) 130:2596–606. doi: 10.1093/brain/awm204
4. Laws ER, Parney IF, Huang W, Anderson F, Morris AM, Asher A, et al. Survival following surgery and prognostic factors for recently diagnosed malignant glioma: data from the glioma outcomes project. J Neurosurg. (2003) 99:467–73. doi: 10.3171/jns.2003.99.3.0467
5. Hegi ME, Liu L, Herman JG, Stupp R, Wick W, Weller M, et al. Correlation of O6-methylguanine methyltransferase (MGMT) promoter methylation with clinical outcomes in glioblastoma and clinical strategies to modulate MGMT activity. J Clin Oncol. (2008) 26:4189–99. doi: 10.1200/JCO.2007.11.5964
6. Sanson M, Marie Y, Paris S, Idbaih A, Laffaire J, Ducray F, et al. Isocitrate dehydrogenase 1 codon 132 mutation is an important prognostic biomarker in gliomas. J Clin Oncol. (2009) 27:4150–4. doi: 10.1200/JCO.2009.21.9832
7. Yan H, Parsons DW, Jin G, McLendon R, Rasheed BA, Yuan W, et al. IDH1 and IDH2 mutations in gliomas. N Engl J Med. (2009) 360:765–73. doi: 10.1056/NEJMoa0808710
8. Verhaak RGW, Hoadley KA, Purdom E, Wang V, Qi Y, Wilkerson MD, et al. Integrated genomic analysis identifies clinically relevant subtypes of glioblastoma characterized by abnormalities in PDGFRA, IDH1, EGFR, and NF1. Cancer Cell. (2010) 17:98–110. doi: 10.1016/j.ccr.2009.12.020
9. Haas-Kogan DA, Prados MD, Tihan T, Eberhard DA, Jelluma N, Arvold ND, et al. Epidermal growth factor receptor, protein kinase B/Akt, and glioma response to erlotinib. J Natl Cancer Inst. (2005) 97:880–7. doi: 10.1093/jnci/dji161
10. Noushmehr H, Weisenberger DJ, Diefes K, Phillips HS, Pujara K, Berman BP, et al. Identification of a CpG island methylator phenotype that defines a distinct subgroup of glioma. Cancer Cell. (2010) 17:510–22. doi: 10.1016/j.ccr.2010.03.017
11. Sturm D, Witt H, Hovestadt V, Khuong-Quang DA, Jones DTW, Konermann C, et al. Hotspot mutations in H3F3A and IDH1 Define distinct epigenetic and biological subgroups of glioblastoma. Cancer Cell. (2012) 22:425–37. doi: 10.1016/j.ccr.2012.08.024
12. Gevaert O, Xu J, Hoang CD, Leung AN, Xu Y, Quon A, et al. Non-small cell lung cancer: identifying prognostic imaging biomarkers by leveraging public gene expression microarray data–methods and preliminary results. Radiology. (2012) 264:387–96. doi: 10.1148/radiol.12111607
13. Nair VS, Gevaert O, Davidzon G, Napel S, Graves EE, Hoang CD, et al. Prognostic PET 18F-FDG uptake imaging features are associated with major oncogenomic alterations in patients with resected non-small cell lung cancer. Cancer Res. (2012) 72:3725–34. doi: 10.1158/0008-5472.CAN-11-3943
14. Gevaert O, Mitchell LA, Achrol AS, Xu J, Echegaray S, Steinberg GK, et al. Glioblastoma multiforme: exploratory radiogenomic analysis by using quantitative image features. Radiology. (2014) 273:168–74. doi: 10.1148/radiol.14131731
15. Itakura H, Achrol AS, Mitchell LA, Loya JJ, Liu T, Westbroek EM, et al. Magnetic resonance image features identify glioblastoma phenotypic subtypes with distinct molecular pathway activities. Sci Transl Med. (2015) 7:1–11. doi: 10.1126/scitranslmed.aaa7582
16. Venkatesh HS, Morishita W, Geraghty AC, Silverbush D, Woo PJ, Taylor KR, et al. Electrical and synaptic integration of glioma into neural circuits. Nature. (2020) 573:539–45. doi: 10.1038/s41586-019-1563
17. Stoecklein VM, Stoecklein S, Galiè F, Ren J, Schmutzer M, Unterrainer M, et al. Resting-state fMRI detects alterations in whole brain connectivity related to tumor biology in glioma patients. Neuro Oncol. (2020) 22:1388–98. doi: 10.1093/neuonc/noaa044
18. Daniel AGS, Park KY, Roland JL, Dierker D, Gross J, Humphries JB, et al. Functional connectivity within glioblastoma impacts overall survival. Neuro Oncol. (2020) 1–10. doi: 10.1093/neuonc/noaa189
19. Power JD, Mitra A, Laumann TO, Snyder AZ, Schlaggar BL, Petersen SE. Methods to detect, characterize, and remove motion artifact in resting state fMRI. Neuroimage. (2014) 84:320–41. doi: 10.1016/j.neuroimage.2013.08.048
20. Leuthardt EC, Guzman G, Bandt SK, Hacker C, Vellimana AK, Limbrick D, et al. Integration of resting state functional MRI into clinical practice–a large single institution experience. PLoS ONE. (2018) 13:e0198349. doi: 10.1371/journal.pone.0198349
21. Seitzman BA, Gratton C, Marek S, Raut RV, Dosenbach NUF, Schlaggar BL, et al. A set of functionally-defined brain regions with improved representation of the subcortex and cerebellum. Neuroimage. (2020) 206:116290. doi: 10.1016/j.neuroimage.2019.116290
22. Power JD, Cohen AL, Nelson SM, Wig GS, Barnes KA, Church JA, et al. Functional network organization of the human brain. Neuron. (2011) 72:665–78. doi: 10.1016/j.neuron.2011.09.006
23. Kuhn M. Building predictive models in R using the caret package. J Stat Softw. (2008) 28:1–26. doi: 10.18637/jss.v028.i05
24. Arslan AK, Colak C, Sarihan ME. Different medical data mining approaches based prediction of ischemic stroke. Comput Methods Programs Biomed. (2016) 130:87–92. doi: 10.1016/j.cmpb.2016.03.022
25. Hastie T, Tibshirani R, Friedman J. The Elements of Statistical Learning (Sections 7.10 and Chapter 12). 2nd ed. New York, NY: Springer US (2008).
26. Chen G, Ward BD, Xie C, Li W, Wu Z, Jones JL, et al. Classification of Alzheimer disease, mild cognitive impairment, and normal cognitive status with large-scale network analysis based on resting-state functional MR imaging. Radiology. (2011) 259:213–21. doi: 10.1148/radiol.10100734
27. Liu F, Xie B, Wang Y, Guo W, Fouche JP, Long Z, et al. Characterization of post-traumatic stress disorder using resting-state fMRI with a multi-level parametric classification approach. Brain Topogr. (2014) 28:221–37. doi: 10.1007/s10548-014-0386-2
28. Guyon I, Weston J, Barnhill S. Gene selection for cancer classification using support vector machines. Mach Learn. (2002) 46:389–422. doi: 10.1023/A:1012487302797
29. Yushkevich PA, Piven J, Hazlett HC, Smith RG, Ho S, Gee JC, et al. User-guided 3D active contour segmentation of anatomical structures: significantly improved efficiency and reliability. Neuroimage. (2006) 31:1116–28. doi: 10.1016/j.neuroimage.2006.01.015
30. Slavin KV. Neuronavigation in neurosurgery: current state of affairs. Expert Rev Med Devices. (2008) 5:1–3. doi: 10.1586/17434440.5.1.1
31. Lacroix M, Abi-Said D, Fourney DR, Gokaslan ZL, Shi W, DeMonte F, et al. A multivariate analysis of 416 patients with glioblastoma multiforme: prognosis, extent of resection, and survival. J Neurosurg. (2001) 95:190–8. doi: 10.3171/jns.2001.95.2.0190
32. McGirt MJ, Mukherjee D, Chaichana KL, Than KD, Weingart JD. Quinones-Hinojosa A. Association of surgically acquired motor and language deficits on overall survival after resection of glioblastoma multiforme. Neurosurgery. (2009) 65:463–70. doi: 10.1227/01.NEU.0000349763.42238.E9
33. Lee MH, Hacker CD, Snyder AZ, Corbetta M, Zhang D, Leuthardt EC, et al. Clustering of resting state networks. PLoS ONE. (2012) 7:e40370. doi: 10.1371/journal.pone.0040370
34. Hacker CD, Laumann TO, Szrama NP, Baldassarre A, Snyder AZ, Leuthardt EC, et al. Resting state network estimation in individual subjects. Neuroimage. (2013) 82:616–33. doi: 10.1016/j.neuroimage.2013.05.108
35. Mitchell TJ, Hacker CD, Breshears JD, Szrama NP, Sharma M, Bundy DT, et al. A novel data-driven approach to preoperative mapping of functional cortex using resting-state functional magnetic resonance imaging. Neurosurgery. (2013) 73:963–9. doi: 10.1227/NEU.0000000000000141
36. Håberg A, Kvistad KA, Unsgård G, Haraldseth O. Preoperative blood oxygen level-dependent functional magnetic resonance imaging in patients with primary brain tumors: clinical application and outcome. Neurosurgery. (2004) 54:902–5. doi: 10.1227/01.neu.0000114510.05922.f8
37. Derks J, Dirkson AR, de Witt Hamer PC, van Geest Q, Hulst HE, Barkhof F, et al. Connectomic profile and clinical phenotype in newly diagnosed glioma patients. Neuroimage Clin. (2017) 14:87–96. doi: 10.1016/j.nicl.2017.01.007
38. Liu L, Zhang H, Wu J, Yu Z, Chen X, Rekik I, et al. Overall survival time prediction for high-grade glioma patients based on large-scale brain functional networks. Brain Imaging Behav. (2019) 13:1333–51. doi: 10.1007/s11682-018-9949-2
39. Arbabshirani MR, Plis S, Sui J, Calhoun VD. Single subject prediction of brain disorders in neuroimaging: promises and pitfalls. Neuroimage. (2017) 145:137–65. doi: 10.1016/j.neuroimage.2016.02.079
40. Qiao C, Lu L, Yang L, Kennedy PJ. Identifying brain abnormalities with schizophrenia based on a hybrid feature selection technology. Appl Sci. (2019) 9:1–23. doi: 10.3390/app9102148
41. Maesawa S, Bagarinao E, Fujii M, Futamura M, Motomura K, Watanabe H, et al. Evaluation of resting state networks in patients with gliomas: connectivity changes in the unaffected side and its relation to cognitive function. PLoS ONE. (2015) 10:e0118072. doi: 10.1371/journal.pone.0118072
42. Catalino MP, Yao S, Green DL, Laws ER, Golby AJ, Tie Y. Mapping cognitive and emotional networks in neurosurgical patients using resting-state functional magnetic resonance imaging. Neurosurg Focus. (2020) 48:E9. doi: 10.3171/2019.11.FOCUS19773
43. Manan HA, Franz EA, Yahya N. Functional connectivity changes in patients with brain tumours—a systematic review on resting state-fMRI. Neurol Psychiatry Brain Res. (2020) 36:73–82. doi: 10.1016/j.npbr.2020.03.003
44. Rosazza C, Aquino D, D'Incerti L, Cordella R, Andronache A, Zacà D, et al. Preoperative mapping of the sensorimotor cortex: comparative assessment of task-based and resting-state fMRI. PLoS ONE. (2014) 9:e98860. doi: 10.1371/journal.pone.0098860
45. Lee MH, Miller-Thomas MM, Benzinger TL, Marcus DS, Hacker CD, Leuthardt EC, et al. Clinical resting-state fMRI in the preoperative setting. Top Magn Reson Imaging. (2016) 25:11–8. doi: 10.1097/rmr.0000000000000075
46. Vincent JL, Patel GH, Fox MD, Snyder AZ, Baker JT, Van Essen DC, et al. Intrinsic functional architecture in the anaesthetized monkey brain. Nature. (2007) 447:83–6. doi: 10.1038/nature05758
47. Larson-Prior LJ, Zempel JM, Nolan TS, Prior FW, Snyder A, Raichle ME. Cortical network functional connectivity in the descent to sleep. Proc Natl Acad Sci USA. (2009) 106:4489–94. doi: 10.1073/pnas.0900924106
48. Breshears JD, Gaona CM, Roland JL, Sharma M, Bundy DT, Shimony JS, et al. Mapping sensorimotor cortex with slow cortical potential resting-state networks while awake and under anesthesia. Neurosurgery. (2012) 71:305–16. doi: 10.1227/NEU.0b013e318258e5d1
49. Fox ME, King TZ. Functional connectivity in adult brain tumor patients: a systematic review. Brain Connect. (2018) 8:381–97. doi: 10.1089/brain.2018.0623
50. Ghinda DC, Wu JS, Duncan NW, Northoff G. How much is enough—can resting state fMRI provide a demarcation for neurosurgical resection in glioma? Neurosci Biobehav Rev. (2018) 84:245–61. doi: 10.1016/j.neubiorev.2017.11.019
51. Bosma I, Vos MJ, Heimans JJ, Taphoorn MJB, Aaronson NK, Postma TJ, et al. The course of neurocognitive functioning in high-grade glioma patients. Neuro Oncol. (2007) 9:53–62. doi: 10.1215/15228517-2006-012
52. Johnson DR, Wefel JS. Relationship between cognitive function and prognosis in glioblastoma. CNS Oncol. (2013) 2:195–201. doi: 10.2217/cns.13.5
53. Lang S, Gaxiola-Va, Opoku-Darko M, Partlo LA, Goodyear BG, Kelly JJP, et al. Functional connectivity in frontoparietal network: indicator of preoperative cognitive function and cognitive outcome following surgery in patients with glioma. Srp Arh Celok Lek. (2017) 16:87–98. doi: 10.2298/SARH170718174T
54. Jütten K, Mainz V, Delev D, Gauggel S, Binkofski F, Wiesmann M, et al. Asymmetric tumor-related alterations of network-specific intrinsic functional connectivity in glioma patients. Hum Brain Mapp. (2020) 41:4549–61. doi: 10.1002/hbm.25140
55. Zhang N, Xia M, Qiu T, Wang X, Lin C, Guo Q, et al. Reorganization of cerebro-cerebellar circuit in patients with left hemispheric gliomas involving language network: a combined structural and resting-state functional MRI study. Hum. Brain Mapp. (2018) 39:4802–19. doi: 10.1002/hbm.24324
56. Yuan B, Zhang N, Yan J, Cheng J, Lu J, Wu J. Resting-state functional connectivity predicts individual language impairment of patients with left hemispheric gliomas involving language network. Neuroimage Clin. (2019) 24:102023. doi: 10.1016/j.nicl.2019.102023
Keywords: brain tumor, resting state functional connectivity, biomarker, overall survival, short and long-term survival, classification, support vector machine
Citation: Lamichhane B, Daniel AGS, Lee JJ, Marcus DS, Shimony JS and Leuthardt EC (2021) Machine Learning Analytics of Resting-State Functional Connectivity Predicts Survival Outcomes of Glioblastoma Multiforme Patients. Front. Neurol. 12:642241. doi: 10.3389/fneur.2021.642241
Received: 15 December 2020; Accepted: 03 February 2021;
Published: 22 February 2021.
Edited by:
Ravi Prakash Reddy Nanga, University of Pennsylvania, United StatesReviewed by:
Victoria M. Leavitt, Columbia University Irving Medical Center, United StatesBhim M. Adhikari, University of Maryland, Baltimore, United States
Copyright © 2021 Lamichhane, Daniel, Lee, Marcus, Shimony and Leuthardt. This is an open-access article distributed under the terms of the Creative Commons Attribution License (CC BY). The use, distribution or reproduction in other forums is permitted, provided the original author(s) and the copyright owner(s) are credited and that the original publication in this journal is cited, in accordance with accepted academic practice. No use, distribution or reproduction is permitted which does not comply with these terms.
*Correspondence: Eric C. Leuthardt, bGV1dGhhcmR0ZUB3dXN0bC5lZHU=; Bidhan Lamichhane, YmlkaGFubGFtaWNoaGFuZUB3dXN0bC5lZHU=