 Moritz Helsper1*
 Aashish Agarwal2Ahmet Aker2Annika Herten1Marvin Darkwah-Oppong1Oliver Gembruch1Cornelius Deuschl3Michael Forsting3
 Philipp Dammann1Daniela Pierscianek1
 Ramazan Jabbarli1Ulrich Sure1
 Karsten Henning Wrede1
- 1Department of Neurosurgery and Spine Surgery, University Hospital Essen, University of Duisburg-Essen, Essen, Germany
- 2Department of Computer Science and Applied Cognitive Science, University of Duisburg-Essen, Duisburg, Germany
- 3Institute of Diagnostic and Interventional Radiology and Neuroradiology, University of Duisburg-Essen, Essen, Germany
Objective: The frequency of aneurysmal subarachnoid hemorrhage (aSAH) presents complex fluctuations that have been attributed to weather and climate changes in the past. In the present long-term big data and deep learning analysis, we have addressed this long-held myth.
Methods: Bleeding dates and basic demographic data for all consecutive patients (n = 1,271) admitted to our vascular center for treatment of aSAH between January 2003 and May 2020 (6,334 days) were collected from our continuously maintained database. The meteorological data of the local weather station, including 13 different weather and climate parameters, were retrieved from Germany's National Meteorological Service for the same period. Six different deep learning models were programmed using the Keras framework and were trained for aSAH event prediction with meteorological data from January 2003 to June 2017, with 10% of this dataset applied for data validation and model improvement. The dataset from July 2017 to May 2020 was tested for aSAH event prediction accuracy for all six models using the area under the receiver operating characteristic curve (AUROC) as the metric.
Results: The study group comprised of 422 (33.2%) male and 849 (66.8%) female patients with an average age of 55 ± 14 years. None of the models showed an AUROC larger than 60.2. From the presented data, the influence of weather and climate on the occurrence of aSAH events is extremely unlikely.
Conclusion: The myth of special weather conditions influencing the frequency of aSAH is disenchanted by this long-term big data and deep learning analysis.
Introduction
Aneurysmal subarachnoid hemorrhage (aSAH) is a common cause of stroke with high mortality and morbidity. The worldwide annual incidence of aSAH is 7.9 per 100,000 person-years (1). The worldwide annual death toll of aSAH is approximately half a million people. The highest prevalence is in the age group of 35 to 60 years, and thus half of the patients affected are under 50 years of age (2). Known risk factors of cerebral aneurysms include smoking, arterial hypertension, congenital disorders of the connective tissues (e.g., “Marfans syndrome” or “Ehlers–Danlos syndrome”), positive family history of the disease, age (>40 years) as well as gender (male to female ratio: 2/3). Further risk factors are alcohol and drug abuse (particularly cocaine), polycystic kidney disease, and fibromuscular dysplasia (3, 4). Several scores such as “UIATS”, “ELAPSS,” or “PHASES” have been created to predict aneurysm growth and the rates of aSAH using those risk (5–7). However, numerous authors have attributed weather and climate to influence the occurrence of aSAH events (8–22). Unlike for the clear correlation between myocardial infarction and cold weather (23), the results of research on the incidence of aSAH succeeding weather and/or climate changes have been inconsistent. Over the last decades, starting in the 1980s (16), no general agreement could be established, and the persistent myth of “aneurysm weather” perseveres. Different study cohorts, geographical areas, study designs, and statistical methods have led to contradicting results. Computing power and the amount of research in big data analysis have been constantly increasing throughout the last decades. Deep learning data analysis has made its way into medical mainstream. The availability of large datasets allows event predictions, pattern recognition, and detailed image analysis. Consequently, these networks can aid clinicians for diagnosis and treatment and can, therefore, improve the quality of patient care (24). Several clinical applications have been reported in the last years, including analysis of electrocardiograms (25), diagnosis of pneumonia in chest X-rays (26), and virtual contrast application in cranial magnetic resonance imaging (27). In the field of neurosurgery, machine learning networks were used to predict the postoperative mortality rates of patients with spinal metastases (28). This study aimed to analyze a large range of weather and climate parameters and their effect on the occurrence of aSAH. The big data and deep learning approach allowed to the simultaneous analysis of 13 different weather and climate parameters and 1,271 aSAH events over a course of 6,334 days (83,613 data points).
The results are reported in accordance with the Strengthening the Reporting of Observational Studies in Epidemiology (STROBE) guidelines for reporting observational studies.
Methods
The University of Duisburg-Essen ethical committee authorized the study (registration number: 15-6331-BO), and all patients or their relatives provided written informed consent. The study was conducted according to the principles of the Declaration of Helsinki and was compliant with the Health Insurance Portability and Accountability Act.
Study Area and Inclusion Criteria
The neurovascular department at the University Hospital of Essen is one of the most frequented referral centers for patients with aneurysmal SAH in the Ruhr area. The region is densely populated with over five million inhabitants, located close to Germany's western border with the Netherlands. The climate in the area is moderate with four distinct seasons. The climate throughout the whole regions tends to not vary significantly due to the absence of large mountain ranges or other geographical weather disturbances. Data from 1,271 patients admitted to our neurovascular department for the treatment of aSAH between January 2003 and May 2020 were collected from our continuously maintained prospective database. Evaluation included bleeding dates, basic demographic data as well as 13 weather parameters for each day (6,334 days). The inclusion criteria were (a) radiographic verification of the bleeding source of aSAH (by digital subtraction angiography and/or computed tomography angiography) and (b) information about the exact date of the ictus.
Meteorological Data
Meteorological data was obtained from the closest weather station (Bredeney #1303), approximately 3 km southwest of our department. It was kindly provided by the Climate Data Center of the German meteorological service (Deutscher Wetterdienst). The following weather parameters were included: daily maximum wind speed (m/s), daily mean wind speed (m/s), daily amount of rainfall in (mm), daily amount of sunshine (hours), daily amount of snowfall (cm), mean daily vapor pressure (hPa), mean daily atmospheric pressure (hPa), mean daily humidity (%), mean daily temperature (°C), maximum and minimum daily temperature at 2 m above ground level (°C), minimum daily temperature at 5 cm aboveground (°C), and cloud coverage.
Data Preprocessing
Various techniques were applied to preprocess the data, including imputation of missing values using scikit-learn (29) and quantile-based discretization to smoothen the data by identifying outliers (30) using the Pandas software library (31). Standardization and Gaussian distribution with zero mean and unit variance were achieved with the scikit-learn library (29). Feature engineering allowed modeling the impact of changes in temperature from the previous day's maximum to the minimum of the next day as a trigger for SAH. The chi-square test was applied to determine significant associations between features (weather parameter) and class labels (ictus/no ictus). Pearson correlation coefficient was calculated to identify the correlation of different meteorological factors on admission days for aSAH.
Training, Validation, and Test Split
The meteorological dataset from January 2003 to June 2017 was used as training data, and 10% of the training data was selected to validate this data and improve the model. Meteorological data from July 2017 to May 2020 was chosen as test data. Sequence-to-sequence classification with sequence lengths of 5 days (2 days before and after the ictus) allowed the correction for bias from overlapping positive and negative classes.
Deep Learning Models
We used pattern recognition algorithms in six standard deep learning models that were implemented with the Keras framework for Python (32), Dense Autoencoder, bi-directional long short-term memory (Bi-LSTM), standard long short-term memory (LSTM), LSTM autoencoder, Dense (feed forward neural network), convolutional neural network (CNN), and CNN+LSTM.
One-Class Classification
In the context of neural networks, one-class classification is also called a “novelty detection technique.” It has been implemented extensively in the field of anomaly detection to classify rare events in cases with a large class imbalance. This technique considers either positive or negative instances instead of distinguishing between two classes. Autoencoders used for this purpose are trained to perform auto-associative mapping, that is, identity function. The classification is made based on a reconstruction error between the input and predicted output patterns, for example, Euclidean, Mahalanobis distance, absolute error, or the squared sum of errors. We used dense and LSTM-based autoencoders (33–35). In this type of classification, the sequence of information is not relevant. Therefore, features are extracted either from days with a bleeding event (in case of positive) or days without a bleeding event (in case of negative).
Two-Class Classification
In contrast to the previous technique, sequence-to-sequence-based classification models were applied. These models use the current input and also the previous values to calculate the result. Five days preceding each positive and negative day were included, resulting in a sequence of six consecutive days. These sequence-to-sequence models make the judgment based on the entire sequence. We investigated standard LSTM and also Bi-LSTM models (36–38). Bi-LSTM, in contrast to standard LSTM models, read the sequence from left to right and then right to left. Furthermore, we combined LSTM with CNN, which helps to extract more and more detailed features (39).
Evaluation Metrics and Testing
The overall accuracy, which is the proportion of test examples, is the metric that is most widely used to evaluate a classifier's performance. When a dataset is imbalanced, the accuracy will favor the overrepresented classes. This leads to misclassification. A measure of quality that addresses these issues is the AUROC (area under receiver operator characteristic). We used the AUROC as the main metric to compare the performance of classifiers trained with our datasets. However, for the purpose of evaluation, we also report precision (ratio of correctly predicted positive observations to the total predicted positive observations), recall (ratio of correctly predicted positive observations to all the observations in actual class), and F1 score (harmonic mean of precision and recall) along with the AUROC values.
Statistical Analysis
Data preprocessing, statistical analysis, and model training was implemented in Python (Version 3.6) (40). The Python libraries utilized for data preprocessing included Numpy (41), Pandas (42), and scikit-learn (29). Model training was implemented in the Keras library (32). Statistical analysis was carried out using the Seaborn (43) and MatplotLib (44) libraries.
Any data not published within the article is available in the public repository “figshare” (https://doi.org/10.6084/m9.figshare.14129960).
Results
The study group comprised 422 (33.2%) male and 849 (66.8%) female patients with an average age of 55 years (range, 19–94; SD ± 14). During data preprocessing, chi-square test (Table 1) showed a significant association between seven out of 14 features and the class label (aSAH), revealing a slight correlation between the data. The Pearson correlation chart (Figure 1) showed only a weak linear correlation within the majority of the chosen meteorological parameters. All networks showed similar, high classification accuracy, represented by Precision, Recall, and F1. However, they were not able to reproduce bleeding days by weather data alone. This is measured by the AUROC. In our scenario, the accuracy of the test depends on how well the test separates bleeding from non-bleeding days using meteorological data. The highest AUROC value was produced by Dense Autoencoder, with a value of 60.2 (Figure 2). LSTM and LSTM+CNN models that take past values and Bi-LSTM model, which also considers future values, also had similar outcomes (Table 2). This provides strong evidence that the incidence of aSAH has no relevant correlation with meteorological factors.
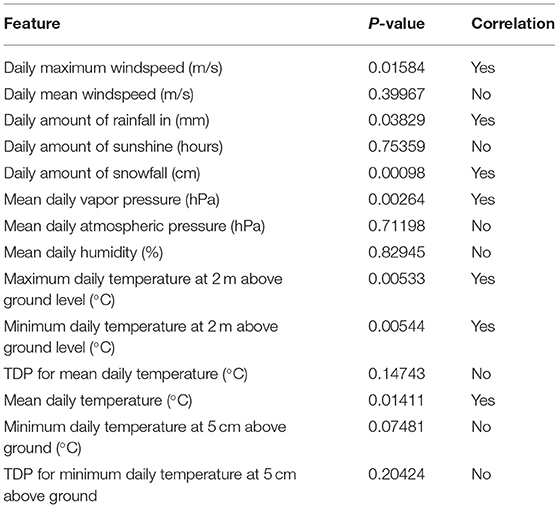
Table 1. Results of “chi-squared test” performed during data preprocessing, illustrating association between aSAH and weather features.
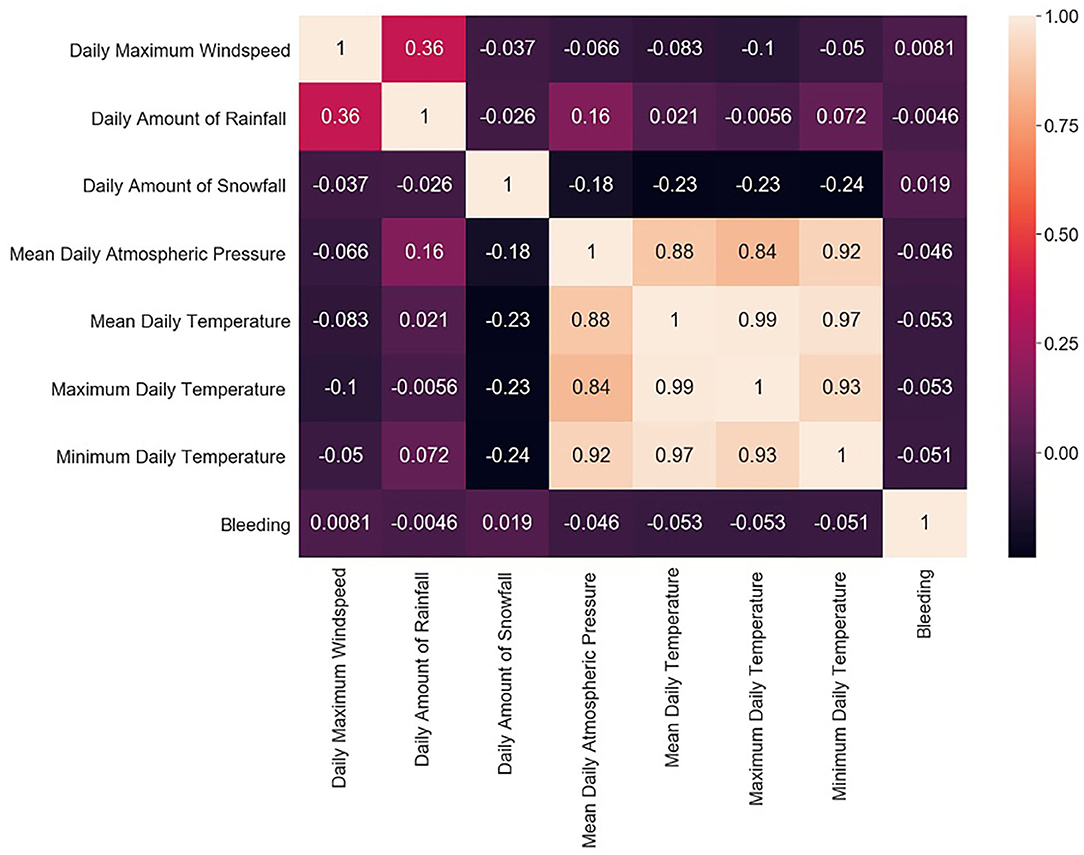
Figure 1. Pearson correlation chart showing the linear correlations between individual weather parameters and bleeding days.
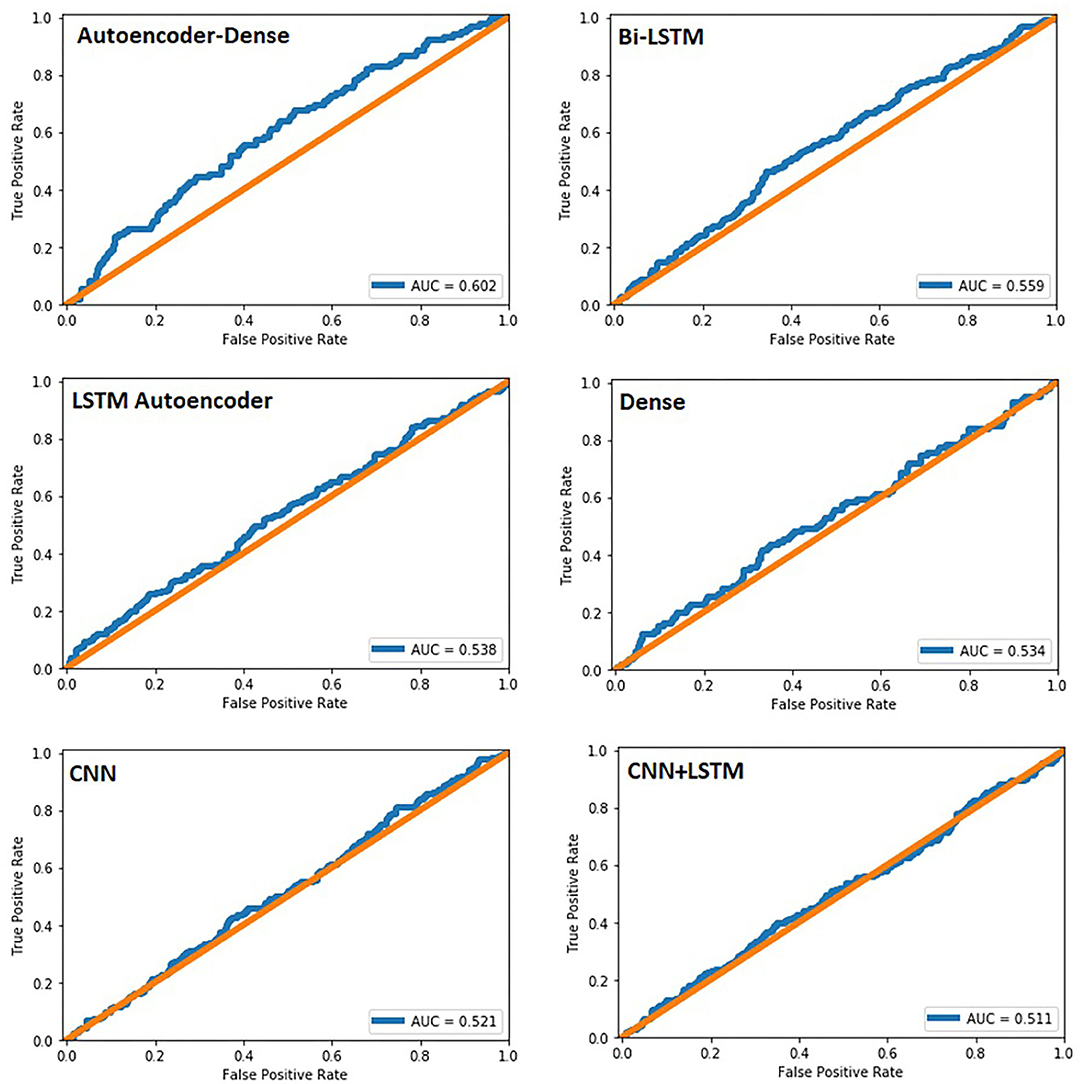
Figure 2. Area under the curve for all six networks created. In our study, it was used to predict bleeding events within our dataset.
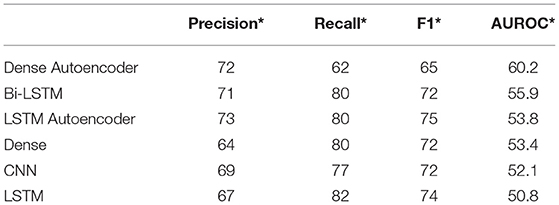
Table 2. Overview of the precision*, recall*, F1*, and AUROC values for all six deep learning models *(weighted average).
Discussion
Weather and climate changes have been attributed to influence aSAH events. Several studies using classical statistics have been published in the past decades with contradicting results. To our knowledge, this is the first study using deep-learning analysis utilizing several weather parameters simultaneously. Deep learning models each have specific strengths and weaknesses. Therefore, six different deep learning models were evaluated to find the most suitable solution for our problem with the highest sensitivity and specificity. The largest analysis on the topic to this date is a multicenter, retrospective study based on the admission diagnosis of 155 US hospitals during the calendar years 2004 to 2008 (N = 7,758) (21). Analyzing temperature, pressure, and humidity, Cowperthwaite and Burnett found no influence of these parameters on the incidence of aSAH. The biggest limitation of this study is the possible discrepancy between the date of aneurysm rupture and hospital admission. On the other hand, the large nationwide study design allowed for the correction of local biases. Several single-center studies found a correlation of aSAH events and environmental pressure, low temperatures, and sudden temperature change. Van Donkelaar et al. investigated the influence of environmental pressure changes on aneurysm rupture. They reported that an increase in pressure on the second and third days before ictus was correlated with a higher incidence of aSAH. They assumed that pressure changes were a delayed trigger of aSAH (18). Several other studies supported these findings (8, 17). Analyzing sequences of 5 days before the ictus allowed us to detect the possible influence of even very small weather changes. Neither pressure changes nor any other parameters were identified as a trigger of aSAH. In accordance with our results, Landers et al. did not find any association between aSAH and an increase in barometric pressure either (22). Other authors reported sudden temperature changes to be a relevant risk factor for aSAH. Gill et al. state that a 1°F temperature drop from 1 day to the next is associated with 0.6% increased risk of aSAH (12). This subtle increase is most likely explained by selection bias and the relatively small study cohort. Backes et al. matched 18,714 patients from the Dutch SAH registry with corresponding ICD codes to the average weekly temperature and found low temperatures to be connected with an increase in aSAH frequency (9). These results support a seasonal dependency of aSAH incidence that we did not find in our cohort. On the other hand, Rivera-Lara et al. found an increase in aSAH incidence also on warm days, but only when the temperature significantly dropped within that same day (15). Their results were supported by two other research groups (19, 45). Our data does not support these findings, and from our experience, it remains questionable if it is possible to determine the time of the ictus with the required accuracy, especially in retrospective datasets. Muroi et al. showed a seasonal variation only in patients younger than 59 in their prospective study with 489 patients from Zurich (14). Chyatte et al. described relevant seasonal fluctuations as well, with a peak in spring for both men and women in their single-center study from the United States (10). In contrast, there were no seasonal variations in hospital admissions in our patient cohort. On the one hand, this could be explained by the moderate central European climate in western Germany, with only subtle weather changes from day to day, but from our analysis it is more likely that the weather and climate changes have no relevant influence on the frequency of aSAH. In summary, previous research on the influence of weather and climate changes on the frequency of aSAH yielded contradictory results. During the data preprocessing stage of the present study, ictus dates and certain weather parameters showed some correlation. However, the applied deep-learning models were neither able to reproduce or predict bleeding days nor able to detect a pattern in the influence of weather and climate as a whole or individually for each parameter.
There are some limitations to our study. The analysis is based on a prospective aSAH dataset starting in 2003. Individual habits and social and working conditions that have not been assessed might have changed during the observation period and therefore bias the analysis. The presented results are only valid for moderate weather and climate conditions like the ones prevalent in central Europe. More extreme conditions could potentially lead to different results. Patients who died before admission or patients who were admitted at surrounding neurosurgical departments were not included within the analyzed dataset.
Conclusion
The myth of special weather and climate conditions influencing the frequency of aSAH is disenchanted by this long-term big data and deep learning analysis. After all, the weather does not appear to influence the risk of aneurysm rupture.
Data Availability Statement
The original contributions presented in the study are included in the article/supplementary material, further inquiries can be directed to the corresponding author/s.
Ethics Statement
The studies involving human participants were reviewed and approved by The University of Duisburg-Essen ethical committee (Registration number: 15-6331-BO). The patients/participants provided their written informed consent to participate in this study.
Author Contributions
MH designed and conceptualized the study, analyzed the data, and drafted the manuscript for intellectual content. AAg performed data analysis and created the deep learning networks. AAk performed data analysis and supervised the creation of the deep learning networks. AH and MDO had a major role in the acquisition of data. OG, CD, MF, PD, DP, and US drafted and revised the manuscript for content, and including medical writing for content. RJ had a major role in the acquisition of data and drafting/revision of the manuscript for content, including medical writing for content. KHW contributed to conceptualization, methodology, and writing—original draft and final approval of the version to be published. All authors contributed to the article and approved the submitted version.
Conflict of Interest
The authors declare that the research was conducted in the absence of any commercial or financial relationships that could be construed as a potential conflict of interest.
Abbreviations
CT, computed tomography; CTA, computed tomography angiography; MRA, magnetic resonance angiography; DSA, digital subtraction angiography; SAH, subarachnoid hemorrhage; aSAH, aneurysmal subarachnoid hemorrhage; AUROC, area under the receiver operating characteristics; ROC, receiver operating characteristic; LSTM, long short term memory; Bi-LSTM, directional long short term memory; CNN, convolutional neural network; ICD, International Classification of Diseases.
References
1. Etminan N, Chang HS, Hackenberg K, de Rooij NK, Vergouwen MDI, Rinkel GJE, et al. Worldwide incidence of aneurysmal subarachnoid hemorrhage according to region, time period, blood pressure, and smoking prevalence in the population: a systematic review and meta-analysis. JAMA Neurol. (2019) 76:588–97. doi: 10.1001/jamaneurol.2019.0006
2. O'Donnell MJ, Xavier D, Liu L, Zhang H, Chin SL, Rao-Melacini P, et al. Risk factors for ischaemic and intracerebral haemorrhagic stroke in 22 countries (the INTERSTROKE study): a case-control study. Lancet. (2010) 376:112–23. doi: 10.1016/S0140-6736(10)60834-3
3. Feigin VL, Rinkel GJ, Lawes CM, Algra A, Bennett DA, van Gijn J, et al. Risk factors for subarachnoid hemorrhage: an updated systematic review of epidemiological studies. Stroke. (2005) 36:2773–80. doi: 10.1161/01.STR.0000190838.02954.e8
4. Krishnamurthi RV, Moran AE, Feigin VL, Barker-Collo S, Norrving B, Mensah GA, et al. Stroke prevalence, mortality and disability-adjusted life years in adults aged 20–64 years in 1990–2013: data from the global burden of disease 2013 study. Neuroepidemiology. (2015) 45:190–202. doi: 10.1159/000441098
5. Feghali J, Gami A, Caplan JM, Tamargo RJ, McDougall CG, Huang J. Management of unruptured intracranial aneurysms: correlation of UIATS, ELAPSS, and PHASES with referral center practice. Neurosurg Rev. (2020). doi: 10.1007/s10143-020-01356-6
6. Hernandez-Duran S, Mielke D, Rohde V, Malinova V. Is the unruptured intracranial aneurysm treatment score (UIATS) sensitive enough to detect aneurysms at risk of rupture? Neurosurg Rev. (2020) 44:987–93. doi: 10.1007/s10143-020-01246-x
7. Neyazi B, Sandalcioglu IE, Maslehaty H. Evaluation of the risk of rupture of intracranial aneurysms in patients with aneurysmal subarachnoid hemorrhage according to the PHASES score. Neurosurg Rev. (2019) 42:489–92. doi: 10.1007/s10143-018-0989-2
8. Abe T, Ohde S, Ishimatsu S, Ogata H, Hasegawa T, Nakamura T, et al. Effects of meteorological factors on the onset of subarachnoid hemorrhage: a time-series analysis. J Clin Neurosci. (2008) 15:1005–10. doi: 10.1016/j.jocn.2007.07.081
9. Backes D, Rinkel GJ, Algra A, Vaartjes I, Donker GA, Vergouwen MD. Increased incidence of subarachnoid hemorrhage during cold temperatures and influenza epidemics. J Neurosurg. (2016) 125:737–45. doi: 10.3171/2015.8.JNS151473
10. Chyatte D, Chen TL, Bronstein K, Brass LM. Seasonal fluctuation in the incidence of intracranial aneurysm rupture and its relationship to changing climatic conditions. J Neurosurg. (1994) 81:525–30. doi: 10.3171/jns.1994.81.4.0525
11. Fukuda H, Ninomiya H, Ueba Y, Ohta T, Kaneko T, Kadota T, et al. Impact of temperature decline from the previous day as a trigger of spontaneous subarachnoid hemorrhage: case-crossover study of prefectural stroke database. J Neurosurg. (2019) 1:1–9. doi: 10.3171/2019.4.JNS19175
12. Gill RS, Hambridge HL, Schneider EB, Hanff T, Tamargo RJ, Nyquist P. Falling temperature and colder weather are associated with an increased risk of aneurysmal subarachnoid hemorrhage. World Neurosurg. (2013) 79:136–42. doi: 10.1016/j.wneu.2012.06.020
13. McDonald RJ, McDonald JS, Bida JP, Kallmes DF, Cloft HJ. Subarachnoid hemorrhage incidence in the United States does not vary with season or temperature. AJNR Am J Neuroradiol. (2012) 33:1663–8. doi: 10.3174/ajnr.A3059
14. Muroi C, Yonekawa Y, Khan N, Rousson V, Keller E. Seasonal variations in hospital admissions due to aneurysmal subarachnoid haemorrhage in the state of Zurich, Switzerland. Acta Neurochir. (2004) 146:659–65. doi: 10.1007/s00701-004-0278-4
15. Rivera-Lara L, Kowalski RG, Schneider EB, Tamargo RJ, Nyquist P. Elevated relative risk of aneurysmal subarachnoid hemorrhage with colder weather in the mid-Atlantic region. J Clin Neurosci. (2015) 22:1582–7. doi: 10.1016/j.jocn.2015.03.033
16. Rosenorn J, Ronde F, Eskesen V, Schmidt K. Seasonal variation of aneurysmal subarachnoid haemorrhage. Acta Neurochir. (1988) 93:24–7. doi: 10.1007/BF01409898
17. Tarnoki AD, Turker A, Tarnoki DL, Iyisoy MS, Szilagyi BK, Duong H, et al. Relationship between weather conditions and admissions for ischemic stroke and subarachnoid hemorrhage. Croat Med J. (2017) 58:56–62. doi: 10.3325/cmj.2017.58.56
18. van Donkelaar CE, Potgieser ARE, Groen H, Foumani M, Abdulrahman H, Sluijter R, et al. Atmospheric pressure variation is a delayed trigger for aneurysmal subarachnoid hemorrhage. World Neurosurg. (2018) 112:e783–e90. doi: 10.1016/j.wneu.2018.01.155
19. Zheng Y, Wang X, Liu J, Zhao F, Zhang J, Feng H. A community-based study of the correlation of hemorrhagic stroke occurrence with meteorologic factors. J Stroke Cerebrovasc Dis. (2016) 25:2323–30. doi: 10.1016/j.jstrokecerebrovasdis.2014.12.028
20. Zorrilla-Vaca A, Healy RJ, Silva-Medina MM. Revealing the association between cerebrovascular accidents and ambient temperature: a meta-analysis. Int J Biometeorol. (2017) 61:821–32. doi: 10.1007/s00484-016-1260-6
21. Cowperthwaite MC, Burnett MG. The association between weather and spontaneous subarachnoid hemorrhage: an analysis of 155 US hospitals. Neurosurgery. (2011) 68:132–8; discussion 8–9. doi: 10.1227/NEU.0b013e3181fe23a1
22. Landers AT, Narotam PK, Govender ST, van Dellen JR. The effect of changes in barometric pressure on the risk of rupture of intracranial aneurysms. Br J Neurosurg. (1997) 11:191–5. doi: 10.1080/02688699746230
23. Sun Z. Cardiovascular responses to cold exposure. Front Biosci. (2010) 2:e108. doi: 10.2741/e108
24. Senders JT, Arnaout O, Karhade AV, Dasenbrock HH, Gormley WB, Broekman ML, et al. Natural and artificial intelligence in neurosurgery: a systematic review. Neurosurgery. (2018) 83:181–92. doi: 10.1093/neuros/nyx384
25. Sannino G, De Pietro G. A deep learning approach for ECG-based heartbeat classification for arrhythmia detection. Future Gener Comput Syst. (2018) 86:446–55. doi: 10.1016/j.future.2018.03.057
26. Rajpurkar P, Irvin J, Zhu K, Yang B, Mehta H, Duan T, et al. Chexnet: Radiologist-level pneumonia detection on chest x-rays with deep learning. arXiv preprint. (2017) arXiv:171105225. Available online at: https://arxiv.org/abs/1711.05225
27. Kleesiek J, Morshuis JN, Isensee F, Deike-Hofmann K, Paech D, Kickingereder P, et al. Can virtual contrast enhancement in brain MRI replace gadolinium?: a feasibility study. Invest Radiol. (2019) 54:653–60. doi: 10.1097/RLI.0000000000000583
28. Karhade AV, Thio Q, Ogink PT, Shah AA, Bono CM, Oh KS, et al. Development of machine learning algorithms for prediction of 30-day mortality after surgery for spinal metastasis. Neurosurgery. (2019) 85:E83–91. doi: 10.1093/neuros/nyy469
29. Pedregosa F, Varoquaux G, Gramfort A, Michel V, Thirion B, Grisel O, et al. Scikit-learn: machine learning in python. J Mach Learn Res. (2011) 12:2825–30. Available online at: https://www.jmlr.org/papers/v12/pedregosa11a.html
30. Liu H, Hussain F, Tan CL, Dash M. Discretization: an enabling technique. Data Min Knowl Discov. (2002) 6:393–423. doi: 10.1023/A:1016304305535
31. McKinney W. Data structures for statistical computing in python. In: Proceedings of the 9th Python in Science Conference. Austin, TX (2010).
32. Keras CF. Keras. (2015). Available online at: https://github.com/fchollet/keras
33. Borghesi A, Bartolini A, Lombardi M, Milano M, Benini L, editors. Anomaly detection using autoencoders in high performance computing systems. In: Proceedings of the AAAI Conference on Artificial Intelligence. Honolulu, HI (2019).
34. Fawaz HI, Forestier G, Weber J, Idoumghar L, Muller P-A. Deep learning for time series classification: a review. Data Min Knowl Discov. (2019) 33:917–63. doi: 10.1007/s10618-019-00619-1
35. Thi NN, Le-Khac N-A. One-class collective anomaly detection based on LSTM-RNNs. In: Transactions on Large-Scale Data-and Knowledge-Centered Systems XXXVI. Springer (2017). p. 73–85.
36. Chen Q, Xie Q, Yuan Q, Huang H, Li Y. Research on a real-time monitoring method for the wear state of a tool based on a convolutional bidirectional LSTM model. Symmetry. (2019) 11:1233. doi: 10.3390/sym11101233
37. De Baets L, Ruyssinck J, Peiffer T, Decruyenaere J, De Turck F, Ongenae F, et al. Positive blood culture detection in time series data using a BiLSTM network. arXiv preprint. (2016) arXiv:161200962. Available online at: https://arxiv.org/abs/1612.00962
38. Sadouk L. CNN Approaches for Time Series Classification, Time Series Analysis - Data, Methods, and Applications. Chun-Kit Ngan: IntechOpen (2018). doi: 10.5772/intechopen.81170. Available online at: https://www.intechopen.com/books/time-series-analysis-data-methods-and-applications/cnn-approaches-for-time-series-classification
39. Karim F, Majumdar S, Darabi H, Chen S. LSTM fully convolutional networks for time series classification. IEEE Access. (2017) 6:1662–9. doi: 10.1109/ACCESS.2017.2779939
42. McKinney W. Pandas: a foundational Python library for data analysis and statistics. Python High Perf Sci Comput. (2011) 14:1–9.
43. Waskom M, Botvinnik O, O'Kane D, Hobson P. mwaskom/seaborn: v0.8.1. Zenodo (2017). doi: 10.5281/zenodo.883859
44. Hunter JD. Matplotlib: A 2D graphics environment. Comput Sci Eng. (2007) 9:90–5. doi: 10.1109/MCSE.2007.55
Keywords: subarachnoid hemorrhage-weather, SAH, hemorrhagic stroke, big-data, deep-learning, subarachanoid hemorrhage, machine learning
Citation: Helsper M, Agarwal A, Aker A, Herten A, Darkwah-Oppong M, Gembruch O, Deuschl C, Forsting M, Dammann P, Pierscianek D, Jabbarli R, Sure U and Wrede KH (2021) The Subarachnoid Hemorrhage–Weather Myth: A Long-Term Big Data and Deep Learning Analysis. Front. Neurol. 12:653483. doi: 10.3389/fneur.2021.653483
Received: 14 January 2021; Accepted: 22 March 2021;
Published: 05 May 2021.
Edited by:
Nikolaus Plesnila, Institute for Stroke and Dementia Research (ISD), GermanyReviewed by:
Serge Marbacher, Aarau Cantonal Hospital, SwitzerlandR. Loch Macdonald, University of Toronto, Canada
Copyright © 2021 Helsper, Agarwal, Aker, Herten, Darkwah-Oppong, Gembruch, Deuschl, Forsting, Dammann, Pierscianek, Jabbarli, Sure and Wrede. This is an open-access article distributed under the terms of the Creative Commons Attribution License (CC BY). The use, distribution or reproduction in other forums is permitted, provided the original author(s) and the copyright owner(s) are credited and that the original publication in this journal is cited, in accordance with accepted academic practice. No use, distribution or reproduction is permitted which does not comply with these terms.
*Correspondence: Moritz Helsper, bW9yaXR6LmhlbHNwZXJAdWstZXNzZW4uZGU=