 Kun Xu1,2
 Xiao-xia Zhou2
 Run-cheng He2Zhou Zhou2Zhen-hua Liu2
 Qian Xu2
 Qi-ying Sun3Xin-xiang Yan2
 Xin-yin Wu4
 Ji-feng Guo2,5,6,7
 Bei-sha Tang1,2,5,6,7*
- 1Collaborative Innovation Center for Brain Disorders, Laboratory of Brain Disorders, Ministry of Science and Technology, Beijing Institute of Brain Disorders, Capital Medical University, Beijing, China
- 2Department of Neurology, Xiangya Hospital, Central South University, Changsha, China
- 3Department of Geriatrics, Xiangya Hospital, Central South University, Changsha, China
- 4Department of Epidemiology and Health Statistics, Xiangya School of Public Health, Central South University, Changsha, China
- 5National Clinical Research Center for Geriatric Disorders, Xiangya Hospital, Central South University, Changsha, China
- 6Centre for Medical Genetics, Hunan Key Laboratory of Medical Genetics, School of Life Sciences, Central South University, Changsha, China
- 7Key Laboratory of Hunan Province in Neurodegenerative Disorders, Central South University, Changsha, China
Objectives: Although risk factors for freezing of gait (FOG) have been reported, there are still few prediction models based on cohorts that predict FOG. This 1-year longitudinal study was aimed to identify the clinical measurements closely linked with FOG in Chinese patients with Parkinson's disease (PD) and construct prediction models based on those clinical measurements using Cox regression and machine learning.
Methods: The study enrolled 967 PD patients without FOG in the Hoehn and Yahr (H&Y) stage 1–3 at baseline. The development of FOG during follow-up was the end-point. Neurologists trained in movement disorders collected information from the patients on a PD medication regimen and their clinical characteristics. The cohort was assessed on the same clinical scales, and the baseline characteristics were recorded and compared. After the patients were divided into the training set and test set by the stratified random sampling method, prediction models were constructed using Cox regression and random forests (RF).
Results: At the end of the study, 26.4% (255/967) of the patients suffered from FOG. Patients with FOG had significantly longer disease duration, greater age at baseline and H&Y stage, lower proportion in Tremor Dominant (TD) subtype, a higher proportion in wearing-off, levodopa equivalent daily dosage (LEDD), usage of L-Dopa and catechol-O-methyltransferase (COMT) inhibitors, a higher score in scales of Unified Parkinson's Disease Rate Scale (UPDRS), 39-item Parkinson's Disease Questionnaire (PDQ-39), Non-Motor Symptoms Scale (NMSS), Hamilton Depression Rating Scale (HDRS)-17, Parkinson's Fatigue Scale (PFS), rapid eye movement sleep behavior disorder questionnaire-Hong Kong (RBDQ-HK), Epworth Sleepiness Scale (ESS), and a lower score in scales of Parkinson's Disease Sleep Scale (PDSS) (P < 0.05). The risk factors associated with FOG included PD onset not being under the age of 50 years, a lower degree of tremor symptom, impaired activities of daily living (ADL), UPDRS item 30 posture instability, unexplained weight loss, and a higher degree of fatigue. The concordance index (C-index) was 0.68 for the training set (for internal validation) and 0.71 for the test set (for external validation) of the nomogram prediction model, which showed a good predictive ability for patients in different survival times. The RF model also performed well, the C-index was 0.74 for the test set, and the AUC was 0.74.
Conclusions: The study found some new risk factors associated with the FOG including a lower degree of tremor symptom, unexplained weight loss, and a higher degree of fatigue through a longitudinal study, and constructed relatively acceptable prediction models.
Introduction
Parkinson's disease (PD) is the most common type of Parkinsonism with a complex spectrum of motor and non-motor characteristics (1). Some patients with PD may suffer freezing of gait (FOG), a common motor complication of PD, which occurs in different stages of PD especially common in the advanced stage and when the drug efficacy wanes (wearing off). FOG is a sudden, variable, and often unpredictable transient break in walking, always occurring at the beginning of or during gait, especially while turning, leading to falls. Patients report that FOG feels like their feet are stuck to the floor (2–4). The Unified Parkinson's Disease Rate Scale (UPDRS) scale is often used in assessing gait abnormalities (5). FOG occurs not only in advanced PD but also in other parkinsonism, especially in progressive supranuclear palsy (PSP), multiple system atrophy (MSA), corticobasal degeneration (CBD), dementia with Lewy bodies (DLB) (6). The prevalence of FOG in patients with PD varies from 14.0 to 55.1%, and in patients with advanced PD, up to 86.5% suffer from FOG (7, 8). The prevalence of FOG in PSP is about 53%, 54% in MSA, 54% in DLB, and 25% in CBD, and is commonly seen in the late stages of these diseases (6).
Freezing of gait (FOG) significantly affects the quality of life (QoL) of patients with PD, and due to the clinical heterogeneity of FOG, the effect of treatment that is mainly based on drug and non-drug therapies is not ideal, especially when Dopa-responsive FOG turns into Dopa-resistance FOG (9–11). Previous studies have explored risk factors and biomarkers and constructed prediction models of certain neurodegenerations (12). In addition, identifying risk factors is also conducive to finding out new therapeutic targets of neurodegenerations (13, 14).
Many risk factors for FOG also have been reported by previous cross-sectional clinical studies and some longitudinal studies (11), however, cross-sectional clinical studies cannot completely describe the development and progression of FOG and there are still few prediction models based on cohorts that predict FOG. One model with different risk factors included caudate Dopamine Transporter (DAT) uptake and Cerebro-Spinal Fluid (CSF) Aβ42 that showed a good predictive ability (15). However, because the examination of caudate DAT uptake is complex and expensive, and the examination of CSF Aβ42 is invasive and has certain risks, it is not suitable for large-scale clinical screening and promotion. Another prediction model constructed by a prospective multimodal neuroimaging cohort study showed accuracy, finding that thalamic gray matter inflation was a predictor of FOG (16). Some other studies used clinical assessment scales to identify risk factors of diseases (17). A longitudinal study proved that prediction models that were constructed by clinical scales could show good prediction ability (18).
Machine learning (ML) uses statistical and mathematical algorithms to develop models that can predict an outcome based on factors related to that outcome. Prediction models from machine learning processes are used in medical fields to diagnose and assess disease progression and evaluate prognosis, which strengthened personalized healthcare and improved strategies for disease treatment (19).
This prospective study used different clinical rating scales in the Parkinson's Disease and Movement Disorders Multicenter Database and Collaborative Network in China (PD-MDCNC; http://www.pd-mdcnc.com/), and the present prospective study was aimed to find out some clinical characteristics in FOG patients, identify some risk factors of FOG, and construct prediction models of FOG.
Materials and Methods
In order to make the study procedures more clear and easy to understand, the flow chart of the study is presented in Figure 1.
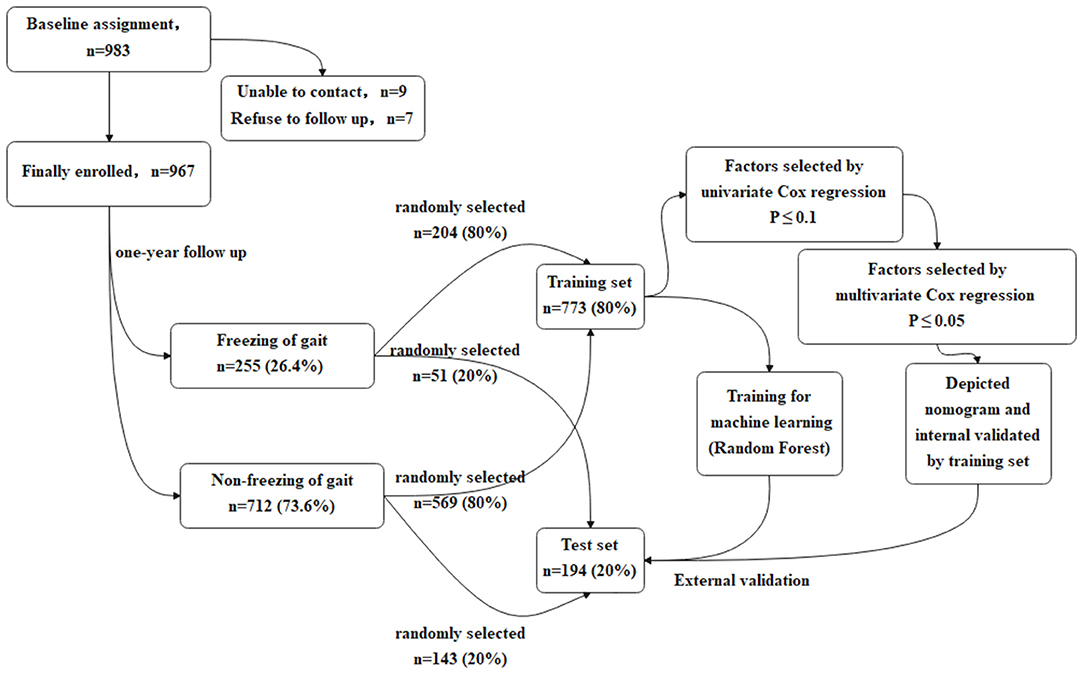
Figure 1. The flow chart of the study.
Study Population
Patients with PD were recruited from the Department of Neurology of Xiangya Hospital Central South University in China from January 1, 2017 to July 31, 2019. All the patient baseline health and disease characteristics including the clinical scales scores were entered into the PD-MDCNC database.
The inclusion criteria included: (a) PD diagnosis (20); (b) available clinical data; (c) at least 1 year of disease duration and at least 1 year of a history of anti-PD drug therapy; (d) non-FOG at baseline; (e) non-L-Dopa-induced dyskinesia; (f) Hoehn and Yahr (H&Y) stage 1–3; (g) agreement for a 1-year follow-up.
The exclusion criteria included: (a) prior history of neuropsychiatric disorders (Alzheimer's disease, schizophrenia) before PD diagnosis; (b) history of diseases that may be confused with the non-motor symptoms of PD (allergic rhinitis, prostatitis); (c) refused follow-up; (d) patients with a disability causing gait disorder.
Both baseline and the first follow-up assessment that is carried out after 1 year were implemented in Xiangya Hospital. The interval of follow-up for each patient was 1 year. Patients with a medication history are more likely to develop FOG (11). In our study, to explore the impact of the baseline drug consumption on FOG, we recruited patients with PD with at least 1 year of disease duration and at least 1 year of a history of anti-PD drug therapy. The survival time of the patients with FOG in Cox regression was set as “disease duration at baseline plus 1 year”. Whenever the patients began experiencing FOG during the follow-up, they were recorded as “End with FOG.” What is more, due to the New Freezing of Gait-Questionnaire (NFOG-Q), a freezer was identified only when FOG-episodes were present during the past month, suggesting that the time frame was short enough for recall and long enough for identifying a consistent pattern (21).
There were 983 patients with PD being assessed at the baseline, and during the 1-year follow-up, 16 patients quit. Finally, 967 patients with PD (496 men and 471 women) were enrolled in the study. Each patient in the study provided written informed consent. The study was reviewed and approved by the Ethics Committee of Xiangya Hospital of Central South University in China.
Variables
For the statistical calculations, prediction model development, and ML, the characteristics of the patients with PD were identified as “variables.” For example, PD medication regimen and clinical characteristics such as different motor and non-motor symptoms were called “independent variables,” and the situation that patients end with FOG was called the outcome.
Outcomes
The UPDRS-14 (22) and the NFOG-Q (21) were used to determine the outcome “End with FOG,” which was defined as “UPDRS-14 score ≥1” and “NFOG-Q evaluation of FOG” (NFOG-Q score also >1). Meanwhile, the experts would provide a detailed description of FOG that “Have you ever feel that your feet are glued to the ground when you walk, turn, or intent to start a walking during the recent months?” to every patient. To those patients who did not determine whether they suffered FOG, experts would imitate all of the subtypes of FOG to ensure the accuracy of the data. Combined with the answer of the patients to the scales and the intervention of experts, the outcome, “End with FOG,” would be finally determined. Patients diagnosed with FOG were placed into a FOG (+) category. At the end of the study, the patients at follow-up that were not diagnosed with FOG were placed into an FOG (–) category. All patients were assessed in the “OFF” medication state. In this study, the “OFF” medication state was defined as: PD patients did not take the medicine at outpatient service, or after taking the medicine they had no efficacy or were in a relatively poor state throughout the day.
Independent Variables and Clinical Assessments
The independent variables in this study were derived from the clinical rating scales in the PD-MDCNC database, each of which had strict scientific significance. Baseline characteristics were collected from the subjects by neurologists trained in movement disorders. The characteristics included sex, age, education level, smoking history, history of alcohol intake, history of exposure to toxic and hazardous substances (including pesticides and organic solvents), history of exposure to heavy metal, history of head injury, surgical history, family history of PD, and age of onset (AOO), duration. The PD medication regimen included L-Dopa, catechol-O-methyltransferase (COMT) Inhibitors, anticholinergic drugs, amantadine, dopamine agonists, and MAO-B inhibitors, and total levodopa equivalent daily dosage (LEDD) (mg/day) (23).
Age at baseline was divided into five categories: 1 means < 50 years old, 2 means age at baseline ≥ 50 and ≤ 59, 3 means age at baseline ≥ 60 and ≤ 69, and similarly so, up to 5 means > 80 years old. In fact, in the process of constructing the models, we tried to input the age of every single patient into the models, while after several experiments of input method, we chose to divide the patients into different age groups, which was the most appropriate classification method for constructing prediction models based on this cohort data. To group AOO, early-onset PD (EOPD) (+) was defined as AOO ≤ 50 years old and EOPD (–) was defined as AOO ≥ 50 years old (24), and factors of AOO were named as EOPD (±).
Motor symptoms were evaluated using the separate scores of each item of UPDRS and total score of parts I, II (excluding the score from item 14), III, and the whole UPDRS, as well as the H&Y stage (1–3). The tremor dominant (TD) and postural instability gait difficulty (PIGD) scores were determined to classify patients as TD, PIGD, and “intermediate” (25). The 39-item Parkinson's Disease Questionnaire (PDQ-39) was used to evaluate the overall situation of patients (26). The Non-Motor Symptoms Scale (NMSS) (27) was used to evaluate the global non-motor symptoms. The mini-mental state examination (MMSE) (28) was used to evaluate the cognitive function of PD patients. The Hamilton Depression Rating Scale (HDRS-17) (29) was used to assess depression. Rome III criteria (IBS-C) were used to diagnose functional constipation (30). The Parkinson's Fatigue Scale (PFS-16) (31) and Epworth Sleepiness Scale (ESS) (32) were used to evaluate fatigue and excessive daytime sleepiness (EDS). The Hyposmia Rating Scale (HRS) (33) and the rapid eye movement (REM) sleep behavior disorder questionnaire-Hong Kong (RBDQ-HK) (34) were used to evaluate hyposmia and REM sleep behavior disorder (RBD).
All of the above-mentioned assessments were conducted in the “OFF” medication state.
Statistical Analysis
Sample Characteristics
Proportions (%) were used to describe unordered classified variables and means and SD (mean, SD) were used to describe continuous variables. Statistical differences between the FOG (+) and FOG (–) groups were determined with the Chi-square test, the Student's t-test, and the Mann-Whitney U-test using Statistical Package for the Social Sciences (SPSS) version 25.0 (IBM, Armonk, New York, United States). Statistical analyses were performed as two-tailed tests and the threshold of significance (α) was 0.05.
The Training Set and the Test Set
Stratified random sampling was used to divide the population into two independent sets: a training set and a test set. The training set included 80% (773/967) of the study cohort, randomly selected from the FOG+ (204/255) and FOG- (569/712) groups. Models were developed using the characteristics in the training set. The test set was used to validate the models, including the remaining 20% (194/967) of the study cohort. Partition of the data set was realized by the train_test_split function in the sklearn package Python 3.7.0. In the partitioning, random_state was set to 0.
Cox Regression
Cox regression was used to determine the hazard ratios (HRs) for variables contributing to FOG and to construct a model to predict FOG. A univariate Cox regression model was constructed for each variable to determine the statistical significance of the model and only those variables with P ≤ 0.1 were screened in the next stage of the analysis. Results with clinical significance were screened out and a multivariate Cox regression with a forward likelihood ratio (LR) model was performed to find risk factors for FOG with a threshold of P ≤ 0.05. The survival time was set as the disease duration at the baseline plus 1 year. Kaplan–Meier survival curves were constructed by the training set, and log-rank tests were performed to determine if significant differences existed in survival times between the FOG(+) and FOG(–) groups. Nomograms were constructed to transform the complex regression equations into visual graphs (RMS 6.1-0 in R 4.0.3; http://www.r-project.org/). To verify the model, using the training set for internal validation, and the test set for external validation, respectively. Bootstrap self-sampling was used for validation. Concordance index (C-index) and calibration curve were used to evaluate model fit to the data (RMS 6.1-0 in R 4.0.3; http://www.r-project.org/). Time-dependent Receiver Operating Characteristic Curves (tdROC) were depicted using survComp (R 4.0.3; http://www.r-project.org/). Areas under the curves (AUC) were used to assess the prediction accuracy of the model at various survival times for internal and external validation.
Machine Learning
Random Forest (RF) was used to develop an alternative prediction model for FOG. The bootstrap self-sampling was used to randomly extract ~2/3 of the samples from the training set for the construction of each decision tree. Next, some factors were randomly extracted from all the features during the construction of each decision tree, and those variables with the best classification ability were selected for the construction of the tree. The importance of factors in the construction of decision trees was measured using Gini-index (https://data.worldbank.org/indicator/SI.POV.GINI). The RF model was constructed using the RF Classifier function in the sklearn package Python 3.7.0. Relevant parameters were adjusted using gridSearchCV in Python 3.7.0.
Mutual Benefits
Cox regression, especially, is applied on the occasion when the outcome variables are closely related to the disease progression, so the Cox regression was chosen as the main analytical method of our study. RF is a common machine learning algorithm that is applied to classification and prediction, especially in regression and classification scenarios, indicating that RF is a way to combine and validate Cox regression. The importance of every single factor for FOG would be ranked by the Gini-index in RF. After the importance of different factors in the Gini-rank was compared, the factors found in the Cox regression could be validated. What is more, other machine learning approaches such as support vector machines (SVM), Random survival forest (RSF) did not achieve our desired results, suggesting that RF might be the best ML approach to this investigation of this dataset.
Results
Baseline Population Characteristics
All baseline features for the patients with FOG (–) and FOG (+) are presented in Tables 1–3.
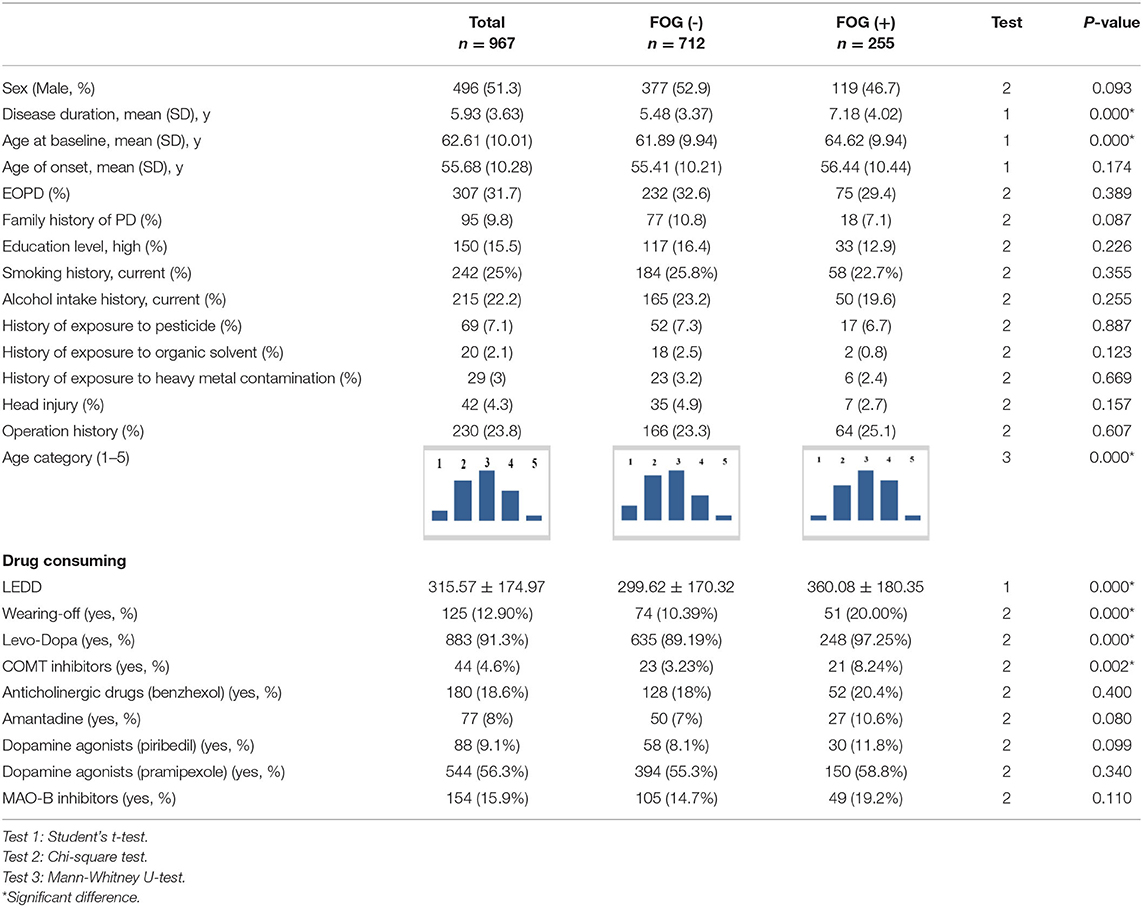
Table 1. Baseline characteristics of demographic and drug consuming of the population.
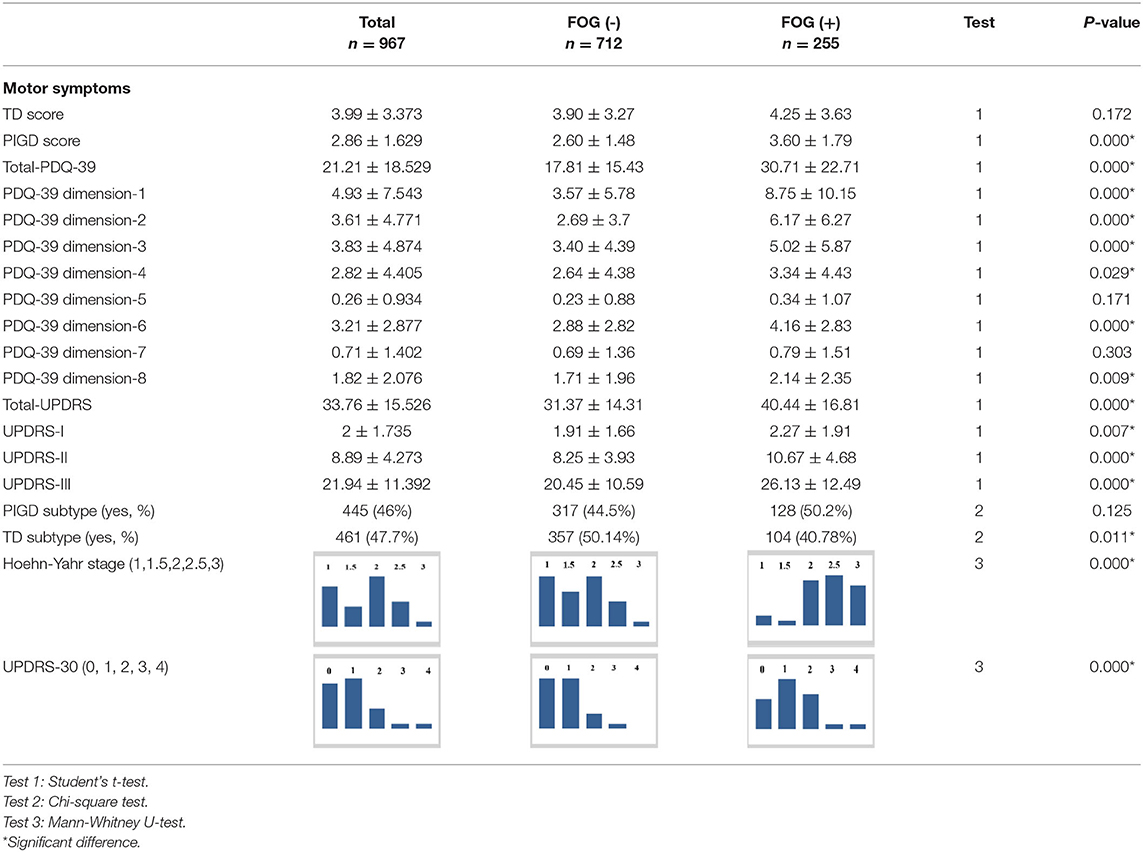
Table 2. Baseline characteristics of motor symptoms of the population.
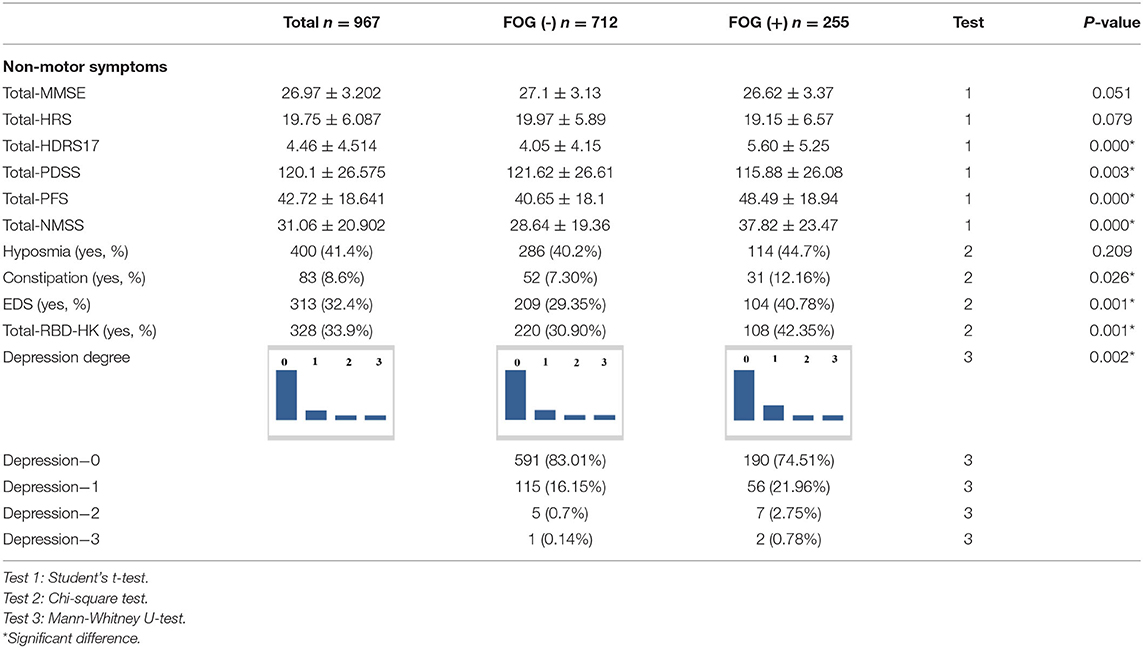
Table 3. Baseline characteristics of non-motor symptoms of the population.
The patients with PD enrolled had the following features: age at baseline (62.61; SD, 10.01; 95% CI, 61.98–63.24), age of onset (55.68; SD, 10.28; 95% CI, 55.03–56.33), and disease duration at baseline (5.93; SD, 3.63; 95% CI, 5.70–6.16).
Of the 967 patients at the end of the study, 26.4% (255/967) of the patients (119 men and 136 women) were FOG (+) with the following features: age at baseline (64.62; SD, 9.94; 95% CI, 63.40–65.84), age of onset (56.44; SD, 10.44; 95% CI, 55.16–7.72) and disease duration at baseline (7.18; SD, 4.02; 95% CI, 6.69–7.67). Meanwhile, 73.6% (712/967) of the patients (377 men and 335 women) were FOG (–) with the following features: age at baseline (55.41; 10.21; 31–91), age of onset (61.89; 9.94; 8–89), and disease duration at baseline (5.48; 3.37; 1–27).
It was found that the FOG (+) groups had significantly longer disease duration and greater age at baseline than those in the FOG (–) group (P < 0.05). There were no significant statistical differences between the FOG (+) and FOG (–) groups in AOO, sex, education level, smoking history, history of alcohol intake, history of exposure to toxic and hazardous substances, history of exposure to heavy metal, history of head injury, surgical history, and family history of PD. There were significantly higher proportions in wearing-off, LEDD, and usage of L-Dopa and COMT inhibitors in patients in the FOG (+) group than those in the FOG (–) group (P < 0.05). There were no significant statistical differences found between the FOG (+) and FOG (–) groups in the usage of anticholinergic drugs, amantadine, dopamine agonists, and MAO-B Inhibitors.
The FOG (+) group had a significantly higher Total-UPDRS score, PIGD score, Total-PDQ-39 score, PDQ-39 scores in Dimensions 1, 2, 3, 4, and 6, UPDRS-part I, II, and III scores, and UPDRS-subitem-30 score, and a higher H&Y stage than the FOG (–) group (P < 0.05). There were more patients with TD in the FOG (–) group (P < 0.05). The FOG (+) group had a significantly higher Total-NMSS score, Total-HDRS-17 score, Total-PFS score, and Total-RBD-HK score than the FOG (–) group (P < 0.05), had more patients with constipation, RBD, and EDS than the FOG (–) group (P < 0.05) and had more patients that were more likely to have depressive symptoms, and more severely so, than patients with FOG (–) (P < 0.05). However, the FOG (+) group had a significantly lower mean score of Total-PDSS than the FOG (–) group (P < 0.05). In the parts of MMSE, only parts 1 and IV showed statistical significance between the two groups (P < 0.05).
Risk Factors for FOG and Performance of Prediction Model
All the variables with P ≤ 0.1 that were selected by single-factor Cox regression are shown in Supplementary Table 1. The factors possibly linked to FOG were identified by multivariate Cox regression, including the EOPD(±), TD score, Total PFS, PDQ-39 dimension 2, NMSS-29, and UPDRS-30 (see in Table 4). These six risk factors meet the Proportional Hazards (PH) Assumption. The final multivariate Cox regression model was based on the Proportional Hazards ratio Model (1) and was shown below (2). h (t, x) was named as the prognosis index. β1, β2 to βn is the partial regression coefficient of independent variables. h0 (t) is the baseline risk when the x is 0.
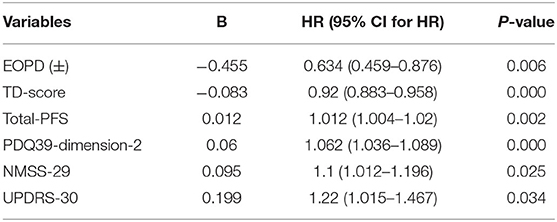
Table 4. Risk factors of FOG selected by multivariate Cox regression.
Kaplan-Meier curves showed that, as time went by, there was a significant difference between the patients with PD with a higher risk of developing FOG and the patients with a lower risk of developing FOG (P < 0.05) (Figure 2). The nomogram was constructed (Figure 3). The C-indices of the nomogram on the training set and test set were 0.68 and 0.71, respectively. The probability of a PD patient developing FOG after 5, 7, and 10 years of assessment (baseline) can be calculated by the nomogram and validated by the calibration curves.
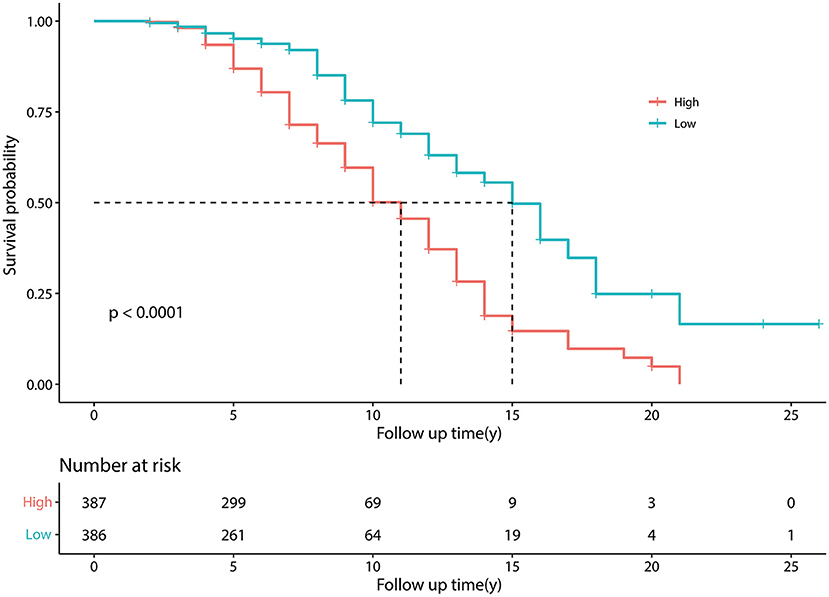
Figure 2. Kaplan–Meier survival curves. Kaplan–Meier curves constructed by the training set, showing that as time went by, there was a significant difference between patients with Parkinson's disease (PD) with a higher risk of developing freezing of gait (FOG) and patients with a lower risk of developing FOG. The number at risk means the number of patients with PD in the group of higher and lower risk of developing FOG; Follow up time (y) means the time from a patient was diagnosed with PD to the end of the follow-up period, in other words means “disease duration at baseline plus 1 year”.
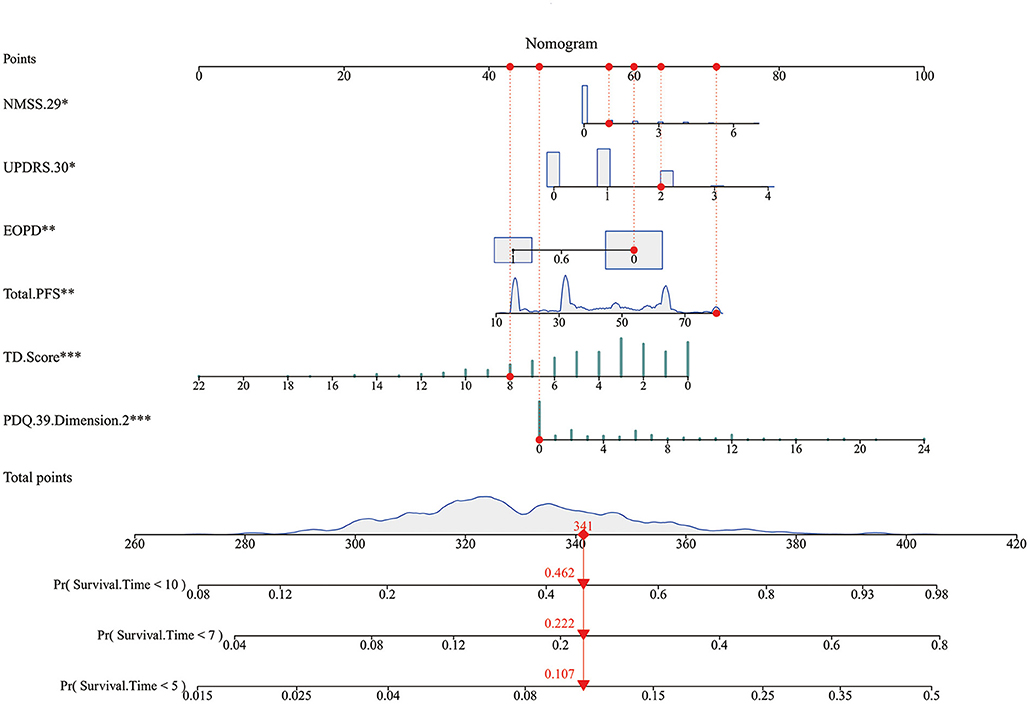
Figure 3. The nomogram. Non-Motor Symptoms Scale (NMSS).29: unexplained weight change; Unified Parkinson's Disease Rate Scale (UPDRS) 0.30: impaired balance; EOPD: early-onset PD; Total. Parkinson's Fatigue Scale (PFS): degree of fatigue; tremor dominant (TD). Score: degree of tremor symptom; Parkinson's Disease Questionnaire (PDQ).39. Dimension.2: Activities of Daily Living. Every factor has a point, and total points are the sum of the point of each factor, corresponding to the probability of FOG occurring at different survival times.
Figures 4A–F showed the predictive ability of the multivariate model which was built by the nomogram and every single factor selected by the multivariate Cox regression. It was found that multivariate models had better predictive ability than any other single factors in both training set and test set. In the internal validation set (the training set), the AUC of the multivariate model at 5, 7, and 10 years was 0.69, 0.71, and 0.67, respectively (Figures 4A–C). In the external validation set (the test set), the AUC of the model at 5, 7, and 10 years was 0.73, 0.72, and 0.69, respectively (Figures 4D–F). The calibration curves for 5, 7, 10 years in the internal and external validation sets (training and test sets) were constructed (Figures 5A–F), and the probability of survival at 5 years showed a fair agreement between the prediction by the nomogram and the standard curve in both the training and test sets.
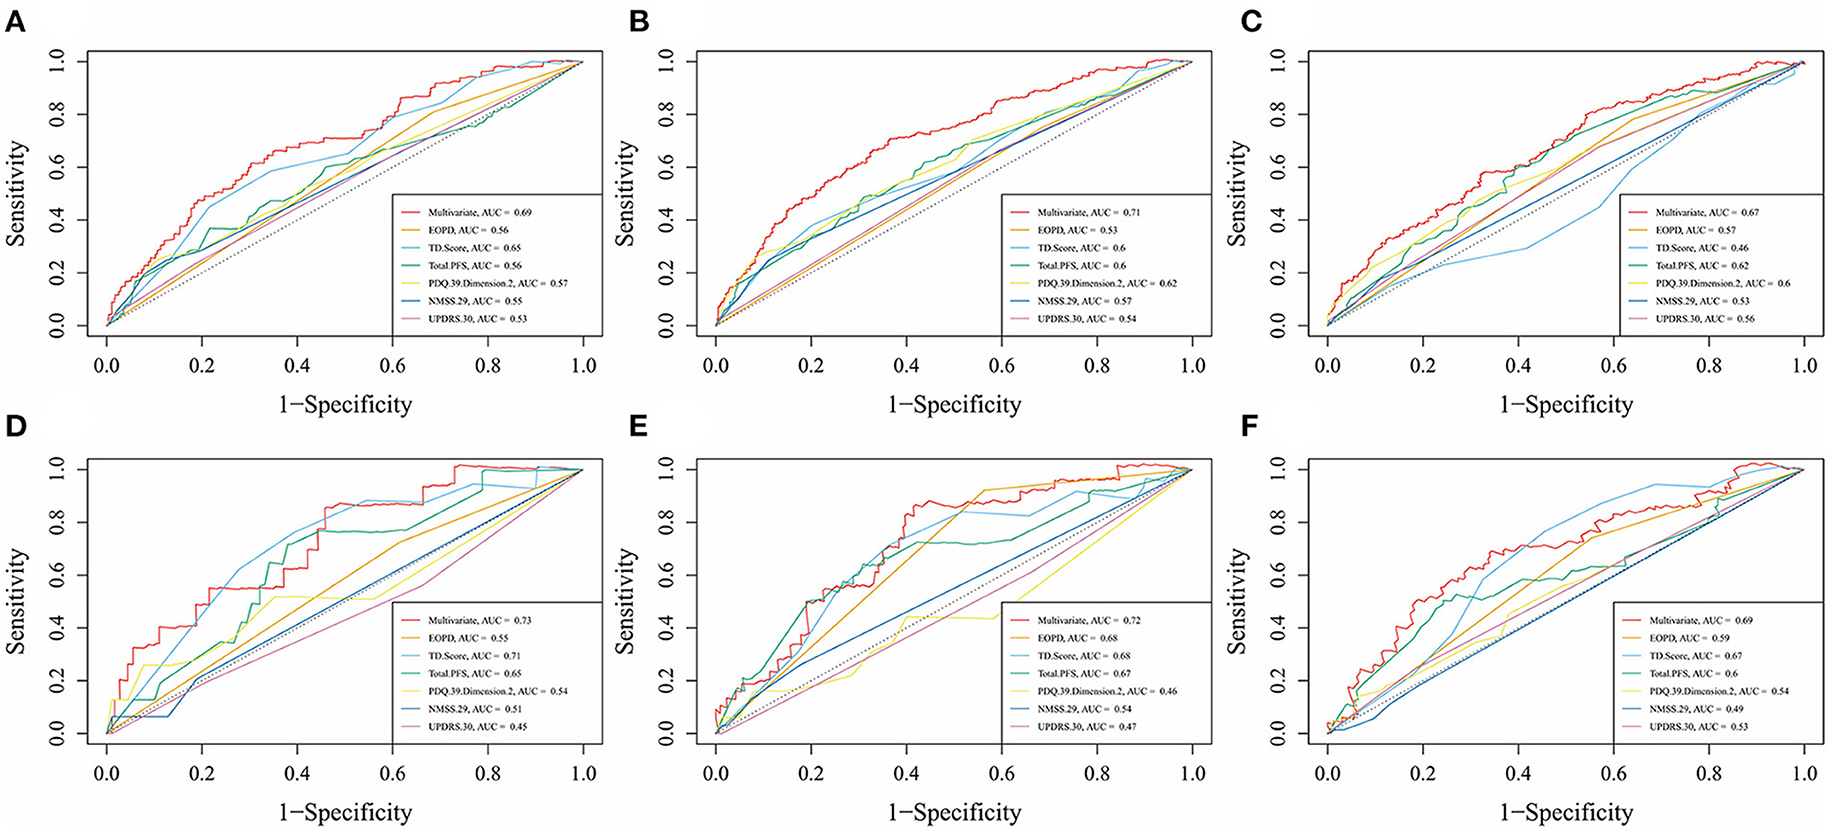
Figure 4. Time-dependent receiver operating characteristic (td-ROC) curves of multivariate and each factor at different survival times in the training set and test set. (A) td-ROC of 5-year survival, in the training set; (B) td-ROC of 7-year survival, in the training set; (C) td-ROC of 10-year survival, in the training set; (D) td-ROC of 5-year survival, in the test set; (E) td-ROC of 7-year survival, in the test set; (F) td-ROC of 10-year survival, in the test set.
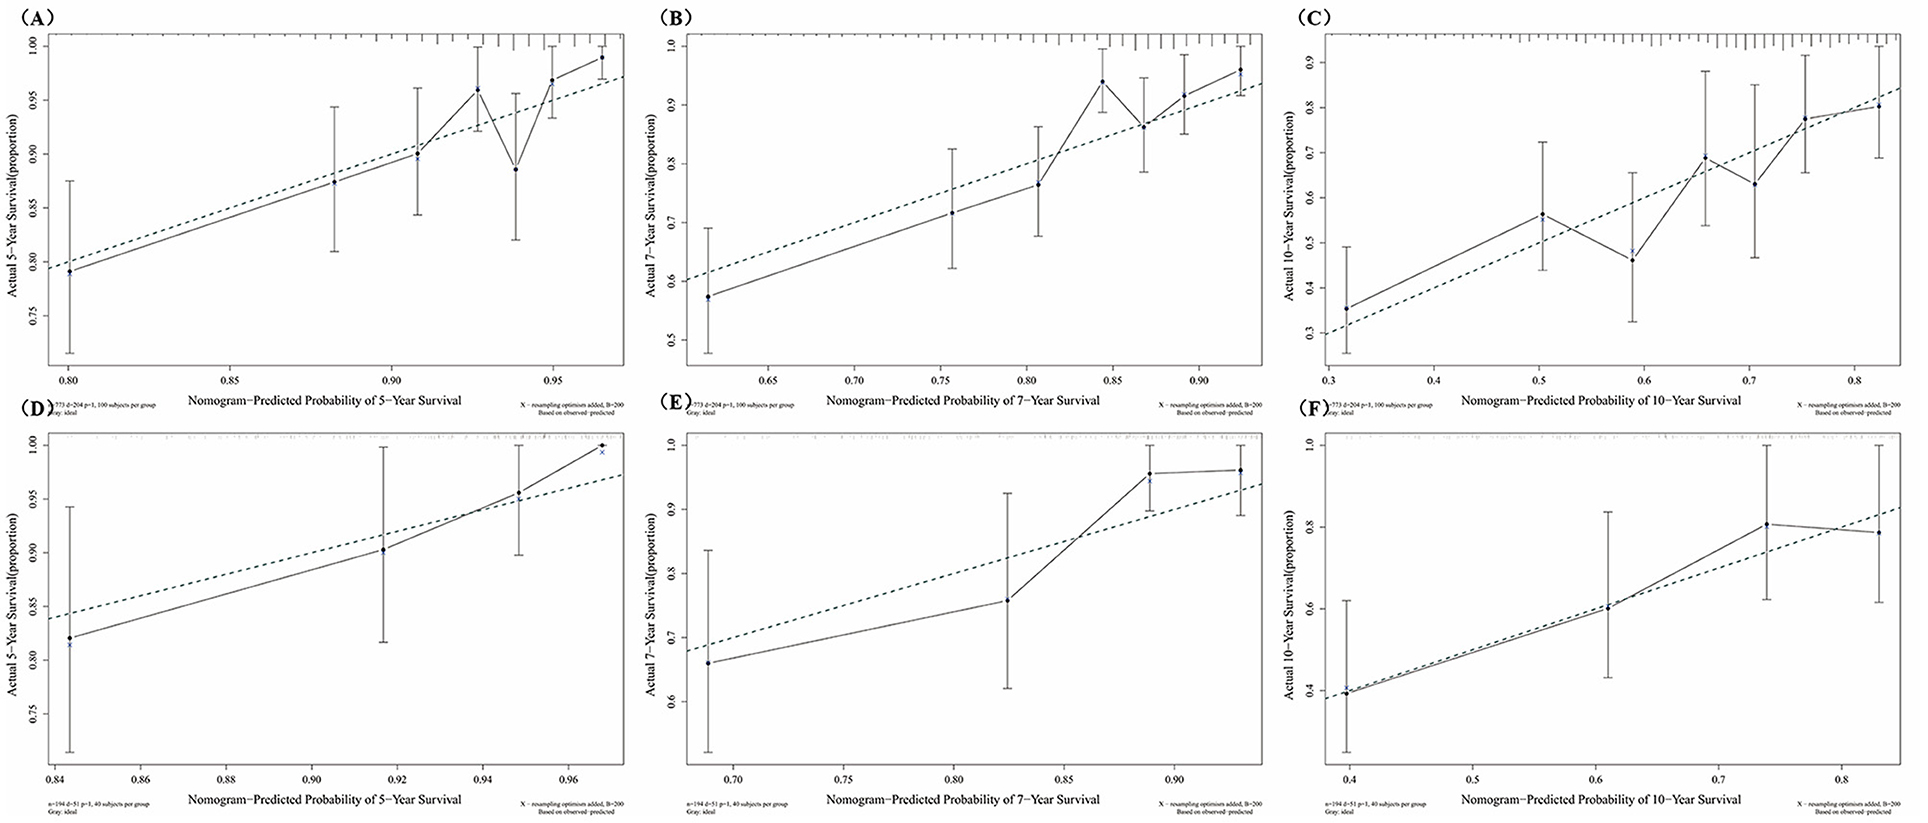
Figure 5. Calibration curves at different survival times in the training set and test set. (A) Calibration curves of 5-year survival, in the training set; (B) Calibration curves of 7-year survival, in the training set; (C) Calibration curves of 10-year survival, in the training set; (D) Calibration curves of 5-year survival, in the test set; (E) Calibration curves of 7-year survival, in the test set; (F) Calibration curves of 10-year survival, in the test set.
ML
The training set was used to develop the RF model using ML and the test set was used to validate the RF model. After adjusting the relevant parameters, n_estimators was set to 120, and max_depth was set to 16.
All the baseline-assessed factors were ranked according to their importance score (Supplementary Table 2). Among the top 30 factors, PDQ-39 Dimension-2, Total-PFS, UPDRS-30, and TD score were present in the nomogram for the Cox regression model. The validation set had a C-index of 0.74 and an AUC of 0.74 (Figure 6).
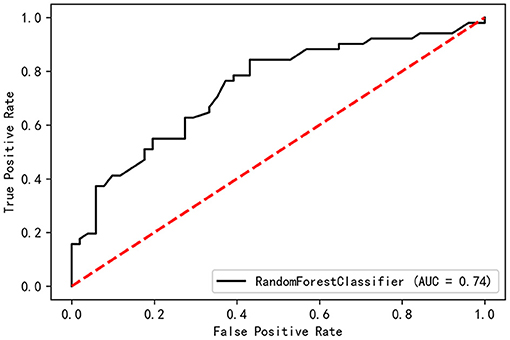
Figure 6. Receiving operating curves (ROC) of Random Forest model.
Discussion
Gait disorder, especially, FOG is a common motor symptom in PD, and it was reported that gait disorder could be a risk factor or prodromal biomarker of PD (5), indicating that finding out risk factors would be meaningful to clinical physicians. Based on the PD-MDCNC database, PD patients with H&Y stages 1–3 were included in this 1-year longitudinal study. The baseline characteristics of FOG (+) and FOG (–) patients as well as the incidence of FOG in the central-southern region of mainland China were reported, and clinical features statistically linked to FOG development in PD patients were also identified during our study. At the end of the 1-year-long study, 26.4% of the patients suffered from FOG, this was lower than the previous study (3, 35). However, it was still within an acceptable range when we considered the disease duration at baseline of patients we enrolled and the shorter follow-up time in this study. The patients who developed FOG had significantly longer disease duration, greater age at baseline and H&Y stage, lower proportion in TD subtype, a higher proportion in wearing-off, LEDD, usage of L-Dopa and COMT inhibitors, higher scores in scales of UPDRS, PDQ-39, NMSS, HDRS-17, PFS, RBD-HK, ESS, and lower scores in scales of PDSS (P < 0.05). These baseline characteristics were coherent with the previous study (15, 35–37).
A nomogram was used to construct the prediction model based on multivariate Cox regression by inputting different clinical PD scales as independent variables. The model had satisfactory prediction efficiencies in the training and test sets at different survival times. The factors associated with the occurrence of FOG included AOO not being under the age of 50 years, a lower degree of tremor symptom, impaired activities of daily living (ADL), UPDRS item 30 posture instability, unexplained weight loss, and a higher degree of fatigue. In addition, according to the ROC curve, any single factor was not as effective as the combination of multiple factors in predicting FOG, indicating that it was a good way to combine with multiple factors related to disease to construct prediction models. RF was used to validate all the variables that might be related to FOG, and the validation set had a C-index of 0.74 and an AUC of 0.74, proving that RF was a good approach to the prediction of FOG. What is more, the importance of risk factors for FOG had been ranked by Gini-index, and most factors found by Cox regression ranked highly, indicating that these factors were important to FOG.
The relationship between FOG and the AOO of PD is unclear. Some studies have demonstrated no significant relationship between the AOO and the development of FOG (15, 36). However, a later AOO is often characterized by the PIGD subtype (38) and the PIGD subtype is a risk factor for the development of FOG (15, 36). Several studies have shown that a later AOO of PD correlates with a faster progression of the disease, especially in imbalance and gait disorders (25). Thus, later AOO may increase the risk of FOG due to a PIGD subtype and faster disease progression.
We used UPDRS sub-items to assess balance and showed that patients with PD exhibiting posture instability have a higher likelihood of developing FOG. The observation that turning exacerbates FOG indicates that an impairment in the ability to control posture is a contributing factor (3). Postural control and balance in patients experiencing FOG were significantly more affected than in non-FOG patients, consistent with the characteristics of the mean PIGD scores in our baseline (39). According to the “threshold model” theory, patients with FOG have more severe gait and balance disorders, FOG occurs when the existing disorders accumulate to a threshold (40). Although there may be a concomitant relationship between impaired balance and FOG, our study still recognizes that impaired balance may be a predictor of FOG.
The PDQ-39 Dimension-2 outlines a variety of ADL conditions crucial for maintaining QoL (26). FOG in PD patients correlates with poor QoL as measured by PDQ-39 (3). Another study found that FOG had a high impact on the QoL of patients with PD (7). Motor functions decrease as PD advances, concomitant with a deterioration in the majority of ADL domains (41), which, in turn, may lead to an increased risk of FOG.
Unexplained weight loss is common in patients with PD and can cause negative health effects (42). A 5-year follow-up study found that weight loss heightened the risk of dependency and dementia, leading to poor prognosis (43), also, dementia was a risk factor of FOG (15). Patients with PD with the PIGD subtype had higher resting metabolic rates and lower body fat, which means patients with the PIGD subtype may more likely to experience weight change (44), and PIGD was identified as a possible risk factor for FOG. What is more, unexplained weight change especially weight loss was correlated with non-dopaminergic symptoms such as gait and balance disorders (45). To sum up, we speculate that unexplained weight change in PD may be associated with an increased risk of FOG.
Fatigue is a disabling and persisting symptom of PD that frequently persists or gets worse with time and negatively impacts the QoL of patients (46). One study revealed the roles of fatigue, as well as PIGD, in the development of FOG (47). A study of the relationship between non-motor symptoms with motor subtypes in PD found that the PIGD subtype was characterized by severe fatigue, which was most negatively impacting the QoL of patients (48). We speculate that fatigue contributes to FOG through the subtype of PIGD and factors that directly affect QoL.
There is less information known about the relationship between the degree of tremor symptom and FOG. Patients with FOG have lower UPDRS part III tremor sub-scores (49), consistent with the baseline characteristics in our study. Another investigation had shown that patients with the TD subtype had a slower disease progression than those with the PIGD subtype, indicating that there is a negative correlation between the TD subtype and the occurrence of FOG (25). This was consistent with the phenomenon that there was a lower proportion in TD subtype in FOG patients in our study, reversely, indicating that a lower degree of tremor symptom might correlate to FOG. Anticholinergics are PD therapies that treat tremor symptoms but do not alleviate akinesia or bradykinesia (50), indicating that there may be a relationship between tremor and cholinergic hyperfunction. PET imaging of patients with PD has found that nigrostriatal and basal forebrain cortical cholinergic denervation is correlated with the slowing of gait in PD (51), and gait disorders may lead to FOG (15, 36). These studies suggested that cholinergic denervation in nigrostriatal and basal forebrain cortical might be associated with FOG and that tremor symptom has a negative correlation with the occurrence of FOG.
Here are the limitations of this study. In this study, the clinical examination and assessment of FOG were mainly based on outpatient consultation and clinical scales assessment. However, due to differences in the educational levels of the patients, it was inevitable that some patients would fail to understand the descriptions of the doctors regarding FOG or fail to recall the detailed progress of their disease. Therefore, some important but mild features might be overlooked in the interview and clinical evaluation, leading to selection bias or recall bias. In this study, the attending physicians and the evaluators repeatedly asked about the symptoms to minimize the impact of these biases. In addition, the period of follow-up (1 year) was relatively short, thus the relatively low incidence of FOG may be related to this. Finally, this study aimed to construct a FOG prediction model suitable for patients with PD of all ages at H&Y stages 1–3, so patients with large age differences were included in the study to cover a wider population. Moreover, due to the large age difference of onset among patients, some discrete values might inevitably exist in the population distribution in this study, and the existence of these values might make the model unable to achieve higher accuracy. This might be the reason why there was no statistically significant difference in the age of onset between the two groups when the baseline characteristics were analyzed. Therefore, in future studies, a better assessment method for FOG and a longer follow-up might be needed.
Conclusion
This study constructed a 1-year cohort of Chinese patients with PD in the early and middle stages and used a variety of clinical scales to find out risk factors related to FOG, and constructed prediction models by Cox regression and machine learning. In this study, we identified some known risk factors associated with FOG and found that some relatively new factors might be associated with FOG including a lower degree of tremor symptom, unexplained weight loss, and a higher degree of fatigue. The prediction models showed the relatively good ability of prediction, thus providing a simple, convenient way for clinicians to predict FOG in the PD patients with H&Y stages 1–3.
Data Availability Statement
The original contributions presented in the study are included in the article/Supplementary Material, further inquiries can be directed to the corresponding author/s.
Ethics Statement
The studies involving human participants were reviewed and approved by the Ethics Committee of Xiangya Hospital of Central South University in China. The patients/participants provided their written informed consent to participate in this study. Written informed consent was obtained from the individual(s) for the publication of any potentially identifiable images or data included in this article.
Author Contributions
B-sT has full access to all the data in the study, takes responsibility for the integrity of the data and the accuracy of the data analysis, and obtained funding. KX and B-sT contributed to the conception, design of the study, and drafting of the manuscript. KX, X-xZ, R-cH, ZZ, Z-hL, QX, Q-yS, X-xY, J-fG, and B-sT contributed to the acquisition, analysis, or interpretation of data. X-yW, J-fG, and B-sT contributed to administrative, technical, or material support and study supervision. All authors contributed to the critical revision of the manuscript for important intellectual content.
Funding
This study was funded by the National Key Research and Development Program of China (Grant No. 2016YFC1306000).
Conflict of Interest
The authors declare that the research was conducted in the absence of any commercial or financial relationships that could be construed as a potential conflict of interest.
Publisher's Note
All claims expressed in this article are solely those of the authors and do not necessarily represent those of their affiliated organizations, or those of the publisher, the editors and the reviewers. Any product that may be evaluated in this article, or claim that may be made by its manufacturer, is not guaranteed or endorsed by the publisher.
Acknowledgments
All the authors are grateful to all subjects for their participation in our study.
Supplementary Material
The Supplementary Material for this article can be found online at: https://www.frontiersin.org/articles/10.3389/fneur.2021.684044/full#supplementary-material
Abbreviations
ADL, activities of daily living; AOO, age of onset; COMT, catechol-O-methyltransferase; C-index, Concordance index; EDS, excessive daytime sleepiness; EOPD, early onset PD; ESS, Epworth Sleepiness Scale; FOG, freezing of gait; HDRS, Hamilton Depression Rating Scale; Hoehn and Yahr stage, H&Y stage; HRS, Hyposmia Rating Scale; LEDD, levodopa equivalent daily dosage; ML, machine learning; MMSE, mini-mental state examination; NFOG-Q, New Freezing of Gait-Questionnaire; NMSS, Non-Motor Symptoms Scale; PD, Parkinson's Disease; PDQ-39, 39-item Parkinson's Disease Questionnaire; PFS, Parkinson's Fatigue Scale; PIGD, postural instability gait difficulty; QoL, quality of life; RBDQ-HK, rapid eye movement sleep behavior disorder questionnaire-Hong Kong; RF, random forest; TD, tremor dominant; UPDRS, Unified Parkinson's Disease Rate Scale.
References
1. Armstrong MJ, Okun MS. Diagnosis and treatment of Parkinson disease: a review. J Am Med Assoc. (2020) 323:548–60. doi: 10.1001/jama.2019.22360
2. Giladi N, Nieuwboer A. Understanding and treating freezing of gait in parkinsonism, proposed working definition, and setting the stage. Mov Disord. (2008) 23:1639–40. doi: 10.1002/mds.21927
3. Perez-Lloret S, Negre-Pages L, Damier P, Delval A, Derkinderen P, Destée A, et al. Prevalence, determinants, and effect on quality of life of freezing of gait in Parkinson disease. J Am Med Assoc Neurol. (2014) 71:884–90. doi: 10.1001/jamaneurol.2014.753
4. Kalia LV, Lang AE. Parkinson's disease. Lancet. (2015) 386:896–912. doi: 10.1016/S0140-6736(14)61393-3
5. Xie F, Gao X, Yang W, Chang Z, Yang X, Wei X, et al. Advances in the research of risk factors and prodromal biomarkers of Parkinson's disease. ACS Chem Neurosci. (2019) 10:973–90. doi: 10.1021/acschemneuro.8b00520
6. Factor SA. The clinical spectrum of freezing of gait in atypical parkinsonism. Mov Disord. (2008) 23:1639–40. doi: 10.1002/mds.21849
7. Moore O, Peretz C, Giladi N. Freezing of gait affects quality of life of peoples with Parkinson's disease beyond its relationships with mobility and gait. Mov Disord. (2007) 22:2192–5. doi: 10.1002/mds.21659
8. Bohnen NI, Frey KA, Studenski S, Kotagal V, Koeppe RA, Constantine GM, et al. Extra-nigral pathological conditions are common in Parkinson's disease with freezing of gait: an in vivo positron emission tomography study. Mov Disord. (2014) 29:1118–24. doi: 10.1002/mds.25929
9. Giladi N. Medical treatment of freezing of gait. Mov Disord. (2008) 23:1639–40. doi: 10.1002/mds.21914
10. Nutt JG, Bloem BR, Giladi N, Hallett M, Horak FB, Nieuwboer A. Freezing of gait: moving forward on a mysterious clinical phenomenon. Lancet Neurol. (2011) 10:734–44. doi: 10.1016/S1474-4422(11)70143-0
11. Gao C, Liu J, Tan Y, Chen S. Freezing of gait in Parkinson's disease: pathophysiology, risk factors and treatments. Transl Neurodegener. (2020) 9:12. doi: 10.1186/s40035-020-00191-5
12. Jia Y, Wang N, Zhang Y, Xue D, Lou H, Liu X. Alteration in the function and expression of SLC and ABC transporters in the neurovascular unit in Alzheimer's disease and the clinical significance. Aging Dis. (2020) 11:390–404. doi: 10.14336/AD.2019.0519
13. Jeon SG, Yoo A, Chun DW, Hong SB, Chung H, Kim JI, et al. The critical role of Nurr1 as a mediator and therapeutic target in Alzheimer's disease-related pathogenesis. Aging Dis. (2020) 11:705–24. doi: 10.14336/AD.2019.0718
14. Zhao X, Li S, Gaur U, Zheng W. Artemisinin improved neuronal functions in Alzheimer's disease animal model 3xtg mice and neuronal cells via stimulating the ERK/CREB signaling pathway. Aging Dis. (2020) 11:801–19. doi: 10.14336/AD.2019.0813
15. Kim R, Lee J, Kim HJ, Kim A, Jang M, Jeon B, et al. CSF β-amyloid 42 and risk of freezing of gait in early Parkinson disease. Neurology. (2019) 92:e40–7. doi: 10.1212/WNL.0000000000006692
16. D'Cruz N, Vervoort G, Chalavi S, Dijkstra BW, Gilat M, Nieuwboer A. Thalamic morphology predicts the onset of freezing of gait in Parkinson's disease. NPJ Parkinsons Dis. (2021) 7:20. doi: 10.1038/s41531-021-00163-0
17. Lin Y, Fu Y, Zeng YF, Hu JP, Lin XZ, Cai NQ, et al. Six visual rating scales as a biomarker for monitoring atrophied brain volume in Parkinson's disease. Aging Dis. (2020) 11:1082–90. doi: 10.14336/AD.2019.1103
18. Ehgoetz Martens KA, Lukasik EL, Georgiades MJ, Gilat M, Hall JM, Walton CC, et al. Predicting the onset of freezing of gait: a longitudinal study. Mov Disord. (2018) 33:128–35. doi: 10.1002/mds.27208
19. Peng L, Chen Z, Chen T, Lei L, Long Z, Liu M, Deng Q, et al. Prediction of the age at onset of spinocerebellar ataxia type 3 with machine learning. Mov Disord. (2021) 36:216–24. doi: 10.1002/mds.28311
20. Postuma RB, Berg D, Stern M, Poewe W, Olanow CW, Oertel W, Obeso J, et al. MDS clinical diagnostic criteria for Parkinson's disease. Mov Disord. (2015) 30:1591–601. doi: 10.1002/mds.26424
21. Nieuwboer A, Rochester L, Herman T, Vandenberghe W, Emil GE, Thomaes T, et al. Reliability of the new freezing of gait questionnaire: agreement between patients with Parkinson's disease and their carers. Gait Posture. (2009) 30:459–63. doi: 10.1016/j.gaitpost.2009.07.108
22. Fahn S, Elton RL, Members Members of the UPDRS Development Committee. Unified Parkinson's disease rating scale. In: Fahn D, Marsden CD, Calne D, Goldstein M, editors, Recent Development in Parkinson's Disease. vol. 2. Florham Park, NJ: Maacmillan Healthcare Information. (1987). p. 153–63, 293–304.
23. Tomlinson CL, Stowe R, Patel S, Rick C, Gray R, Clarke CE. Systematic review of levodopa dose equivalency reporting in Parkinson's disease. Mov Disord. (2010) 25:2649–53. doi: 10.1002/mds.23429
24. Butterfield PG, Valanis BG, Spencer PS, Lindeman CA, Nutt JG. Environmental antecedents of young-onset Parkinson's disease. Neurology. (1993) 43:1150–8. doi: 10.1212/WNL.43.6.1150
25. Jankovic J, McDermott M, Carter J, Gauthier S, Goetz C, Golbe L, et al. Variable expression of Parkinson's disease: a base-line analysis of the DATATOP cohort. the Parkinson Study Group. Neurology. (1990) 40:1529–34. doi: 10.1212/WNL.40.10.1529
26. Peto V, Jenkinson C, Fitzpatrick R, Greenhall R. The development and validation of a short measure of functioning and well being for individuals with Parkinson's disease. Qual Life Res. (1995) 4:241–8. doi: 10.1007/BF02260863
27. Wang G, Hong Z, Cheng Q, Xiao Q, Wang Y, Zhang J, et al. Validation of the Chinese non-motor symptoms scale for Parkinson's disease: results from a Chinese pilot study. Clin Neurol Neurosurg. (2009) 111:523–6. doi: 10.1016/j.clineuro.2009.02.005
28. Folstein MF, Folstein SE, McHugh PR. “Mini-mental state.” A practical method for grading the cognitive state of patients for the clinician. J Psychiatr Res. (1975) 12:189–98. doi: 10.1016/0022-3956(75)90026-6
29. Hamilton M. A rating scale for depression. J Neurol Neurosurg Psychiatry. (1960) 23:56–62. doi: 10.1136/jnnp.23.1.56
30. Rasquin A, Di Lorenzo C, Forbes D, Guiraldes E, Hyams JS, Staiano A, et al. Childhood functional gastrointestinal disorders: child/adolescent. Gastroenterology. (2006) 130:1527–37. doi: 10.1053/j.gastro.2005.08.063
31. Fu R, Cui SS, Du JJ, Huang P, He YC, Gao C, et al. Validation of the Parkinson fatigue scale in Chinese Parkinson's disease patients. Brain Behav. (2017) 7:e00712. doi: 10.1002/brb3.712
32. Johns MW. A new method for measuring daytime sleepiness: the Epworth sleepiness scale. Sleep. (1991) 14:540–5. doi: 10.1093/sleep/14.6.540
33. Millar Vernetti P, Perez Lloret S, Rossi M, Cerquetti D, Merello M. Validation of a new scale to assess olfactory dysfunction in patients with Parkinson's disease. Parkinsonism Relat Disord. (2012) 18:358–61. doi: 10.1016/j.parkreldis.2011.12.001
34. Shen SS, Shen Y, Xiong KP, Chen J, Mao CJ, Huang JY, et al. Validation study of REM sleep behavior disorder questionnaire-Hong Kong (RBDQ-HK) in east China. Sleep Med. (2014) 15:952–8. doi: 10.1016/j.sleep.2014.03.020
35. Ou R, Wei Q, Cao B, Song W, Hou Y, Liu H, et al. Predictors of freezing of gait in Chinese patients with Parkinson's disease. Brain Behav. (2018) 8:e00931. doi: 10.1002/brb3.931
36. Forsaa EB, Larsen JP, Wentzel-Larsen T, Alves G. A 12-year population-based study of freezing of gait in Parkinson's disease. Parkinsonism Relat Disord. (2015) 21:254–8. doi: 10.1016/j.parkreldis.2014.12.020
37. Gan J, Liu W, Cao X, Xie A, Li W, Yuan C, et al. Prevalence and clinical features of FOG in Chinese PD patients, a multicenter and cross-sectional clinical study. Front Neurol. (2021) 12:568841. doi: 10.3389/fneur.2021.568841
38. Thenganatt MA, Jankovic J. Parkinson disease subtypes. J Am Med Assoc Neurol. (2014) 71:499–504. doi: 10.1001/jamaneurol.2013.6233
39. Schlenstedt C, Muthuraman M, Witt K, Weisser B, Fasano A, Deuschl G. Postural control and freezing of gait in Parkinson's disease. Parkinsonism Relat Disord. (2016) 24:107–12. doi: 10.1016/j.parkreldis.2015.12.011
40. Plotnik M, Giladi N, Hausdorff JM. Is freezing of gait in Parkinson's disease a result of multiple gait impairments? Implications for treatment. Parkinsons Dis. (2012) 2012:459321. doi: 10.1155/2012/459321
41. Sperens M, Georgiev D, Eriksson Domellöf M, Forsgren L, Hamberg K, Hariz GM. Activities of daily living in Parkinson's disease: time/gender perspective. Acta Neurol Scand. (2020) 141:168–76. doi: 10.1111/ane.13189
42. van der Marck MA, Dicke HC, Uc EY, Kentin ZH, Borm GF, Bloem BR, et al. Body mass index in Parkinson's disease: a meta-analysis. Parkinsonism Relat Disord. (2012) 18:263–7. doi: 10.1016/j.parkreldis.2011.10.016
43. Cumming K, Macleod AD, Myint PK, Counsell CE. Early weight loss in parkinsonism predicts poor outcomes: evidence from an incident cohort study. Neurology. (2017) 89:2254–61. doi: 10.1212/WNL.0000000000004691
44. Femat-Roldán G, Gaitán Palau MA, Castilla-Cortázar I, Elizondo Ochoa G, Moreno NG, Martín-Estal I, et al. Altered body composition and increased resting metabolic rate associated with the postural instability/gait difficulty Parkinson's disease subtype. Parkinsons Dis. (2020) 2020:8060259. doi: 10.1155/2020/8060259
45. Cersosimo MG, Raina GB, Pellene LA, Micheli FE, Calandra CR, Maiola R. Weight loss in Parkinson's disease: the relationship with motor symptoms and disease progression. Biomed Res Int. (2018) 2018:9642524. doi: 10.1155/2018/9642524
46. Siciliano M, Trojano L, Santangelo G, De Micco R, Tedeschi G, Tessitore A. Fatigue in Parkinson's disease: a systematic review and meta-analysis. Mov Disord. (2018) 33:1712–23. doi: 10.1002/mds.27461
47. Sawada M, Wada-Isoe K, Hanajima R, Nakashima K. Clinical features of freezing of gait in Parkinson's disease patients. Brain Behav. (2019) 9:e01244. doi: 10.1002/brb3.1244
48. Huang X, Ng SY, Chia NS, Setiawan F, Tay KY, Au WL, et al. Non-motor symptoms in early Parkinson's disease with different motor subtypes and their associations with quality of life. Eur J Neurol. (2019) 26:400–6. doi: 10.1111/ene.13803
49. Aktürk T, Güven H, Güven B, Çomoglu S. Association of freezing of gait and clinical features in patients with Parkinson's disease. Acta Neurol Belg. (2021) 121:153–9. doi: 10.1007/s13760-019-01217-0
50. Ztaou S, Amalric M. Contribution of cholinergic interneurons to striatal pathophysiology in Parkinson's disease. Neurochem Int. (2019) 126:1–10. doi: 10.1016/j.neuint.2019.02.019
Keywords: freezing of gait, risk factors, prediction model, statistics, machine learning
Citation: Xu K, Zhou X-x, He R-c, Zhou Z, Liu Z-h, Xu Q, Sun Q-y, Yan X-x, Wu X-y, Guo J-f and Tang B-s (2021) Constructing Prediction Models for Freezing of Gait by Nomogram and Machine Learning: A Longitudinal Study. Front. Neurol. 12:684044. doi: 10.3389/fneur.2021.684044
Received: 22 March 2021; Accepted: 01 November 2021;
Published: 06 December 2021.
Edited by:
Joan Cabestany, Universitat Politecnica de Catalunya, SpainCopyright © 2021 Xu, Zhou, He, Zhou, Liu, Xu, Sun, Yan, Wu, Guo and Tang. This is an open-access article distributed under the terms of the Creative Commons Attribution License (CC BY). The use, distribution or reproduction in other forums is permitted, provided the original author(s) and the copyright owner(s) are credited and that the original publication in this journal is cited, in accordance with accepted academic practice. No use, distribution or reproduction is permitted which does not comply with these terms.
*Correspondence: Bei-sha Tang, YnN0YW5nNzM5OEAxNjMuY29t