 Pranav S. Ambadi1*
 Kristin Basche2
 Rebecca L. Koscik3
 Visar Berisha1†
 Julie M. Liss1†
 Kimberly D. Mueller2,4†
- 1College of Health Solutions, Arizona State University, Tempe, AZ, United States
- 2Division of Geriatrics, School of Medicine and Public Health, University of Wisconsin-Madison, Madison, WI, United States
- 3Wisconsin Alzheimer's Institute, School of Medicine and Public Health, University of Wisconsin-Madison, Madison, WI, United States
- 4Department of Communication Sciences and Disorders, University of Wisconsin-Madison, Madison, WI, United States
Clinical assessments often use complex picture description tasks to elicit natural speech patterns and magnify changes occurring in brain regions implicated in Alzheimer's disease and dementia. As The Cookie Theft picture description task is used in the largest Alzheimer's disease and dementia cohort studies available, we aimed to create algorithms that could characterize the visual narrative path a participant takes in describing what is happening in this image. We proposed spatio-semantic graphs, models based on graph theory that transform the participants' narratives into graphs that retain semantic order and encode the visuospatial information between content units in the image. The resulting graphs differ between Cognitively Impaired and Unimpaired participants in several important ways. Cognitively Impaired participants consistently scored higher on features that are heavily associated with symptoms of cognitive decline, including repetition, evidence of short-term memory lapses, and generally disorganized narrative descriptions, while Cognitively Unimpaired participants produced more efficient narrative paths. These results provide evidence that spatio-semantic graph analysis of these tasks can generate important insights into a participant's cognitive performance that cannot be generated from semantic analysis alone.
Introduction
Asking patients to describe a complex picture is a mainstay of clinical assessment tasks in aphasia, and increasingly so in the context of cognitive decline and dementia (1). This task is straight-forward to elicit, and its successful completion requires the ability to scan the scene, retrieve and sequence the relevant semantic symbols, and draw inferences about relationships and causation among the objects in the scene (2). The complexity of the cognitive-linguistic processing required for an accurate and comprehensive description makes the task an ideal candidate to magnify early and mild changes associated with medial temporal lobe and frontal lobe pathology (3).
The Cookie Theft picture description task from the Boston Diagnostic Aphasia Examination (4) is the most commonly elicited task, both clinically and in research and across a broad range of cognitive-linguistic conditions (2). The black and white line drawing portrays a kitchen scene, in which a mother is absentmindedly drying dishes at the sink while the running water overflows onto the floor. Behind her is her son, who stands atop a wobbly stool stealing cookies from a cookie jar for himself and for his sister, who holds out her hand in anticipation. The curtained window above the sink opens to a yard scene. Typically, transcripts of the spoken picture descriptions are coded by hand by trained individuals to tag parts of speech, content information units (CIUs) (content units, semantic relevance), empty speech, repetitions, among others; as well as acoustic measures extracted from speech recordings (1, 5–7). These data have been used to detect preclinical changes in cognitive-linguistics and differentiate among dementia etiologies such as Alzheimer's (AD), frontotemporal dementia (FTD), dementia due to Parkinson's disease (PD) and dementia with Lewy bodies (DLB) (8–10).
While there is nothing particularly special about The Cookie Theft picture itself—and indeed it has been criticized and even revised for being outdated and culturally non-inclusive (11, 12)—the original picture from the BDAE enjoys the status of having been used to elicit spontaneous speech data in the largest Alzheimer's disease and dementia cohort studies to date (13–15). As such, these picture description data are incomparable in their potential, in joint consideration with other biomarkers and data, to provide for increasingly earlier detection of pathological changes in AD and other dementias. Preclinical detection is essential for the development of disease altering interventions (16).
While the promise of cognitive-linguistic and acoustic metrics in the analysis of picture descriptions is high, these approaches leave important information on the table. In particular, they underspecify the ways in which the patient navigates the visual scene to “describe everything that is happening in the picture,” per the task instructions. Describing a picture has been shown to invoke the expected cortical pathways underlying semantic retrieval and production for the objects in the picture (anterior temporal lobe, inferior frontal gyrus, and sensorimotor cortices), but also to pathways linking aspects of the parietal lobe with posterior cortical circuits activated for visual processing of a picture (3). There is a growing body of evidence that the parietal lobe is among the earliest sites for neurodegenerative AD change; changes in visuospatial abilities may differentiate AD from other dementias (17, 18).
In the current study, we sought to develop algorithms that would allow us to characterize the ways in which participants navigate the visual scene using the large set of The Cookie Theft transcripts in the combined Wisconsin Registry for Alzheimer's Prevention (WRAP) + DementiaBank databases. We conjectured that by tracking the spatial movement paths from semantic object to semantic object, the results would reflect a culmination of visuospatial, attentional, and organizational capabilities. To that end, we apply graph theory and introduce the concept of spatio-semantic graphs—mathematical models that encode the sequential listing of content units in a transcript and their relative spatial position in The Cookie Theft image. Previous studies have shown the value of analyzing the lexical sequence via visual analyses and automatic speech recognition on recorded Cookie Theft descriptions to classify participants as AD or as healthy (19), and via natural language processing of dream reports to objectively differentiate normal and dysfunctional flows of thought (20). Along this line of research, we introduce this new graph-based representation with the aim of generating mechanistic and interpretable features capable of sensitively capturing early and emerging cognitive decline. We explore the distribution of these features on existing large-scale corpora to determine if they differ between clinical and control groups in ways that match performance expectations. By restricting our analysis to the transcripts alone to generate these graphs, we unlock additional value from the large amount of data already available to researchers in existing corpora.
Materials and Methods
Data
The data for this study accessed 1,058 audio recordings from the WRAP database and 291 audio recordings from the DementiaBank (DB) Pitt Corpus database. WRAP is a longitudinal, observational cohort of individuals in midlife, enriched for parental history of AD. WRAP began in 2001; participants attend study visits every 2 years in which they provide detailed health and lifestyle data, as well as undergo comprehensive neuropsychological testing [see (14) for complete description of WRAP]. Speech sample collection including Cookie Theft picture descriptions began in 2012. The Pitt Corpus from DementiaBank (https://dementia.talkbank.org) consists of audio-recorded data collected as part of a larger protocol administered by the Alzheimer and Related Dementias Study at the University of Pittsburgh School of Medicine (13). All data used in this study were transcripts from the first available audio recordings of The Cookie Theft picture description task only. Control data from DB (n = 99 participants) were combined with Cognitively Unimpaired-Stable participant data from WRAP [n = 836; (21)]; participants with AD from DB (n = 193) were combined with MCI participants from WRAP (n = 26). The combined dataset includes four possible diagnoses: Cognitively Unimpaired-Stable (CUS) (935), Cognitively Unimpaired-Declining (CUD) (181 from WRAP), Impaired but not MCI (14 from WRAP), and MCI/Dementia (219). Further participant characteristics, including average age, years of education, and PACC3 scores are included in the Supplementary Material.
Content-information-units (CIUs) used in this study were adapted from Croisile et al. (22), further defined by our group in Mueller et al. (6), and include a total of 23 Subjects, Objects, and Actions/Facts (see Supplementary Material).
Constructing Spatio-Semantic Graphs From Transcripts
All participant transcripts were processed in Python. The 23 CIUs were manually assigned (x, y) coordinate pairs on a pixel scale on a picture of The Cookie Theft (the copy used was 546 × 290 pixels). Figures 1A,B show a schematic of the approximate relative positions (and the descriptions) of the assigned CIUs overlaid on The Cookie Theft image.
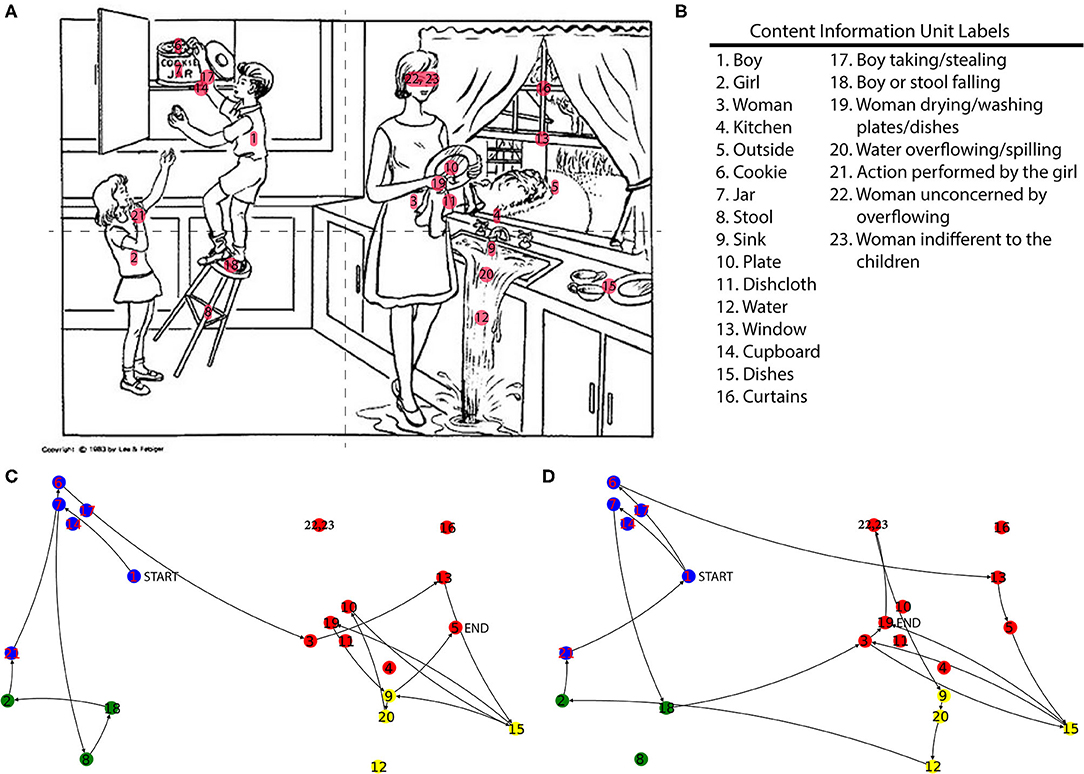
Figure 1. (A) The image used in the cookie theft picture description task overlaid with the CIUs at their approximate assigned coordinate locations. Dotted lines indicate the quadrant splits in the image. (B) Definitions for the CIU labels. (C) Examples of a Healthy Control participant's and (D) an AD participant's descriptions transformed into spatio-semantic graphs. Nodes are labeled the same as in panel A and are colored according to quadrants in which nodes fall. Starting and ending nodes are labeled to the right of the corresponding nodes for both participants. While both participants reach the same number of unique nodes mentioned, the AD participant's description has inefficient pathing with several repeats, cross quadrant transitions, and a larger total path distance traveled [(4), Used with Permission].
Transcripts from the WRAP and DB databases already have CIUs manually labeled, and these labels and their order of occurrence in the transcript were extracted and automatically encoded with the corresponding coordinate pairs. Next, the NetworkX package was used to transform the CIUs with their corresponding features, including coordinate pairs, and orderings into a set of nodes and edges that can be analyzed and visualized as a graph (23). The graph nodes represent the 23 CIUs in the image and the graph edges encode the order in which CIUs were mentioned in the transcript by the participant and the relative spatial location between two connected CIUs (via a Euclidean distance between two nodes connected by an edge). Additionally, each CIU was attributed a quadrant of the picture. Quadrant information was also processed in NetworkX to analyze and visualize participants' transitions between and within quadrants of the picture. In this representation, the nodes in the graph represent the quadrants of the image and the edges represent how the participant is moving across different quadrants as they describe the picture. Examples of transformed participant transcripts as graphs are also shown in Figures 1C,D.
Extracting Features From Spatio-Semantic Graphs
After transforming the participant transcripts into nodes and edges, several features from the graph were calculated. These features were extracted from the graph representation and the relative spatial position of the CIUs in the image. Additionally, metrics based on quadrant transitions were calculated from participants' transitions within and between these collective nodes. The features, their calculation, and their interpretation are described in Table 1.

Table 1. Feature descriptions.
Statistical Analysis
For the statistical analysis, two sets of ANCOVA models were used to determine whether there exist group-level differences in the features in Table 1 between individuals who are cognitively impaired and cognitively unimpaired and whether these differences occur at early stages of cognitive impairment.
For the first ANCOVA, the CUS and CUD diagnosis groups were combined into the Cognitively Unimpaired level (n = 1,116) of the diagnosis independent variable, and the Impaired but not MCI and MCI/Dementia diagnosis groups were combined into the Cognitively Impaired level (n = 233). For the second set, CUS and CUD were used as the two levels of the diagnosis independent variable while Impaired but not MCI and MCI/Dementia groups were omitted. The purpose of the second analysis was to determine whether the spatio-semantic graph features capture pre-clinical changes. Each individual feature was used in its own ANCOVA model as the dependent variable, with demographic data (Age, Education, and Gender) as well as the Unique Nodes variable as covariates. We adjust for Unique Nodes, which is a proxy for the number of content units in the transcript, as it was expected to vary between the Cognitively Unimpaired and Cognitively Impaired groups. To verify this, an initial one-way ANCOVA was performed comparing how these two participant groups differed in the number of Unique Nodes mentioned, while controlling for age, education, and gender. The data for all ANCOVA models were checked for homogeneity of variance (or homoscedasticity) using Levene's test. A significant result indicates that the null hypothesis that the diagnosis groups have equal population variances should be rejected. This violation of one of the assumptions to run an ANCOVA can lead to a decrease in the power of the test (24). In the following analyses, our aim is to evaluate whether the remaining features differ in distribution when compared across the diagnosis groups.
Results
The sections that follow list the results of the ANCOVAs for the two group comparisons of interest: Cognitively Unimpaired vs. Cognitively Impaired and CUS vs. CUD.
Cognitively Unimpaired vs. Cognitively Impaired
The top section of Table 2 contains the results for the ANCOVAs performed with the Cognitively Unimpaired and Cognitively Impaired groups as levels of the independent variable diagnosis, and Figure 2 contains plots depicting the Marginal Means of each ANCOVA with a significant result. There was a significant difference in the mean number of Unique Nodes mentioned after adjusting for covariates and the model passed Levene's test of homoscedasticity, so Unique Nodes was also used as a covariate for all other models.
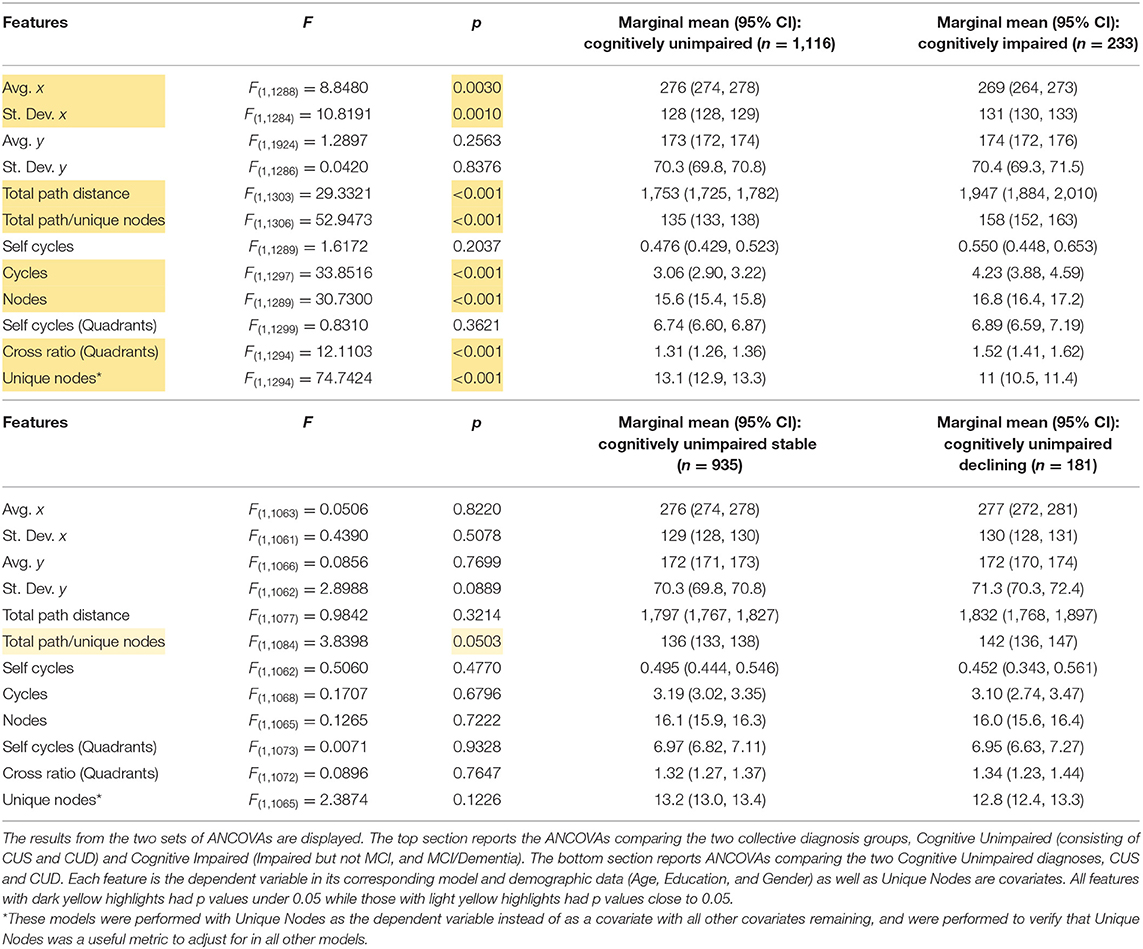
Table 2. ANCOVA models for features against two binary comparisons.
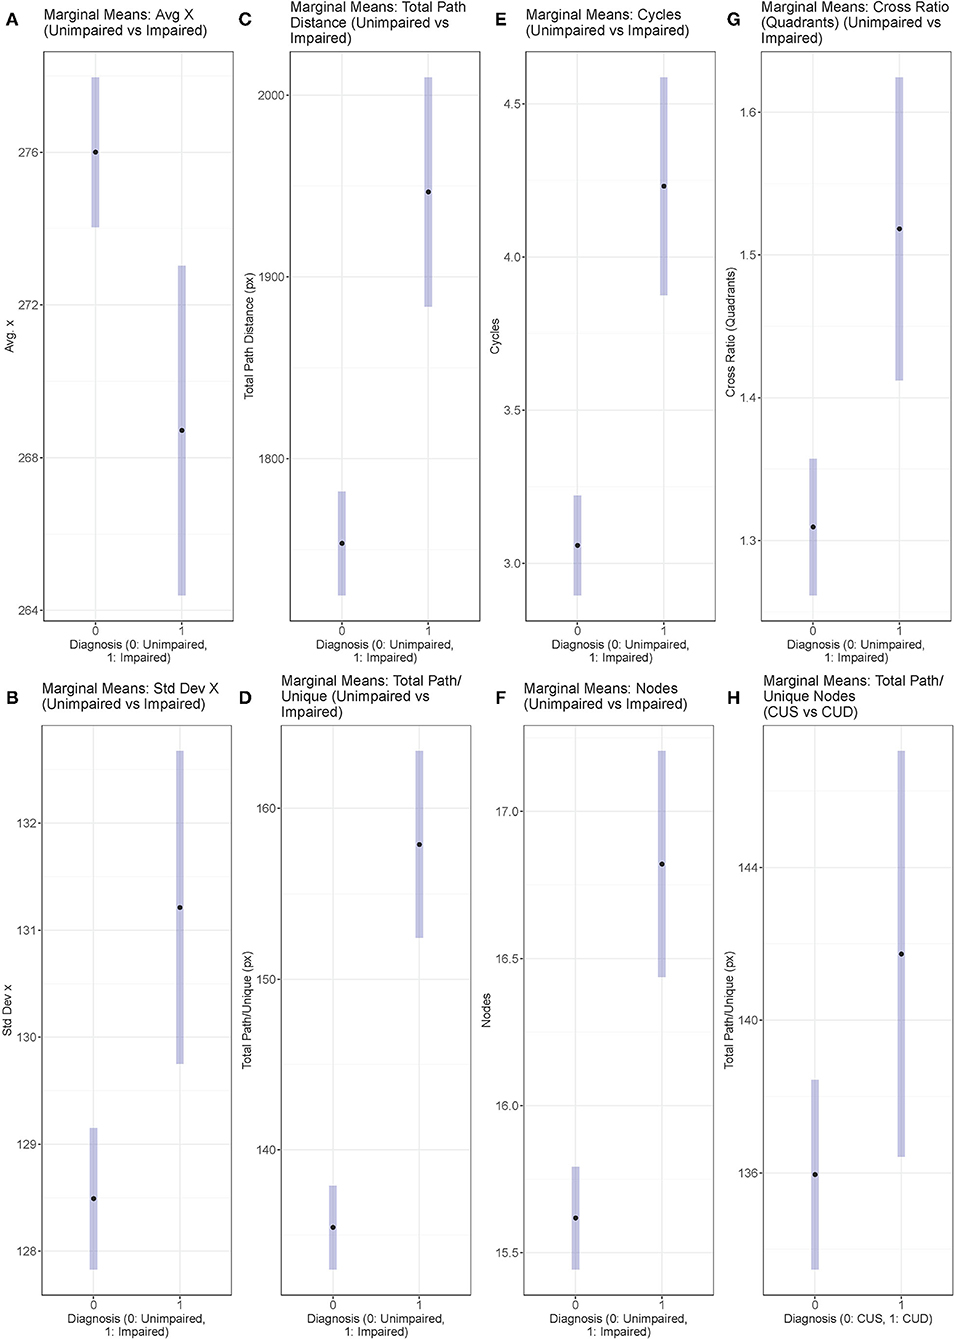
Figure 2. Marginal Means Plots displaying the marginal means for all features with significant results from both sets of ANCOVAs (A–G) Unimpaired vs. Impaired, and (H) CUS vs. CUD. Marginal means are estimated using model parameters, holding Age, Education, Gender, and Unique Nodes constant.
Six dependent variables achieved significance at p < 0.05: Average x and Standard Deviation of x, Total Path Distance/Unique Nodes, Cross Ratio (quadrants), Cycles, Total Path Distance. Levene's test revealed unequal variances for all but the Average x feature.
Comparing the marginal means for these features showed that the Cognitively Impaired group had a lower Average x position of mentioned nodes (more left aligned) and higher Standard Deviation of x compared to the Cognitively Unimpaired group, as well as a higher Total Path Distance/Unique Nodes, Total Path Distance, Cross Ratio (quadrants), Number of Cycles, and Number of nodes mentioned.
Cognitively Unimpaired-Stable vs. Cognitively Unimpaired-Declining
The bottom section of Table 2 contains the results for the ANCOVAs performed with the Cognitively Unimpaired-Stable and Cognitively Unimpaired-Declining diagnoses as levels of the independent variable diagnosis. As with the first set of models, Unique Nodes was used as a dependent variable in an ANCOVA to verify if there was a significant difference. There was no significant difference found, however we still chose to use Unique Nodes as a covariate for the other models run in this group comparison to maintain consistency with the previous set of models in controlling for this variable. While no features achieved p-values less than the threshold value of 0.05, the Total Path Distance/Unique Nodes feature had a p-value close to this threshold value. The marginal means show that the Cognitively Unimpaired-Declining group had a higher Total Path Distance/Unique Nodes. Additionally, Levene's test failed to reject the null hypothesis that the variances are equal for this feature.
Discussion
The ability to identify pre-clinical cognitive changes is essential to the development of interventions that halt or slow irreversible neurodegeneration. The Cookie Theft picture description task has been widely studied for its ability to elicit symptoms associated with early dementia and Alzheimer's disease (6, 25). In this investigation, we developed an approach to extract novel additional information from transcriptions of The Cookie Theft picture descriptions using graph theory and spatio-semantic graphs. Ours is not the first study to characterize elicited narrative paths on The Cookie Theft description task. Mirheidari et al. used features extracted from speech acoustics and automated transcripts, which characterized the timing on and between areas of interest in the picture, to train an automated classifier to label participants as AD or Healthy Control (19). In contrast, our contribution is a new representation generated from transcripts only, resulting in features that capture the visuospatial path the participant takes as they navigate the content units of the picture without accounting for timing. Further, we individually validate the features on a large-scale dataset that contains a number of subgroups of participants with varying degrees of cognitive status and progression profiles. This allows us to verify that performance patterns coincide with expectations informed by the extant literature on cognition and dementia. A natural extension of our work is to include the timing information as per Mirheidari et al. (19). Other notable studies process participant transcripts from the Cookie Theft Task using natural language processing methodologies to train classifiers to similar ends as Mirheidari et al. (26, 27). These studies use co-occurrence and semantic similarity representations gleaned from transcripts, with content information units and other linguistic features to improve classification of patient transcripts as healthy/control or MCI/AD. While our study encodes CIUs (via the graph nodes) and their co-occurrence (via the graph edges), we additionally visualize the transcripts and CIUs in the two-dimensional space relative to the Cookie Theft picture itself.
The first analysis revealed differences between the cognitively impaired and cognitively unimpaired groups that may reflect a combination of deficits in visuospatial, attentional, and organizational abilities. With regard to spatial orientation, the Cognitively Impaired group described more of the left side of the picture than the right, in contrast to the Cognitively Unimpaired group (Average x). This is notable because the right side actually contains more target CIUs than the left, but its full description requires more abstract inferences (e.g., the mom doesn't notice the children) than does the left side. This finding is corroborated by a study also using data from the DementiaBank database, in which many of the spatial neglect features indicated that the participants with dementia were less perceptive on the right side of the image (28). The Cognitively Impaired group also showed more shifts in attention between nodes on the left and right sides of the picture (higher Standard Deviation of x). This attention shifting by the Cognitively Impaired group was also evidenced by the Cross Ratio feature, with a higher number of crossings between quadrants than staying within a quadrant during their description, and more sporadic internode transitions and node repeats than the Cognitively Unimpaired group.
A number of other features seemed to be indicative of poor organization and perhaps memory deficits in the Cognitively Impaired group relative to Cognitively Unimpaired. The Cognitively Impaired group consistently had longer descriptions overall (Total Path Distance), and longer descriptions to reach a similar number of CIUs as the Cognitively Unimpaired group (Total Path Distance/Unique Nodes). This finding aligns with prior work showing reduced density of information and increased use of non-specific words in cognitive decline (6, 29, 30). Similarly, the Cognitively Impaired group's descriptions tended to repeat nodes more frequently, a finding that The Cookie Theft task has revealed before (31). Taken together, these results portray Cognitively Impaired picture descriptions as less organized and less efficiently constructed than those of the Cognitively Unimpaired group. This is in keeping with prior literature.
The second analysis attempted to find features that distinguished performance between the two Cognitively Unimpaired groups, CUS and CUD. As both groups are characterized by normal cognition, any differences that may implicate cognitive decline would be expected to be subtle and difficult to detect. We found that one feature, Total Path Distance/Unique Nodes, approached statistical significance (p = 0.0503), with marginal means of 136 for CUS and 142 for CUD. It is of note that this trend is similar to that observed in the comparison between the Cognitively Unimpaired and Cognitively Impaired groups. This overall pattern suggests that spatio-semantic graphs be further explored in preclinical and mild populations for evidence of early cognitive changes. It is likely that larger sample sizes are required to adequately assess the value of these features in these early clinical populations.
It is important to note the limitations in this study. Data collection for this study involves some labor-intensive steps. In this implementation, listeners have manually identified CIUs in the transcripts of spoken participant picture descriptions. Future work will focus on automated extensions utilizing automatic speech recognition algorithms to reduce this workload. Next, population variance is quite heterogeneous between the diagnosis groups across the two sets of ANCOVAs. Only one of the features in the Cognitively Impaired vs. Cognitively Unimpaired models (with the Unique Nodes covariate included) that reached significance, Average x, passed Levene's test of homoscedasticity. As the other features violated this assumption of an ANCOVA, the probability of significance of those models may be underestimated (24). The large variance in the Cognitively Impaired diagnosis group may stem from a wider array of causes of clinical impairment, which may be difficult to control for. To resolve this problem in a future study, it is advisable to balance the group sizes by increasing the sample size of the clinical group, as violations of the assumption of homoscedasticity are less important with equal group sizes. Also, because the primary purpose of this study was to evaluate the novel approach and validate its utility for detecting cognitive impairment, there is no evaluation of the marginal value of these features above and beyond other language-based features used in machine learning models of cognitive impairment based on speech (32). Such an evaluation in follow-on work will determine the extent to which these features make unique contributions to the models and improve separability between clinical groups. Finally, we did not identify statistically significant differences between CUS and CUD participants using features derived from the Spatio-Semantic Graphs. We posit that this reflects reduced effect size when detecting very early cognitive decline. However, as many of the features are found to be sensitive to differences in later stages of decline and the group trends approaching significance in Table 2 are in the correct direction, spatio-semantic graphs should be further analyzed in larger scale clinical studies involving participants with very early cognitive decline.
Data Availability Statement
The raw data supporting the conclusions of this article will be made available by the authors, without undue reservation.
Ethics Statement
The studies involving human participants were reviewed and approved by the Health Sciences Institutional Review Board of the University of Wisconsin and the other medical centers involved in data collection. The patients/participants provided their written informed consent to participate in this study.
Author Contributions
PA, RK, VB, JL, and KM contributed to the writing and editing of the manuscript. PA and KB performed statistical analyses. All authors contributed to manuscript revision, read, and approved the submitted version.
Funding
This research was supported by the National Institute on Deafness and Other Communication Disorders, National Institutes of Health Grant R01DC006859; National Institute on Aging (NIA), NIH Grant R01AG027161; NIA R01AG070940; NIA R01AG054059; NIA AG03705; and NIA AG05133.
Conflict of Interest
VB and JL are cofounders and have equity in Aural Analytics Inc.
The remaining authors declare that the research was conducted in the absence of any commercial or financial relationships that could be construed as a potential of conflict of interest.
Publisher's Note
All claims expressed in this article are solely those of the authors and do not necessarily represent those of their affiliated organizations, or those of the publisher, the editors and the reviewers. Any product that may be evaluated in this article, or claim that may be made by its manufacturer, is not guaranteed or endorsed by the publisher.
Acknowledgments
We would like to thank the participants of the WRAP study and the Pitt Corpus for their dedication to Alzheimer's disease research. We acknowledge the WRAP staff and students who carefully acquired and transcribed the speech sample data.
Supplementary Material
The Supplementary Material for this article can be found online at: https://www.frontiersin.org/articles/10.3389/fneur.2021.795374/full#supplementary-material
References
1. Mueller KD, Hermann B, Mecollari J, Turkstra LS. Connected speech and language in mild cognitive impairment and Alzheimer's disease: a review of picture description tasks. J Clin Exp Neuropsychol. (2018) 40:917–39. doi: 10.1080/13803395.2018.1446513
2. Cummings L. Describing the cookie theft picture: sources of breakdown in Alzheimer's dementia. Pragmatics Soc. (2019) 10:153–76. doi: 10.1075/ps.17011.cum
3. Geranmayeh F, Leech R, Wise RJS. Semantic retrieval during overt picture description: Left anterior temporal or the parietal lobe? Neuropsychologia. (2015) 76:125–35. doi: 10.1016/j.neuropsychologia.2014.12.012
4. Goodglass H, Kaplan E, Weintraub S. BDAE: The Boston Diagnostic Aphasia Examination. Philadelphia, PA: Lippincott Williams and Wilkins (2001).
5. Fraser KC, Meltzer JA, Graham NL, Leonard C, Hirst G, Black SE, et al. Automated classification of primary progressive aphasia subtypes from narrative speech transcripts. Cortex. (2014) 55:43–60. doi: 10.1016/j.cortex.2012.12.006
6. Mueller KD, Koscik RL, Turkstra LS, Riedeman SK, LaRue A, Clark LR, et al. Connected language in late middle-aged adults at risk for Alzheimer's disease. J Alzheimer's Dis: JAD. (2016) 54:1539–50. doi: 10.3233/JAD-160252
7. Stegmann GM, Hahn S, Liss J, Berisha V, Mueller KD. Large-scale cross-sectional and longitudinal validation of a digital speech-based measure of cognition. In: Alzheimer's Association International Conference. (2021). https://alz.confex.com/alz/2021/meetingapp.cgi/Paper/56199
8. Pakhomov SV, Smith GE, Marino S, Birnbaum A, Graff-Radford N, Caselli R, et al. A computerized technique to assess language use patterns in patients with frontotemporal dementia. J Neurolinguistics. (2010) 23:127–44. doi: 10.1016/j.jneuroling.2009.12.001
9. Pekkala S, Wiener D, Himali JJJ, Beiser AS, Obler LK, Liu Y, et al. Lexical retrieval in discourse: An early indicator of Alzheimer's dementia. Clin Linguist Phon. (2013) 27:905–21. doi: 10.3109/02699206.2013.815278
10. Smith KM, Ash S, Xie SX, Grossman M. Evaluation of linguistic markers of word-finding difficulty and cognition in Parkinson's disease. J Speech Lang Hear Res. (2018) 61:1691–9. doi: 10.1044/2018_JSLHR-L-17-0304
11. Berube S, Nonnemacher J, Demsky C, Glenn S, Saxena S, Wright A, et al. Stealing cookies in the twenty-first century: measures of spoken narrative in healthy versus speakers with aphasia. Am J Speech Lang Pathol. (2019) 28:321–9. doi: 10.1044/2018_AJSLP-17-0131
12. Evans E, Coley SL, Gooding DC, Norris N, Ramsey CM, Green-Harris G, et al. Preliminary assessment of connected speech and language as marker for cognitive change in late middle-aged Black/African American adults at risk for Alzheimer's disease. Aphasiology. (2021) 0:1–24. doi: 10.1080/02687038.2021.1931801
13. Becker JT, Boiler F, Lopez OL, Saxton J, McGonigle KL. The natural history of Alzheimer's disease: description of study cohort and accuracy of diagnosis. Arch Neurol. (1994) 51:585–94. doi: 10.1001/archneur.1994.00540180063015
14. Johnson SC, Koscik RL, Jonaitis EM, Clark LR, Mueller KD, Berman SE, et al. The wisconsin registry for Alzheimer's prevention: a review of findings and current directions. Alzheimer's Dementia Diagn Assess Dis Monitor. (2018) 10:130–42. doi: 10.1016/j.dadm.2017.11.007
15. Petersen RC, Aisen PS, Beckett LA, Donohue MC, Gamst AC, Harvey DJ, et al. Alzheimer's Disease Neuroimaging Initiative (ADNI). Neurology. (2010) 74:201–9. doi: 10.1212/WNL.0b013e3181cb3e25
16. Dubois B, Hampel H, Feldman HH, Scheltens P, Aisen P, Andrieu S, et al. Preclinical Alzheimer's disease: definition, natural history, and diagnostic criteria. Alzheimer's Dementia. (2016) 12:292–323. doi: 10.1016/j.jalz.2016.02.002
17. Jacobs HIL, Van Boxtel MPJ, Jolles J, Verhey FRJ, Uylings HBM. Parietal cortex matters in Alzheimer's disease: an overview of structural, functional and metabolic findings. Neurosci Biobehav Rev. (2012) 36:297–309. doi: 10.1016/j.neubiorev.2011.06.009
18. Salimi S, Irish M, Foxe D, Hodges JR, Piguet O, Burrell JR. Can visuospatial measures improve the diagnosis of Alzheimer's disease? Alzheimer's Dementia: Diagn Assess Dis Monitor. (2018) 10:66–74. doi: 10.1016/j.dadm.2017.10.004
19. Mirheidari B, Pan Y, Walker T, Reuber M, Venneri A, Blackburn D, et al. Detecting Alzheimer's disease by estimating attention and elicitation path through the alignment of spoken picture descriptions with the picture prompt. ArXiv:1910.00515 [Cs]. (2019). http://arxiv.org/abs/1910.00515
20. Mota NB, Vasconcelos NAP, Lemos N, Pieretti AC, Kinouchi O, Cecchi GA, et al. Speech graphs provide a quantitative measure of thought disorder in psychosis. PLoS ONE. (2012) 7:e34928. doi: 10.1371/journal.pone.0034928
21. Langhough Koscik R, Hermann BP, Allison S, Clark LR, Jonaitis EM, Mueller KD, et al. Validity evidence for the research category, “Cognitively Unimpaired—Declining,” as a risk marker for mild cognitive impairment and Alzheimer's disease. Front Aging Neurosci. (2021) 13:404. doi: 10.3389/fnagi.2021.688478
22. Croisile B, Ska B, Brabant M-J, Duchene A, Lepage Y, Aimard G, et al. Comparative study of oral and written picture description in patients with Alzheimer's Disease. Brain Lang. (1996) 53:1–19. doi: 10.1006/brln.1996.0033
23. Hagberg A, Swart P, S Chult D. Exploring network structure, dynamics, and function using NetworkX. (2008). Los Alamos, NM (United States): Los Alamos National Lab (LANL).
24. Glass GV, Peckham PD, Sanders JR. Consequences of failure to meet assumptions underlying the fixed effects analyses of variance and covariance. Rev Educ Res. (1972) 42:237–88. doi: 10.3102/00346543042003237
25. Guo Y, Li C, Roan C, Pakhomov S, Cohen T. Crossing the “Cookie Theft” corpus chasm: applying what BERT learns from outside data to the ADReSS challenge dementia detection task. Front Comput Sci. (2021) 3:26. doi: 10.3389/fcomp.2021.642517
26. Millington T, Luz S. Analysis and classification of word co-occurrence networks from Alzheimer's patients and controls. Front Comput Sci. (2021) 3:36. doi: 10.3389/fcomp.2021.649508
27. Santos L, Corrêa Júnior EA, Oliveira Jr, O, Amancio D, Mansur L, Aluísio S. Enriching complex networks with word embeddings for detecting mild cognitive impairment from speech transcripts. In: Proceedings of the 55th Annual Meeting of the Association for Computational Linguistics (Volume 1: Long Papers). (2017) 1284–96. doi: 10.18653/v1/P17-1118
28. Masrani V. Detecting Dementia from Written and Spoken Language. (2018). University of British Columbia.
29. Ahmed S, Haigh A-MF, de Jager CA, Garrard P. Connected speech as a marker of disease progression in autopsy-proven Alzheimer's disease. Brain. (2013) 136:3727–37. doi: 10.1093/brain/awt269
30. Verfaillie SCJ, Witteman J, Slot RER, Pruis IJ, Vermaat LEW, Prins ND, et al. High amyloid burden is associated with fewer specific words during spontaneous speech in individuals with subjective cognitive decline. Neuropsychologia. (2019) 131:184–92. doi: 10.1016/j.neuropsychologia.2019.05.006
31. Eyigoz E, Mathur S, Santamaria M, Cecchi G, Naylor M. Linguistic markers predict onset of Alzheimer's disease. EClinicalMedicine. (2020) 28. doi: 10.1016/j.eclinm.2020.100583
Keywords: Alzheimer's disease, dementia, speech biomarkers, cognition, semantic analysis, cookie theft, graph theory
Citation: Ambadi PS, Basche K, Koscik RL, Berisha V, Liss JM and Mueller KD (2021) Spatio-Semantic Graphs From Picture Description: Applications to Detection of Cognitive Impairment. Front. Neurol. 12:795374. doi: 10.3389/fneur.2021.795374
Received: 15 October 2021; Accepted: 15 November 2021;
Published: 09 December 2021.
Edited by:
Panying Rong, University of Kansas, United StatesReviewed by:
Kathleen Fraser, National Research Council Canada (NRC-CNRC), CanadaAlexandra Economou, National and Kapodistrian University of Athens, Greece
Copyright © 2021 Ambadi, Basche, Koscik, Berisha, Liss and Mueller. This is an open-access article distributed under the terms of the Creative Commons Attribution License (CC BY). The use, distribution or reproduction in other forums is permitted, provided the original author(s) and the copyright owner(s) are credited and that the original publication in this journal is cited, in accordance with accepted academic practice. No use, distribution or reproduction is permitted which does not comply with these terms.
*Correspondence: Pranav S. Ambadi, cGFtYmFkaUBhc3UuZWR1
†These authors share senior authorship