 Dan Zhu
 Yamei Zhu2
- 1Xinqiao Hospital, Army Medical University (Third Military Medical University), Chongqing, China
- 2Deptartment of Infectious Diseases, Wuhua Ward, 920th Hospital of Joint Logistics Support Force of Chinese PLA, Kunming, Yunnan, China
- 3Dalian Hunter Information Consulting Co. LTD, Dalian, China
Introduction: Screening for metabolically relevant differentially expressed genes (DEGs) shared by hepatocellular carcinoma (HCC) and vascular cognitive impairment (VCI) to explore the possible mechanisms of HCC-induced VCI.
Methods: Based on metabolomic and gene expression data for HCC and VCI, 14 genes were identified as being associated with changes in HCC metabolites, and 71 genes were associated with changes in VCI metabolites. Multi-omics analysis was used to screen 360 DEGs associated with HCC metabolism and 63 DEGs associated with VCI metabolism.
Results: According to the Cancer Genome Atlas (TCGA) database, 882 HCC-associated DEGs were identified and 343 VCI-associated DEGs were identified. Eight genes were found at the intersection of these two gene sets: NNMT, PHGDH, NR1I2, CYP2J2, PON1, APOC2, CCL2, and SOCS3. The HCC metabolomics prognostic model was constructed and proved to have a good prognostic effect. The HCC metabolomics prognostic model was constructed and proved to have a good prognostic effect. Following principal component analyses (PCA), functional enrichment analyses, immune function analyses, and TMB analyses, these eight DEGs were identified as possibly affecting HCC-induced VCI and the immune microenvironment. As well as gene expression and gene set enrichment analyses (GSEA), a potential drug screen was conducted to investigate the possible mechanisms involved in HCC-induced VCI. The drug screening revealed the potential clinical efficacy of A-443654, A-770041, AP-24534, BI-2536, BMS- 509744, CGP-60474, and CGP-082996.
Conclusion: HCC-associated metabolic DEGs may influence the development of VCI in HCC patients.
Introduction
Hepatocellular carcinoma (HCC) is one of the most common malignant tumors worldwide, characterized by the insidious and rapid onset, poor prognosis, and high metastasis rate. With an estimated 906,000 new cases of HCC in 2020, accounting for 4.7% of the overall cancer incidence, HCC is the sixth most common malignancy worldwide, after breast, lung, colorectal, prostate, and stomach cancers (1). It is the third most common cause of cancer-related death and patients generally have a poor prognosis as the onset is insidious and the tumor is often at an advanced stage at the time of diagnosis. In 2020, ~830,000 people died from HCC globally, accounting for 8.3% of cancer-related deaths (1). In recent years, with the popularization of hepatitis B vaccination and the improved efficacy of antiviral drug therapy, the incidence of virus-related HCC is on the decline, while non-alcoholic liver disease and metabolic syndrome-related HCC are increasing year by year due to lifestyle changes and dietary habits (2). The main treatment options for HCC include surgical resection, radiofrequency ablation, chemotherapy, liver-targeted drugs, and liver transplantation. However, due to the insidious onset of the disease, the early stages may present with only non-specific symptoms such as weakness and dyspepsia, and progresses rapidly, resulting in the diagnosis of the tumor at an advanced stage, by when the opportunity for radical treatment had already passed (3). The late stage of HCC is often associated with complications such as gastrointestinal bleeding, infection, hepatic and renal syndrome, and hepatic encephalopathy. When complicated by hepatic encephalopathy, clinical manifestations may include behavioral abnormalities, cognitive impairment, altered consciousness, and even coma, which are often combined with liver dysfunction making the treatment more difficult and the patient's prognosis poor (4, 5). However, no extensive study has been conducted to determine whether other factors may contribute to cognitive impairment in patients with HCC.
Vascular cognitive impairment (VCI) is a syndrome of cognitive impairment secondary to bleeding, ischemic stroke, cerebrovascular injury, and other diseases. Patients may present with cognitive impairment such as memory problems, behavioral abnormalities, speech difficulties, and even dementia (6). Various mechanisms involving immune inflammatory response, oxidative stress, and damage to the blood-brain barrier are associated with the development of VCI (7–11). Some studies have also reported that a strong correlation between HCC and the changes in intestinal microbiota in Alzheimer's disease has been observed, indicating that HCC may promote cognitive impairment in Alzheimer's disease by affecting the intestinal microbial ecology (12). Furthermore, some studies have found common transcriptional changes between Alzheimer's disease and HCC and other cancers (13). Abnormal levels of circulating metabolites such as amino acids and fatty acids are associated with cognitive impairment caused by vascular dysfunction (14–16). Metabolomic analysis showed that dysregulation of various metabolites was closely related to HCC, suggesting its involvement in promoting the occurrence of HCC-related VCI (17). The circulating metabolites may, therefore, be affected by HCC, thereby resulting in cognitive impairment.
Metabolomics is the qualitative and quantitative analysis of the metabolites of an organism or cell during a specific period to deduce the relationship between different metabolites and the corresponding pathophysiological state. Metabolomics is now widely used in many fields such as disease diagnosis, drug toxicology, pharmaceutical development, and microbial metabolism (18, 19). Since abnormal metabolism is a common feature of cancer cells, metabolomics plays an important role in tumor prognosis, drug target research, and metabolic marker screening (20). The liver is the central organ of human metabolism and is involved in regulating the expression levels of many metabolites, which makes the metabolomic study of HCC particularly important (21, 22). Zoe Hall and other researchers found that the proliferation of HCC tumor cells is closely related to altered metabolic pathways such as adipogenesis and phosphatidylcholine production (23). Further, the serum bile acid levels were significantly higher and serum sphingolipid levels were lower in HCC patients, suggesting that the changes in these metabolites are closely related to the development of HCC (24). Metabolomic analysis of VCI showed that the disease-related biomarkers were mainly associated with homocysteine, folate, branched-chain amino acids, and lipid metabolism (16). Sphingolipids, cholesterol, phospholipids, and other lipids play an important role in the maintenance of the structure and function of neuronal structures. Therefore, some researchers have suggested that disorders of lipid metabolism could be vital in the pathogenesis of VCI, but the exact mechanism is not yet clear (25). This suggests that HCC and VCI are associated with metabolomic changes, and related studies are needed.
The development of next generation sequencing (NGS) technologies and bioinformatic tools allows a large-scale analysis of each parameter involved in cancer and other systemic disease (26–32). In this study, the Gene Expression Omnibus (GEO) database and literature search were utilized to obtain metabolomic data on HCC and VCI, and Metaboanalyst 5.0 was used to obtain the metabolic differentially expressed genes (DEGs) as previous researches (33–36). In order to understand the possible mechanism of VCI caused by HCC and provide some theoretical basis for the clinical treatment of HCC, we conducted principal component analyses, functional enrichment analyses, immune function analyses, and tumor mutational burden (TMB) analyses of the above genes. We investigated possible mechanisms of VCI induction by HCC in this study.
Methods
Data acquisition
VCI clinical and transcriptomic (mRNA) data were downloaded from GEO database. The filter conditions were set to ①” vascular cognitive impairment”; ② human. This study was derived from 10 “normal cognitive patients” and 10 “patients with VCI” from the microarray dataset GSE201482 in 10 cases. DEGs of VCI were screened according to the criteria of P-value < 0.05 and |log2FC| ≥ 1.00. HCC clinical, transcriptomic (mRNA) data were downloaded from TCGA (https://portal.gdc.cancer.gov/) website, and their expression matrix was compiled and summarized by R. DEGs were screened by adjust P-value < 0.05 and |log2FC| ≥ 1.0, and heat maps were plotted. DEGs were categorized into up-regulated, down-regulated, and non-statistically significant groups, and then imported into R for volcano plots. Bioconductor R software's bioconductor R package was used to normalize and calculate expression values for microarray data. Based on the screened DEGs, heat maps and cluster analyses were performed using the heatmap package. We transformed DEG P-value to –log10, grouped them according to log2FC, and imported the processed data into R for volcano plotting. The HCC expression matrix data was downloaded from the Cancer Genome Atlas database. According to the pre-screened genes, the relative expression of the core genes in the HCC expression data was analyzed using “ggpubr” package and a relative expression box plot was drawn.
Metabolomics matrix construction and multi-omics analyses
For multi-omics analysis, metabolically differentially expressed metabolites and DEGs were imported from HCC and VCI metabolomics into Metaboanalyst 5.0, while metabolomics genes associated with HCC and VCI were incorporated into Venny 2.1 software (http://bioinfogp.cnb.csic.es/tools/venny/index.html) for plotting Venn diagrams and obtaining metabolomic differential genes associated with HCC and VCI.
Immuno-infiltration analysis and immunofunctional analysis
The HCC expression matrix data obtained above were subjected to a deconvolution algorithm using the CIBERSORT package, which allows estimation of the cellular composition of complex tissues based on normalized gene expression data, as well as quantification of specific cell types. The immune cell sorting perl script is used to sort the HCC-associated infiltrating immune cells. The limma R package in R was used to calculate expression values from the microarray data. HCC and paraneoplastic tissues were analyzed using the CIBERSORT package. With the CIBERSORT package, the composition of immune cells in each sample was further analyzed and histograms were plotted. Pheatmap was used to generate heat maps showing immune cell distribution. HCC immune cell infiltration co-expression map was plotted using corrplot to analyse interactions between immune cell populations. Finally, the expression of each immune cell was analyzed using the vioplot package in HCC tissues and paracancerous tissues. In relation to immunofunctional analysis, we used the “limma,” “GSVA,” “gseabase,” “pheatmap,” and “reshape2” packages to perform immunofunctional analysis on HCC metabolomics-related genes to identify targets for precision therapy.
VCI-associated HCC metabolic genes prognostic model
Standardized HCC metabolomics data were merged with HCC clinical data, and univariate and multifactorial Cox prognostic survival analyses on HCC differential genes were performed using the R language packages survival, caret, glmnet, survminer, and survroc to plot survival curves for closely related key metabolomics genes. In addition, 370 cases were randomly divided into testing group (n = 185) and training group (n = 185). R software was used to perform risk survival analysis on the pre-merged data, plotting risk survival curves and receiver operator characteristic (ROC) curves for testing group, training group, and total group as previous studies (37–40). On the general clinical data of HCC, the survival package was again used to perform clinical statistical analysis and risk prognostic analysis. To investigate the risk factors associated with HCC, forest plots, and histograms were plotted for single- and multi-factor independent prognostic analysis. Further model validation on clinical subgroups was performed using the “survival” and “survminer” packages.
Principal component analysis and enrichment analysis of gene ontology (GO) and the Kyoto encyclopedia of genes and genomes (KEGG) for genes associated with HCC metabolomics
The scatterplot3d package was used for the principal component analysis of HCC metabolomics-related genes and HCC-related risk genes, and the clusterprofilergo.R package in R (https://www.r-project.org/) software and Perl language were used for metabolomics-related HCC GO analysis for differential genes. KEGG pathway enrichment analysis was performed using the clusterprofilerkegg.R package to analyze core pathway enrichment based on enrichment factor values and to investigate the biological functions and signaling pathways that may be associated with HCC.
TMB analysis of HCC metabolism-related genes
TMB files were downloaded from the TCGA database and correlation tests between core genes and TMB were performed using functions, with correlation coefficients and P-values calculated. In addition, correlation analysis between metabolism-related genes and HCC tumor mutational load was performed using the survival and survminer software packages, and correlation coefficients and P-values were calculated.
Gene set enrichment analysis (GSEA)
The GSEA website was used to download the GO/KEGG annotation files for the whole transcriptome genes, and GO and KEGG enrichment analyses of the core genes were performed using the limma, org. Hs. eg. db, clusterprofiler, and enrichplot packages as previous researches (41–43). Analyses of cellular component (CC), molecular function (MF), biological process (BP), and KEGG pathway enrichment were conducted for the core genes. Based on the enrichment factor values, we analyzed the core pathway enrichment and examined the potential biological functions and signaling pathways of the HCC core genes.
Screening for potential therapeutic drugs
“pRRophetic” is a package that can be used to predict phenotypes from gene expression data, predict drug sensitivity in external cell lines, and predict clinical data. In order to determine the drug sensitivity of each sample from TCGA database, we used the R package “pRRophetic” to obtain HCC metabolism-related genes after prescreening.
Results
Metabolites with differential levels in patients with HCC and VCI
A total of 14 differentially expressed metabolites from HCC, including 2 up-regulated and 12 down-regulated metabolites, as well as 71 differentially expressed metabolites from VCI, including 32 up-regulated and 39 down-regulated metabolites, were identified by screening criteria of fold change (FC) >1.5 and P-value < 0.05. Data enrichment and metabolic pathway analysis were performed using Metabolanalyst 5.0. Ammonia recycling, glutathione metabolism, glutamate metabolism, and Beta A metabolism were enriched for differentially expressed metabolites of VCI (Figures 1A, B). As part of the metabolic signaling pathway enriched for aminoacyl-tRNA, glycine, serine, and threonine biosynthesis, valine, leucine, and isoleucine biosynthesis, glyoxylate and dicarboxylate metabolism, phenylalanine metabolism, phenylalanine, tyrosine, and tryptophan biosynthesis, etc (Figures 1A, B). Among the metabolic functions enriched for differentially expressed metabolites of HCC are the Warburg effect, gluconeogenesis, purine metabolism, phosphatidylethanolamine biosynthesis, phosphatidylcholine biosynthesis, and arginine and proline metabolism (Figures 1C, D). The main enriched metabolic signaling pathways include glycerophospholipid metabolism, citrate cycle (TCA cycle), pyruvate metabolism, purine metabolism, glycolysis/gluconeogenesis, and the alanine, aspartate, and glutamate metabolism (Figures 1C, D). Based on the above, it is evident that metabolism-related genes may play a role in HCC and VCI.
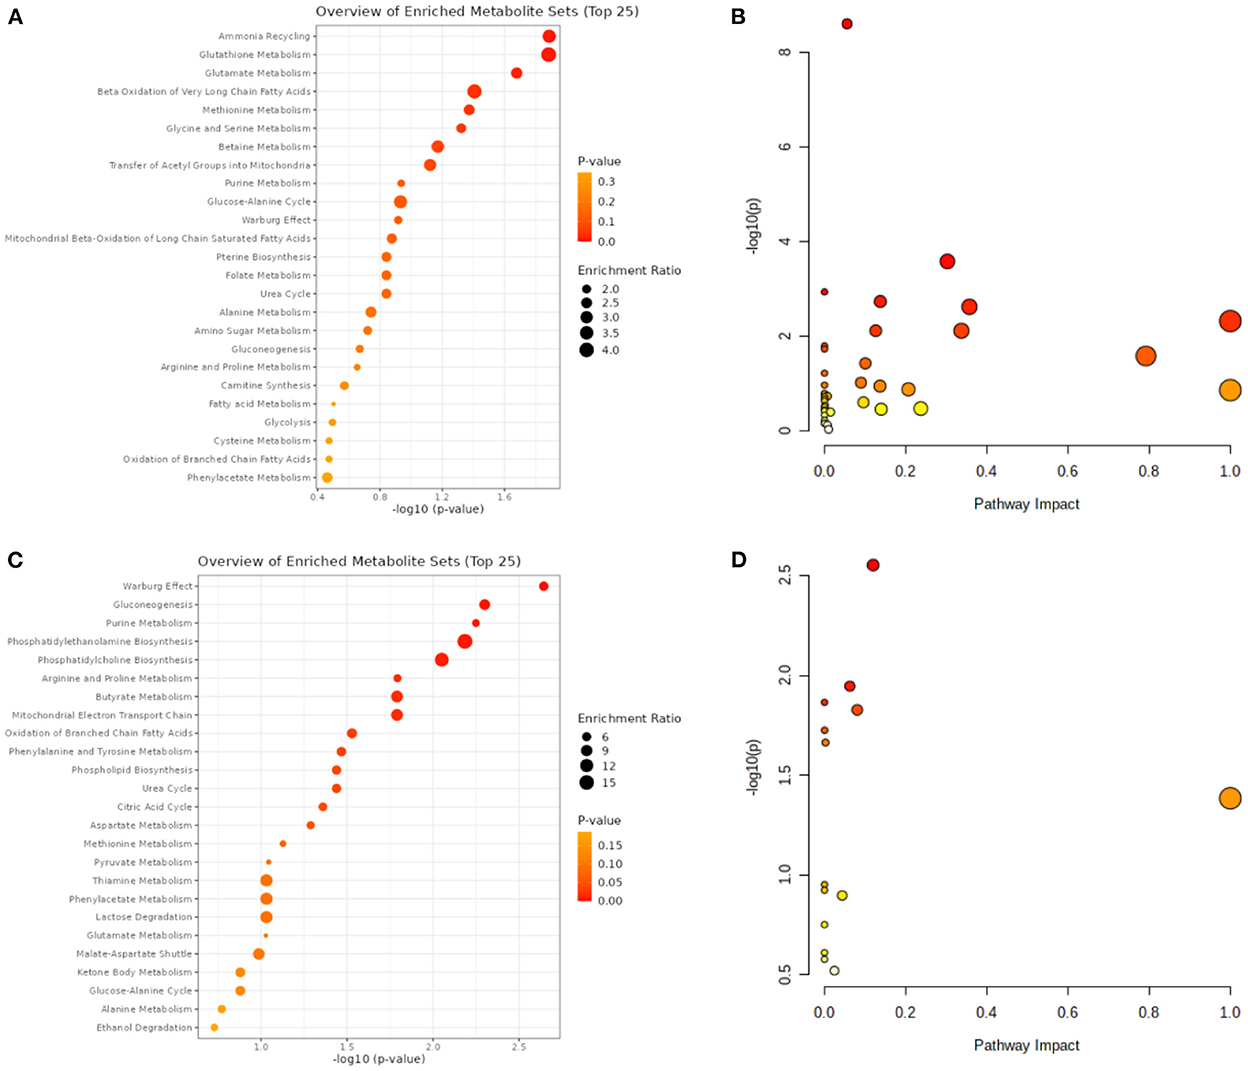
Figure 1. VCI and HCC metabolomic analysis. (A) VCI differentially expressed metabolite enrichment analysis diagram; (B) Differentially expressed metabolite signaling pathways in VCI; (C) Differentially expressed metabolite enrichment distributions in HCC; (D) Differentially expressed metabolite signaling pathways in HCC.
HCC and VCI transcriptome DEGs
The TCGA website (https://portal.gdc.cancer.gov/) was used to download clinical and transcriptomic expression data related to HCC, and a total of 424 transcriptomic and 377 clinical datasets were obtained according to the predefined screening criteria. Differential expression data were screened based on adjusted P-values < 0.05 and |log2FC| ≥ 1.0. A total of 882 differentially expressed mRNAs were screened in the dataset, including 487 up-regulated mRNAs and 395 down-regulated mRNAs; DEGs were screened for differential analysis based on P-value. The top 100 most significant differentially expressed mRNAs were screened based on P-values and plotted as heat maps (Figure 2A). Following differential analysis, P-values were –log10 transformed, grouped according to log2 FC (groups of up-regulated DEGs, down-regulated DEGs, and non-statistically significant DEGs), and imported into R for plotting volcanoes (Figure 2B). The GSE201482 dataset contained 343 differentially expressed mRNAs, including 179 up-regulated and 164 down-regulated mRNAs. The top 100 differentially expressed coding RNAs with the greatest significance were screened, and the heat map was created based on the P-value (Figure 2C). Further, –log10 (P-value) was transformed from differential analysis microarray data, –log10 (P-value) was grouped by log2 FC (groups of up-regulated DEGs, down-regulated DEGs, and non-statistically significant DEGs), and the processed data was imported into R to plot volcanoes (Figure 2D).
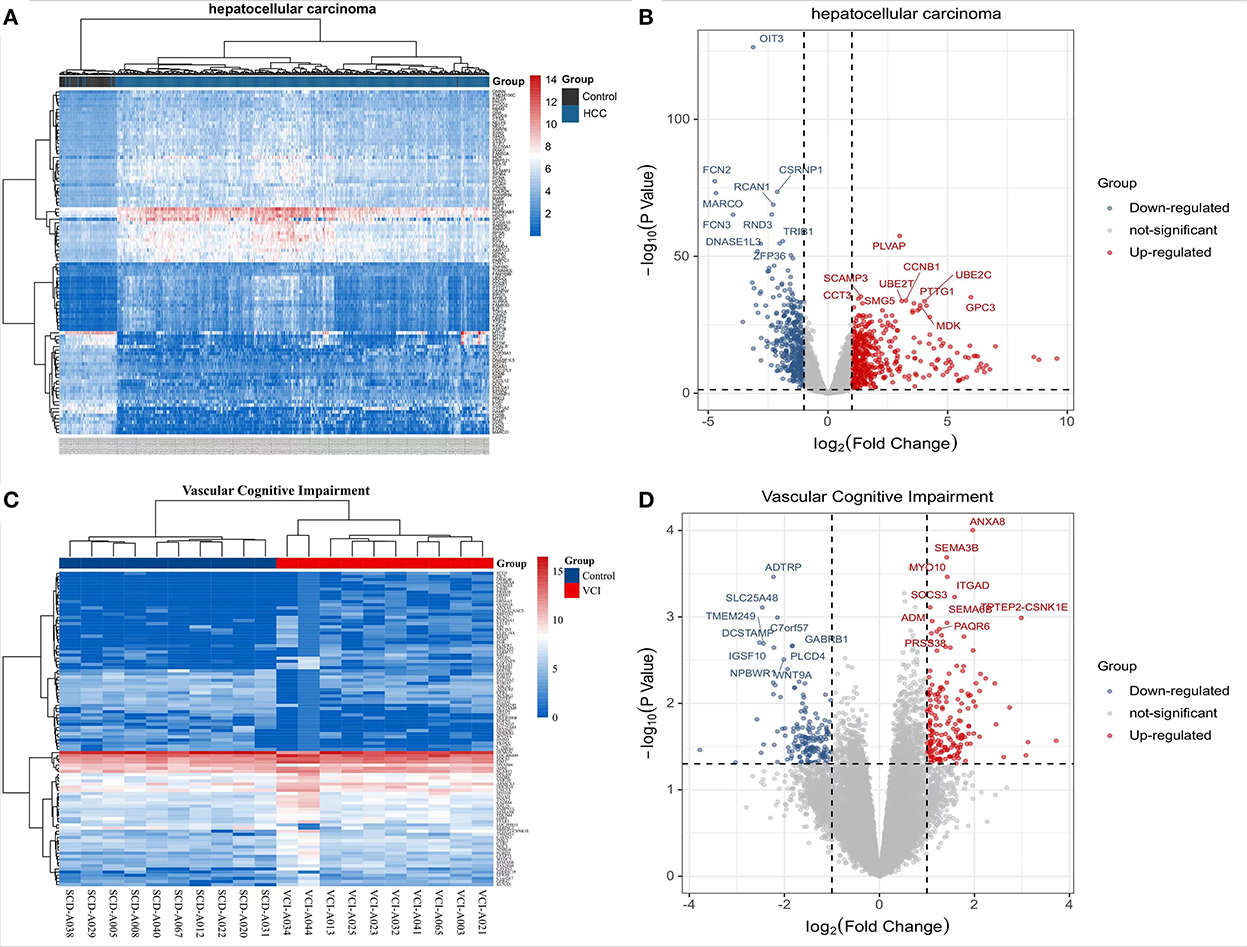
Figure 2. Transcriptomic analysis of HCC and VCI. (A) Heat map of DEGs clustering for HCC transcriptomics; (B) Transcriptomics of DEGs volcanoes for HCC; (C) Heat map of DEGs clustering for VCI transcriptomics; (D) Volcano map for VCI transcriptomics based on DEGs.
Multi-omics analysis of HCC and VCI
The differentially expressed metabolites and DEGs of HCC and VCI obtained in the previous stage were imported into Metaboanalyst 5.0 for multi-omics analysis, and 360 metabolic DEGs associated with HCC and 63 metabolic DEGs associated with VCI were obtained (Figures 3A, B). To plot the Venn diagram, the above metabolomics genes associated with HCC and VCI were imported into Venny 2.1 software (http://bioinfogp.cnb.csic.es/tools/venny/index.html). Accordingly, 8 mRNAs were selected, including 1 up-regulated and 7 down-regulated mRNAs, namely: NNMT, PHGDH, NR1I2, CYP2J2, PON1, APOC2, CCL2, and SOCS3 (Figure 3C). Figure 4 shows a heat map of those differentially metabolized DEGs related to HCC and VCI.
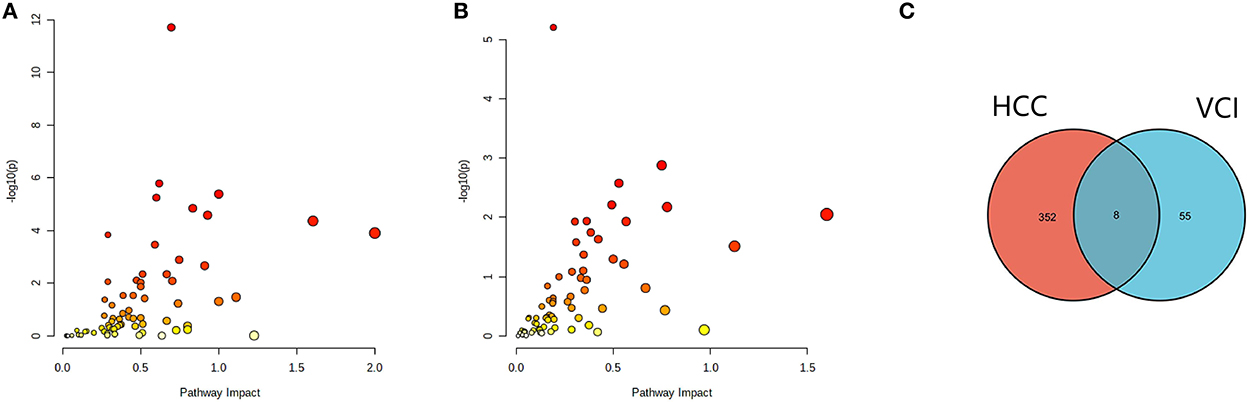
Figure 3. Analysis of multi-omics data; (A) Bubble map of enrichment distribution of HCC metabolism-related genes; (B) Bubble map of enrichment distribution of VCI metabolism-related genes; (C) Venn diagram showing the intersection of HCC and VCI differential genes.
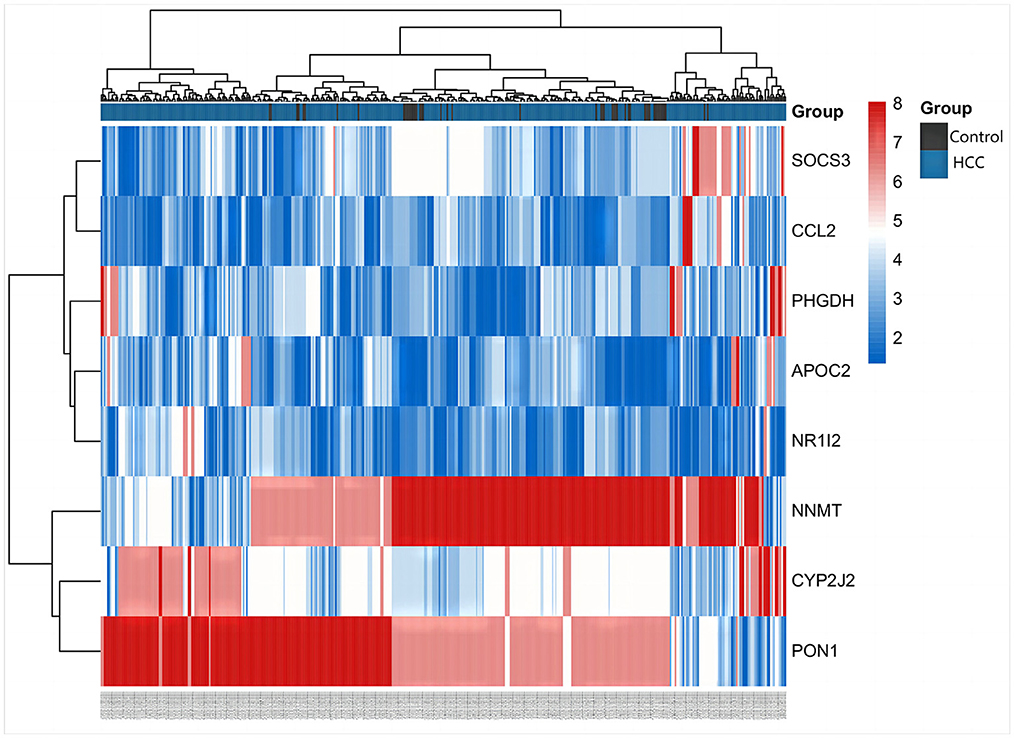
Figure 4. Clustering of metabolism-related genes in HCC.
Prognostic models based on metabolic genes related to HCC and VCI
The 377 clinical cases were randomly divided into a test group and a training group, for clinical and statistical analysis. No significant differences were found between the two groups in terms of age, gender, and tumor stage (P-value > 0.05), and the data from the two groups were comparable, as shown in Supplementary Table 1. Based on a multifactorial regression model, we composed these six genes (NNMT, PHGDH, NR1I2, CYP2J2, PON1, APOC2, CCL2, and SOCS3) into a risk factor model called riskScore. In the COX survival prognostic model, survival time decreased with increasing riskScore in the test group and the training group (P-value < 0.05) (Figures 5A, B). Independent prognostic analyses by univariate and multifactorial regression showed that the tumor stage and riskScore were significantly associated with prognosis in HCC patients (Figures 5C, D). For prognosis prediction of HCC patients at 1, 3, and 5 years, the area under the curve (AUC) of the subject working characteristic (ROC) curve exceeded 0.59 (Figure 5E). Among the ROC curves for all HCC risk factors, the AUC of riskScore for metabolic genes related to HCC and VCI was the largest and >0.6 (Figure 5F), indicating a good sensitivity of the established survival prognostic model. Based on HCC and VCI-related metabolic genes, a nomogram prognostic model was constructed, and the test results showed survival rates of 0.929, 0.86, and 0.81 after 1 year (P-value < 0.05) (Figure 5G).
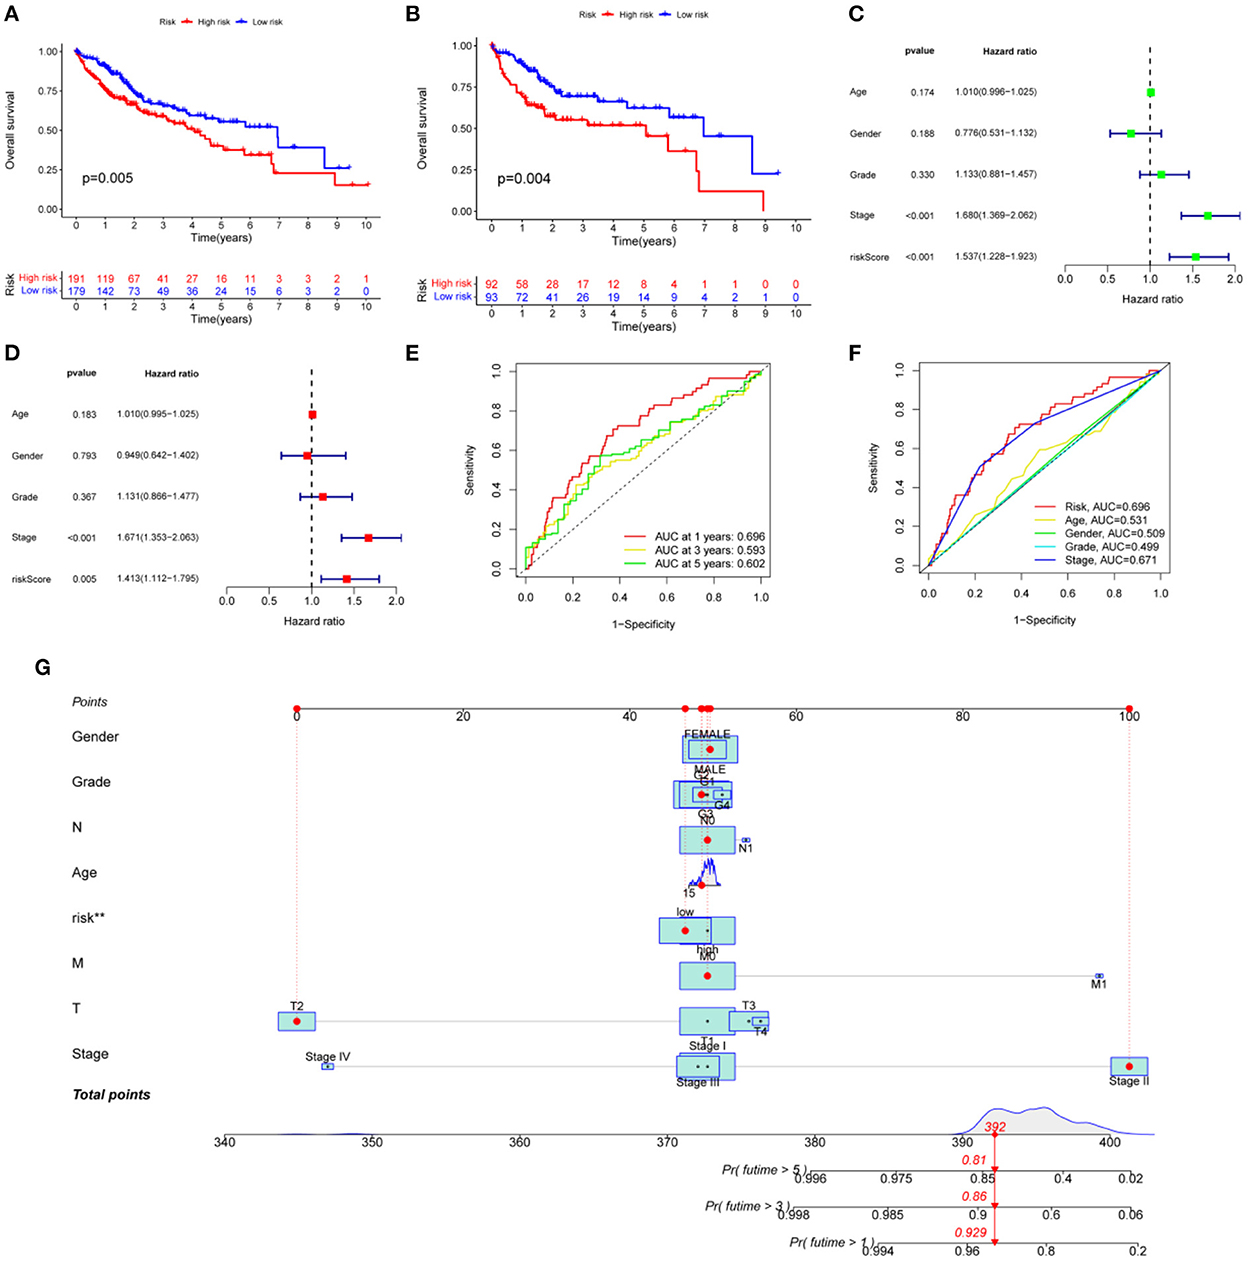
Figure 5. Developing a prognosis model for HCC. (A) Prognostic curves for the overall sample group; (B) The survival prognosis curve for the training group; (C) Analysis of independent prognostic factors based on single-factor regression; (D) Analysis of independent prognostic factors based on multi-factor regression; (E) HCC 5-year survival ROC curves; (F) HCC risk factor ROC curves; (G) Nomograph of metabolomic prognostic models for HCC.
Principal component analysis, GO, and KEGG enrichment analysis of metabolism-related genes of HCC
Principal component analysis of HCC metabolism-related genes and HCC-associated genes was performed using the scatterplot3d package (Figures 6A, B). GO and KEGG pathway enrichment analysis of those eight differentially metabolized DEGs related to HCC and VCI were done using Bioconductor package and clusterprofiler package in R language. The GO analysis of those eight differentially metabolized DEGs showed that their biological processes were mainly enriched in response to a drug or an exogenous drug catabolic process (Figures 7A–F). The cellular components that were mainly enriched included high-density lipoprotein particles and plasma lipoprotein particles. The molecular functions including phospholipase activator activity, lipase activator activity, and phospholipase binding were also enriched. The enriched KEGG pathways included TNF signaling pathway, Influenza A lipid and atherosclerosis pathway, linoleic acid metabolism, nicotinate and nicotinamide metabolism, glycine, serine, and threonine metabolism, and so on (Figures 7G, H). This indicates that the pathways and functions of these DEGs enrichment may be connected to the immune microenvironment and metabolism.
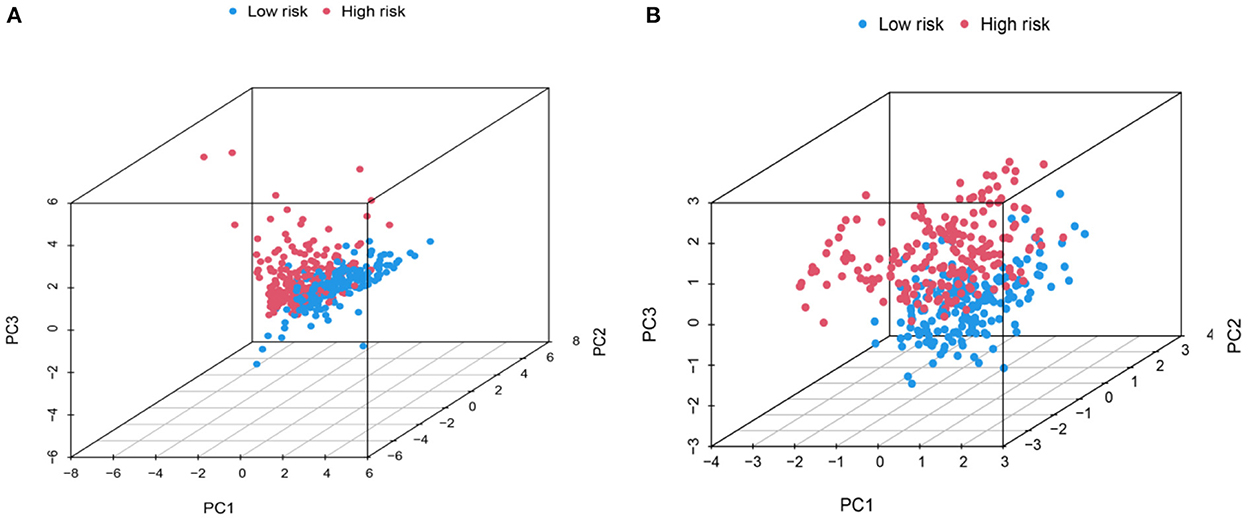
Figure 6. PCA distribution map. (A) Metabolic-related genes PCA distribution map; (B) Genes related to HCC PCA distribution map.
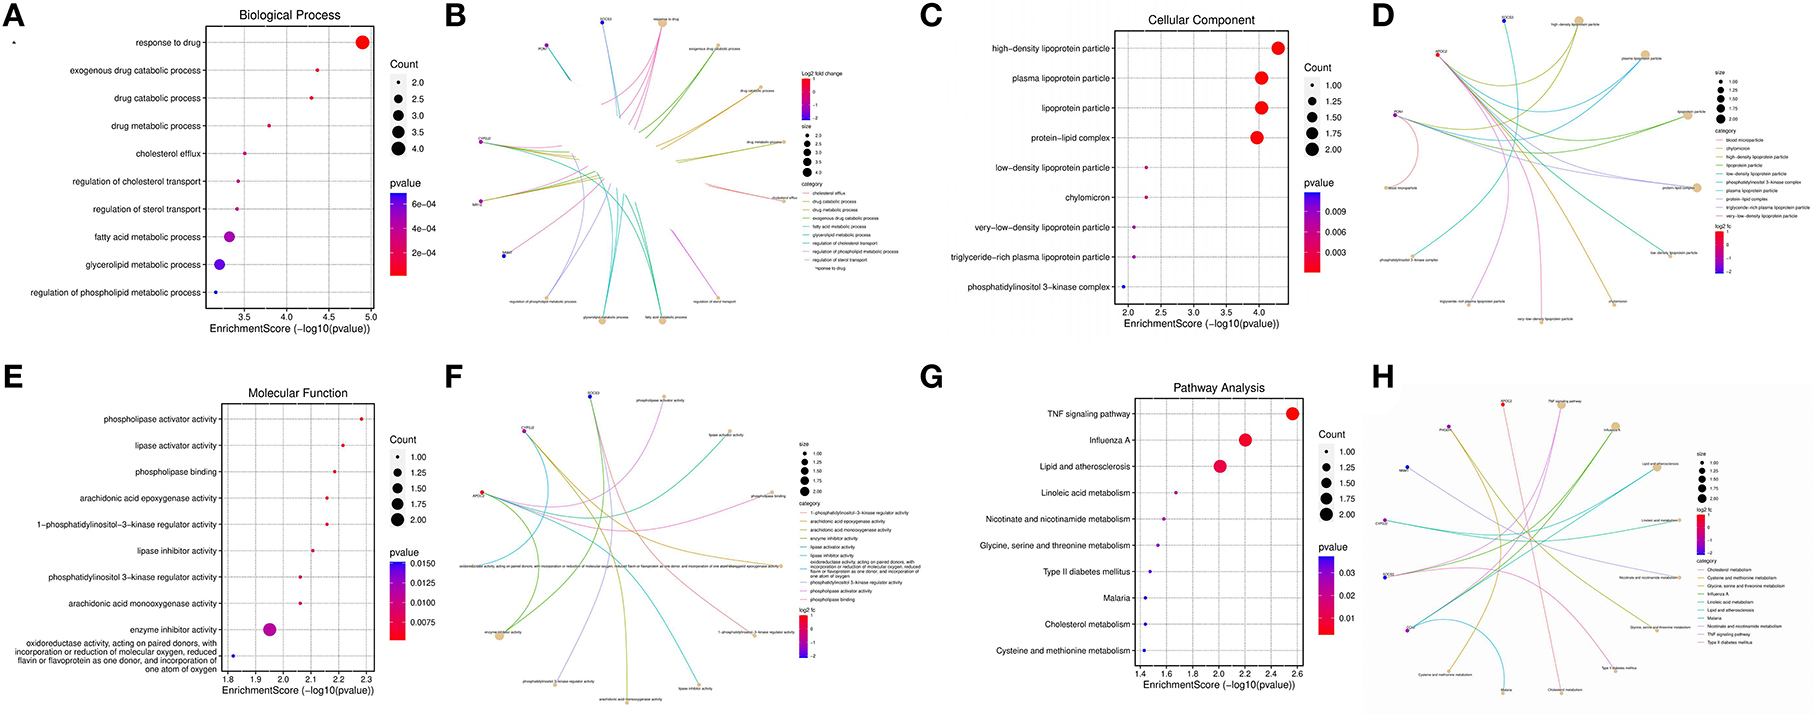
Figure 7. Enrichment analysis; (A) BP enrichment bubble plot; (B) BP enrichment plot; (C) CC enrichment bubble plot; (D) CC enrichment plot; (E) MF enrichment bubble plot; (F) MF enrichment plot; (G) KEGG enrichment bubble plot; (H) KEGG enrichment plot.
Immuno-infiltration and immunofunctional analysis of metabolized DEGs related to HCC and VCI
The obtained HCC expression matrix data were background corrected and normalized and expression values for the microarray data were calculated using the limma R package in R. The immune cell composition of each sample was further analyzed using the CIBERSORT package and histograms were plotted (Figure 8A). The immune cell distribution heat map was plotted using the pheatmap package (Figure 8B). The interaction of immune cell populations in HCC was then analyzed using the corrplot package and co-expression maps of immune cell infiltration in HCC were plotted (Figure 8C). Finally, the expression matrix data were analyzed using the Vioplot package to investigate the expression of each immune cell in HCC tissues as well as paracancerous tissues, and further plotted (Figure 8D).
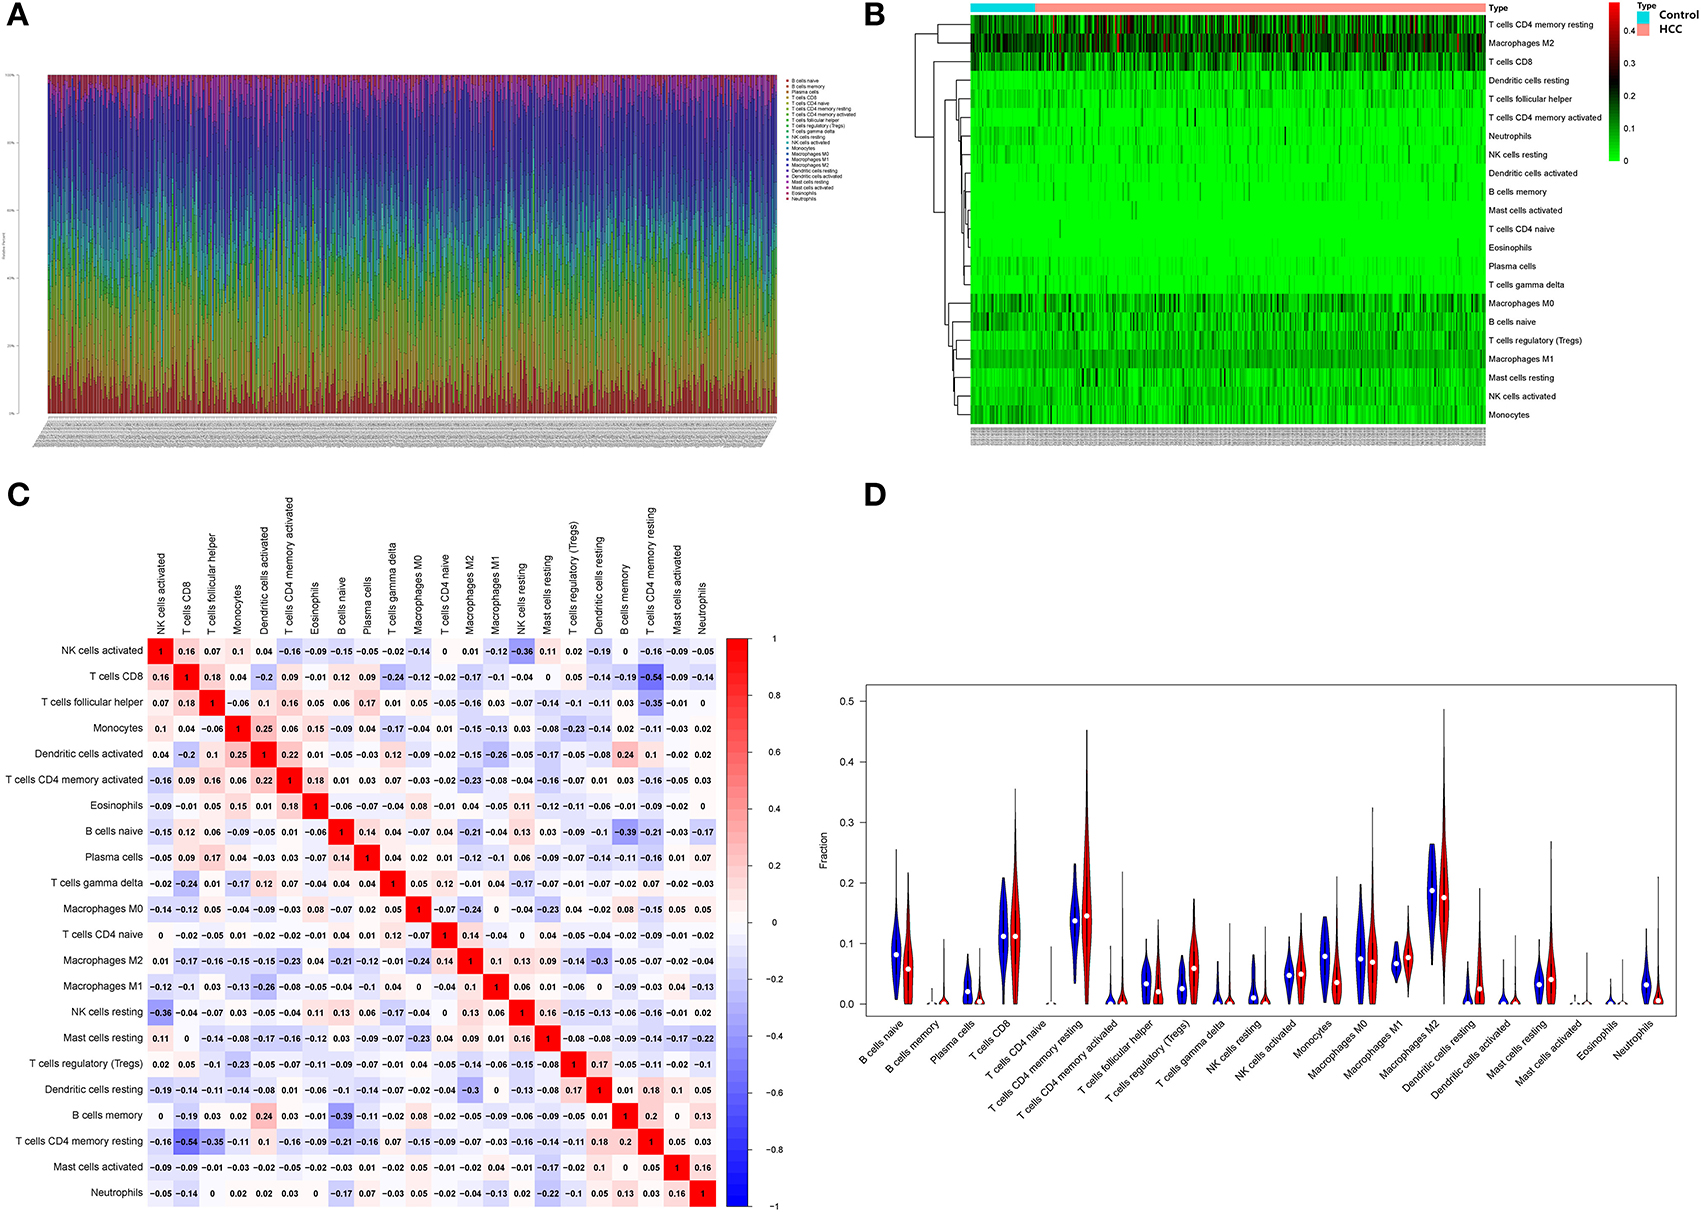
Figure 8. Infiltration analysis of immune cells. (A) Distribution of immune cells in HCC; (B) HCC immune cell distribution heat map; (C) HCC immune cell interaction heat map; (D) Image showing the relative amount of immune cells in HCC.
Immunological functions of HCC metabolism-related genes were analyzed using limma, Gene Set Variation Analysis (GSVA), gseabase, pheatmap, and reshape2 packages. The immune functions were mainly focused on antigen-presenting cells (APC) co-inhibition, APC co-stimulation, cytokine-cytokine receptor interaction (CCR), checkpoint, cytolytic activity, human leukocyte antigens (HLA), inflammation-promoting, MHC_class_I, and parainflammation (Figure 9). This study reveals and visualizes immune infiltration and immune function associated with metabolic DEGs of HCC and VCI.
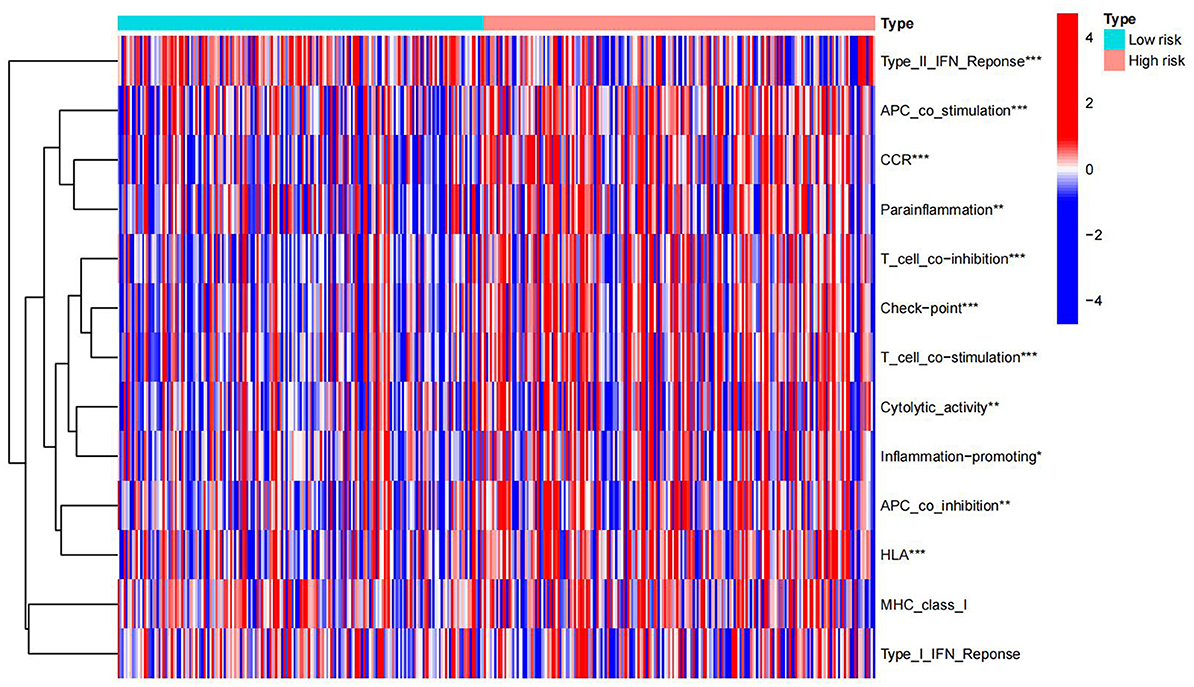
Figure 9. Immune enrichment analysis heat map.
TMB analysis of metabolized DEGs related to HCC and VCI
The HCC expression data and TMB files were imported into R, and the correlation between DEGs related to HCC and tumor mutation load was calculated by using the function, and the waterfall plots of high and low-risk groups were drawn according to the correlation results (Figures 10A, B). The differential analysis results suggested that the tumor mutation load in the low-risk group was significantly higher than that in the high-risk group (Figure 10C). Survival analysis of the tumor mutation load of HCC metabolism-related genes showed that the survival period of the low tumor mutation load group was significantly longer than that of the high tumor mutation load group (P-value < 0.05) (Figure 10D). In addition, combining tumor mutation load characteristics and metabolism-related genetic factors, the low-risk group with low tumor mutation load had the highest probability of survival while the high-risk group with low tumor mutation load had the lowest probability of survival (Figure 10E).
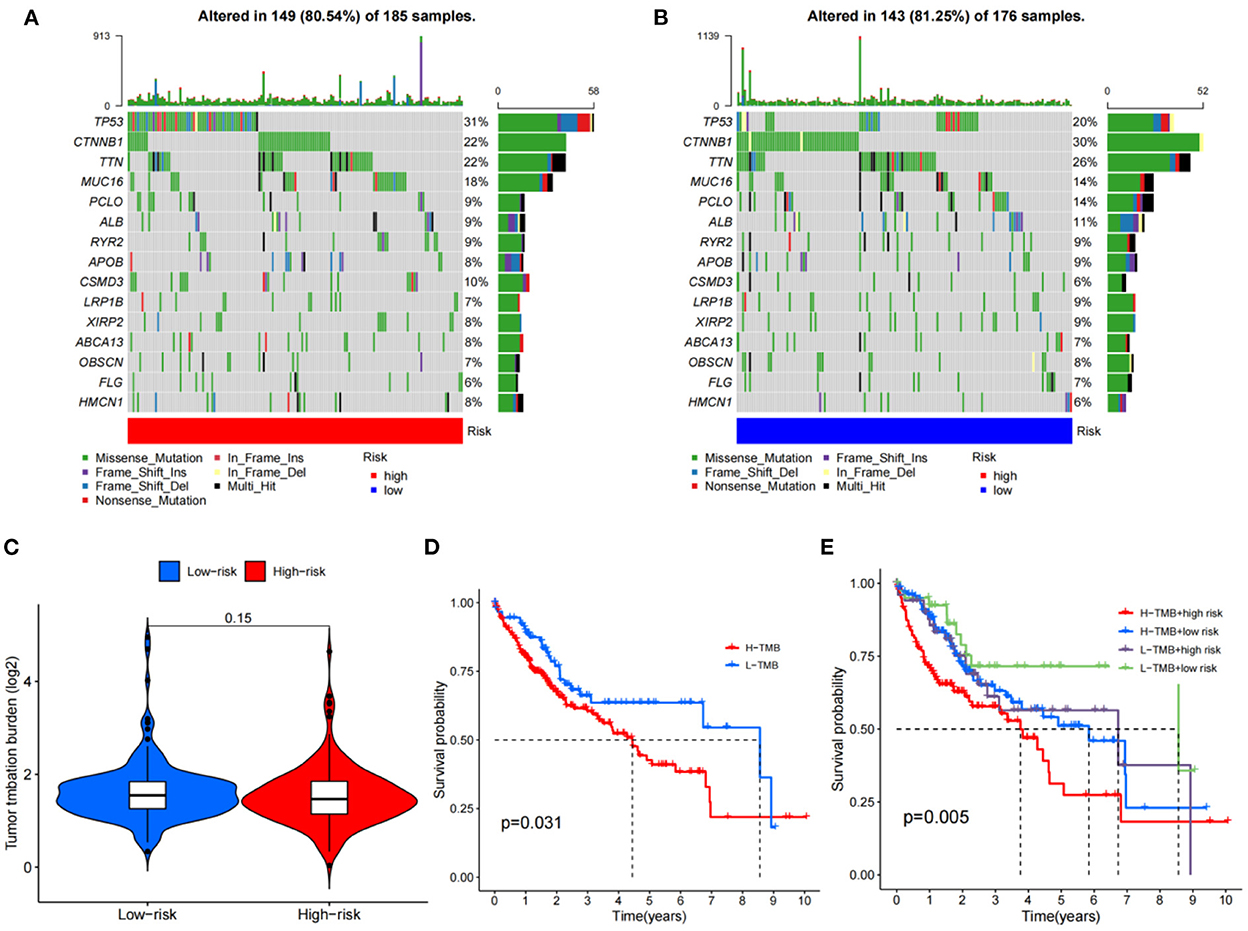
Figure 10. TMB analysis; (A) The waterfall plot for the high risk group; (B) The waterfall plot for the low risk group; (C) The differential analysis of tumor mutation burden; (D) Survival analysis of tumor mutation burden; (E) Survival analysis of TMV+ risk factors.
Relative expression of PHGDH, NR1I2, and APOC2
After obtaining the core genes PHGDH, NR1I2, and APOC2 from the previous differential expression analysis and survival prognosis analysis, we further investigated their relative expression in HCC. The transcriptome data of HCC were downloaded from the TCGA and the ggpubr package was used to analyze the relative expression of the identified core genes and to draw box expression maps (Figures 11A–C). The results revealed that PHGDH and NR1I2 genes exhibited low expression in HCC tumor tissues (P-value < 0.001) while APOC2 genes were highly expressed in HCC tumor tissues (P-value < 0.01).
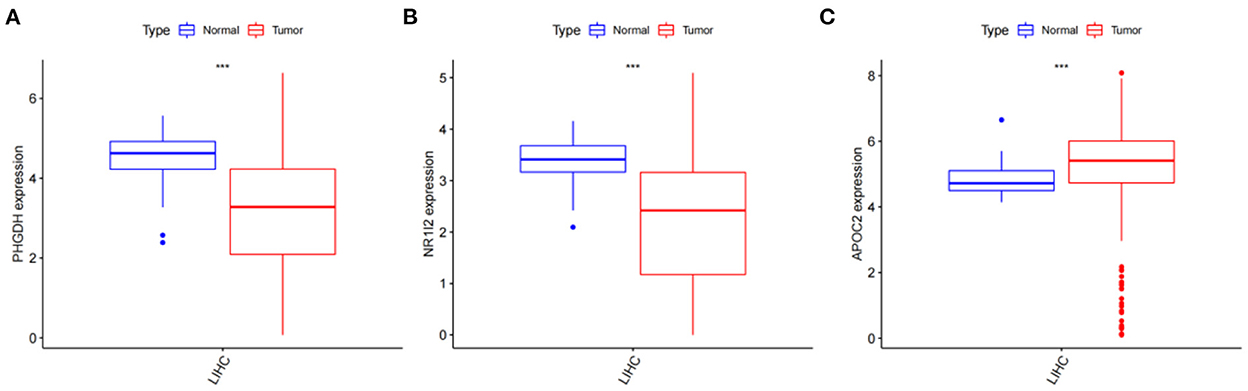
Figure 11. Analysis of the relative expression of target genes; (A) Relative expression of PHGDH (p < 0.001); (B) Relative expression of NR1I2 (p < 0.001); (C) Relative expression of APOC2 (p < 0.001).
Single-gene GSEA enrichment analysis
The GO/KEGG annotation file downloaded from the GSEA website and the HCC tumor data file were read into R. Analytical operations were performed, and it was found that: the GO of gene PHGDH at HCC was enriched in CHROMATIN REMODELING, DNA PACKAGING, and PROTEIN DNA COMPLEX SUBUNIT ORGANIZATION functions (Figure 12A). The GO function of gene NR1I2 was enriched in ACTIVATION OF IMMUNE RESPONSE, ADAPTIVE IMMUNE RESPONSE BASED ON SOMATIC RECOMBINATION OF IMMUNE RECEPTORS BUILT FROM IMMUNOGLOBULIN SUPERFAMILY DOMAINS, and ALPHA BETA T CELL ACTIVATION (Figure 12B). The gene APOC2 was functionally enriched in CHROMATIN ASSEMBLY OR DISASSEMBLY, EPIDERMAL CELL DIFFERENTIATION, and INFLAMMATORY RESPONSE TO ANTIGENIC STIMULUS (Figure 12C); The main PHGDH gene-enriched KEGG pathways are OLFACTORY TRANSDUCTION, CIRCADIAN RHYTHM MAMMAL, GRAFT VS. HOST DISEASE signaling pathways (Figure 12D); The NR1I2 gene enriched KEGG pathways are mainly ANTIGEN PROCESSING AND PRESENTATION, CYTOKINE RECEPTOR INTERACTION, and CYTOSOLIC DNA SENSING signaling pathways (Figure 12E). The main KEGG pathways enriched by the APOC2 gene are OLFACTORY TRANSDUCTION, CYTOSOLIC DNA SENSING PATHWAY, and REGULATION OF AUTOPHAGY signaling pathway (Figure 12F).
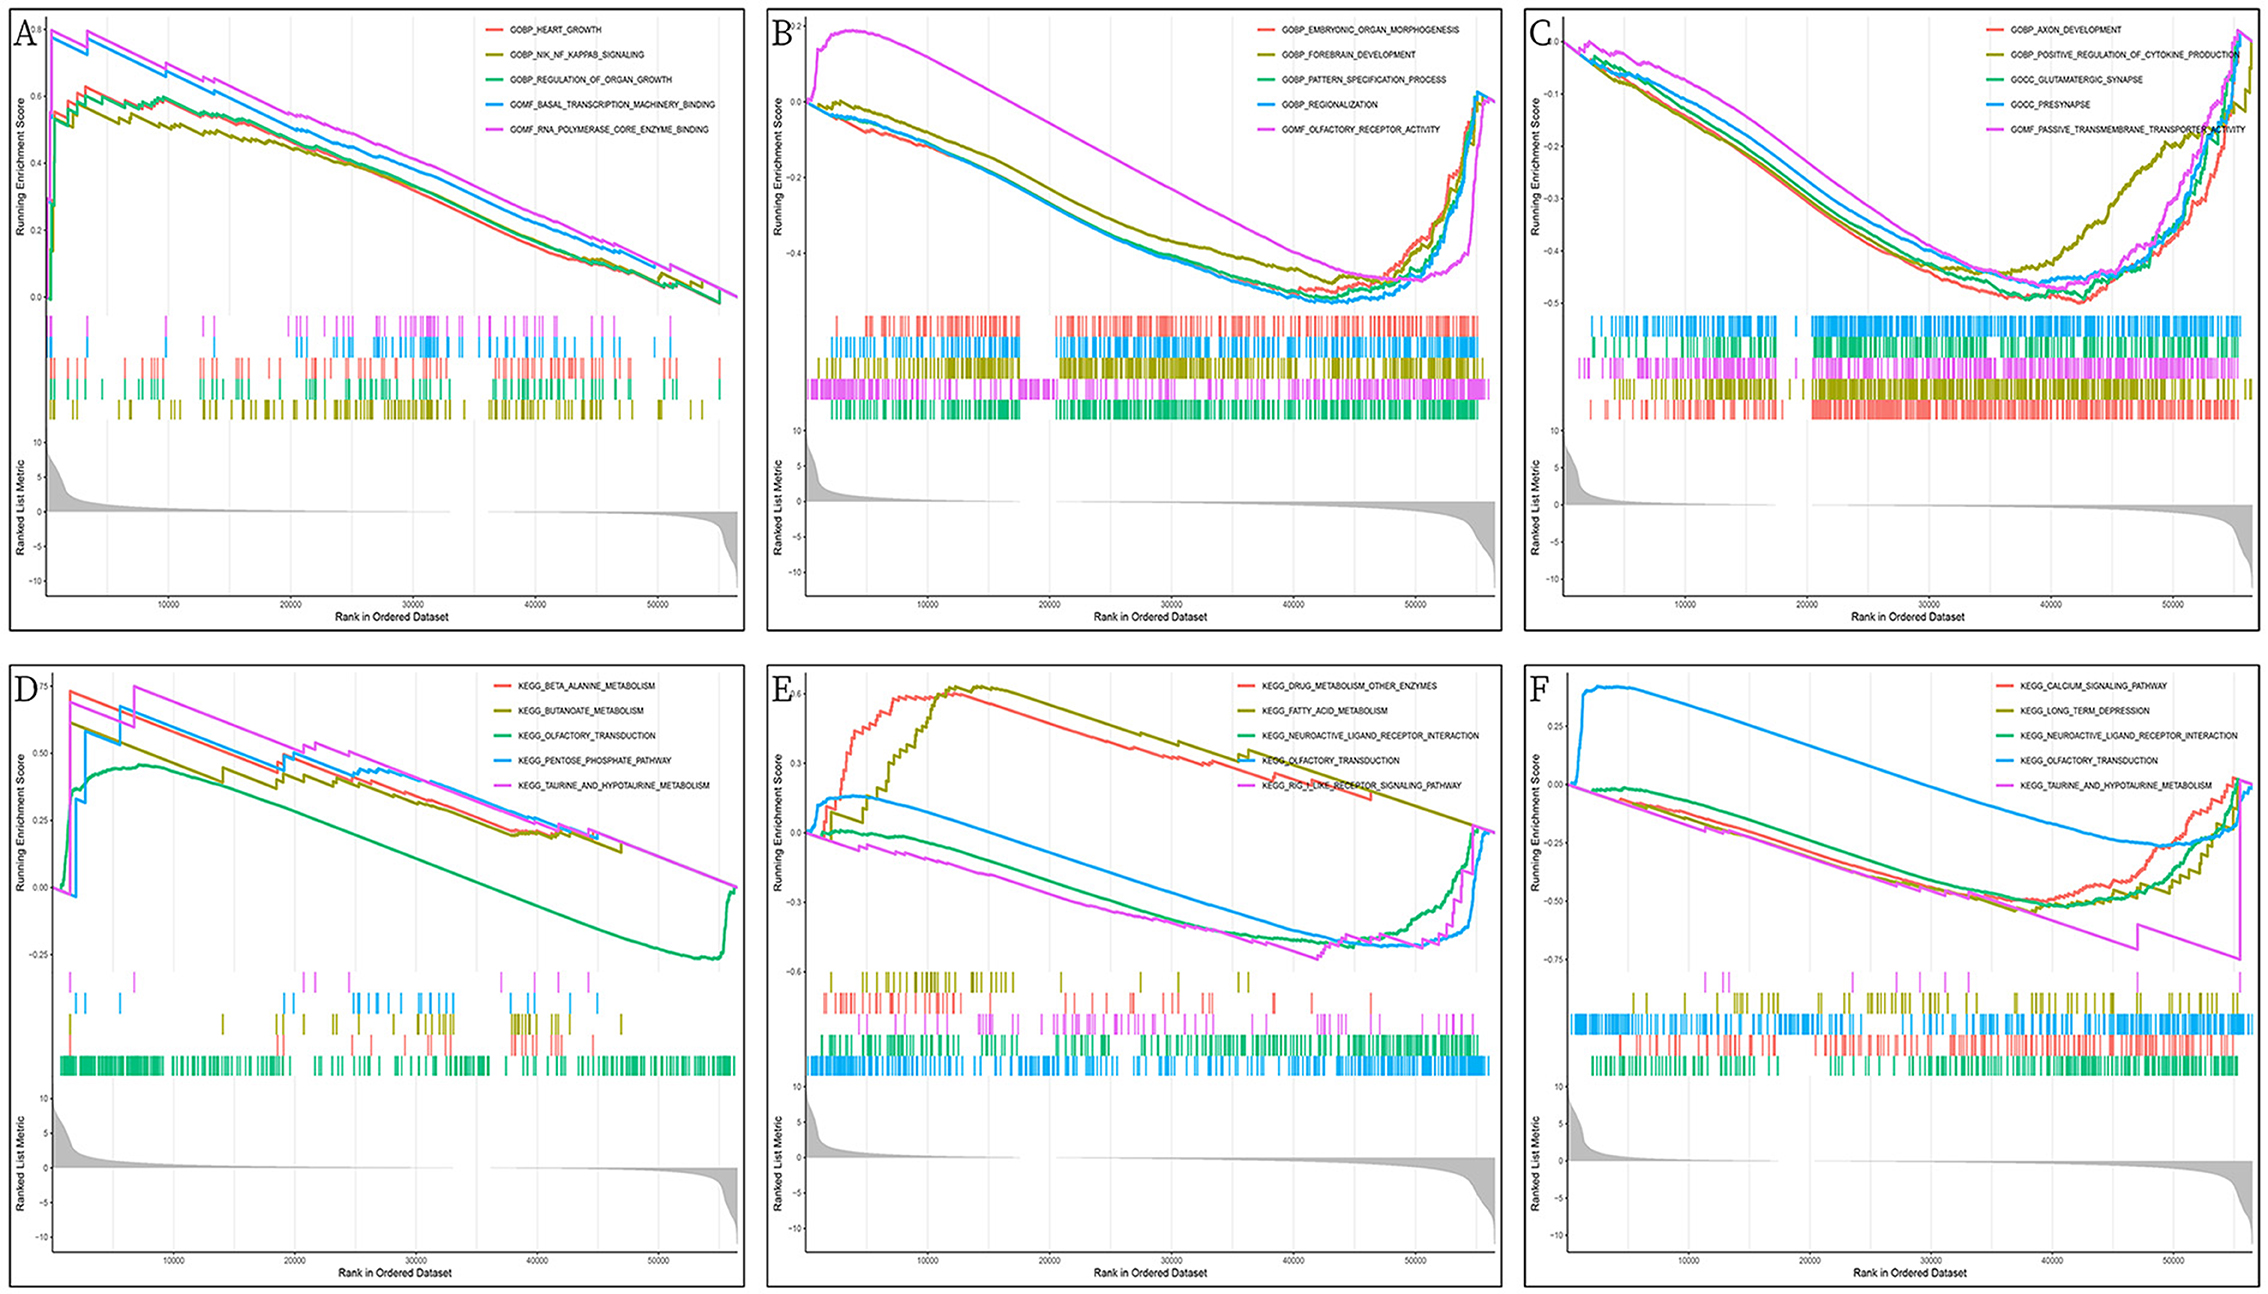
Figure 12. GSEA enrichment analysis of DEGs (PHGDH, NR1I2, and APOC2); (A) GO enrichment analysis of PHGDH in HCC; (B) GO enrichment analysis of NR1I2 in HCC; (C) GO enrichment analysis of APOC2 in HCC; (D) KEGG enrichment analysis of PHGDH in HCC; (E) KEGG enrichment analysis of NR1I2 in HCC; (F) KEGG enrichment analysis of APOC2 in HCC.
Potential drug screening
To evaluate therapeutically effective drugs against DEGs related to HCC and VCI, we used the limma, ggpubr, prrophetic, and ggplot2 packages. Drugs with potential clinical efficacy against HCC metabolism-related genes include A-443654, A-770041, AP-24534, BI-2536, BMS-509744, CGP-60474, CGP-082996, CMK, cyclopamine, dasatinib, doxorubicin, etoposide, gemcitabine, GW843682X, HG-6-64-1, and JW-7-52-1 (Figures 13A–P).
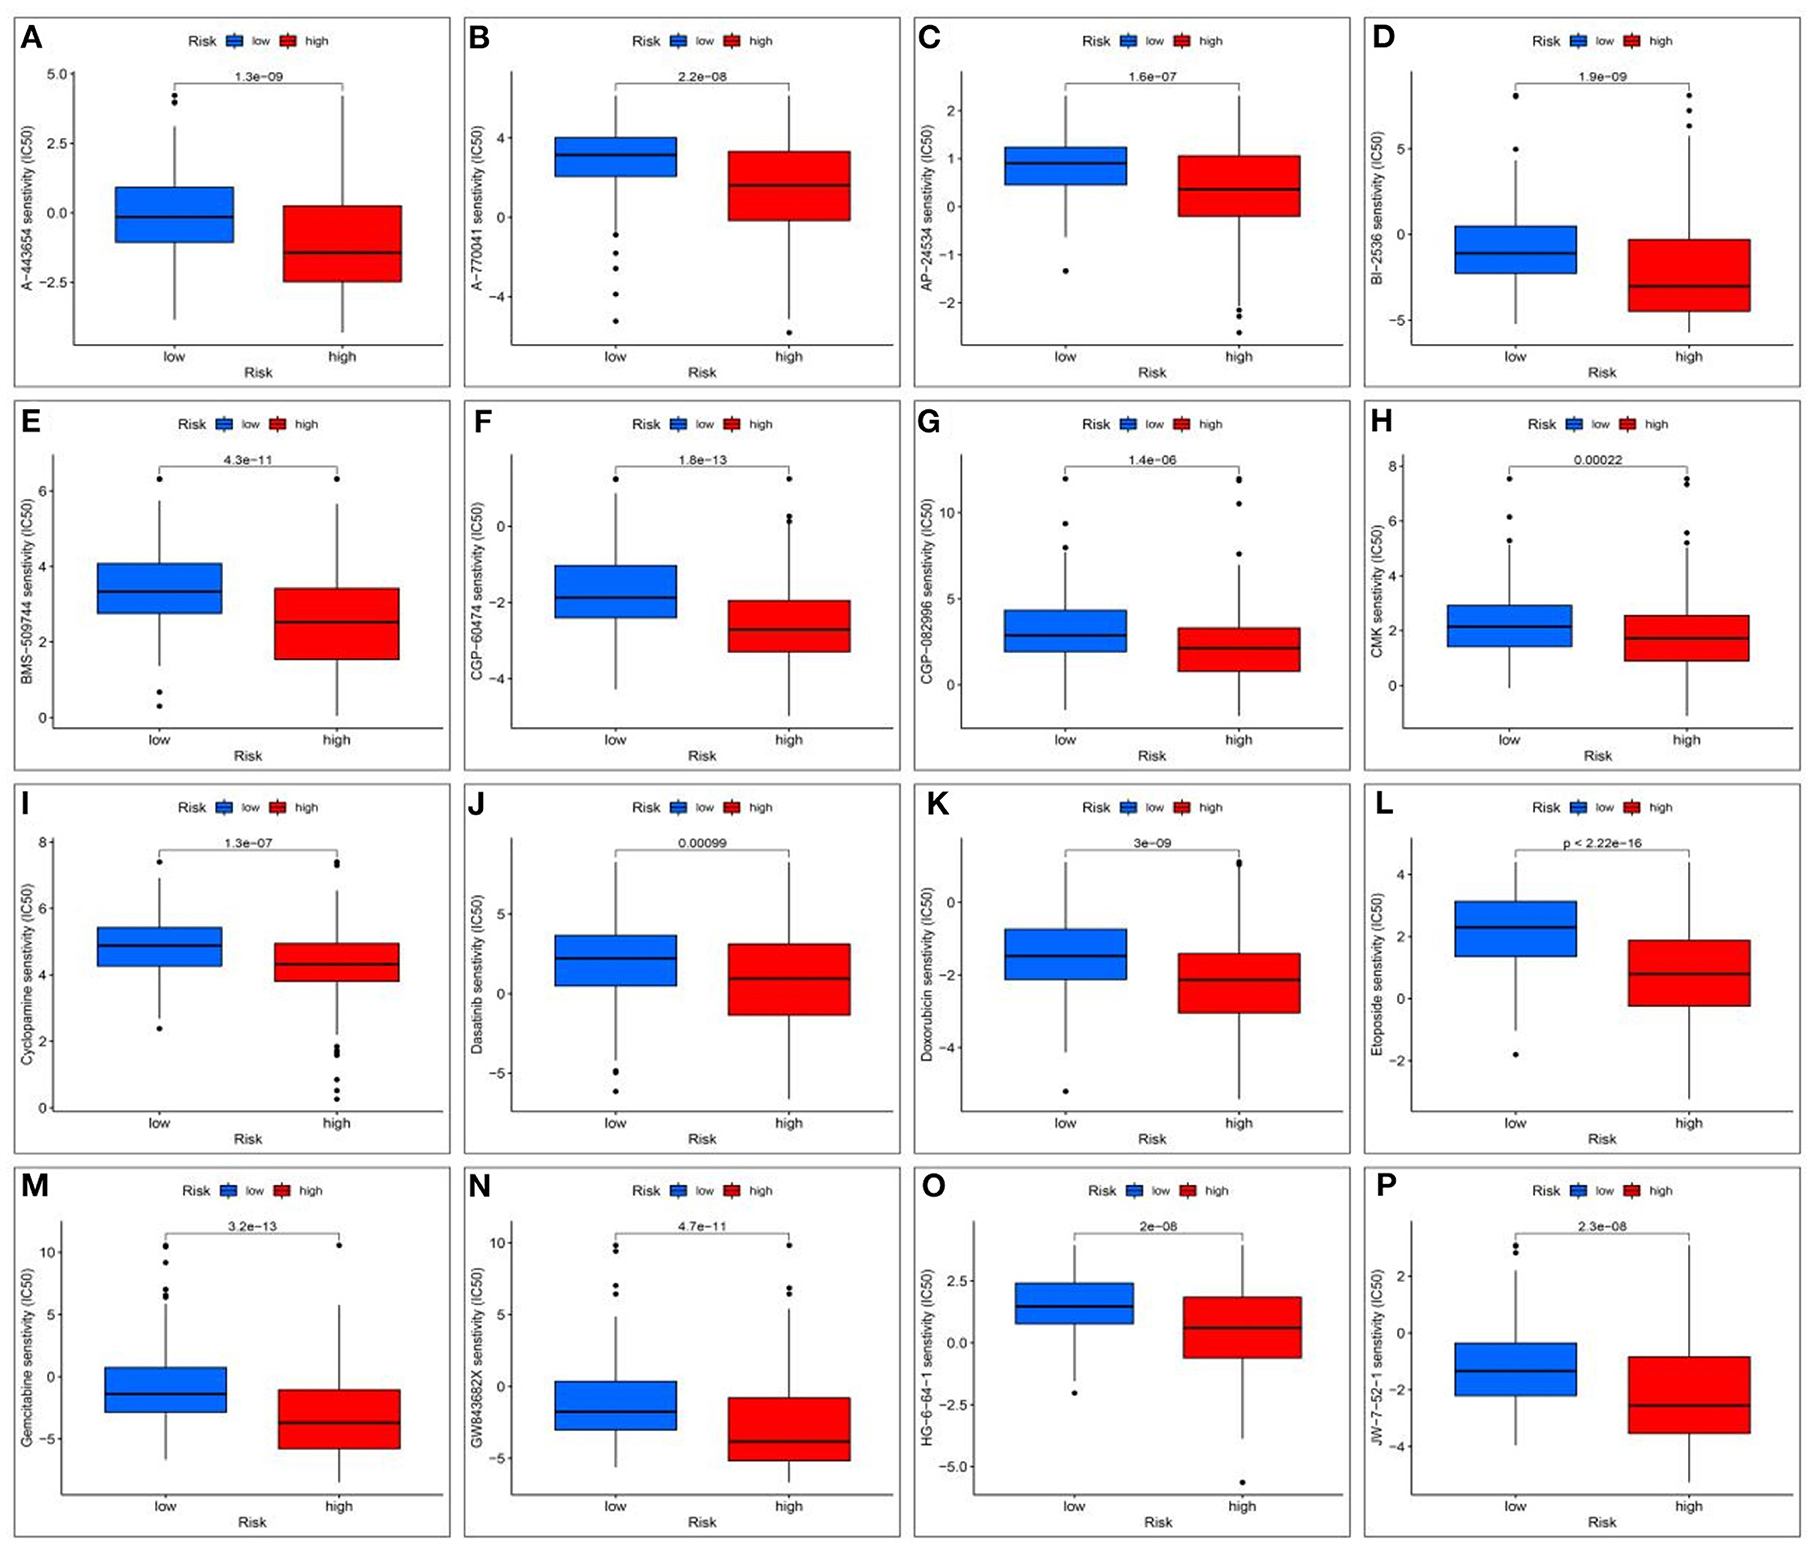
Figure 13. Screening for potential drugs; (A) The therapeutic effect of the drug A-443654; (B) The therapeutic effect of the drug A-770041; (C) The therapeutic effect of the drug AP-24534; (D) The therapeutic effect of the drug BI-2536; (E) The therapeutic effect of the drug BMS-509744; (F) The therapeutic effect of the drug CGP-60474; (G) The therapeutic effect of the drug CGP-082996; (H) The therapeutic effect of the drug RSK2 kinase inhibitor (CMK); (I) Cyclopamine drug's therapeutic effects; (J) The therapeutic effect of the drug Dasatinib; (K) The therapeutic effect of the drug Doxorubicin; (L) The therapeutic effect of the drug Etoposide; (M) The therapeutic effect of the drug Gemcitabine; (N) The therapeutic effect of the drug GW843682X; (O) The therapeutic effect of the drug HG-6-64-1; (P) The therapeutic effect of the drug HG-6-64-1.
Discussions
VCI is an acquired mental impairment syndrome, which is characterized by cognitive impairment, memory difficulties, and neurodegenerative lesions (44). Previous studies have pointed out that HCC may be associated with cognitive disorders of the brain such as hepatic encephalopathy, but the specific mechanisms by which HCC induces VCI are unclear (45). Metabolomic studies have shown that the pathogenesis of VCI may involve various mechanisms such as impaired myelin synthesis caused by glucolipid metabolism disorders and related metabolites leading to blood-brain barrier disruption and vascular endothelial damage (46–48). HCC may affect metabolic disorders promoting the development of VCI. According to the current studies, the possible mechanisms of cognitive impairment due to HCC include impaired blood ammonia and bile acid metabolism, oxidative stress injury and inflammatory response, impaired blood-brain barrier, neurotransmission disorders, neurotoxic accumulation, and disturbance of cerebral energy metabolism (49–51). Therefore, in this study, we propose that HCC may influence the body's metabolism to promote the occurrence of VCI. In this study, we obtained the 8 significant HCC-VCI DEGs by metabolomic analysis, which are NNMT, PHGDH, NR1I2, CYP2J2, PON1, APOC2, CCL2, and SOCS3. Previous literature indicated that the above eight genes are mostly involved in the development of VCI.
NNMT encodes proteases involved in the metabolism of various substances and drugs in vivo and is highly expressed in a variety of tumors, correlating with tumor infiltration, distant metastasis, and malignancy (52, 53). NNMT encodes neuronal proteins whose increased expression is associated with stress responses in the brain microenvironment and can be involved in promoting cognitive impairment (54–56). PHGDH encodes a phosphoglycerate dehydrogenase involved in the synthesis of L-serine, a regulator of synaptic plasticity and an essential product for T-cell expansion (57, 58). PHGDH mutants can result in neurological symptoms such as impaired motor function, and its overexpression can promote proliferation and invasion of cancer cells such as HCC (59–61). Further, PHGDH has been found to contribute to the development of cognitive impairment (62). NR1I2 is a member of the nuclear receptor superfamily and is involved in encoding a transcriptional regulator that regulates cytochrome P450 (CYP) enzymes. Previous studies suggest that NR1I2 may regulate bile acid metabolism involved in promoting the progression of cognitive impairment (63). CYP2J2 is a cyclooxygenase that is involved in regulating the body's inflammatory response, cell proliferation, and other physiological functions, and plays an important role in the homeostasis (64). CYP2J2 variants are involved in promoting cerebrovascular disease and their polymorphisms are associated with susceptibility to cognitive impairment (65, 66). CYP2J2 increases the production of eets and enhances HIF-1 alpha stability and promotes the development of HCC (67). PON1 encodes calcium-dependent high-density lipoprotein-related lipase, which can reduce reactive oxygen species, reduce LDL oxidative stress, enhance HDL antioxidant capacity, and participate in anti-inflammatory and antioxidant activities in neurodegenerative diseases, neuroinflammation, and other neurological diseases (68, 69). Studies have pointed out that reduced PON1 activity may affect lipid metabolism, promote vascular endothelial damage, and contribute to the development of cognitive impairment (69–72). PON1 levels were negatively correlated with HCC vascular invasion, probably due to its anti-inflammatory activity and its role in the maintenance of normal vascular endothelial function (73). APOC2 encodes a lipid-binding protein belonging to the apolipoprotein family, which is involved in the composition of very low-density lipoproteins and in promoting the hydrolysis of triglycerides (74, 75). High serum levels of APOC2 are associated with cognitive impairment, and the exact underlying mechanism of action is unclear (76, 77). CCL2 or MCP-1 is a member of the CC chemokine family, and abnormally expressed CCL2 is closely associated with CNS diseases, neoplastic diseases, and inflammatory diseases. The CCL2/CCR2 axis activates the Hedgehog pathway involved in the induction of HCC invasion and epithelial-mesenchymal transition (78). Further, CCL2 may be involved in promoting the progression of cognitive impairment through enhancing excitotoxicity, oxidative stress-induced inflammatory damage, and apoptosis in neuronal cells, affecting glutamate metabolism and inducing microglia activation in the local microenvironment (79–82). SOCS3 is an important negative feedback regulatory protein in the JAK/STAT signaling pathway, a key physiological regulator in natural and acquired immunity, T-lymphocyte differentiation, and immune regulation, and plays a negative feedback regulatory role in immune/inflammatory diseases (83–85). The SOCS3 signaling pathway is also involved in the development of HCC (86, 87). Thus, the above genes may be associated with the occurrence of HCC-induced VCI.
The developed HCC metabolomics prognostic model based on HCC-VCI DEGs has a good prognostic effect. Principal component analysis, functional enrichment analysis, immune function analysis, and TMB analysis suggested that HCC-VCI DEGs may affect the immune microenvironment and thus result in the occurrence and development of VCI in HCC. Therefore, the immune-related effects of the above genes were probed, and it was observed that several of these genes were associated with immunity. PHGDH can promote liver ceramide synthesis to maintain lipid homeostasis, and participate in the maintenance of mitochondrial REDOX homeostasis and cellular homeostasis in the immune microenvironment (88, 89). NR1I2 is involved in the regulation of T-cell differentiation and plays an important role in the regulation of immune homeostasis (90, 91). APOC2 may play a protective role in the immune microenvironment of atherosclerotic disease by inhibiting foam cell formation, in addition to participating in lipid metabolism (74, 92, 93). CCL2 plays an important role in immune regulation by recruiting chemotactic monocytes/macrophages to the site of inflammation, mediating the inflammatory response to limit pathogen invasion, and participating in the repair of damaged tissues (94, 95).
In summary, our study revealed that the HCC-associated metabolic DEGs such as NNMT and PHGDH may influence the occurrence and progression of VCI in HCC patients by affecting the immune microenvironment. Further by establishing a prognostic model and screening potential targeted drugs, we found that the above genes had a good prognostic effect on HCC. Finally, drugs that may target HCC-VCI DEGs were screened, namely A-443654, A-770041, AP-24534, BI-2536, BMS-509744, CGP-60474, and CGP-082996, and are expected to have good potential clinical efficacy in patients with HCC-induced VCI. Therefore, this study provides theoretical support and potential therapeutic strategies for the pathogenesis and clinical treatment of VCI in HCC patients. However, the current study also has some limitations. On the one hand, a larger sample of data is needed to verify the conclusions while on the other, relevant biological experiments are needed to clarify the specific regulatory mechanisms.
Conclusion
HCC metabolization-related DEGs such as NNMT and PHGDH may lead to the occurrence of VCI in HCC patients by affecting the immune microenvironment. Further by establishing a prognostic model and screening the potential targeted drugs, we found that the above genes had a good prognostic effect on HCC. A-443654, A-770041, AP-24534, BI-2536, BMS-509744, CGP-60474, and CGP-082996 could be potential candidates with good clinical efficacy for treating VCI in HCC patients.
Data availability statement
The original contributions presented in the study are included in the article/Supplementary material, further inquiries can be directed to the corresponding author.
Author contributions
DZ, YZ, LL, XH, and SF contributed to conception and design of the study and organized the database. DZ and SF performed the statistical analysis and wrote sections of the manuscript. DZ wrote the first draft of the manuscript. All authors contributed to manuscript revision, read, and approved the submitted version.
Conflict of interest
LL was employed by Dalian Hunter Information Consulting Co. LTD, Dalian, China.
The remaining authors declare that the research was conducted in the absence of any commercial or financial relationships that could be construed as a potential conflict of interest.
Publisher's note
All claims expressed in this article are solely those of the authors and do not necessarily represent those of their affiliated organizations, or those of the publisher, the editors and the reviewers. Any product that may be evaluated in this article, or claim that may be made by its manufacturer, is not guaranteed or endorsed by the publisher.
Supplementary material
The Supplementary Material for this article can be found online at: https://www.frontiersin.org/articles/10.3389/fneur.2022.1109019/full#supplementary-material
References
1. Sung H, Ferlay J, Siegel RL, Laversanne M, Soerjomataram I, Jemal A, et al. Global cancer statistics 2020: GLOBOCAN estimates of incidence and mortality worldwide for 36 cancers in 185 countries. CAA Cancer J Clin. (2021) 71:209–49. doi: 10.3322/caac.21660
2. Cheng A-L, Kang Y-K, Chen Z, Tsao C-J, Qin S, Kim JS, et al. Efficacy and safety of sorafenib in patients in the Asia-Pacific region with advanced hepatocellular carcinoma: a phase III randomised, double-blind, placebo-controlled trial. Lancet Oncol. (2009) 10:25–34. doi: 10.1016/S1470-2045(08)70285-7
3. Tang B, Zhu J, Zhao Z, Lu C, Liu S, Fang S, et al. Diagnosis and prognosis models for hepatocellular carcinoma patient's management based on tumor mutation burden. J Adv Res. (2021) 33:153–65. doi: 10.1016/j.jare.2021.01.018
4. Osu N, Shiba S, Shibuya K, Okazaki S, Miyasaka Y, Okamoto M, et al. Carbon-ion radiotherapy subsequent to balloon-occluded retrograde transvenous obliteration for hepatocellular carcinoma with hepatic encephalopathy: a multidisciplinary approach. Clin J Gastroenterol. (2021) 14:852–7. doi: 10.1007/s12328-021-01395-6
5. Surjan RCT, Santos ES, dos Silveira SP, Makdissi FF, Machado MAC. Fibrolamellar hepatocellular carcinoma-related hyperammonemic encephalopathy: up to now and next steps. Clin Mol Hepatol. (2020) 26:231–2. doi: 10.3350/cmh.2019.0084
6. van der Flier WM, Skoog I, Schneider JA, Pantoni L, Mok V, Chen CLH, et al. Vascular cognitive impairment. Nat Rev Dis Primers. (2018) 4:18003. doi: 10.1038/nrdp.2018.3
7. Arvanitakis Z, Capuano AW, Leurgans SE, Buchman AS, Bennett DA, Schneider JA. The relationship of cerebral vessel pathology to brain microinfarcts: cerebral vessel pathology and microinfarcts. Brain Pathol. (2017) 27:77–85. doi: 10.1111/bpa.12365
8. Dudvarski Stankovic N, Teodorczyk M, Ploen R, Zipp F, Schmidt MHH. Microglia–blood vessel interactions: a double-edged sword in brain pathologies. Acta Neuropathol. (2016) 131:347–63. doi: 10.1007/s00401-015-1524-y
9. Burrows F, Haley MJ, Scott E, Coutts G, Lawrence CB, Allan SM, et al. Systemic inflammation affects reperfusion following transient cerebral ischaemia. Exp Neurol. (2016) 277:252–60. doi: 10.1016/j.expneurol.2016.01.013
10. Faraco G, Sugiyama Y, Lane D, Garcia-Bonilla L, Chang H, Santisteban MM, et al. Perivascular macrophages mediate the neurovascular and cognitive dysfunction associated with hypertension. J Clin Invest. (2016) 126:4674–89. doi: 10.1172/JCI86950
11. Cai Z, Liu Z, Xiao M, Wang C, Tian F. Chronic cerebral hypoperfusion promotes amyloid-beta pathogenesis via activating β/γ-secretases. Neurochem Res. (2017) 42:3446–55. doi: 10.1007/s11064-017-2391-9
12. Zhang W, Zhang X, Zhang Y, Wu H, Liu Q, Zhou X, et al. Analysis of changes of intestinal flora in elderly patients with Alzheimer's Disease and liver cancer and its correlation with abnormal gastrointestinal motility. J Oncol. (2021) 2021:1–5. doi: 10.1155/2021/7517379
13. Forés-Martos J, Boullosa C, Rodrigo-Domínguez D, Sánchez-Valle J, Suay-García B, Climent J, et al. Transcriptomic and genetic associations between Alzheimer's disease, Parkinson's disease, and cancer. Cancers. (2021) 13:2990. doi: 10.3390/cancers13122990
14. Snyder HM, Corriveau RA, Craft S, Faber JE, Greenberg SM, Knopman D, et al. Vascular contributions to cognitive impairment and dementia including Alzheimer's disease. Alzheimer's Dement. (2015) 11:710–7. doi: 10.1016/j.jalz.2014.10.008
15. Lee SJ, Teunissen CE, Pool R, Shipley MJ, Teumer A, Chouraki V, et al. Circulating metabolites and general cognitive ability and dementia: evidence from 11 cohort studies. Alzheimer's Dement. (2018) 14:707–22. doi: 10.1016/j.jalz.2017.11.012
16. Qureshi MI, Vorkas PA, Coupland AP, Jenkins IH, Holmes E, Davies AH. Lessons from metabonomics on the neurobiology of stroke. Neuroscientist. (2017) 23:374–82. doi: 10.1177/1073858416673327
17. Yang C, Huang X, Liu Z, Qin W, Wang C. Metabolism-associated molecular classification of hepatocellular carcinoma. Mol Oncol. (2020) 14:896–913. doi: 10.1002/1878-0261.12639
18. Mayo R, Crespo J, Martínez-Arranz I, Banales JM, Arias M, Mincholé I, et al. Metabolomic-based noninvasive serum test to diagnose nonalcoholic steatohepatitis: results from discovery and validation cohorts. Hepatol Commun. (2018) 2:807–20. doi: 10.1002/hep4.1188
19. Chen B, Garmire L, Calvisi DF, Chua M-S, Kelley RK, Chen X. Harnessing big ‘omics' data and AI for drug discovery in hepatocellular carcinoma. Nat Rev Gastroenterol Hepatol. (2020) 17:238–51. doi: 10.1038/s41575-019-0240-9
20. Fitian AI, Nelson DR, Liu C, Xu Y, Ararat M, Cabrera R. Integrated metabolomic profiling of hepatocellular carcinoma in hepatitis C cirrhosis through GC/MS and UPLC/MS-MS. Liver Int. (2014) 34:1428–44. doi: 10.1111/liv.12541
21. Zeng J, Yin P, Tan Y, Dong L, Hu C, Huang Q, et al. Metabolomics Study of hepatocellular carcinoma: discovery and validation of serum potential biomarkers by using capillary electrophoresis–mass spectrometry. J Proteome Res. (2014) 13:3420–31. doi: 10.1021/pr500390y
22. Wang B, Chen D, Chen Y, Hu Z, Cao M, Xie Q, et al. Metabonomic profiles discriminate hepatocellular carcinoma from liver cirrhosis by ultraperformance liquid chromatography–mass spectrometry. J Proteome Res. (2012) 11:1217–27. doi: 10.1021/pr2009252
23. Hall Z, Chiarugi D, Charidemou E, Leslie J, Scott E, Pellegrinet L, et al. Lipid remodeling in hepatocyte proliferation and hepatocellular carcinoma. Hepatology. (2021) 73:1028–44. doi: 10.1002/hep.31391
24. Banales JM, Iñarrairaegui M, Arbelaiz A, Milkiewicz P, Muntané J, Muñoz-Bellvis L, et al. Serum metabolites as diagnostic biomarkers for cholangiocarcinoma, hepatocellular carcinoma, and primary sclerosing cholangitis. Hepatology. (2019) 70:547–62. doi: 10.1002/hep.30319
25. Qin Q, Yin Y, Xing Y, Wang X, Wang Y, Wang F, et al. Lipid metabolism in the development and progression of vascular cognitive impairment: a systematic review. Front Neurol. (2021) 12:709134. doi: 10.3389/fneur.2021.709134
26. Holtsträter C, Schrörs B, Bukur T, Löwer M. Bioinformatics for cancer immunotherapy. In:Boegel S, , editor. Bioinformatics for Cancer Immunotherapy. Methods in Molecular Biology. New York, NY: Springer (2020). p. 1–9. doi: 10.1007/978-1-0716-0327-7_1
27. Xuan Z, Ma T, Qin Y, Guo Y. Role of ultrasound imaging in the prediction of TRIM67 in brain metastases from breast cancer. Front Neurol. (2022) 13:889106. doi: 10.3389/fneur.2022.889106
28. Fan Y, Xu H, Lv M, Li N. Preoperative serum calcitonin level and ultrasonographic characteristics predict the risk of metastatic medullary thyroid carcinoma: functional analysis of calcitonin-related genes. Dis Mark. (2022) 2022:1–14. doi: 10.1155/2022/9980185
29. Sun Y, Sun X, Liu S, Liu L, Chen J. The overlap between regeneration and fibrosis in injured skeletal muscle is regulated by phosphatidylinositol 3-kinase/Akt signaling pathway: a bioinformatic analysis based on lncRNA microarray. Gene. (2018) 672:79–87. doi: 10.1016/j.gene.2018.06.001
30. Zhang Q, Yang J, Yang C, Yang X, Chen Y. Eucommia ulmoides Oliver-Tribulus terrestris L. drug pair regulates ferroptosis by mediating the neurovascular-related ligand-receptor interaction pathway: a potential drug pair for treatment hypertension and prevention ischemic stroke. Front Neurol. (2022) 13:98. doi: 10.3389/fneur.2022.833922
31. Luo Z, Qi B, Sun Y, Chen Y, Lin J, Qin H, et al. Engineering bioactive M2 macrophage-polarized, anti-inflammatory, miRNA-based liposomes for functional muscle repair: from exosomal mechanisms to biomaterials. Small. (2022) 18:2201957. doi: 10.1002/smll.202201957
32. Lin W, Wang Q, Chen Y, Wang N, Ni Q, Qi C, et al. Identification of a 6-RBP gene signature for a comprehensive analysis of glioma and ischemic stroke: cognitive impairment and aging-related hypoxic stress. Front Aging Neurosci. (2022) 14:951197. doi: 10.3389/fnagi.2022.951197
33. Pang Z, Chong J, Zhou G, de Lima Morais DA, Chang L, Barrette M, et al. MetaboAnalyst 50: narrowing the gap between raw spectra and functional insights. Nucl Acids Res. (2021) 49:W388–96. doi: 10.1093/nar/gkab382
34. Chong J, Wishart DS, Xia J. Using MetaboAnalyst 40 for comprehensive and integrative metabolomics data analysis. Curr Protocols Bioinform. (2019) 68:86. doi: 10.1002/cpbi.86
35. Chen Y, Luo Z, Sun Y, Li F, Han Z, Qi B, et al. Exercise improves choroid plexus epithelial cells metabolism to prevent glial cell-associated neurodegeneration. Front Pharmacol. (2022) 13:1010785. doi: 10.3389/fphar.2022.1010785
36. Li T, Zhang W, Hu E, Sun Z, Li P, Yu Z, et al. Integrated metabolomics and network pharmacology to reveal the mechanisms of hydroxysafflor yellow A against acute traumatic brain injury. Comput Struct Biotechnol J. (2021) 19:1002–13. doi: 10.1016/j.csbj.2021.01.033
37. van Houwelingen HC, Putter H. Comparison of stopped Cox regression with direct methods such as pseudo-values and binomial regression. Lifetime Data Anal. (2015) 21:180–96. doi: 10.1007/s10985-014-9299-3
38. Sun C, Chen Y, Kim NH, Lowe S, Ma S, Zhou Z, et al. Identification and verification of potential biomarkers in gastric cancer by integrated bioinformatic analysis. Front Genet. (2022) 13:911740. doi: 10.3389/fgene.2022.911740
39. Kang X, Chen Y, Yi B, Yan X, Jiang C, Chen B, et al. An integrative microenvironment approach for laryngeal carcinoma: the role of immune/methylation/autophagy signatures on disease clinical prognosis and single-cell genotypes. J Cancer. (2021) 12:4148–71. doi: 10.7150/jca.58076
40. Chen Y, Sun Y, Luo Z, Lin J, Qi B, Kang X, et al. Potential mechanism underlying exercise upregulated circulating blood exosome miR-215-5p to prevent necroptosis of neuronal cells and a model for early diagnosis of Alzheimer's Disease. Front Aging Neurosci. (2022) 14:860364. doi: 10.3389/fnagi.2022.860364
41. Subramanian A, Tamayo P, Mootha VK, Mukherjee S, Ebert BL, Gillette MA, et al. Gene set enrichment analysis: a knowledge-based approach for interpreting genome-wide expression profiles. Proc Natl Acad Sci USA. (2005) 102:15545–50. doi: 10.1073/pnas.0506580102
42. Huang J, Liang X, Cai Z. A potential ceRNA network for neurological damage in preterm infants. Biomed Res Int. (2021) 2021:2628824. doi: 10.1155/2021/2628824
43. Zhao B, Jiang X. Hsa-miR-518-5p/hsa-miR-3135b regulates the REL/SOD2 pathway in Ischemic cerebral infarction. Front Neurol. (2022) 13:852013. doi: 10.3389/fneur.2022.852013
44. Smith EE. Clinical presentations and epidemiology of vascular dementia. Clin Sci. (2017) 131:1059–68. doi: 10.1042/CS20160607
45. Rose CF, Amodio P, Bajaj JS, Dhiman RK, Montagnese S, Taylor-Robinson SD, et al. Hepatic encephalopathy: novel insights into classification, pathophysiology and therapy. J Hepatol. (2020) 73:1526–47. doi: 10.1016/j.jhep.2020.07.013
46. Teruya T, Chen Y-J, Kondoh H, Fukuji Y, Yanagida M. Whole-blood metabolomics of dementia patients reveal classes of disease-linked metabolites. Proc Natl Acad Sci USA. (2021) 118:e2022857118. doi: 10.1073/pnas.2022857118
47. González-Domínguez R, Javier Rupérez F, García-Barrera T, Barbas C, Luis Gómez-Ariza J. Metabolomic-driven elucidation of serum disturbances associated with Alzheimer's disease and mild cognitive impairment. CAR. (2016) 13:641–53. doi: 10.2174/1567205013666160129095138
48. Le Douce J, Maugard M, Veran J, Matos M, Jégo P, Vigneron P-A, et al. Impairment of glycolysis-derived l-Serine production in astrocytes contributes to cognitive deficits in Alzheimer's disease. Cell Metabol. (2020) 31:503–17.e8. doi: 10.1016/j.cmet.2020.02.004
49. Hadjihambi A, Harrison IF, Costas-Rodríguez M, Vanhaecke F, Arias N, Gallego-Durán R, et al. Impaired brain glymphatic flow in experimental hepatic encephalopathy. J Hepatol. (2019) 70:40–9. doi: 10.1016/j.jhep.2018.08.021
50. Lu K, Zimmermann M, Görg B, Bidmon H-J, Biermann B, Klöcker N, et al. Hepatic encephalopathy is linked to alterations of autophagic flux in astrocytes. EBioMedicine. (2019) 48:539–53. doi: 10.1016/j.ebiom.2019.09.058
51. Nho K, Kueider-Paisley A, MahmoudianDehkordi S, Arnold M, Risacher SL, Louie G, et al. Altered bile acid profile in mild cognitive impairment and Alzheimer's disease: relationship to neuroimaging and CSF biomarkers. Alzheimer's Dement. (2019) 15:232–44. doi: 10.1016/j.jalz.2018.08.012
52. Geng F, Liu J, Guo Y, Li C, Wang H, Wang H, et al. Persistent exposure to porphyromonas gingivalis promotes proliferative and invasion capabilities, and tumorigenic properties of human immortalized oral epithelial cells. Front Cell Infect Microbiol. (2017) 7:57. doi: 10.3389/fcimb.2017.00057
53. Yin H, He Q, Chen J, Li Z, Yang W, Hu X. Drug metabolism-related eight-gene signature can predict the prognosis of gastric adenocarcinoma. J Clin Lab Anal. (2021) 35:85. doi: 10.1002/jcla.24085
54. Liu KY, Mistry RJ, Aguirre CA, Fasouli ES, Thomas MG, Klamt F, et al. Nicotinamide N-methyltransferase increases complex I activity in SH-SY5Y cells via sirtuin 3. Biochem Biophys Res Commun. (2015) 467:491–6. doi: 10.1016/j.bbrc.2015.10.023
55. Parsons RB, Aravindan S, Kadampeswaran A, Evans EA, Sandhu KK, Levy ER, et al. The expression of nicotinamide N-methyltransferase increases ATP synthesis and protects SH-SY5Y neuroblastoma cells against the toxicity of Complex I inhibitors. Biochem J. (2011) 436:145–55. doi: 10.1042/BJ20101685
56. Yan Z, Zhou Z, Wu Q, Chen ZB, Koo EH, Zhong S. Presymptomatic increase of an extracellular RNA in blood plasma associates with the development of Alzheimer's disease. Curr Biol. (2020) 30:1771–82.e3. doi: 10.1016/j.cub.2020.02.084
57. Guercio GD, Panizzutti R. Potential and challenges for the clinical use of d-Serine as a cognitive enhancer. Front Psychiatry. (2018) 9:14. doi: 10.3389/fpsyt.2018.00014
58. Ma EH, Bantug G, Griss T, Condotta S, Johnson RM, Samborska B, et al. Serine is an essential metabolite for effector T cell expansion. Cell Metabol. (2017) 25:345–57. doi: 10.1016/j.cmet.2016.12.011
59. Liu S, Sun Y, Jiang M, Li Y, Tian Y, Xue W, et al. Glyceraldehyde-3-phosphate dehydrogenase promotes liver tumorigenesis by modulating phosphoglycerate dehydrogenase: hepatology, Vol. XX, No. X, 2017 Liu et al. Hepatology. (2017) 66:631–45. doi: 10.1002/hep.29202
60. Rossi M, Altea-Manzano P, Demicco M, Doglioni G, Bornes L, Fukano M, et al. PHGDH heterogeneity potentiates cancer cell dissemination and metastasis. Nature. (2022) 605:747–53. doi: 10.1038/s41586-022-04758-2
61. Tan Y, Zhou X, Gong Y, Gou K, Luo Y, Jia D, et al. Biophysical and biochemical properties of PHGDH revealed by studies on PHGDH inhibitors. Cell Mol Life Sci. (2022) 79:27. doi: 10.1007/s00018-021-04022-2
62. Chen X, Calandrelli R, Girardini J, Yan Z, Tan Z, Xu X, et al. expression increases with progression of Alzheimer's disease pathology and symptoms. Cell Metabol. (2022) 34:651–3. doi: 10.1016/j.cmet.2022.02.008
63. Prendecki M, Kowalska M, Toton E, Kozubski W. Genetic editing and pharmacogenetics in current and future therapy of neurocognitive disorders. CAR. (2020) 17:238–58. doi: 10.2174/1567205017666200422152440
64. Das A, Weigle AT, Arnold WR, Kim JS, Carnevale LN, Huff HC. CYP2J2 molecular recognition: a new axis for therapeutic design. Pharmacol Therapeut. (2020) 215:107601. doi: 10.1016/j.pharmthera.2020.107601
65. Yao M, Lv D, Huo J, Sun Z. Cerebral small vessel disease is associated with genetic variations in CYP2J. CNR. (2018) 14:378–84. doi: 10.2174/1567202614666171017151128
66. Yan H, Kong Y, He B, Huang M, Li J, Zheng J, et al. CYP2J2 rs890293 polymorphism is associated with susceptibility to Alzheimer's disease in the Chinese Han population. Neurosci Lett. (2015) 593:56–60. doi: 10.1016/j.neulet.2015.03.024
67. Gui L, Xu Q, Huang J, Wu G, Tang H, Hui L, et al. CYP2J2 promotes the development of hepatocellular carcinoma by increasing the EETs production to improve HIF-1α stability. Am J Transl Res. (2020) 12:7923–37.
68. Cervellati C, Trentini A, Romani A, Bellini T, Bosi C, Ortolani B, et al. Serum paraoxonase and arylesterase activities of paraoxonase-1 (PON-1), mild cognitive impairment, and 2-year conversion to dementia: a pilot study. J Neurochem. (2015) 135:395–401. doi: 10.1111/jnc.13240
69. Castellazzi M, Trentini A, Romani A, Valacchi G, Bellini T, Bonaccorsi G, et al. Decreased arylesterase activity of paraoxonase-1 (PON-1) might be a common denominator of neuroinflammatory and neurodegenerative diseases. Int J Biochem Cell Biol. (2016) 81:356–63. doi: 10.1016/j.biocel.2016.06.008
70. Cervellati C, Romani A, Bergamini CM, Bosi C, Sanz JM, Passaro A, et al. PON-1 and ferroxidase activities in older patients with mild cognitive impairment, late onset Alzheimer's disease or vascular dementia. Clin Chem Lab Med. (2015) 53:803. doi: 10.1515/cclm-2014-0803
71. Perła-Kaján J, Włoczkowska O, Zioła-Frankowska A, Frankowski M, Smith AD, de Jager CA, et al. Paraoxonase 1, B vitamins supplementation, and mild cognitive impairment. JAD. (2021) 81:1211–29. doi: 10.3233/JAD-210137
72. Bednarz-Misa I, Berdowska I, Zboch M, Misiak B, Zieliński B, Płaczkowska S, et al. Paraoxonase 1 decline and lipid peroxidation rise reflect a degree of brain atrophy and vascular impairment in dementia. Adv Clin Exp Med. (2020) 29:71–8. doi: 10.17219/acem/111377
73. Ding G-Y, Zhu X-D, Ji Y, Shi G-M, Shen Y-H, Zhou J, et al. Serum PON1 as a biomarker for the estimation of microvascular invasion in hepatocellular carcinoma. Ann Transl Med. (2020) 8:204–204. doi: 10.21037/atm.2020.01.44
74. Gao M, Yang C, Wang X, Guo M, Yang L, Gao S, et al. ApoC2 deficiency elicits severe hypertriglyceridemia and spontaneous atherosclerosis: a rodent model rescued from neonatal death. Metabolism. (2020) 109:154296. doi: 10.1016/j.metabol.2020.154296
75. Groenendijk M. The apoAI-CIII-AIV gene cluster. Atherosclerosis. (2001) 157:1–11. doi: 10.1016/S0021-9150(01)00539-1
76. Ma C, Li J, Bao Z, Ruan Q, Yu Z. Serum levels of ApoA1 and ApoA2 are associated with cognitive status in older men. BioMed Res Int. (2015) 2015:1–10. doi: 10.1155/2015/481621
77. Cervantes S, Samaranch L, Vidal-Taboada JM, Lamet I, Bullido MJ, Frank-García A, et al. Genetic variation in APOE cluster region and Alzheimer's disease risk. Neurobiol Aging. (2011) 32:2107.e7. doi: 10.1016/j.neurobiolaging.2011.05.023
78. Zhuang H, Cao G, Kou C, Liu T. CCL2/CCR2 axis induces hepatocellular carcinoma invasion and epithelial-mesenchymal transition in vitro through activation of the Hedgehog pathway. Oncol Rep. (2017) 39:21–30. doi: 10.3892/or.2017.6069
79. Zhou Y, Chen J, Sapkota K, Long J, Liao Y, Jiang J, et al. Pananx notoginseng saponins attenuate CCL2-induced cognitive deficits in rats via anti-inflammation and anti-apoptosis effects that involve suppressing over-activation of NMDA receptors. Biomed Pharmacother. (2020) 127:110139. doi: 10.1016/j.biopha.2020.110139
80. Naziroglu M, Taner AN, Balbay E, Çig B. Inhibitions of anandamide transport and FAAH synthesis decrease apoptosis and oxidative stress through inhibition of TRPV1 channel in an in vitro seizure model. Mol Cell Biochem. (2019) 453:143–55. doi: 10.1007/s11010-018-3439-0
81. Xu J, Dong H, Qian Q, Zhang X, Wang Y, Jin W, et al. Astrocyte-derived CCL2 participates in surgery-induced cognitive dysfunction and neuroinflammation via evoking microglia activation. Behav Brain Res. (2017) 332:145–53. doi: 10.1016/j.bbr.2017.05.066
82. Chen J, Tan L, Liao Y, Long J, Zhou Y, Wei J, et al. Chemokine CCL2 impairs spatial memory and cognition in rats via influencing inflammation, glutamate metabolism and apoptosis-associated genes expression- a potential mechanism for HIV-associated neurocognitive disorder. Life Sci. (2020) 255:117828. doi: 10.1016/j.lfs.2020.117828
83. Qin H, Holdbrooks AT, Liu Y, Reynolds SL, Yanagisawa LL, Benveniste EN. SOCS3 deficiency promotes M1 macrophage polarization and inflammation. JI. (2012) 189:3439–48. doi: 10.4049/jimmunol.1201168
84. Zhang X, He B, Li H, Wang Y, Zhou Y, Wang W, et al. SOCS3 Attenuates GM-CSF/IFN-γ-mediated inflammation during spontaneous spinal cord regeneration. Neurosci Bull. (2020) 36:778–92. doi: 10.1007/s12264-020-00493-8
85. Gao Y, Liu R, He C, Basile J, Vesterlund M, Wahren-Herlenius M, et al. SOCS3 expression by thymic stromal cells is required for normal T cell development. Front Immunol. (2021) 12:642173. doi: 10.3389/fimmu.2021.642173
86. Lin J. C1QTNF1-AS1 regulates the occurrence and development of hepatocellular carcinoma by regulating miR-221-3p/SOCS3. Hepatol Int. (2021) 15:526–526. doi: 10.1007/s12072-021-10152-3
87. Liu Z-K, Li C, Zhang R-Y, Wei D, Shang Y-K, Yong Y-L, et al. EYA2 suppresses the progression of hepatocellular carcinoma via SOCS3-mediated blockade of JAK/STAT signaling. Mol Cancer. (2021) 20:79. doi: 10.1186/s12943-021-01377-9
88. Kang YP, Falzone A, Liu M, González-Sánchez P, Choi B-H, Coloff JL, et al. supports liver ceramide synthesis and sustains lipid homeostasis. Cancer Metab. (2020) 8:6. doi: 10.1186/s40170-020-00212-x
89. Samanta D, Park Y, Andrabi SA, Shelton LM, Gilkes DM. Semenza GL. PHGDH expression is required for mitochondrial redox homeostasis, breast cancer stem cell maintenance, and lung metastasis. Cancer Res. (2016) 76:4430–42. doi: 10.1158/0008-5472.CAN-16-0530
90. Elentner A, Schmuth M, Yannoutsos N, Eichmann TO, Gruber R, Radner FPW, et al. Epidermal overexpression of xenobiotic receptor PXR impairs the epidermal barrier and triggers Th2 immune response. J Invest Dermatol. (2018) 138:109–20. doi: 10.1016/j.jid.2017.07.846
91. Dubrac S, Elentner A, Ebner S, Horejs-Hoeck J, Schmuth M. Modulation of T lymphocyte function by the pregnane X receptor. JI. (2010) 184:2949–57. doi: 10.4049/jimmunol.0902151
92. Rensen PC, Voshol PJ, Havekes LM. The role and mode of action of apolipoproteins CIII and AV: synergistic actors in triglyceride metabolism? Curr Opin Lipidol. (2004) 15:239–46. doi: 10.1097/00041433-200406000-00002
93. Li L, Xu W, Fu X, Huang Y, Wen Y, Xu Q, et al. Blood miR-1275 is associated with risk of ischemic stroke and inhibits macrophage foam cell formation by targeting ApoC2 gene. Gene. (2020) 731:144364. doi: 10.1016/j.gene.2020.144364
94. Lv L-L, Feng Y, Wen Y, Wu W-J, Ni H-F, Li Z-L, et al. Exosomal CCL2 from tubular epithelial cells is critical for albumin-induced tubulointerstitial inflammation. JASN. (2018) 29:919–35. doi: 10.1681/ASN.2017050523
Keywords: metabolomics, metabolic DEGs, prognostic model, biomarkers, neurovascular disease, hepatocellular carcinoma (HCC), vascular cognitive impairment (VCI)
Citation: Zhu D, Zhu Y, Liu L, He X and Fu S (2023) Metabolomic analysis of vascular cognitive impairment due to hepatocellular carcinoma. Front. Neurol. 13:1109019. doi: 10.3389/fneur.2022.1109019
Received: 27 November 2022; Accepted: 26 December 2022;
Published: 16 March 2023.
Edited by:
Yuzhen Xu, Tongji University, ChinaReviewed by:
Tengyang Wang, Fujian Branch of Shanghai Children's Medical Center Affiliated to Shanghai Jiaotong University School of Medicine, ChinaLuqian Li, Maoming People's Hospital, China
Ning Zhang, General Hospital of Ningxia Medical University, China
Copyright © 2023 Zhu, Zhu, Liu, He and Fu. This is an open-access article distributed under the terms of the Creative Commons Attribution License (CC BY). The use, distribution or reproduction in other forums is permitted, provided the original author(s) and the copyright owner(s) are credited and that the original publication in this journal is cited, in accordance with accepted academic practice. No use, distribution or reproduction is permitted which does not comply with these terms.
*Correspondence: Shizhong Fu, c2hpb3VtbzlAMTYzLmNvbQ==; NDUyNzcwOTc0QHFxLmNvbQ==