 Bence Bozsik1
 Eszter Tóth1
 Ilona Polyák2Fanni Kerekes2
 Nikoletta Szabó1
 Krisztina Bencsik1
 Péter Klivényi1
 Zsigmond Tamás Kincses1,2*
- 1Department of Neurology, University of Szeged, Szeged, Hungary
- 2Department of Radiology, University of Szeged, Szeged, Hungary
Purpose: Lesion number and burden can predict the long-term outcome of multiple sclerosis, while the localization of the lesions is also a good predictive marker of disease progression. These biomarkers are used in studies and in clinical practice, but the reproducibility of lesion count is not well-known.
Methods: In total, five raters evaluated T2 hyperintense lesions in 140 patients with multiple sclerosis in six localizations: periventricular, juxtacortical, deep white matter, infratentorial, spinal cord, and optic nerve. Black holes on T1-weighted images and brain atrophy were subjectively measured on a binary scale. Reproducibility was measured using the intraclass correlation coefficient (ICC). ICCs were also calculated for the four most accurate raters to see how one outlier can influence the results.
Results: Overall, moderate reproducibility (ICC 0.5–0.75) was shown, which did not improve considerably when the most divergent rater was excluded. The areas that produced the worst results were the optic nerve region (ICC: 0.118) and atrophy judgment (ICC: 0.364). Comparing high- and low-lesion burdens in each region revealed that the ICC is higher when the lesion count is in the mid-range. In the periventricular and deep white matter area, where lesions are common, higher ICC was found in patients who had a lower lesion count. On the other hand, juxtacortical lesions and black holes that are less common showed higher ICC when the subjects had more lesions. This difference was significant in the juxtacortical region when the most accurate raters compared patients with low (ICC: 0.406 CI: 0.273–0.546) and high (0.702 CI: 0.603–0.785) lesion loads.
Conclusion: Lesion classification showed high variability by location and overall moderate reproducibility. The excellent range was not achieved, owing to the fact that some areas showed poor performance. Hence, putting effort toward the development of artificial intelligence for the evaluation of lesion burden should be considered.
Introduction
Multiple sclerosis (MS) is a chronic demyelinating autoimmune disease of the central nervous system. MRI has an important role in the diagnosis and follow-up of the disease. It is a sensitive tool in identifying the prominent features of the disease, lesions in the white matter, gray matter, and the spinal cord. Therefore, MRI has become the cornerstone of the diagnosis (1, 2).
The number of white matter lesions and the lesion volume have been associated with the long-term outcome of the disease (3–5). It seems that certain lesion locations have special predictive value for disease progression. The number of cortical lesions was shown to have predictive value for the clinical outcome (6, 7). Infratentorial and spinal lesions have an outstanding role in the development of clinically significant disabilities (8, 9).
Consequently, it is not only important to estimate the number of lesions to establish the dissemination of the disease. Lesion burden and location serve as predictive factors for long-term outcomes. A high lesion load might help to characterize patients with highly active multiple sclerosis (10), a patient population that may require a different therapeutic approach.
Various bodies of literature on imaging provide sufficient information about structured reporting in multiple sclerosis, which is also recommended by the recent guideline of the MAGNIMS society. Typical features of the disease were depicted in various templates (11, 12) considered to provide adequate information for neurologists. These templates are common in estimating the number of T2 hyperintense lesions in different brain regions.
The reproducibility of the lesion counts was scarcely investigated (13–15). Most of these studies were conducted in the early times of MS imaging on low magnetic field strength. They concentrated on diagnostic performance, rather than the number of lesions in various regions.
While it is known that the manual lesion segmentation is cumbersome and it is expected that there are issues with reproducibility, these were not systematically evaluated with the current state-of-the-art images. This issue is crucially important since deep learning-based automatic lesion segmentation approaches often rely on manually segmented teaching data.
In our study, we aimed to (1) determine the lesion detection disparity of five raters in the clinically relevant lesion localizations; (2) the impact of expertise in MS radiology on the identification of lesions; (3) the effect of lesion-load on the raters' performance.
Methods
Participants
We gathered 140 random clinical MRI scans from our MS database who suffered from the relapsing remitting form of the disease. Diagnosis of MS was performed according to the 2010 McDonald criteria (16). A detailed clinical report was available about each patient at every 3 months. The inclusion criteria was as follows: relapsing-remitting disease course with no relapse 6 months before or after the MR scan. The clinical features of the patients are depicted in Table 1.
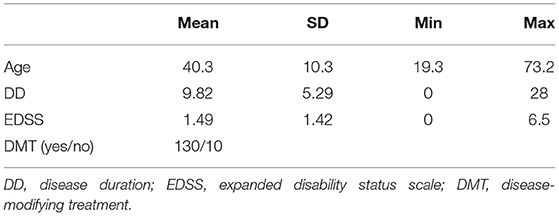
Table 1. Clinical data of the patients.
Image Acquisition
All the MRI data were acquired on a 3T GE Discovery 750w scanner. We outlined the imaging protocol in our recent publication (17, 18). Structural images were acquired using 3D axial fast spoiled gradient echo (FSPGR) T1-weighted images (TR = 450 ms, TE = 4.2 ms, FOV = 256 mm, slice thickness 1 mm, flip angle 12), 2D spin-echo (SE) T1-weighted images (TR = 500 ms, TE = 4.2 s, FOV = 240 mm, slice thickness 1.4 mm, flip angle 73), 3D sagittal fluid-attenuated inversion recovery (FLAIR) (TR = 6.7 ms, TI = 1.8 ms, FOV = 250 ms, slice thickness 1.4 mm), and 3D double inversion recovery images (DIR) (TR = 7,000 ms, TE = 90 ms, TI = 546 ms, TI2 = 2,900 ms, FOV = 250 mm, slice thickness 1.4 mm), 2D axial T2 and proton density (PD) weighted dual echo fast spin echo sequences (TR = 3,000 ms, TE = Min Full, TE2 = 102 ms, FOV = 240 mm, flip angle 125, slice thickness 3.0 mm), and 2D coronal short tau inversion recovery (STIR) images on the optic nerve and the chiasm (TR = 3,000 ms, TE = 42 ms, TI = 185 ms, FOV = 240 mm, flip angle 111).
The ethics committee of the Medical University of Szeged approved the study and all study participants gave their written informed consent in accordance with the Declaration of Helsinki (Ref. No. 56/2011).
Raters
Five raters who were qualified in the field of MS but are working in different specialties and on various levels: radiologist (IP: 14 years of experience in the field of MS), radiology resident (FK: 3 years of experience in the field of MS), neurologist (TK: 12 years of experience in the field of MS), neurology resident (ET: 4 years of experience in the field of MS), and a Ph.D. fellow (BB: working with MS for 2 years) were selected to evaluate the scans by lesion count and localization.
Lesion Classification
The five raters evaluated MR images independently on identical workstations using the same report template. Images were evaluated on the Biotronics 3DNet PACS and visualization tool (Biotronics3D, London, UK).
The definition of a white matter lesion was ovoid T1/FLAIR hypo/hyperintensity larger than 3 mm. The following lesions were counted separately:
• Periventricular: ovoid T2 hyperintense lesions touching the lateral ventricles.
• Infratentorial: T2 hyperintense lesions in the brain stem and the cerebellum, an area extending from the tentorium to the level of the foramen magnum.
• Cortical/juxtacortical: supratentorial T2 hyperintense lesions in the cortex or touching the cortex.
• Optic nerve: T2 hyperintense lesions in the optic nerve between the bulbous and the optic chiasm.
• Spinal: T2 hyperintense lesions in the spinal cord between the level of the foramen magnum and the CIII-CIV intervertebral disc.
Periventricular lesions were evaluated on the sagittal FLAIR images. FLAIR and DIR images were used to identify the cortical and juxtacortical lesions. Coronal STIR images were used to evaluate the optic nerves. Infratentorial lesions were evaluated on the sagittal FLAIR images aided by the axial PD/T2 images. The FOV of the sagittal FLAIR and DIR images were selected in a way that made it possible to evaluate the first three cervical segments of the spinal cord. The total lesion count was calculated by adding the number of lesions in each location, excluding the optic nerve. The purpose of this variable was to see how the raters perform when they did not have to classify lesions by brain regions.
Atrophy was evaluated on axial 3D FSPGR images and measured by the rater's subjective opinion on a binary scale (significant or non-significant). Cases with a higher lesion number were allowed to have an error as seen in Table 2.
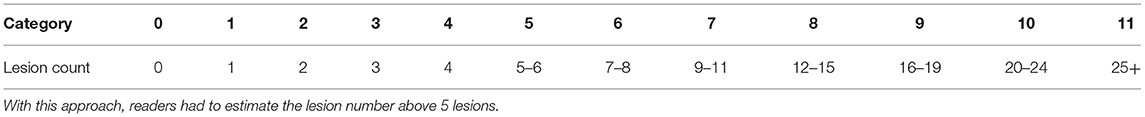
Table 2. Since counting the lesions is increasingly more difficult with a higher lesion count, we created arbitrary categories accounting for this inaccuracy.
Statistics
For the statistical analysis, we used IBM SPSS software, a two-way mixed intraclass correlation (ICC) was calculated with an absolute agreement for single measures. The ICCs were primarily determined for all five raters and then retested, excluding the most divergent rater to see how much the results would improve.
To investigate the reproducibility of lesion detection in patients with low- and high-lesion counts, we divided the patients into two groups based on the median lesion count. We also repeated this analysis using only the four most accurate raters.
The results are interpreted by 95% CI. Categorization of the reproducibility was based on the following criteria (ICC): poor 0–0.5; moderate 0.5–0.75; good 0.75–0.9, and excellent 0.9–1 (19). Graphs were made by GraphPad Prism 8.0 software.
Results
Lesions by Regions
Averaging the lesion count by every rater, the results are shown in Table 3.
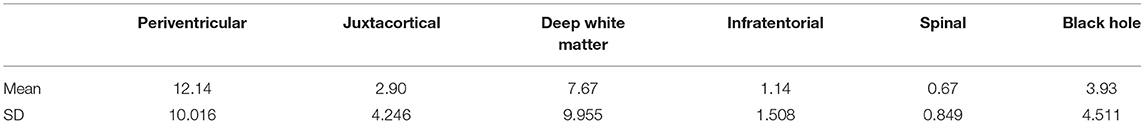
Table 3. Average lesion count per region.
Reproducibility of Lesion Count, All Rater, All Patients
The calculated ICCs for five raters were below the excellent (<0.90) reliability in every region (Figure 1; Table 4). The number of T2 hyperintense lesions in the cerebrum [periventricular, (juxta)cortical, deep white matter] had the best ICC (ICC: 0.761). The highest ICC was for the periventricular region (ICC: 0.731) which is considered a moderate–good result. Also, moderate results were given for juxtacortical lesions (ICC: 0.648) and for black holes (ICC: 0.669). Deep white matter (ICC: 0.534), infratentorial (ICC, 0.445), and spinal cord lesions (ICC: 0.562) had poor-to-moderate reproducibility. Poor reproducibility was noted for atrophy prediction (ICC: 0.349) and optic nerve involvement (ICC: 0.054).
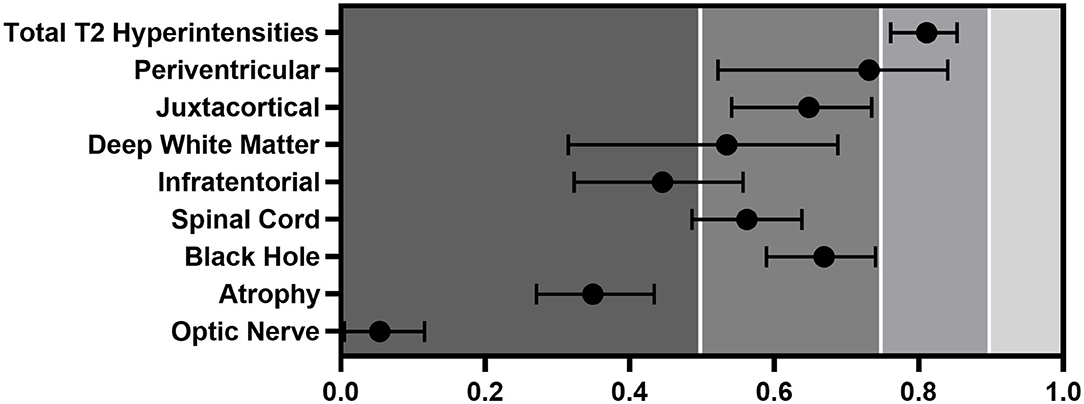
Figure 1. ICC of the different regions evaluated by all five raters. Error bars represent CIs.
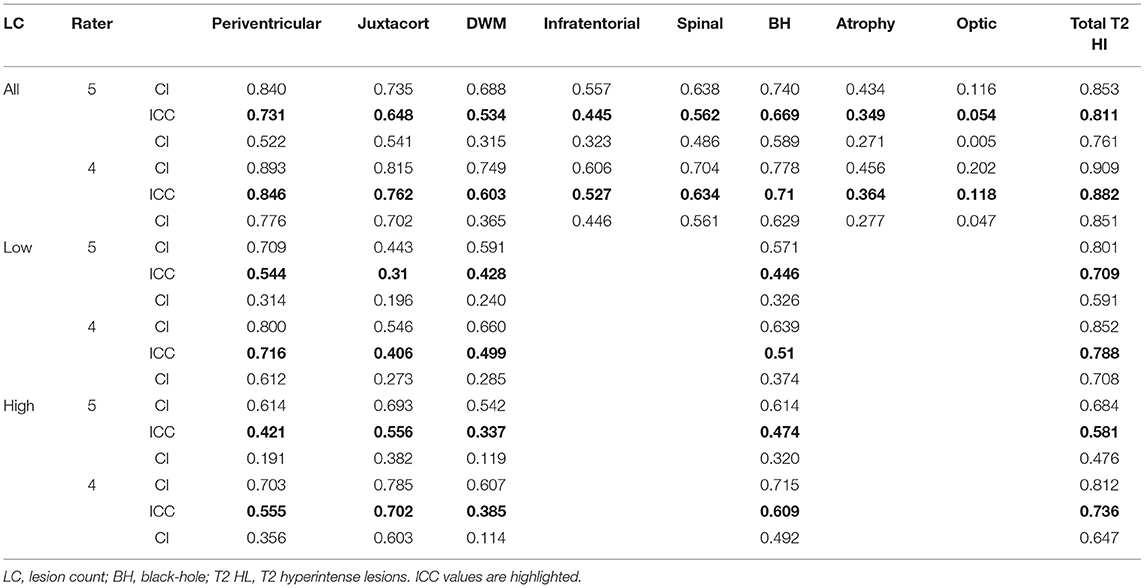
Table 4. Summary of the ICCs and the 95% CIs made in this study.
Concordance Between Raters
After leaving out the most outlier rater in every area, the ICCs improved between 0.015 and 0.115 (Figure 2). The most significant change and the best result was seen in the periventricular region, where we measured ICC to be 0.115 times higher than that with 5 raters, but it still did not reach the excellent level (ICC: 0.846). Juxtacortical (ICC, 0.762) and black hole (ICC: 0.710) values improved from moderate-to- good reliability. The spinal cord's ICC increased to moderate (ICC: 0.634) but infratentorial (ICC: 0.527) and deep white matter (ICC: 0.603) regions showed no significant quality change. Optic nerve (ICC: 0.118) and atrophy (ICC, 0.364) judgment showed the worst reliability even after leaving out the divergent rater. The sum of the lesions does reach the excellent range by a margin (ICC: 0.882).
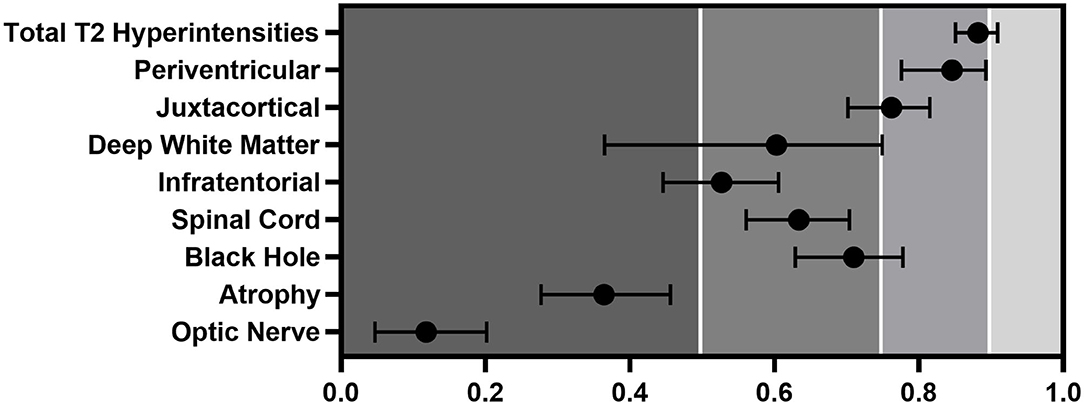
Figure 2. ICC with of the different regions evaluated by the four closest raters. Error bars represent CIs.
While in most of the regions, the ICCs improved marginally and the raters' performance did not differ significantly. By the leaving-one-out approach, the ICCs were very close (Figure 3).
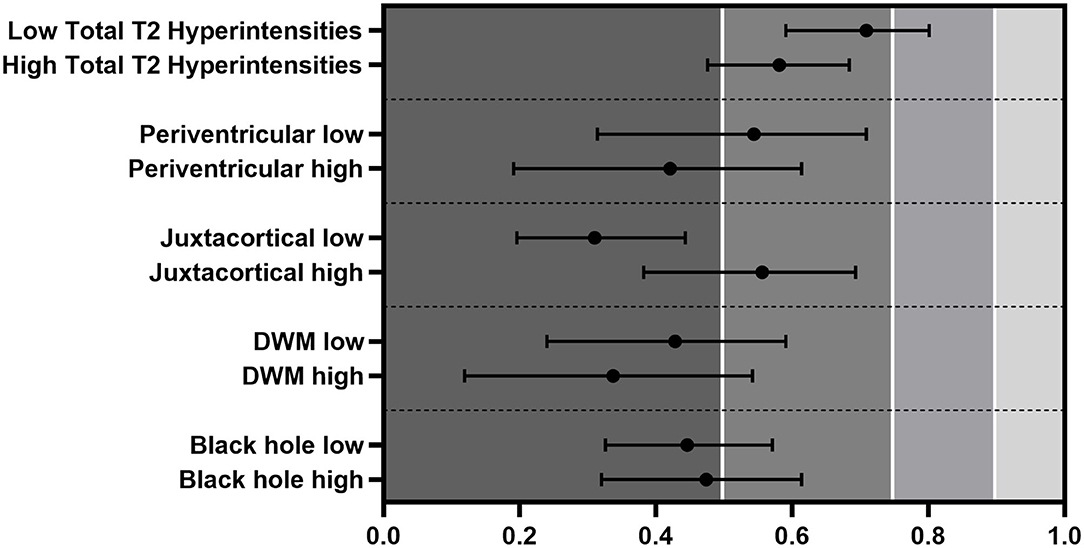
Figure 3. ICC differences between low- and high-lesion counts evaluated by every rater. Error bars represent CIs.
Reproducibility in High- and Low-Lesion Count Groups
We divided the patients into low- and high-lesion count groups based on the median lesion count of all five raters. ICCs were in the poor-to-moderate range, except for the sum of all lesions that reached moderate-to-good quality in the low-lesion count subjects (low ICC: 0.709 vs. high ICC: 0.581) (Figure 4). Periventricular [low (ICC: 0.544) vs. high (ICC: 0.421)] and DWM [low (ICC: 0.428) vs. high (ICC: 0.337)] regions showed better ICC on the lower side, and black holes presented minimal changes (low ICC: 0.446 vs. high ICC: 0.474). Interestingly, the lesion identification in the juxtacortical area performed much better, although not significantly in the higher lesion load group (low ICC: 0.310 vs. high ICC: 0.556).
Figure 4. ICC differences between low- and high-lesion counts evaluated by the four closest. The classification of juxtacortical lesions was significantly lower when the juxtacortical lesion burden was low. Error bars represent CIs.
The same analysis was performed using only the four best raters. The quality of the ICCs improved similarly to what we have seen with five raters (Figure 4). In the juxtacortical region, patients with a high-lesion load showed significantly higher ICC than the low group (low ICC: 0.406 vs. high ICC: 0.702). Black holes presented a slightly greater ICC in the high group (low ICC: 0.510 vs. high ICC: 0.609). Periventricular (low ICC: 0.716 vs. high ICC: 0.555) and DWM (low ICC: 0.499 vs. high ICC: 0.385) areas showed better ICC between raters in patients with a lower lesion count, but not significantly. The quality of the tests mostly stayed in the moderate-to-good range.
Discussion
In this study, we measured interrater reliability by lesion number and localization in patients with multiple sclerosis. Overall, the intraclass correlation coefficients showed high variability between different areas, although they never reached the excellent range.
Unexpectedly, abandoning the most divergent rater could not improve the ICC into the excellent quality range, even if a considerable improvement was seen in some regions. It was not possible to discriminate between the raters by experience, as their performance was close to each other (Figure 5), which means that they performed consistently throughout the study. The sum of the lesions having the highest ICC showed that the overall lesion count is reliable, but classifying them by regions is a difficult task.
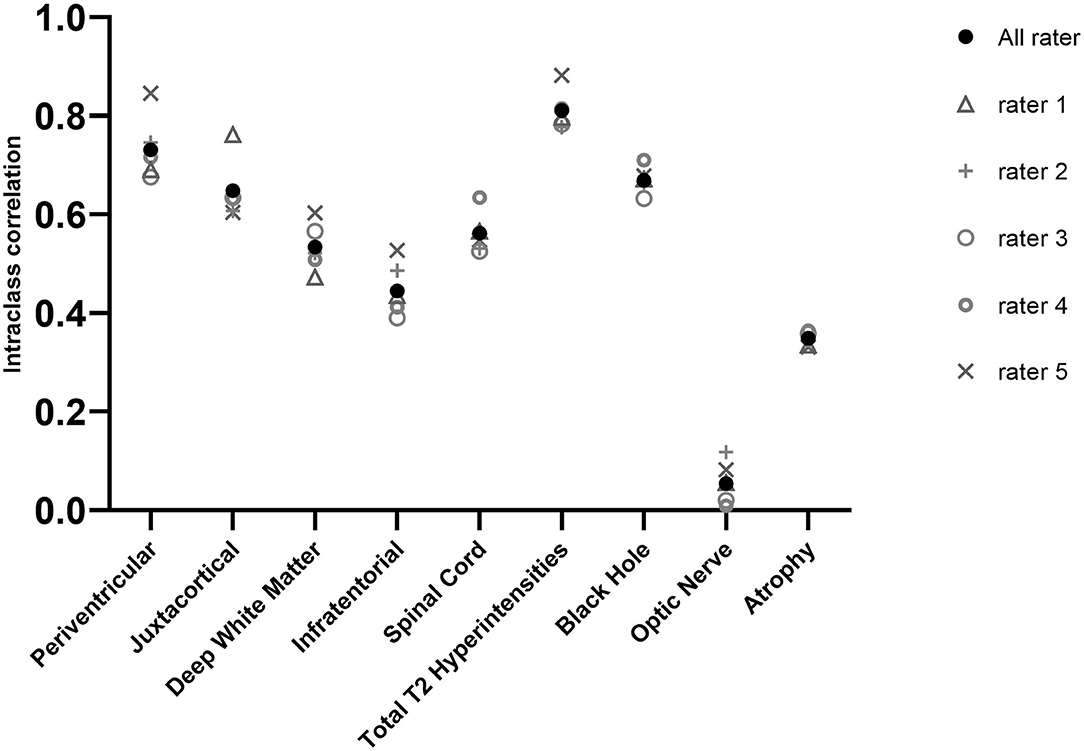
Figure 5. ICCs for all raters and when we left out different ones. For example, rater 1 shows ICC for the other 4 thus a higher value means lower performance for the rater.
Grouping by lesion numbers with the four best raters showed us that the juxtacortical lesions' ICC in the high-lesion load group was significantly higher than in the low-lesion group, seeing a tendency for this with black holes also. These results suggest that lesions in brain regions with little lesion probability (Table 3) have a higher chance for detection if the lesion count in that area is larger. The simple explanation for this can be that even a small number of lesions in a low-probability region is easier to detect than one or two lesions. We observed the opposite in regions where lesion number is normally high (periventricular, DWM); the ICC was higher if the lesion count was lower. The reason behind this could be similar, that is, the raters have an easier task to keep the counting on track with fewer lesions. Also, high-lesion load can be confluent, which is challenging to work with.
The explanation for this could be that these lesions are hard to detect even for experts using DIR sequences (20), while if a patient has a higher lesion number, then maybe they can no longer keep count and are more easily missed. The opposite of this was presented when we got higher ICC for low-lesion load in regions where the lesions are more common (periventricular, DWM), which can be explained by the difficulty of counting, as they could be confluent.
Altogether, it seems that the lesions could be best evaluated if their number is in the mid range. If it is too low, they could be missed easier and if it is too high then counting is more challenging with the appearance of the confluent inflammation.
The area in which new lesions appear is especially critical. In recent years, plenty of studies found evidence of clinical and cognitive impairment in association with cortical lesion load (7, 21, 22). Detecting these lesions could be challenging on FLAIR images, and though the DIR scan shows higher sensitivity (23), this sequence is not yet part of the conventional MS MRI protocol.
There is no consensus on whether optic nerve involvement should be in the diagnostic criteria. The 2016 MAGNIMS guideline (1) used optic lesions as a diagnostic marker but the 2017 revised McDonald criteria (2) excluded them, due to missing validation and it suggested further research to be conducted. We showed that optical lesions are difficult to spot and the ICC was lower than 0.2, which can be considered as a random classification that supports the view that diagnosis of MS should not be based on optic nerve findings.
Despite the results, managing a patient with MS can undoubtedly be aided with the quality of the report. Studies showed that structured MRI reports that use a template for a broad and proper description of MS findings contained significantly more adequate information relevant to MS clinical decision-making than non-structured reports (11, 12).
Lesion segmentation tools are available with different methodological approaches. Semiautomated software including threshold-based, fuzzy connectedness or seed-based region growing methods are still time-consuming and have limitations with large data (24). Automated segmentation algorithms become popular recently because of their high performance (25–30). The disadvantage of these approaches (e.g., the supervised algorithms) is the need for thorough training. Unsupervised methods do not have these limitations, albeit their results might be less accurate as they do not have any prior input data to train from (23).
The demand for reliable lesion segmentation software is growing. In the international MICCAI challenge (24) in 2016, 13 teams contested against the grand truth set by a record number of seven experts. The results showed that even the best method was by far outperformed by the experts. The study also showed a positive correlation between lesion load and volume with the three measured parameters, which means performance was worse when a patient had a smaller lesion number or volume. Automated approaches also had serious problems with data from a new unknown scanner. These data call attention to how important it is to know the exact performance of human readers in lesion detection, as some of the automated approaches are trained on these data.
To the best of our knowledge, this is the first study that investigates the interrater reliability of the lesion classification in different areas using a number of raters. Although there were some studies in which the interrater reliability was measured, but only for diagnostics. In the first study (14), the interobserver agreement between four neurologists was tested for diagnosing MS by the McDonald's and Poser's criteria. The results showed moderate-to-substantial agreement. In the second study (15), the interobserver agreement on the radiological criteria of the International Panel was investigated where four trained and four inexperienced radiologists were compared. The IP-trained radiologists reached moderate-to-substantial agreement and excellent agreement on the enhancing lesions while the non-trained group performed notably poorly.
Our study also has some limitations. First and most importantly, we did not manage to recruit five neuroradiology experts which could have made our results closer to reality. Despite our raters working in different fields, they all have the necessary experience with MS to make this study valid. Second, a grand truth was not established thus we cannot determine how much the raters deviated from it, but we can only see how close they were to each other. Third, intrarater correlation could have added an extra value to the study, but the limited resources did not make it possible to evaluate the scans for a second or third time. Finally, optic nerve hyperintensities were only examined on STIR sequences but not on FLAIR or DIR images, which could have improved our detection quality.
In summary, our study indicates that finding new lesions or diagnosing the disease can be overlooked even by experts that can influence disease outcomes. With the rapid development of artificial intelligence, the use of automated lesion segmentation software will eventually emerge into the clinical routine and will be a useful tool for (reporting) radiologists.
Data Availability Statement
The raw data supporting the conclusions of this article will be made available by the authors, without undue reservation.
Ethics Statement
The studies involving human participants were reviewed and approved by University of Szeged (Ref. No. 56/2011). The patients/participants provided their written informed consent to participate in this study.
Author Contributions
Guarantor of integrity of the entire study and manuscript editing: ZK. Study concepts and design: KB and PK. Literature research, statistical analysis, and manuscript preparation: BB. Experimental studies/data analysis: ET, IP, FK, NS, and BB. All authors contributed to the article and approved the submitted version.
Conflict of Interest
The authors declare that the research was conducted in the absence of any commercial or financial relationships that could be construed as a potential conflict of interest.
Publisher's Note
All claims expressed in this article are solely those of the authors and do not necessarily represent those of their affiliated organizations, or those of the publisher, the editors and the reviewers. Any product that may be evaluated in this article, or claim that may be made by its manufacturer, is not guaranteed or endorsed by the publisher.
References
1. Filippi M, Rocca MA, Ciccarelli O, De Stefano N, Evangelou N, Kappos L, et al. MRI criteria for the diagnosis of multiple sclerosis: MAGNIMS consensus guidelines. Lancet Neurol. (2016) 15:292–303. doi: 10.1016/S1474-4422(15)00393-2
2. Thompson AJ, Banwell BL, Barkhof F, Carroll WM, Coetzee T, Comi G, et al. Diagnosis of multiple sclerosis: 2017 revisions of the McDonald criteria. Lancet Neurol. (2018) 17:162–73. doi: 10.1016/S1474-4422(17)30470-2
3. Ouellette R, Bergendal Å, Shams S, Martola J, Mainero C, Kristoffersen Wiberg M, et al. Lesion accumulation is predictive of long-term cognitive decline in multiple sclerosis. Mult Scler Relat Disord. (2018) 21:110–6. doi: 10.1016/j.msard.2018.03.002
4. Goodin DS, Traboulsee A, Knappertz V, Reder AT Li D, Langdon D, et al. Relationship between early clinical characteristics and long term disability outcomes: 16 year cohort study (follow-up) of the pivotal interferon β-1b trial in multiple sclerosis. J Neurol Neurosurg Psychiatry. (2012) 83:282–7. doi: 10.1136/jnnp-2011-301178
5. Uher T, Vaneckova M, Sobisek L, Tyblova M, Seidl Z, Krasensky J, et al. Combining clinical and magnetic resonance imaging markers enhances prediction of 12-year disability in multiple sclerosis. Mult Scler. (2017) 23:51–61. doi: 10.1177/1352458516642314
6. Treaba CA, Granberg TE, Sormani MP, Herranz E, Ouellette RA, Louapre C, et al. Longitudinal characterization of cortical lesion development and evolution in multiple sclerosis with 7.0-T. MRI Radiol. (2019) 291:740–9. doi: 10.1148/radiol.2019181719
7. Calabrese M, Poretto V, Favaretto A, Alessio S, Bernardi V, Romualdi C, et al. Cortical lesion load associates with progression of disability in multiple sclerosis. Brain. (2012) 135(Pt 10):2952–61. doi: 10.1093/brain/aws246
8. Galassi S, Prosperini L, Logoteta A, Hirsch MN, Fanelli F, De Giglio L, et al. A lesion topography-based approach to predict the outcomes of patients with multiple sclerosis treated with Interferon Beta. Mult Scler Relat Disord. (2016) 8:99–106. doi: 10.1016/j.msard.2016.05.012
9. Minneboo A, Barkhof F, Polman CH, Uitdehaag BM, Knol DL, Castelijns JA. Infratentorial lesions predict long-term disability in patients with initial findings suggestive of multiple sclerosis. Arch Neurol. (2004) 61:217–21. doi: 10.1001/archneur.61.2.217
10. Díaz C, Zarco LA, Rivera DM. Highly active multiple sclerosis: An update. Mult Scler Relat Disord. (2019) 30:215–24. doi: 10.1016/j.msard.2019.01.039
11. Dickerson E, Davenport MS, Syed F, Stuve O, Cohen JA, Rinker JR, et al. Effect of template reporting of brain MRIs for multiple sclerosis on report thoroughness and neurologist-rated quality: results of a prospective quality improvement project. J Am Coll Radiol. (2017) 14:371–9 e1. doi: 10.1016/j.jacr.2016.09.037
12. Alessandrino F, Pichiecchio A, Mallucci G, Ghione E, Romani A, Bergamaschi R, et al. Do MRI structured reports for multiple sclerosis contain adequate information for clinical decision making? AJR Am J Roentgenol. (2018) 210:24–9. doi: 10.2214/AJR.17.18451
13. Barkhof F, Filippi M, van Waesberghe JH, Campi A, Miller DH, Adèr HJ. Interobserver agreement for diagnostic MRI criteria in suspected multiple sclerosis. Neuroradiology. (1999) 41:347–50. doi: 10.1007/s002340050762
14. Zipoli V, Portaccio E, Siracusa G, Pracucci G, Sorbi S, Amato MP. Interobserver agreement on Poser's and the new McDonald's diagnostic criteria for multiple sclerosis. Mult Scler. (2003) 9:481–5. doi: 10.1191/1352458503ms956oa
15. Korteweg T, Uitdehaag BM, Knol DL, Smithuis RH, Algra PR, de Vries C, et al. Interobserver agreement on the radiological criteria of the International Panel on the diagnosis of multiple sclerosis. Eur Radiol. (2007) 17:67–71. doi: 10.1007/s00330-006-0303-5
16. Polman CH, Reingold SC, Banwell B, Clanet M, Cohen JA, Filippi M, et al. Diagnostic criteria for multiple sclerosis: 2010 revisions to the McDonald criteria. Ann Neurol. (2011) 69:292–302. doi: 10.1002/ana.22366
17. Kincses Z, Tóth E, Fricska-Nagy Z, Füvesi J, Rajda C, Bencsik K, et al. The role of MRI in measuring the effectivity of disease modifying treatments II. Ideggyogy Sz. (2018) 71:81–8. doi: 10.18071/isz.71.0081
18. Tóth E, Bencsik K, Vörös E, Fricska-Nagy Z, Füvesi J, Rajda C, et al. The role of MRI in measuring the effectivity of disease modifying treatments I. Ideggyogy Sz. (2018) 71:77–80. doi: 10.18071/isz.71.0077
19. Terry K, Koo P, Li MY. Erratum to “A Guideline of Selecting and Reporting Intraclass Correlation Coefficients for Reliability Research”. J Chiropr Med. (2016) 15:155–63. J Chiropr Med. (2017) 16:346. doi: 10.1016/j.jcm.2017.10.001
20. Faizy TD, Thaler C, Ceyrowski T, Broocks G, Treffler N, Sedlacik J, et al. Reliability of cortical lesion detection on double inversion recovery MRI applying the MAGNIMS-Criteria in multiple sclerosis patients within a 16-months period. PLoS ONE. (2017) 12:e0172923. doi: 10.1371/journal.pone.0172923
21. Roosendaal SD, Moraal B, Pouwels PJ, Vrenken H, Castelijns JA, Barkhof F, et al. Accumulation of cortical lesions in MS: relation with cognitive impairment. Mult Scler. (2009) 15:708–14. doi: 10.1177/1352458509102907
22. Harrison DM, Roy S, Oh J, Izbudak I, Pham D, Courtney S, et al. Association of cortical lesion burden on 7-T magnetic resonance imaging with cognition and disability in multiple sclerosis. JAMA Neurol. (2015) 72:1004–12. doi: 10.1001/jamaneurol.2015.1241
23. Wattjes MP, Lutterbey GG, Gieseke J, Traber F, Klotz L, Schmidt S, et al. Double inversion recovery brain imaging at 3T: diagnostic value in the detection of multiple sclerosis lesions. AJNR Am J Neuroradiol. (2007) 28:54–9. doi: 10.1055/s-2006-931847
24. Mortazavi D, Kouzani AZ, Soltanian-Zadeh H. Segmentation of multiple sclerosis lesions in MR images: a review. Neuroradiology. (2012) 54:299–320. doi: 10.1007/s00234-011-0886-7
25. García-Lorenzo D, Prima S, Arnold DL, Collins DL, Barillot C. Trimmed-likelihood estimation for focal lesions and tissue segmentation in multisequence MRI for multiple sclerosis. IEEE Trans Med Imaging. (2011) 30:1455–67. doi: 10.1109/TMI.2011.2114671
26. Roura E, Oliver A, Cabezas M, Valverde S, Pareto D, Vilanova JC, et al. A toolbox for multiple sclerosis lesion segmentation. Neuroradiology. (2015) 57:1031–43. doi: 10.1007/s00234-015-1552-2
27. Jain S, Sima DM, Ribbens A, Cambron M, Maertens A, Van Hecke W, et al. Automatic segmentation and volumetry of multiple sclerosis brain lesions from MR images. Neuroimage Clin. (2015) 8:367–75. doi: 10.1016/j.nicl.2015.05.003
28. Schmidt P. Bayesian inference for structured additive regres- sion models for large-scale problems with applications to medical imaging. Munich: Ludwig-Maximilians University, Munich. (2017).
29. Griffanti L, Zamboni G, Khan A, Li L, Bonifacio G, Sundaresan V, et al. BIANCA (Brain Intensity AbNormality Classification Algorithm): A new tool for automated segmentation of white matter hyperintensities. Neuroimage. (2016) 141:191–205. doi: 10.1016/j.neuroimage.2016.07.018
Keywords: multiple sclerosis, lesion, MRI, intraclass correlation, interobservator variability, reproducibility
Citation: Bozsik B, Tóth E, Polyák I, Kerekes F, Szabó N, Bencsik K, Klivényi P and Kincses ZT (2022) Reproducibility of Lesion Count in Various Subregions on MRI Scans in Multiple Sclerosis. Front. Neurol. 13:843377. doi: 10.3389/fneur.2022.843377
Received: 25 December 2021; Accepted: 07 April 2022;
Published: 10 May 2022.
Edited by:
Marcello Moccia, University of Naples Federico II, ItalyReviewed by:
Subhranil Koley, Indian Institute of Technology Kharagpur, IndiaElizaveta Lavrova, University of Liège, Belgium
Copyright © 2022 Bozsik, Tóth, Polyák, Kerekes, Szabó, Bencsik, Klivényi and Kincses. This is an open-access article distributed under the terms of the Creative Commons Attribution License (CC BY). The use, distribution or reproduction in other forums is permitted, provided the original author(s) and the copyright owner(s) are credited and that the original publication in this journal is cited, in accordance with accepted academic practice. No use, distribution or reproduction is permitted which does not comply with these terms.
*Correspondence: Zsigmond Tamás Kincses, a2luY3Nlcy56c2lnbW9uZC50YW1hc0BtZWQudS1zemVnZWQuaHU=