 Xiaoli Du
 Yue He2
 Wei Lin
- 1Department of Radiology, Chengdu First People's Hospital, Chengdu, China
- 2Department of Orthopedics, Chengdu First People's Hospital, Chengdu, China
Background: It is difficult to differentiate between a few primary central nervous system lymphoma (PCNSL) and high-grade glioma (HGG) using conventional magnetic resonance imaging techniques. The purpose of this study is to explore whether diffusion-weighted imaging (DWI) can be effectively used to differentiate between these two types of tumors by analyzing the apparent diffusion coefficient (ADC).
Research Design and Methods: Data presented in Pubmed, Embase, Web of Science, Cochrane Library, China National Knowledge Infrastructure (CNKI), Wanfang Database, and China Science and Technology Journal Database (CQVIP) were analyzed. High-quality literature was included, and the quality was evaluated using the quality assessment of diagnostic accuracy studies-2 (QUADAS-2) tool, and the studies were based on the inclusion and exclusion rules. The pooled sensitivity, pooled specificity, pooled positive likelihood ratio (PLR), pooled negative likelihood ratio (NLR), pooled diagnostic odds ratio (DOR), area under the curve (AUC) of the summary operating characteristic curve (SROC), and corresponding 95% confidence interval (CI) were calculated using the bivariate mixed effect model. Meta-regression analysis and subgroup analysis were used to explore the sources of heterogeneity. The publication bias was evaluated by conducting Deek's test.
Results: In total, eighteen high-quality studies were included. The pooled sensitivity was 0.82 (95% CI: 0.75–0.88), the pooled specificity was 0.87 (95% CI: 0.84–0.90), the pooled positive likelihood ratio was 6.49 (95% CI: 5.06–8.32), the pooled NLR was 0.21 (95% CI: 0.14–0.30), the pooled DOR was 31.31 (95% CI: 18.55–52.86), and the pooled AUC was 0.90 (95% CI: 0.87–0.92). Sample size, language and country of publication, magnetic field strength, region of interest (ROI), and cut-off values of different types of ADC can potentially be the sources of heterogeneity. There was no publication bias in this meta-analysis.
Conclusions: The results obtained from the meta-analysis suggest that DWI is characterized by high diagnostic accuracy and thus can be effectively used for differentiating between PCNSL and HGG.
Introduction
Primary central nervous system lymphoma (PCNSL) is a variant of the non-Hodgkin lymphoma of the central nervous system. PCNSL is a disease in which cancer cells form in the primary brain, spinal cord, and eye (1). The origin of 3–5% of intracranial tumors can be attributed to PCNSL. It has been observed that the incidence rate of PCNSL is increasing each year (2). The clinical manifestations are similar to the clinical manifestations observed for intracranial gliomas. Apart from the process of pathological biopsy, imaging techniques are also used to differentiate between the two types of tumors. At present, the recommended PCNSL treatment method involves the use of chemotherapy combined with immunotherapy. Generally, surgery is not recommended (3, 4). HGG is primarily resected surgically, and the process is supplemented by radiotherapy and chemotherapy (5). The choice of the treatment plan heavily relies on the accurate identification of the two types of tumors.
A significant number of uniformly enhanced masses or nodules are observed in the deep parts of the brain near the midline structure when the MRI technique is used to study the manifestation of PCNSL. Atypical MRI manifestations, which overlap with the manifestations observed for HGG, are observed in some cases, making the accurate identification of the tumors difficult. This can potentially result in misdiagnosis. Diffusion-weighted imaging (DWI) is a new MRI technology that was developed in the middle of the 1990s. It is the only non-invasive method that can be used to detect the diffusion of water molecules in living tissues (6). DWI does not involve the process of contrast agent imaging. This process can be used to diagnose patients allergic to contrast agents or patients suffering from abnormal renal function. The results obtained using this technique are better than the result obtained using other techniques, such as enhanced MRI. The apparent diffusion coefficient (ADC) value can eliminate the effects of the T2 penetration effect and diffusion-sensitive gradient. This value can accurately and truly reflect the diffusion ability of water molecules in tumor tissues. The ADC value can quantitatively reflect the density and malignancy of tumor cells. Hence, it is widely used in clinical diagnosis (7). We hypothesized that the ADC value could be used to distinguish between the two types of tumors as the extents of blood flow characterizing PCNSL and HGG are different. Based on the current research status, we conducted a systematic meta-analysis to evaluate the comprehensive diagnostic value of DWI combined with ADC for accurately identifying PCNSL and HGG.
Materials and Methods
Search Strategy
Chinese and English databases were primarily searched. The English databases include Pubmed, Embase, Web of Science, and Cochrane Library, and the Chinese databases include China National Knowledge Infrastructure (CNKI), Wanfang Database, and China Science and Technology Journal Database (CQVIP). The keywords used were glioma, lymphoma, DWI, and ADC. We can obtain the relevant “Medical Subject Headings” from https://www.ncbi.nlm.nih.gov/mesh/?term=. For different databases, different Boolean logic retrieval formulae were used. The period for database retrieval covered the period from the establishment of each retrieval database to March 2022.
Inclusion and Exclusion Criteria
There were several inclusion criteria: 1) The patient should have pathologically confirmed PCNSL and high-grade glioma (the WHO grade III or grade IV). 2) The patient should not have been exposed to any treatment methods prior to being subjected to the imaging conditions. 3) The patient should have undergone DWI–MRI sequence tests. 4) Studies with sufficient data to calculate true-positive (TP), false-positive (FP), false-negative (FN), and true-negative (TN) values should be considered. For example, the considered for the studies contains raw data for all patients. The reports present the sensitivity and specificity achieved using DWI during the diagnosis of the two diseases. Sensitivity is expressed as TP/(TP+FN), and specificity is expressed as TN/(TN+FP). These formulae can be used to obtain the relevant data (4) The sample sizes greater than 10 should be considered. The were several exclusion criteria applied. 1) Cases, where animal experiments or other basic experiments were conducted, were not considered. 2) Data from non-original research articles, such as the data presented in review articles, conference reports, abstracts, comments, letters, and case reports were excluded. 3) Patients from the same cohort were not considered. When the research samples are from the same cohort, we consciously consider and choose the latest study reported or the study with the largest sample size.
Data Collection and Quality Assessment
During the process, two researchers are selected. If there are differences among the authors, the differences are resolved through discussion within the group. The extraction parameters primarily include the author of the study, the year of publication, the sample size (control group and case group sizes), the average age and gender of the patients in the control and case groups, research type (whether it is a retrospective study or a prospective study), imaging parameters corresponding to DWI, sensitivity, specificity, cut-off value, and the TP, FP, TN, and FN values of each study.
The quality of the included literature reports was evaluated based on the guidelines presented by the quality assessment of diagnostic accuracy studies-2 (QUADAS-2) tool and a Newcastle-Ottawa Scale (NOS). The QUADAS-2 scale was divided into various factors: 1) patient selection; 2) index test; 3) reference standard; and 4) flow and timing (8). The software Review Manager (version 5.2) was used to determine the bias and quality of the included studies. The literature quality evaluation chart was also drawn. The answers “yes,” “unclear,” and “no” corresponded to “high risk,” “unclear risk,” or “low risk,” respectively, and indicated the bias risk level. The risk levels were denoted in red, yellow, and green, respectively, in the quality evaluation chart. The NOS was used to assess the quality of included case-control and cohort studies and each item of NOS is assigned 1 or 2 points. Studies with a score of 5 or more are considered to be of high quality.
Statistical Analysis
The data were analyzed using Stata 15.1 (64-bit), Review manager 5.2, and MetaDiSc 1.4. The pooled sensitivity, pooled specificity, pooled positive likelihood ratio (PLR), pooled negative likelihood ratio (NLR), pooled diagnostic odds ratio (DOR), summary receiver operating characteristic (SROC), area under the curve (AUC), and corresponding 95% confidence interval (CI) of DWI for the differentiation of PCNSL and HGG were calculated using the bivariate mixed effect model (9). The relationships among prior-test probability, likelihood ratio, and post-test probability were studied to certify using Fagan's nomogram. The heterogeneity of the study was assessed by conducting the Cochran-Q and I2 tests (10). A p < 0.05 was considered statistically significant. When I2 was > 50%, high heterogeneity among the studies was suggested. MetaDiSc 1.4 software was used to calculate the Spearman correlation coefficient between the logarithm of sensitivity and the logarithm of 1-specificity to determine whether the threshold effect results in heterogeneity. A strong positive correlation indicates the generation of a threshold effect (11). The literature publication bias was evaluated by analyzing the Deeks' funnel plot (12). Sensitivity analysis, meta-regression analysis, and subgroup analysis methods were used to identify the source of heterogeneity. The value of p < 0.05 was considered statistically significant.
Results
Literature Search and Quality Evaluation
We have preliminarily identified 261 documents (duplicate documents were excluded) for our studies by searching the Chinese and English databases. After reading the abstract and judging the literature type, we excluded 169 non-original studies (literature and review articles unrelated to this field of study). After thoroughly reading the remaining literature reports, we included a total of 18 literature reports (13–30) for meta-analysis. A total of 372 patients with PCNSL and 701 patients with glioma were included in the study. A total of 32 lesions (14 glioblastomas and 18 PCNSL) were studied by Anwar et al. (24). Hence, a total of 380 lesions characterized by PCNSL and 704 lesions characterized by glioma were included in the meta-analysis. The process of literature screening is presented in Figure 1, and the basic characteristics of the included literature reports are shown in Tables 1, 2. Results obtained from QUADAS-2 are presented in Figure 2, and the quality evaluation of NOS are shown in Supplementary Table 1. The quality of the included studies was found to be satisfactory.
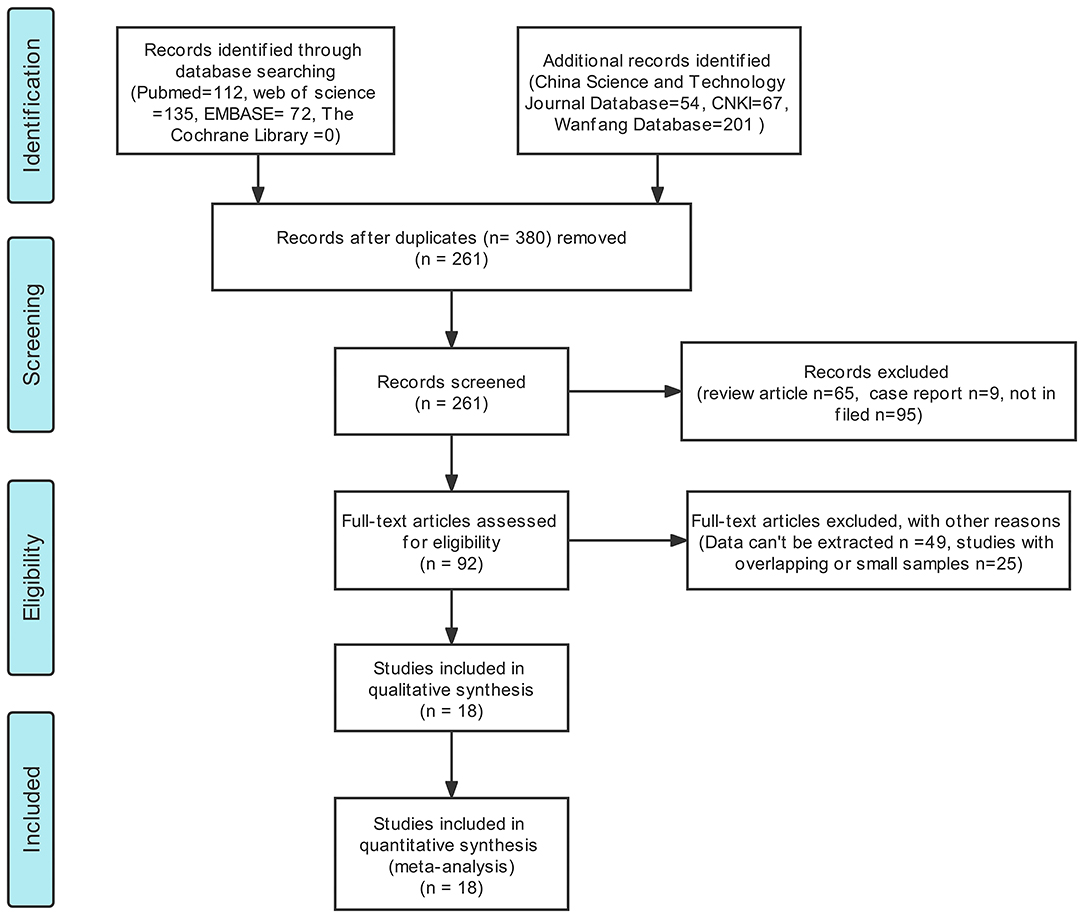
Figure 1. A Flowchart representing the literature selection process.
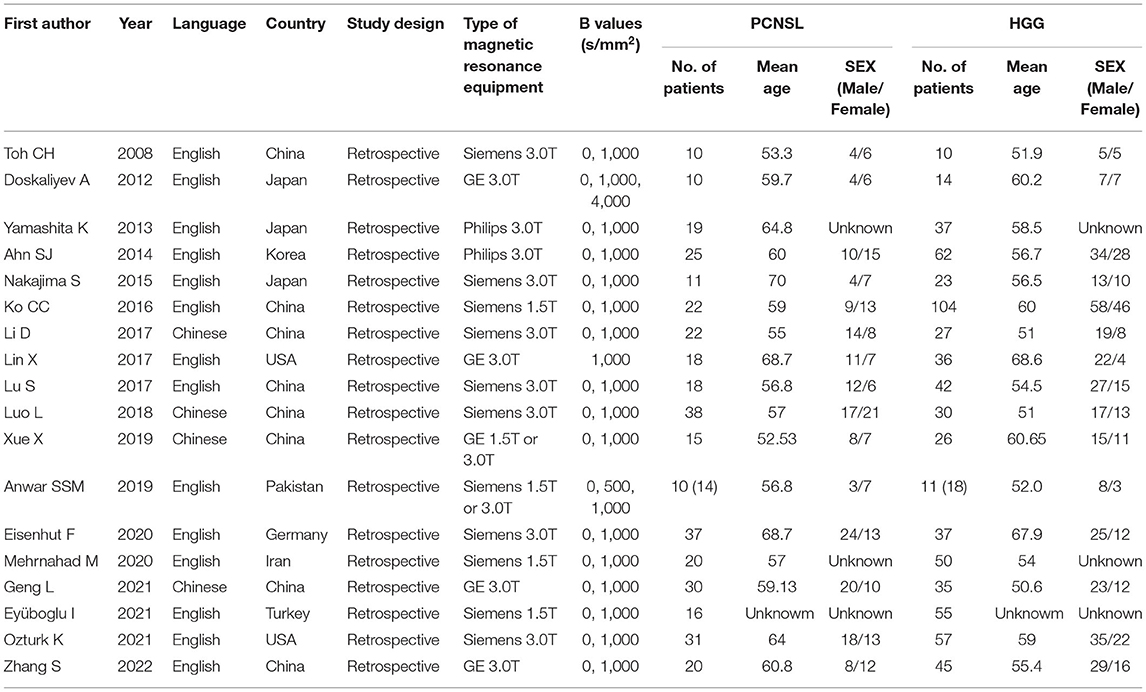
Table 1. Basic clinical characteristics and parameters of the included literature.
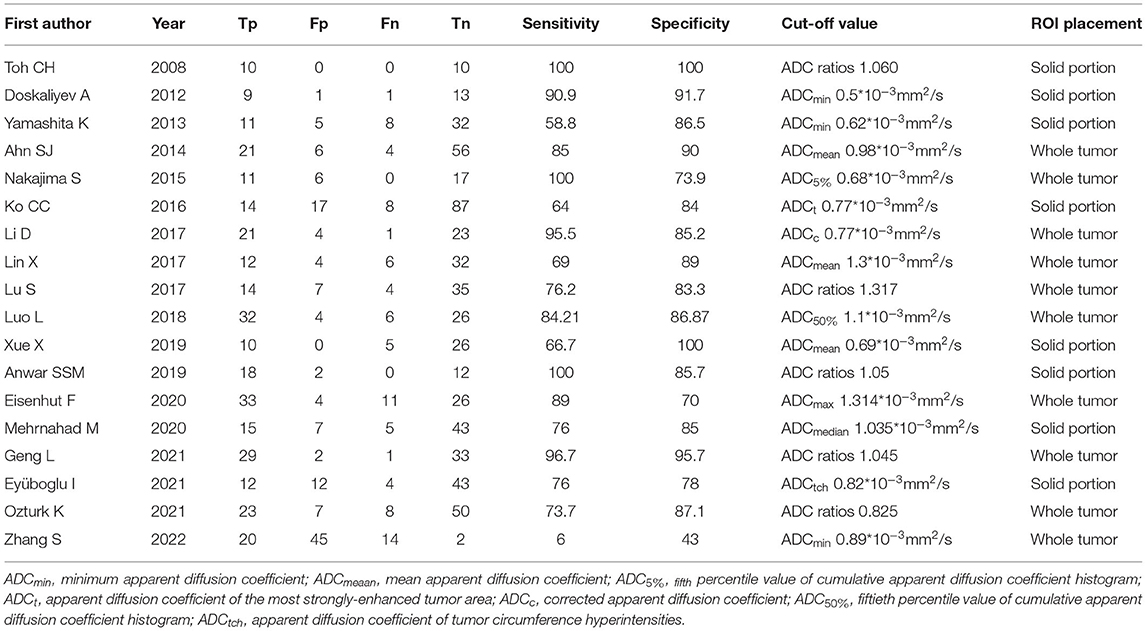
Table 2. Characteristic of primary diagnostic studies.
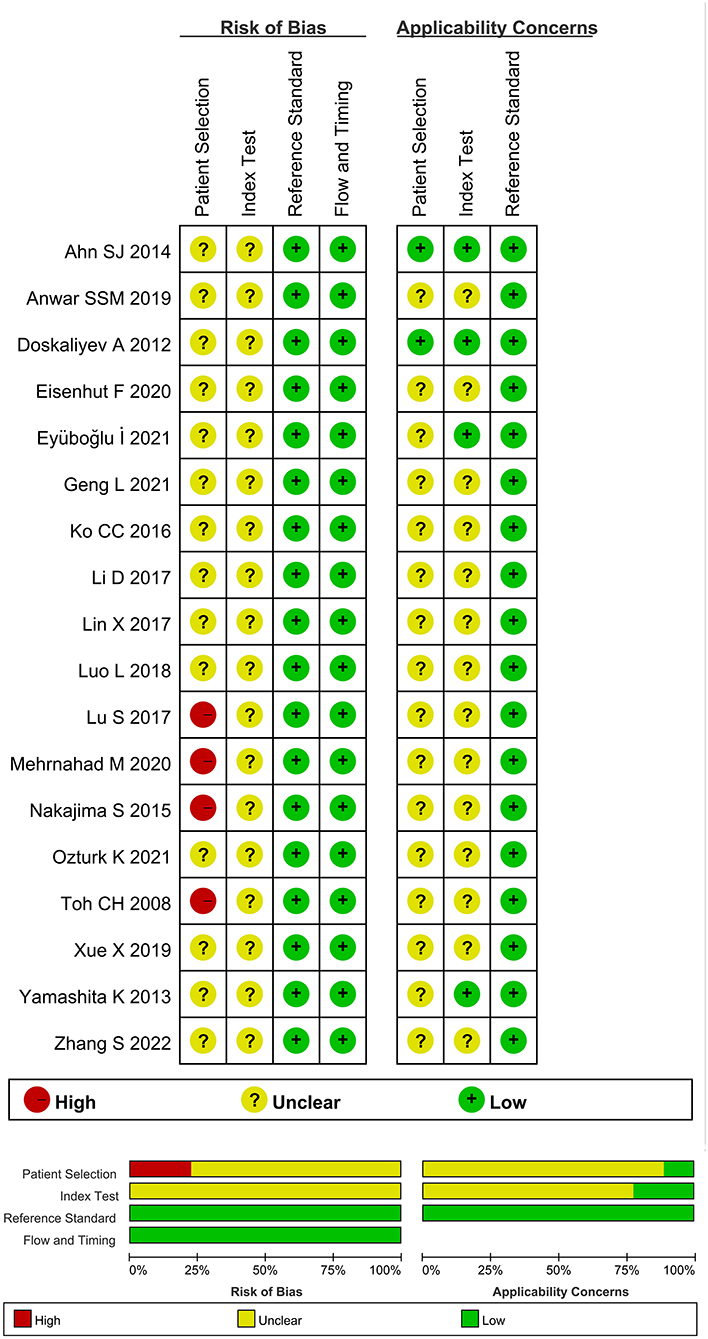
Figure 2. A document quality evaluation chart prepared using the QUADAS-2 tool.
Meta-Analysis: Results
The results of the heterogeneity test were obtained (Q = 3.409, df = 2.00, p = 0.091, I2 = 41%; 95% CI was in the range of 0–100). It was observed that moderate levels of heterogeneity existed between the included studies. The results of the threshold effect test revealed that the Spearman correlation coefficient was 0.048 (p = 0.851). This indicated that a threshold effect did not result in heterogeneity. The pooled sensitivity of DWI (used to differentiate PCNSL from HGG) was 0.82 (95% CI: 0.75–0.88), the pooled specificity was 0.87 (95% CI: 0.84–0.90), the pooled PLR was 6.49 (95% CI: 5.06–8.32), the pooled NLR was 0.21 (95% CI: 0.14–0.30), and the pooled DOR was 31.31 (95% CI: 18.55–52.86). The forest maps of pooled results are shown in Figures 3A–E. The results obtained by analyzing the SROC are presented in Figure 3F. The AUC of SROC was 0.90 (95% CI 0.87–0.92). Analysis of the Fagan diagram (Figure 4) reveals that the probability before the prediction is 50%. Under conditions of positive DWI, the probability of diagnosing PCNSL would increase the post-test probability to 87%. When the result was negative, the probability of diagnosing PCNSL would decrease the post-test probability to 17%.
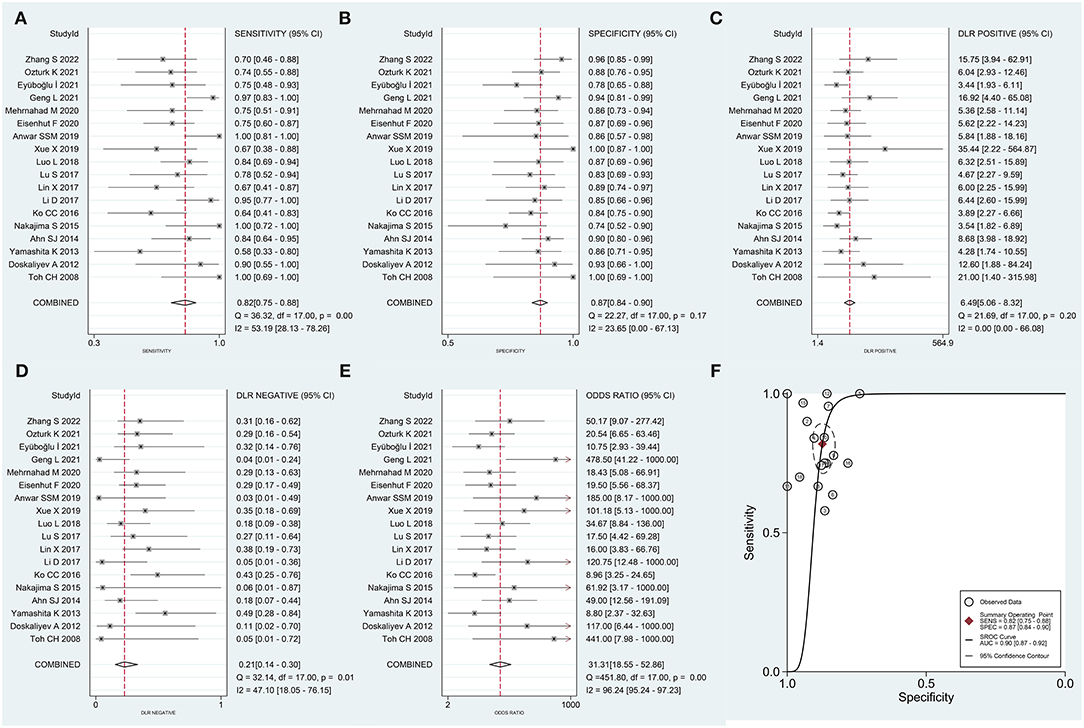
Figure 3. Forest plot generated for pooled (A) sensitivity, (B) specificity, (C) positive likelihood ratio (PLR), (D) negative likelihood ratio (NLR), (E) diagnostic odds ratio (DOR), and (F) area under the curve (AUC) recorded for the summary receiver operating characteristic (SROC) curve.
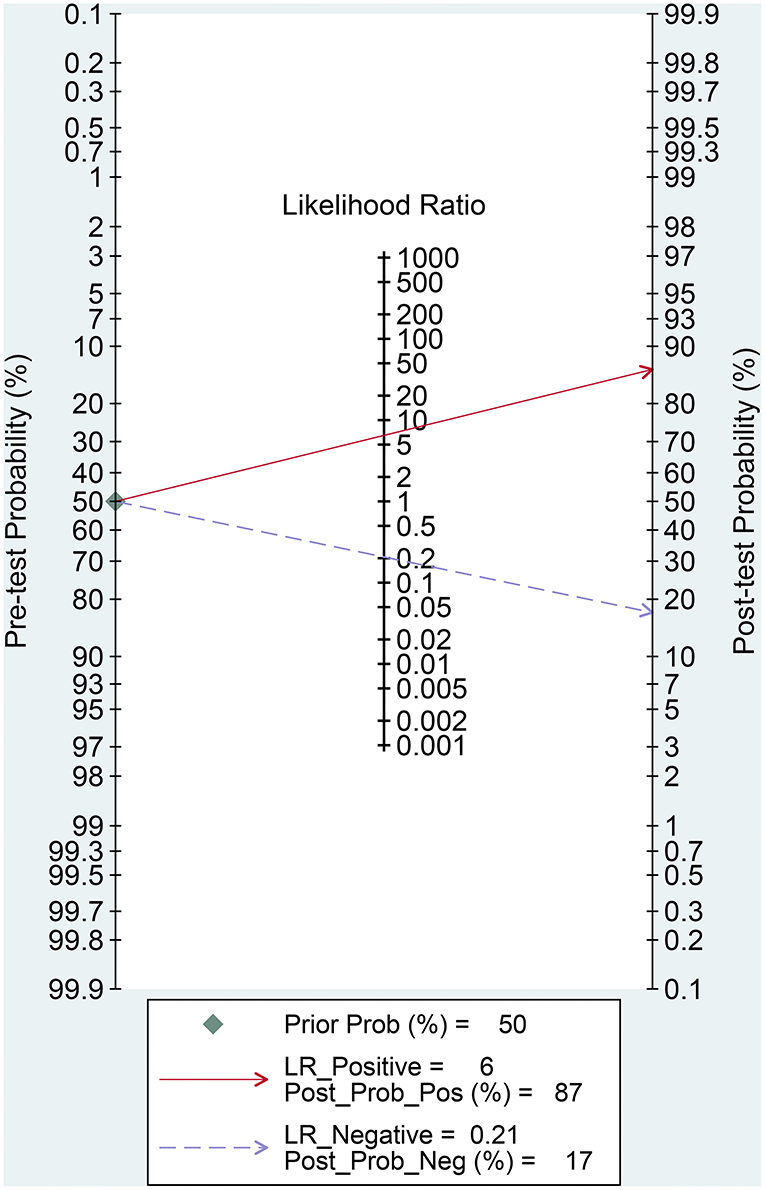
Figure 4. Fagan's nomogram for evaluating the post-test probability.
Meta-Regression and Subgroup Analysis
We conducted a meta-regression analysis to find the potential source of heterogeneity. Various variables were considered: sample size (>50 vs. <50), language (English vs. Chinese), country (Asia vs. other continents), magnetic field strength (3.0 vs. 1.5 T), the necessity of using ADC ratios, ADCmin, and ADCmean as the cut-off value (Yes vs. No), and ROI placement (solid portion vs. the whole tumor). This is presented in Figure 5. Some of the variables (sample size, language, and necessity of using ADCmin as the cut-off value) are the sources of heterogeneity for sensitivity and specificity, while others (country, magnetic field strength, necessity of using ADC ratios, ADCmean as the cut-off values, and ROI placement) are the sources of heterogeneity observed in specificity.
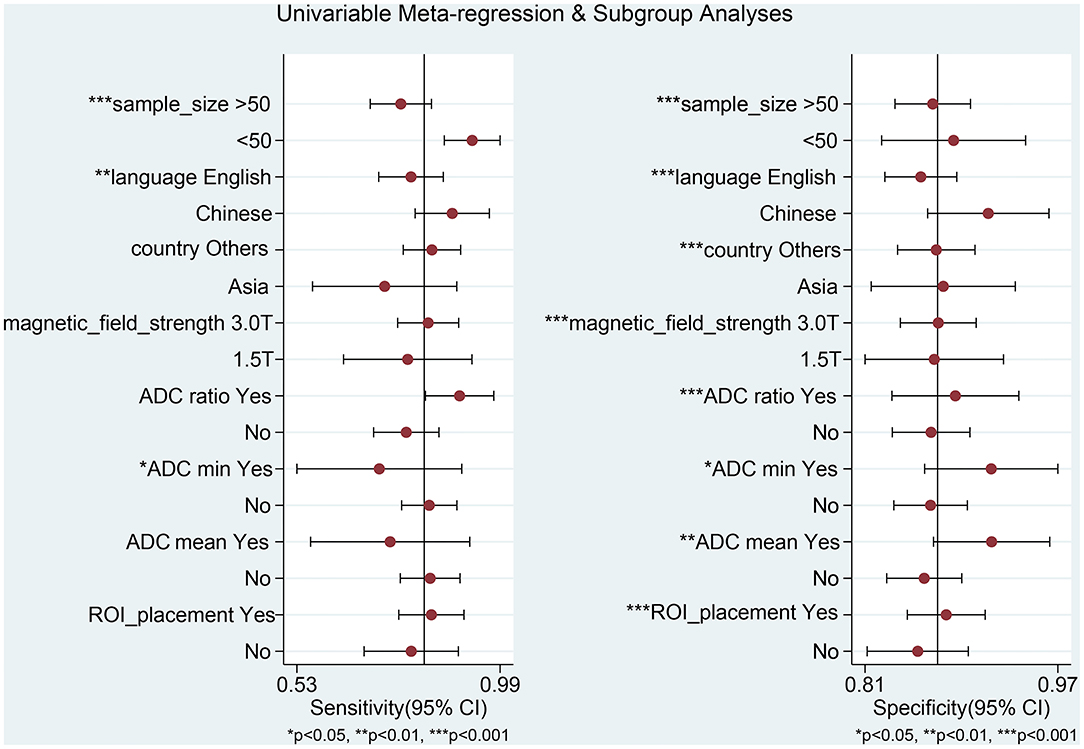
Figure 5. Univariable meta-regression analysis for the sensitivity and specificity of DWI for differentiating between primary central nervous system lymphoma (PCNSL) and high-grade glioma (HGG).
For subgroup analysis (Table 3), the results of studies with a pooled literature whose sample size is less than 50 have a high sensitivity of 0.93 (95% CI: 0.86–0.99) and a specificity of 0.89 (95% CI: 0.83–0.95). Results from pooled studies conducted with Chinese language literature revealed that a high sensitivity of 0.88 (95% CI: 0.80–0.97) and a specificity of 0.92 (95% CI: 0.87–0.97) was achieved. Low sensitivity of 0.78 (95% CI: 0.70–0.85) was achieved in cases where ADC ratios were not used as the cut-off values. When ADCmin was not used as the cut-off value, high sensitivity of 0.83 (95% CI: 0.77–0.89) and low specificity of 0.87 (95% CI: 0.84–0.90) was achieved. In cases where ADCmean was not used as the cut-off value, high sensitivity of 0.83 (95% CI: 0.76–0.90) and low specificity of 0.86 (95% CI: 0.83–0.89) were achieved. When ROI placement reflected a solid tumor, a low sensitivity of 0.79 (95% CI: 0.68–0.90) was achieved.
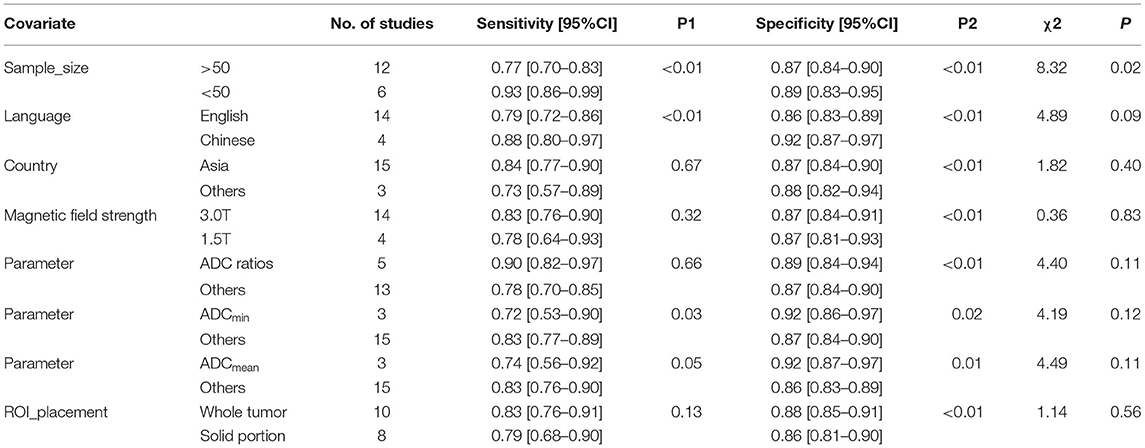
Table 3. Results of subgroup analysis and meta-regression analysis.
Sensitivity Analysis and Publication Bias
Results from sensitivity analysis revealed that the goodness of fit and bivariate normality tests should be conducted using the bivariate mixed effect model for the meta-analysis (Figure 6). Four influential outliers were identified. No other outliers could be identified by conducting outlier detection tests. The four abnormal studies were excluded, and significant changes in sensitivity (0.83 vs. 0.82), specificity (0.85 vs. 0.87), PLR (5.65 vs. 6.49), NLR (0.20 vs. 0.21), AUC (0.86 vs. 0.90) and DOR (27.72 vs. 31.31) were not observed. This indicated that the combined results were relatively stable. Deek's test was performed to assess the publication bias (Figure 7). The number of studies on both sides of the dividing line was roughly equal and symmetrical (p = 0.09), indicating the absence of publication bias. Besides, the funnel plot was shown in Supplementary Figure 1.
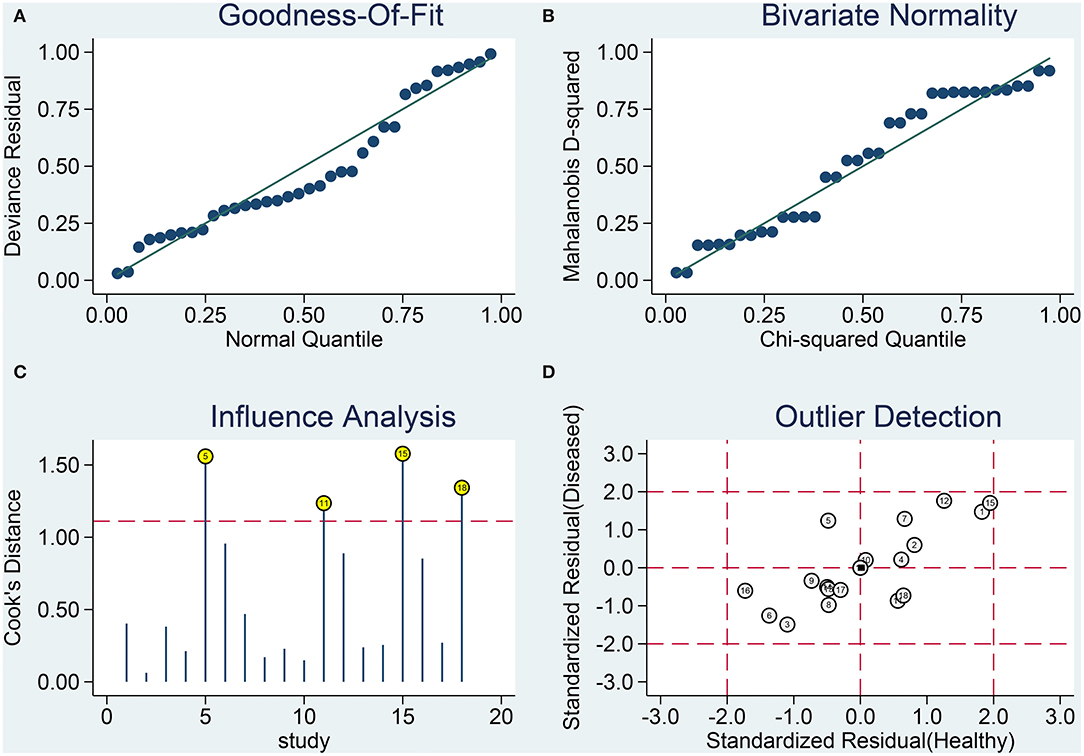
Figure 6. Results from sensitivity analysis. (A) Goodness-of-fit, (B) bivariate normality, (C) influence analysis, and (D) outlier detection.
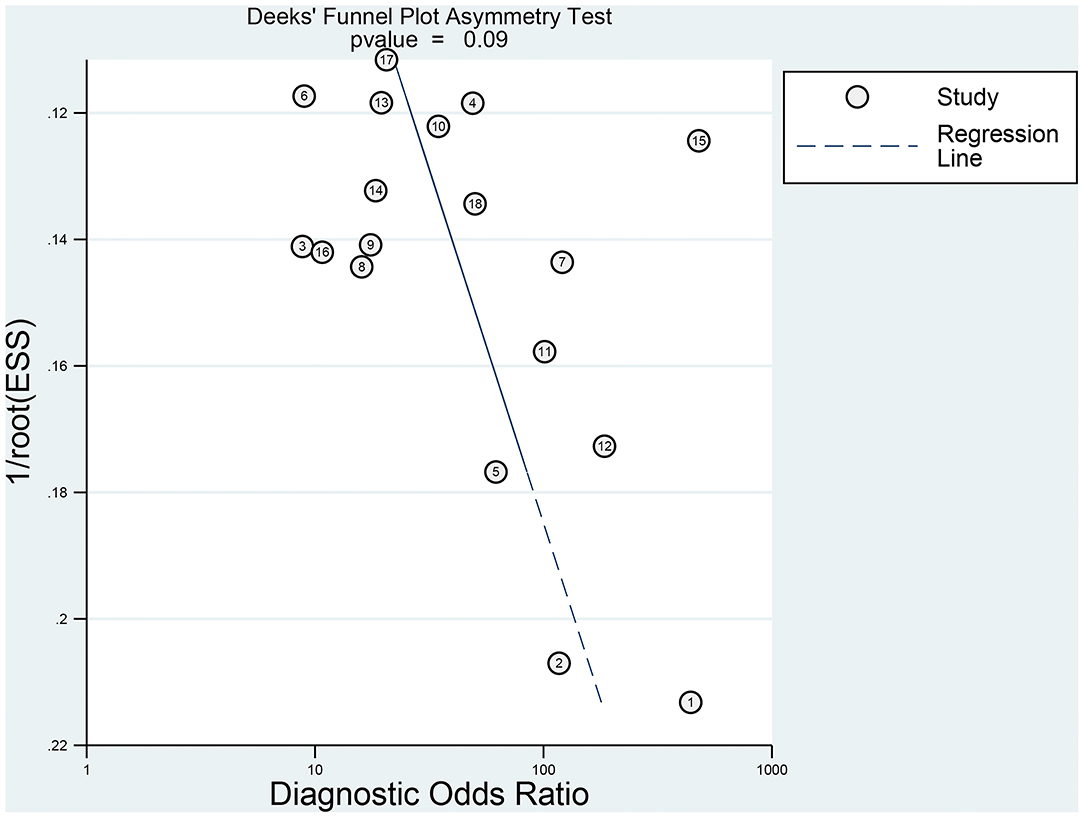
Figure 7. Publication bias determined by conducting Deeks' test.
Discussion
We thoroughly searched and studied the Chinese and English databases to perform the meta-analyses. We selected a total of 18 relevant literature reports for the studies after thoroughly reading the literature reports (taking into account the inclusion and exclusion criteria). The pooled sensitivity, specificity, PLR, NLR, and DOR were 0.82, 0.87, 6.5, 0.21, and 31, respectively. The AUC was 0.90, indicating that DWI can effectively distinguish between PCNSL and HGG. The DOR is a single performance indicator that combines sensitivity and specificity for diagnostic testing. As the pooled DOR of the 18 studies selected by us was 31, it was advantageous to use DWI to distinguish PCNSL from HGG. Moderate levels of heterogeneity were obtained post meta-analysis. and there was no publication bias.
Primary central nervous system lymphoma and HGG are characterized by a similar location of onset, high cell density, multi-center onset, and invasive growth. Thus, there is a high chance of misdiagnosis (31). PCNSL can often be found in the deep brain parenchyma near the intracranial midline. It is mostly found on the tentorium. a slightly lower or equal T1 signal, equal or slightly higher T2 signal, highly intense DWI signal, low-intensity ADC signal, low incidence of internal cystic necrosis, mild to moderate peritumoral edema, and space-occupying effects can be observed using the MRI technique compared with other intracranial tumors (32). HGG invades a wide area (usually involving two or more lobes of the cerebral hemisphere). The invasion can be primarily observed in the white matter. Analysis of the images recorded using the MRI technique revealed the diffuse infiltration of the tumor cells and/or demyelination of the white matter. The signal was uniform, the boundary was unclear, and the tumor infiltration and edema could not be distinguished (33).
It has been previously reported that the density of the micro-vessel in PCNSL is significantly less than the density of the micro-vessels in HGG (34). This indicates that the tumor is deficient in blood. The rate of growth of these tumors is slow, resulting in less severe internal cystic necrosis. Glioma, especially HGG, is characterized by the high blood supply and rapid growth of tumor cells. The release of the cystic swelling factor (from the tumor cells) can result in a significant extent of cystic necrosis of the tumor tissues. The special anatomical position of some PCNSLs results in an adequate extent of blood supply. Under these conditions, the manifestations are complex and diverse. Hence, atypical MRI signals are obtained. The signals corresponding to PCNSL overlap with the atypical signals corresponding to glioma. Hence, it is difficult to accurately identify the two types of tumors using conventional MRI techniques. In recent years, the DWI method has been widely used in clinical settings as a non-invasive, rapid, and reproducible quantitative evaluation method to identify benign tumors, determine the degree of malignancy, and evaluate cell density.
Diffusion-weighted imaging is a non-invasive MRI-based functional imaging method that can be used to observe the microscopic dispersion state of water molecules present in tissues. The method can also be used for quantitative analysis in association with the ADC value. The ADC value can be used to eliminate the effects of the T2 penetration effect, diffusion sensitivity gradient, and other factors. This value efficiently and accurately quantifies the dispersion ability of the water molecules present in tumor tissues (35). ADC can quantitatively reflect the density and malignancy of tumor cells. In the past, most studies have used the average ADC of tumor parenchyma for comparison, but there is heterogeneity due to the different degrees of internal differentiation of tumor tissues. Only a single average ADC index cannot truly and accurately reflect the biological behavior and malignancy of tumors. In addition, results from the subgroup analysis also suggested that the sensitivity achieved using the ADCmin and ADCmean values decreased significantly, while the sensitivity and specificity achieved using the ADC ratio increased. This further indicated that the ADC ratio could be effectively used to eliminate the influence of microcirculation injection and white matter fiber dispersion in different directions. It can also help increase the degree of comparability between different individuals and reduce systematic error. Therefore, a more comprehensive and effective performance should be achieved before the method is applied in clinical settings. A universal ADC value and specific ADC parameters to set the cut-off values are yet to be identified. The cut-off value for ADC varies from study to study. We should comprehensively analyze the images recorded for the patient to determine the specific ADC cut-off value. It has been reported that although large non-tumor parenchymal areas can be avoided to measure the average ADC values corresponding to tumor parenchyma, microcapsule formation, microcalcification, and bleeding in tumor parenchymal areas (potentially resulting in the deviation in the average ADC values) cannot be avoided in the region of interest. This hinders the reflection of tumor micropathology (28).
Previously reported results that were obtained by conducting meta-analyses have been combined and analyzed for the accurate identification of PCNSL and glioma using the MRI technique. For example, a meta-analysis conducted with 598 participants (pooled from 14 studies) revealed that the perfusion-weighted imaging (PWI) method could be effectively used to distinguish between HGG and PCNSL. The results were highly accurate (pooled AUC: 0.9415). The dynamic susceptibility contrast (DSC) value is potentially the best index that can be used to distinguish between HGG and PCNSL (36). Results from a meta-analysis involving 704 participants (pooled over 13 studies) revealed the absence of a significant difference in AUC [between DSC and susceptibility-weighted imaging (SWI)]. The Z-test was conducted, and the combined results suggested that a high and similar rate of diagnostic accuracy could be achieved using the DSC-MRI and SWI techniques. Thus, these methods could be effectively used to distinguish between HGG and PCNSL (37). Researchers have also conducted meta-analyses using the DWI technique to identify the two types of tumors. All eight studies were conducted on a total of 461 patients. The results obtained confirmed that the DWI method could be effectively used to accurately identify the two types of tumors. However, significant heterogeneity was observed, and the combined sensitivity, specificity, and other indicators were lower than those reported by us (38).
The 18F-fluorodeoxyglucose (FDG)-positron emission tomography/computed tomography (PET/CT) technique can be used to simultaneously reflect the anatomical and metabolic information of the focus. The use of the PET/CT technique can result in a significant increase in the diagnostic accuracy achieved for the central nervous system lymphoma (39). Uchinomura S et al. retrospectively analyzed the PET/CT scanning results of 13 patients with PCNSL and 62 patients with glioblastoma before they were subjected to treatment methods. It was found that the diagnostic AUC value of PETCT could be as high as 0.9 (39). A retrospective analysis was carried out by Zhou W et al. They reported that the maximum standardized uptake (SUVmax) value and tumor to normal contralateral cortex activity (T/N) ratio calculated using the PET/CT technique could be used as reliable indices to distinguish between PCNSL and glioblastoma multiforme (40). Currently, an increasing number of studies are being conducted using the machine learning (ML) technique to image brains and distinguish between PCNSL and HGG. Results obtained from a meta-analysis of 8 relevant literature reports suggest that the efficiency of the ML algorithm-based method was at par, or in some cases, better than the efficiency of radiologists. The pooled AUC was approximately 0.9 (41).
There are several limitations of the studies. First, the sample sizes in some of the literature reports considered for the studies were <50, and most of the studies were reported by researchers working in Asia. These factors also result in heterogeneity. Second, we included retrospective studies to conduct our studies, and prospective studies were not considered. In retrospective studies, it is difficult to avoid selection bias. It is also difficult to determine the time sequence of exposure and disease. The authenticity of information is debatable, and all these factors affect the accuracy of the final results. Third, it is better to establish a unified method using the DWI method as the differences in the imaging parameters, fluctuations in the field strength, and differences in the efficiencies of the post-processing software used may result in the generation of inaccurate ADC values. Thus, the result can potentially be affected.
Conclusion
The results obtained by conducting the meta-analysis reveal that the DWI method is characterized by high sensitivity, specificity, and diagnostic accuracy. This method can be effectively used to distinguish between PCNSL and HGG. It is suggested that samples of patients suffering from PCNSL and HGG should be analyzed using the DWI to effectively distinguish between the two types of tumors as soon as possible. Further research on the diagnostic performance of DWI requires more well-designed and prospective studies involving a larger number of patients.
Data Availability Statement
The original contributions presented in the study are included in the article/Supplementary Material, further inquiries can be directed to the corresponding author.
Author Contributions
XD and YH conceived and designed the study, acquired and analyzed the data, and wrote the manuscript. WL contributed to data analysis and manuscript preparation. All authors read and approved the manuscript and agree to be accountable for all aspects of the research in ensuring that the accuracy or integrity of any part of the work is appropriately investigated and resolved.
Conflict of Interest
The authors declare that the research was conducted in the absence of any commercial or financial relationships that could be construed as a potential conflict of interest.
Publisher's Note
All claims expressed in this article are solely those of the authors and do not necessarily represent those of their affiliated organizations, or those of the publisher, the editors and the reviewers. Any product that may be evaluated in this article, or claim that may be made by its manufacturer, is not guaranteed or endorsed by the publisher.
Acknowledgments
We thank Bullet Edits Limited for the linguistic editing and proofreading of the manuscript.
Supplementary Material
The Supplementary Material for this article can be found online at: https://www.frontiersin.org/articles/10.3389/fneur.2022.882334/full#supplementary-material
Supplementary Figure 1. A funnel plot representing the publication bias.
Supplementary Table 1. The results of study quality and bias judged by the Newcastle-Ottawa Scale (NOS) checklist.
References
1. Fox CP, Phillips EH, Smith J, Linton K, Gallop-Evans E, Hemmaway C, et al. Guidelines for the diagnosis and management of primary central nervous system diffuse large B-cell lymphoma. Br J Haematol. (2019) 184:348–63. doi: 10.1111/bjh.15661
2. Chukwueke UN, Nayak L. Central nervous system lymphoma. Hematol Oncol Clin North Am. (2019) 33:597–611. doi: 10.1016/j.hoc.2019.03.008
3. Alcantara M, Fuentealba J, Soussain C. Emerging landscape of immunotherapy for primary central nervous system lymphoma. Cancers (Basel). (2021) 13:5061. doi: 10.3390/cancers13205061
4. Chukwueke U, Grommes C, Nayak L. Primary central nervous system lymphomas. Hematol Oncol Clin North Am. (2022) 36:147–59. doi: 10.1016/j.hoc.2021.09.004
5. Chen R, Smith-Cohn M, Cohen AL, Colman H. Glioma subclassifications and their clinical significance. Neurotherapeutics. (2017) 14:284–97. doi: 10.1007/s13311-017-0519-x
6. Lima J, Mehta T, Datta N, Bakradze E, Staff I, Beland D, et al. Migraine history: a predictor of negative diffusion-weighted imaging in IV-tPA-treated stroke mimics. J Stroke Cerebrovasc Dis. (2019) 28:104282. doi: 10.1016/j.jstrokecerebrovasdis.2019.06.040
7. Wang QP, Lei DQ, Yuan Y, Xiong NX. Accuracy of ADC derived from DWI for differentiating high-grade from low-grade gliomas: systematic review and meta-analysis. Medicine (Baltimore). (2020) 99:e19254. doi: 10.1097/MD.0000000000019254
8. Whiting PF, Rutjes AW, Westwood ME, Mallett S, Deeks JJ, Reitsma JB, et al. QUADAS-2: a revised tool for the quality assessment of diagnostic accuracy studies. Ann Intern Med. (2011) 155:529–36. doi: 10.7326/0003-4819-155-8-201110180-00009
9. Vogelgesang F, Schlattmann P, Dewey M. The evaluation of bivariate mixed models in meta-analyses of diagnostic accuracy studies with SAS, Stata and R. Methods Inf Med. (2018) 57:111–9. doi: 10.3414/ME17-01-0021
10. Cohen JF, Chalumeau M, Cohen R, Korevaar DA, Khoshnood B, Bossuyt PM. Cochran's Q test was useful to assess heterogeneity in likelihood ratios in studies of diagnostic accuracy. J Clin Epidemiol. (2015) 68:299–306. doi: 10.1016/j.jclinepi.2014.09.005
11. Zamora J, Abraira V, Muriel A, Khan K, Coomarasamy A. Meta-DiSc: a software for meta-analysis of test accuracy data. BMC Med Res Methodol. (2006) 6:31. doi: 10.1186/1471-2288-6-31
12. Deeks JJ, Macaskill P, Irwig L. The performance of tests of publication bias and other sample size effects in systematic reviews of diagnostic test accuracy was assessed. J Clin Epidemiol. (2005) 58:882–93. doi: 10.1016/j.jclinepi.2005.01.016
13. Toh CH, Castillo M, Wong AM, Wei KC, Wong HF, Ng SH, et al. Primary cerebral lymphoma and glioblastoma multiforme: differences in diffusion characteristics evaluated with diffusion tensor imaging. AJNR Am J Neuroradiol. (2008) 29:471–5. doi: 10.3174/ajnr.A0872
14. Doskaliyev A, Yamasaki F, Ohtaki M, Kajiwara Y, Takeshima Y, Watanabe Y, et al. Lymphomas and glioblastomas: differences in the apparent diffusion coefficient evaluated with high b-value diffusion-weighted magnetic resonance imaging at 3T. Eur J Radiol. (2012) 81:339–44. doi: 10.1016/j.ejrad.2010.11.005
15. Yamashita K, Yoshiura T, Hiwatashi A, Togao O, Yoshimoto K, Suzuki SO, et al. Differentiating primary CNS lymphoma from glioblastoma multiforme: assessment using arterial spin labeling, diffusion-weighted imaging, and 18F-fluorodeoxyglucose positron emission tomography. Neuroradiology. (2013) 55:135–43. doi: 10.1007/s00234-012-1089-6
16. Ahn SJ, Shin HJ, Chang JH, Lee SK. Differentiation between primary cerebral lymphoma and glioblastoma using the apparent diffusion coefficient: comparison of three different ROI methods. PLoS ONE. (2014) 9:e112948. doi: 10.1371/journal.pone.0112948
17. Nakajima S, Okada T, Yamamoto A, Kanagaki M, Fushimi Y, Okada T, et al. Primary central nervous system lymphoma and glioblastoma: differentiation using dynamic susceptibility-contrast perfusion-weighted imaging, diffusion-weighted imaging, and (18)F-fluorodeoxyglucose positron emission tomography. Clin Imaging. (2015) 39:390–5. doi: 10.1016/j.clinimag.2014.12.002
18. Ko CC, Tai MH, Li CF, Chen TY, Chen JH, Shu G, et al. Differentiation between glioblastoma multiforme and primary cerebral lymphoma: additional benefits of quantitative diffusion-weighted MR imaging. PLoS ONE. (2016) 11:e0162565. doi: 10.1371/journal.pone.0162565
19. Li D, Li Z. Value of conventional MR and diffusion weighted imaging in differentiating primary central nervous system lymphoma and glioblastoma. Int Med Health Guidance News. (2016) 23:2906–9.
20. Lin X, Lee M, Buck O, Woo KM, Zhang Z, Hatzoglou V, et al. Diagnostic Accuracy of T1-Weighted Dynamic Contrast-Enhanced-MRI and DWI-ADC for Differentiation of Glioblastoma and Primary CNS Lymphoma. AJNR Am J Neuroradiol. (2017) 38:485–91. doi: 10.3174/ajnr.A5023
21. Lu S, Wang S, Gao Q, Zhou M, Li Y, Cao P, et al. Quantitative evaluation of diffusion and dynamic contrast-enhanced magnetic resonance imaging for differentiation between primary central nervous system lymphoma and glioblastoma. J Comput Assist Tomogr. (2017) 41:898–903. doi: 10.1097/RCT.0000000000000622
22. Luo L, Ren C, Zhang Y, Cheng J, Wang W, Gao X. Analysis of histogram of T2WI, ADC and enhanced T1WI in the differential diagnosis of pimary central nervous system lymphoma and glioblastoma. Radiol Practice. (2018) 33:658–63.
23. Xue X, Zhang J, Yang R, Liu Y, Li J, Han T. Valuation of combination use of single voxel long echo 1H-MRS and ADC in distinguishing primary central nervous system lymphoma from high grade gliomas. J Clin Radiol. (2019) 38:2194–9.
24. Anwar S, Baig MZ, Laghari AA, Mubarak F, Shamim MS, Jilani UA, et al. Accuracy of apparent diffusion coefficients and enhancement ratios on magnetic resonance imaging in differentiating primary cerebral lymphomas from glioblastoma. Neuroradiol J. (2019) 32:328–34. doi: 10.1177/1971400919857556
25. Zhang S, Wang J, Wang K, Li X, Zhao X, Chen Q, et al. Differentiation of high-grade glioma and primary central nervous system lymphoma: multiparametric imaging of the enhancing tumor and peritumoral regions based on hybrid (18)F-FDG PET/MRI. Eur J Radiol. (2022) 150:110235. doi: 10.1016/j.ejrad.2022.110235
26. Eisenhut F, Schmidt MA, Putz F, Lettmaier S, Fröhlich K, Arinrad S, et al. Classification of primary cerebral lymphoma and glioblastoma featuring dynamic susceptibility contrast and apparent diffusion coefficient. Brain Sci. (2020) 10:886. doi: 10.3390/brainsci10110886
27. Mehrnahad M, Rostami S, Kimia F, Kord R, Taheri MS, Rad HS, et al. Differentiating glioblastoma multiforme from cerebral lymphoma: application of advanced texture analysis of quantitative apparent diffusion coefficients. Neuroradiol J. (2020) 33:428–36. doi: 10.1177/1971400920937382
28. Geng L, Sun Y, Zhao Y, Wan J, Xu L, Ye Y, et al. Application of ADC values and rADC values in the diagnosis and differentiation of primary central nervous system lymphoma and its correlation with Ki-67. J Pract Med. (2021) 37:2530–4.
29. Eyüboglu I, Çakir IM, Aslan S, Sari A. Diagnostic efficacy of apparent diffusion coefficient measurements in differentiation of malignant intra-axial brain tumors. Turk J Med Sci. (2021) 51:256–67. doi: 10.3906/sag-2006-1
30. Ozturk K, Soylu E, Cayci Z. Differentiation between primary CNS lymphoma and atypical glioblastoma according to major genomic alterations using diffusion and susceptibility-weighted MR imaging. Eur J Radiol. (2021) 141:109784. doi: 10.1016/j.ejrad.2021.109784
31. Chiavazza C, Pellerino A, Ferrio F, Cistaro A, Soffietti R, Rudà R. Primary CNS lymphomas: challenges in diagnosis and monitoring. Biomed Res Int. (2018) 2018:3606970. doi: 10.1155/2018/3606970
32. Küker W, Nägele T, Korfel A, Heckl S, Thiel E, Bamberg M, et al. Primary central nervous system lymphomas (PCNSL): MRI features at presentation in 100 patients. J Neurooncol. (2005) 72:169–77. doi: 10.1007/s11060-004-3390-7
33. Almansory KO, Fraioli F. Combined PET/MRI in brain glioma imaging. Br J Hosp Med (Lond). (2019) 80:380–6. doi: 10.12968/hmed.2019.80.7.380
34. Chakhoyan A, Yao J, Leu K, Pope WB, Salamon N, Yong W, et al. Validation of vessel size imaging (VSI) in high-grade human gliomas using magnetic resonance imaging, image-guided biopsies, and quantitative immunohistochemistry. Sci Rep. (2019) 9:2846. doi: 10.1038/s41598-018-37564-w
35. Gatidis S, Schmidt H, Martirosian P, Nikolaou K, Schwenzer NF. Apparent diffusion coefficient-dependent voxelwise computed diffusion-weighted imaging: an approach for improving SNR and reducing T2 shine-through effects. J Magn Reson Imaging. (2016) 43:824–32. doi: 10.1002/jmri.25044
36. Xu W, Wang Q, Shao A, Xu B, Zhang J. The performance of MR perfusion-weighted imaging for the differentiation of high-grade glioma from primary central nervous system lymphoma: a systematic review and meta-analysis. PLoS ONE. (2017) 12:e0173430. doi: 10.1371/journal.pone.0173430
37. Wu Y, Den Z, Lin Y. Accuracy of susceptibility-weighted imaging and dynamic susceptibility contrast magnetic resonance imaging for differentiating high-grade glioma from primary central nervous system lymphomas: meta-analysis. World Neurosurg. (2018) 112:e617–e623. doi: 10.1016/j.wneu.2018.01.098
38. Lu X, Xu W, Wei Y, Li T, Gao L, Fu X, et al. Diagnostic performance of DWI for differentiating primary central nervous system lymphoma from glioblastoma: a systematic review and meta-analysis. Neurol Sci. (2019) 40:947–56. doi: 10.1007/s10072-019-03732-7
39. El-Galaly TC, Villa D, Gormsen LC, Baech J, Lo A, Cheah CY. FDG-PET/CT in the management of lymphomas: current status and future directions. J Intern Med. (2018) 284:358–76. doi: 10.1111/joim.12813
40. Zhou W, Wen J, Hua F, Xu W, Lu X, Yin B, et al. (18)F-FDG PET/CT in immunocompetent patients with primary central nervous system lymphoma: differentiation from glioblastoma correlation with DWI. Eur J Radiol. (2018) 104:26–32. doi: 10.1016/j.ejrad.2018.04.020
Keywords: diffusion-weighted imaging, meta-analysis, lymphoma, diagnosis, high-grade glioma
Citation: Du X, He Y and Lin W (2022) Diagnostic Accuracy of the Diffusion-Weighted Imaging Method Used in Association With the Apparent Diffusion Coefficient for Differentiating Between Primary Central Nervous System Lymphoma and High-Grade Glioma: Systematic Review and Meta-Analysis. Front. Neurol. 13:882334. doi: 10.3389/fneur.2022.882334
Received: 23 February 2022; Accepted: 27 May 2022;
Published: 24 June 2022.
Edited by:
Sandro M. Krieg, Technical University of Munich, GermanyReviewed by:
Constantin-Cristian Topriceanu, University College London, United KingdomNa Li, Shandong Cancer Hospital, China
Copyright © 2022 Du, He and Lin. This is an open-access article distributed under the terms of the Creative Commons Attribution License (CC BY). The use, distribution or reproduction in other forums is permitted, provided the original author(s) and the copyright owner(s) are credited and that the original publication in this journal is cited, in accordance with accepted academic practice. No use, distribution or reproduction is permitted which does not comply with these terms.
*Correspondence: Wei Lin, bGlud2VpX2ltYWdlQHNpbmEuY29t