 Adeel S. Zubair
 Sharfaraz Salam
 Mazen M. Dimachkie
 Pedro M. Machado
 Bhaskar Roy
- 1Division of Neuromuscular Diseases, Department of Neurology, Yale University School of Medicine, New Haven, CT, United States
- 2Department of Neuromuscular Diseases, UCL Queen Square Institute of Neurology, University College London, London, United Kingdom
- 3Department of Neurology, The University of Kansas Medical Center, Kansas City, KS, United States
- 4Centre for Rheumatology, Division of Medicine, University College London, London, United Kingdom
Idiopathic inflammatory myopathies (IIMs) are a group of acquired muscle diseases with muscle inflammation, weakness, and other extra-muscular manifestations. IIMs can significantly impact the quality of life, and management of IIMs often requires a multi-disciplinary approach. Imaging biomarkers have become an integral part of the management of IIMs. Magnetic resonance imaging (MRI), muscle ultrasound, electrical impedance myography (EIM), and positron emission tomography (PET) are the most widely used imaging technologies in IIMs. They can help make the diagnosis and assess the burden of muscle damage and treatment response. MRI is the most widely used imaging biomarker of IIMs and can assess a large volume of muscle tissue but is limited by availability and cost. Muscle ultrasound and EIM are easy to administer and can even be performed in the clinical setting, but they need further validation. These technologies may complement muscle strength testing and laboratory studies and provide an objective assessment of muscle health in IIMs. Furthermore, this is a rapidly progressing field, and new advances are going to equip care providers with a better objective assessment of IIMS and eventually improve patient management. This review discusses the current state and future direction of imaging biomarkers in IIMs.
Introduction
Idiopathic inflammatory myopathies (IIMs) are a heterogeneous group of acquired muscle diseases characterized by muscle inflammation, weakness, and other extra-muscular manifestations (1–4). Classically, the IIMs were sub-grouped into dermatomyositis (DM), polymyositis (PM), and inclusion body myositis (IBM) (5). Increasing evidence suggesting that myositis-specific antibodies (MSA) can help define subgroups of patients with different phenotypes, prognosis, and response to treatment has favored the development of a new classification system that groups IIMs into DM, IBM, immune-mediated necrotizing myopathy (IMNM), and antisynthetase syndrome (ASS) (6). All IIMs, except for most IBM cases, usually present with acute or subacute symmetric proximal weakness. IBM typically presents with insidious onset asymmetric quadriceps muscle weakness with frequent long finger flexors involvement; patients often develop dysphagia (7, 8). Patients with DM have characteristic skin changes such as periorbital edema and erythema (heliotrope rash), and Gottron papules on the dorsum of hands and fingers. The later rash overlaps can also be seen in the ASS.
Disease severity of IIMs can vary, and patient quality of life can be significantly impaired (1, 2). The management of IIMs is challenging and requires a multi-disciplinary team including rheumatologists, neuromuscular specialists, dermatologists, physical, occupational, and speech therapists, pulmonologists, and cardiologists. The role of imaging technologies in the diagnosis, assessing disease activity and treatment response, and monitoring disease progression of the IIMs is increasingly being recognized. The objective nature of these technologies can complement the available outcome measures and will facilitate future clinical trials. In this study, we review the application of imaging technologies as an objective biomarker of IIMs, their limitations, and future directions.
Methods
A PubMed search was done for the terms “myositis and biomarkers,” “MRI and myositis,” “electrical impedance myography and myositis,” and “ultrasound and myositis” for all English language literature until 14 February 2023. Overall, this resulted in a total of 2,672 results which were then screened by AZ for applicability to this topic. This resulted in 199 publications that were reviewed for this study (Supplementary Figure 1).
Magnetic resonance imaging
Magnetic resonance imaging (MRI) has been used to assess muscle involvement in myositis for over three decades (Figure 1), and it is the imaging modality of choice for the evaluation and follow-up of muscle changes in myositis patients. MRI can distinguish between active muscle inflammation vs. chronic muscle damage and is a tool to optimize sample selection for muscle biopsies (Figure 2) (9, 10). Additionally, MRI patterns of muscle involvement can help distinguish between IIMs such as DM/PM and IBM.
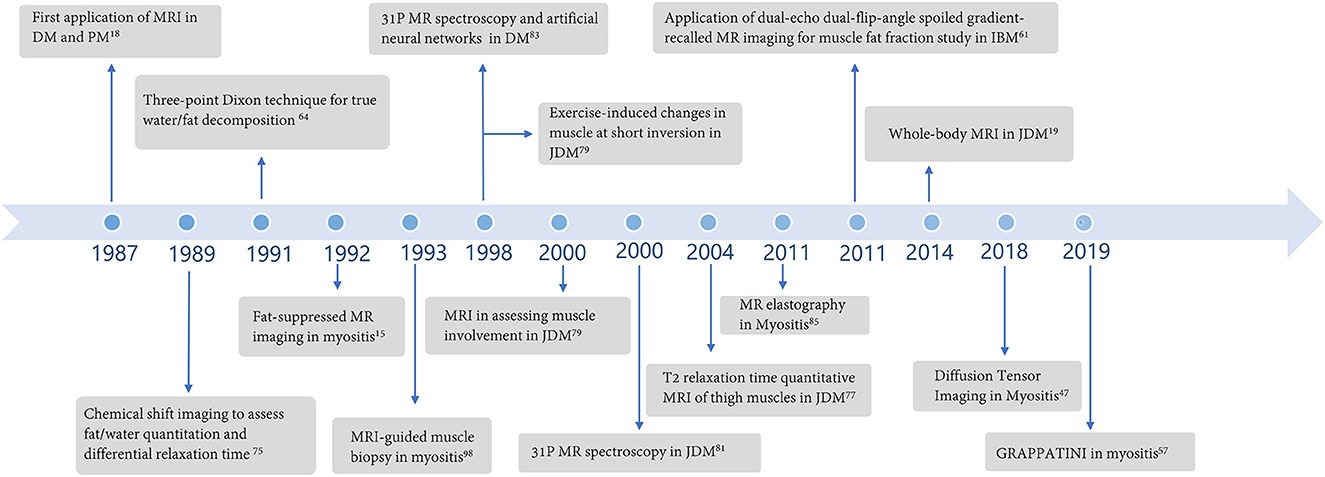
Figure 1. Major developments regarding the application of magnetic resonance imaging in idiopathic inflammatory myopathies over the years.
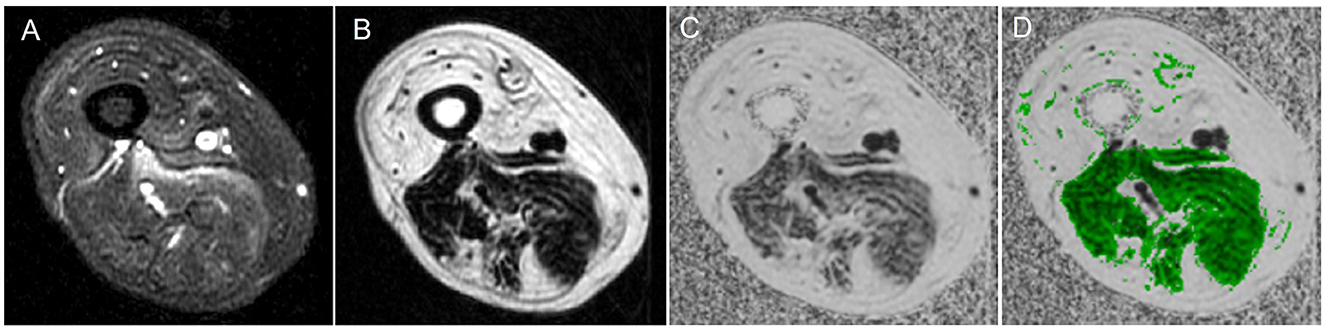
Figure 2. Magnetic resonance imaging of muscle showing water vs. fat image and a fat fraction map. (A) Water image, (B) fat image, (C) fat fraction map, and (D) fat fraction map with muscle region overlaid.
MRI characteristics of normal muscles
Normal, healthy muscle generates an intermediate signal intensity, slightly higher than water and much lower than fat using T1 weighted image sequences. On the contrary, T2-weighted sequences generate a much lower signal for healthy muscle in comparison to fat and water (11, 12). With short-tau inversion recovery sequences (STIR) or fat-suppressed T2-weighted sequences, normal muscle signal intensity is lower than the signal intensity of pure/free water molecules but higher than pure/free fat molecules (12–15). Usually, fat replacement is better captured by T1-weighted images, while muscle edema is better detected with STIR or fat-suppressed T2 images.
MRI captures a wide area of muscle and provides more detailed information than computed tomography and muscle ultrasound. Moreover, it can identify changes in the deep muscles which can be particularly challenging with muscle ultrasound and electromyography. Thus, MRI is particularly helpful for the identification of muscle involvement patterns that can be used to distinguish between IIMs and myopathies in general.
MRI changes in IIMs
In myositis, there is muscle edema in the early stage of active muscle disease and muscle atrophy and fatty replacement in the later stages of muscle damage which alters the normal MRI signal of muscles. However, in some cases, both can co-exist (16, 17). The initial study by Kaufman et al. (18) showed higher T1 signal intensity, atrophy, and fat replacement in active DM and PM. Edema is noted in the early stage of myositis even in the absence of clinical weakness and with normal creatine kinase (CK) (18, 19). MRI is ~80%−90% sensitive in showing muscle edema in active myositis (13, 20). Studies from juvenile DM showed that 76%−97% of patients will have muscle edema on MRI (21, 22). A study showed that 56% of patients with active DM, and 15% of patients with PM can have muscle edema on MRI even without any elevation of CK level. The pattern of muscle edema in DM and PM can vary; edema is usually diffuse in PM and patchy and ill-defined in DM. Moreover, edema can spread to subcutaneous tissue and fascia in DM (19, 23).
The pattern of muscle involvement can be helpful to distinguish between IIMs (24–27). In PM, inflammatory changes, reflected as edema, are symmetric and affect proximal upper and lower extremity muscles. Usually, the adductor group of muscles is more involved in PM, whereas DM frequently involves the quadriceps (9, 28, 29). On the contrary, MRI findings in sporadic IBM patients are more extensive in the lower extremities and are usually asymmetric; however, inflammatory changes are seen in all affected muscles and prevalent at all stages of the disease (16, 28, 30–32). Typically, findings are more severe in distal muscles, and fat infiltration is a frequent pathologic finding in patients with IBM (31). The anterior compartment of thigh muscles is usually more affected, but the rectus femoris is relatively spared (16, 31). Relative sparing of pelvic muscles can be seen. Among the distal muscles, the medial gastrocnemius is usually the most affected (16, 31). The fat infiltration in the individual muscles of these patients is heterogeneous in terms of the proximal-to-distal gradient, and the severity of fat infiltration correlated with worse clinical scores (32). Edema and atrophy have been reported to be present together in both PM and IBM (28). Undulating fascia sign is the presence of wavy fascia between the severe atrophic and fat-infiltrated vastus muscles commonly seen in IBM. Undulating fascia sign is associated with more severe disease and poor clinical outcomes. However, this sign is not specific to IBM and can be seen in conditions with severe atrophy and fat infiltration of quadriceps including advanced PM (28, 31).
Patients with IMNM often have severe lower limb muscle edema with fatty replacement and atrophy, and pelvic muscles and adductors are usually more affected than patients with DM (33). Patients with ASS often have significant subcutaneous tissue edema and relative sparing of adductor muscle, which is similar to DM but distinct from IMNM (24). Despite some similar findings with DM, patients with ASS may have less symmetric involvement and more common myofascial edema of tensor fascial lata (24).
Apart from the standard T1 and T2 (or STIR), other MRI sequences also can provide valuable information on muscle health in myositis. Diffusion-weighted imaging (DWI) measures the mobility of free water in the living tissue; areas of increased free water content result in increased diffusivity, and apparent diffusion coefficient (ADC), an index of diffusivity, is higher in these regions and can identify muscle edema that is comparable to STIR (34). Apparent diffusion coefficient (ADC) values in patients with myositis increased in affected muscles compared to that of normal muscles (35–38).
Muscle edema and fat deposition are not unique to IIM and can be seen in denervation changes (including disorders of the motor neurons), neoplasm, infection, and muscle injury (20, 39–44). Differentiating neurogenic changes from IIMs can sometimes be difficult. The overall pattern of muscle involvement and comparing it to “classic” forms of IIMs can be helpful (42). Muscle MRI can be useful as a clinical tool to identify a pattern (with a sensitivity to detect selective patterns in the rigidity of the spine in relation to the genetic diagnosis reported as 0.9) (45). Furthermore, the identification of muscle “islands” or small areas of muscle tissue with normal signal intensity surrounded by areas with intensity similar to subcutaneous fat on imaging is usually associated with neurogenic etiology (42, 46).
Other MRI sequences for evaluation of IIMs
Diffusion tensor imaging (DTI) evaluates the anisotropic diffusion of water molecules which can help characterize physiological and microstructural properties of skeletal muscles and architectural organization (47–49). DM patients have lower pseudo-diffusion and volume in quadriceps muscles. Moreover, static dynamic diffusion imaging metrics correlated with T1/T2 scores (50). However, in another study, the mean apparent diffusion coefficient was higher in patients with DM, but no significant difference in fractional anisotrophy was noted between edematous and normal muscles. Traditional DTI has limitations including a reduced signal-to-noise ratio (SNR) on DTI images and prolonged study time (47–49). Discrepancies in DTI measures can be due to many issues, potentially including unsatisfactory fat suppression. Simultaneous multi-slice (SMS) accelerated echo planar imaging (EPI) DTI which combines simultaneous excitation of multiple slices during acquisition and spatially encodes their signals in a simultaneous manner can capture fast images and shows lower fractional anisotrophy (47, 51).
The problem of long scanning times is not limited to DTI imaging but also applies to traditional MRI T2 sequences which can take up to 30 min per thigh (52, 53). A new technique based on a multi-echo spin-echo sequence including a reconstruction method that combines model-based accelerated relaxometry by iterative non-linear inversion (MARTINI) with generalized auto-calibrating partial parallel acquisition (GRAPPA) can acquire much faster images (54–56). GRAPPATINI utilizes the characteristics of the two methods and can significantly shorten the acquisition time of T2 mapping (52, 57). However, elevated GRAPPATINI-generated T2 values were seen in some non-edematous muscles which were normal in conventional MRI DM patients (52).
Quantitative MRI
Qualitative assessment of muscles can identify a specific pattern and can help in diagnosis but is subjected to individual biases and may not accurately represent disease progression and treatment response. There has been an unmet need for a more objective measure of muscle damage in IIMs (58, 59).
Semi-quantitative methods use visual assessment by an evaluator who assigns a numerical grade on an ordinal scale. The Mercuri scale, a commonly used semi-quantitative grading score scale, grades muscle images between 0 and 4 (0 being normal muscle and four representing end-stage muscles with severe damage) and was created to mitigate this problem to some extent (60–62). This scale helped in standardizing muscle imaging and is relatively easy to administer, but it is essentially an ordinal scale. Ordinal scales may lack sensitivity and can have subjective bias. A study by Kubinova et al. reported a large variability among different scoring approaches for muscle MRI (12, 63).
Quantitative MRI has the potential to be a useful biomarker in clinical practice and in the context of clinical trials (58). They always use continuous scales to measure muscle changes more precisely. Fat fraction analysis, transverse relaxation time (T2), and magnetization transfer ratio are the commonly used quantitative muscle MRI techniques which is expected to be more accurate than the commonly used manual ordinal grading system (59).
Computer-based analysis of pixel intensity values is a commonly employed quantitative muscle MRI technique (59). Quantitative MRI techniques can determine the functioning muscle area or remaining muscle area (RMA) (16). RMA can be estimated by using the cross-sectional area. A decrease in RMA has been shown to be associated with reduced knee extension strength on myometry in IBM (16).
A 3-Point-Dixon MRI fat-water imaging quantifies tissue fat content on a 0%−100% fat-fraction (FF) scale and has been previously used in neuromuscular diseases (Figure 3) (64–67). In Duchenne muscular dystrophy, Dixon MRI has been shown to be more precise and reliable than visual radiological methods (68). If optimally performed, the magnetization transfer ratio (MTR) excludes lipid contribution, and it is similar to water T2 relaxation time; in that, it also is sensitive to changes in the water distribution (69). In IBM, T2 and MTR showed early changes in muscles before significant intramuscular fat accumulation, providing potential measures of early disease before irreversible changes occurred (70–72). Furthermore, the whole muscle fat fraction increased at the calf level and thigh level in patients with IBM over 1 year, and the changes in fat fraction were more consistent compared to changes in longitudinal T2 and MTR changes (16). In particular, increased lower limb FF was shown to have a negative association with the Medical Research Council Sum score, lower limb components of IBM Functional rating scale (IBM-FRS) score, Rankin score, and 36-Item Short Form Health Survey questionnaire in IBM patients (16, 31, 32).
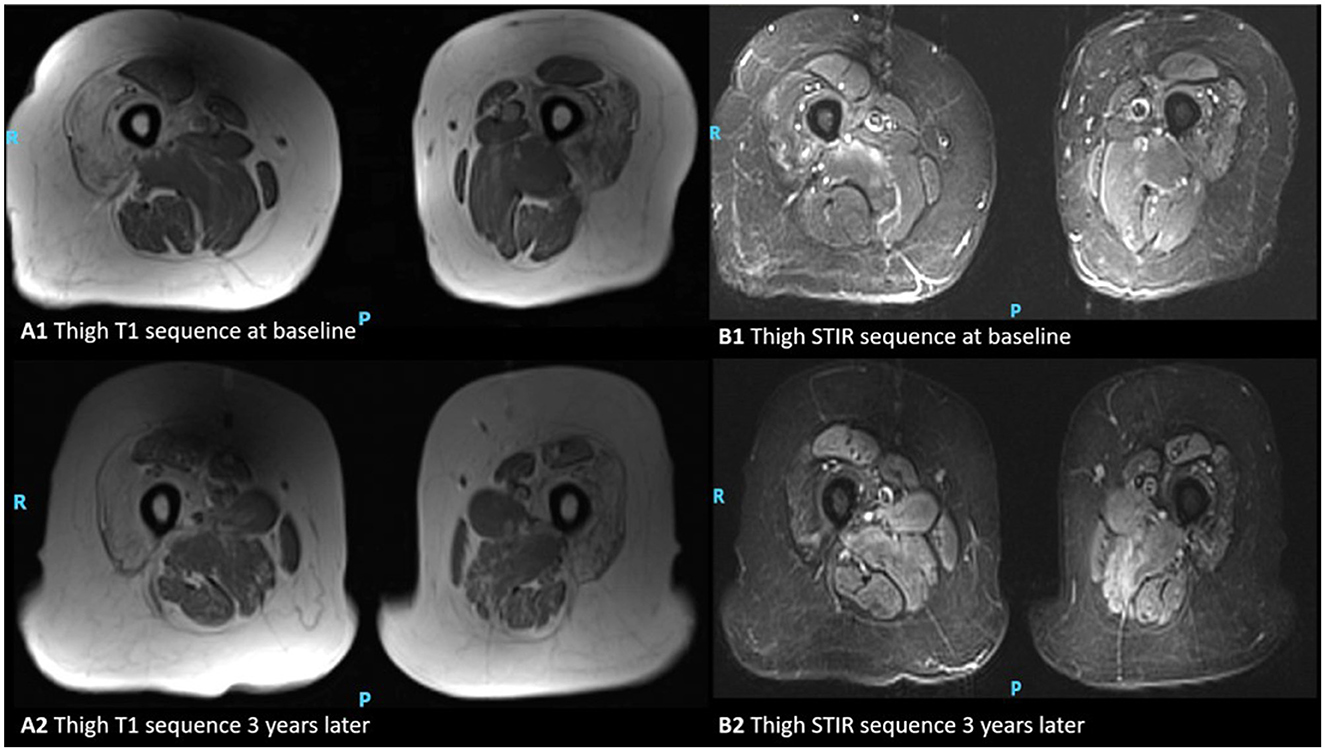
Figure 3. MRI appearances of thigh muscles in a patient with inclusion body myositis. Axial T1-weighted images of the thigh at the baseline and 3 years later (A1, A2), and axial STIR respectively (B1, B2). This figure illustrates progressive intramuscular fat accumulation with initial sparing of the rectus femoris as hyperintensities on T1-weighted sequence and acute muscle inflammation is evident as hyperintensity on STIR images (P, posterior; R, right).
T2 relaxation time has been referenced as a more objective marker to assess muscle disease. T2 relaxation is sensitive to changes in water distribution and lipid content, and it is an objective marker of muscle health. However, fat replacement in advanced IIM can confound the interpretation of muscle T2 values and published T2 values for fat vary significantly (73–76). Combination of MRI estimation of fat fraction with a bi-exponential T2 modeling procedure can result in fat-corrected T2 (fc-T2) maps. Yao et al. published a study showing that application of fc-T2, fat fraction (FF), and muscle T2 to MRI evaluation of IIM disease activity can improve study precision and is amenable to automation (73). In children with JDM, invasive procedures like EMG and muscle biopsy are less frequently used. T2 relaxation times in JDM patients can quantify areas of inflammation and correlate with other measures of disease activity (77–79).
MRI assessing muscle metabolism
Quantification of muscle metabolism by measuring pH and high-energy phosphate metabolites [phosphocreatine, inorganic phosphate, and adenosine triphosphate (ATP)] by phosphorus-31 magnetic resonance spectroscopy (P-MRS) can identify metabolic abnormalities in DM, juvenile dermatomyositis (JDM), and also treatment response (9, 80, 81). Mean ATP and phosphocreatine values are much lower in the thigh muscles of patients with JDM (81). Post-exercise P-MRS indices are impaired in DM with prolonged post-exercise recovery likely related to impaired perfusion (80). In DM, JDM, and PM, these metabolic abnormalities improve with corticosteroid therapy (81–83). On the contrary, patients with IBM have abnormal resting metabolites but normal post-exercise recovery parameters (84). While MRS can be a useful modality that can differentiate between subtypes of IIMs and assess treatment response, it is limited by cost and availability, and still mostly used for research purposes (9, 20, 39).
Magnetic resonance elastography
Magnetic resonance elastography (MRE) can provide an assessment of muscle stiffness based on the propagation of shear waves (85, 86). In a limited sample of patients with PM, DM, and JDM, a statistically significant reduction in MRE imagery was noted when compared to healthy controls in a relaxed state (87).
Whole-body MRI
Whole-body MRI is useful to capture distal and patchy disease activity that was not appreciated clinically and would have been missed by dedicated regional imaging (88). It is becoming particularly popular in pediatric populations with the advent of increasingly efficient MRI scanners (19, 89). Whole-body MRI can also play an important role by potentially detecting occult malignancy in DM and determining if there is a paraneoplastic etiology (9, 90–93). This can be valuable as older DM patients with dysphagia, anti-TIF1γ and anti-NXP2 seropositivity, and cutaneous ulceration have a higher risk of developing cancer (93).
Use of MR imaging in clinical practice
Only limited classification criteria have incorporated MRI as a variable in the classification of IIM (9). Addition of muscle MRI and myositis-specific antibodies have been shown to improve the diagnostic accuracy of the Bohan and Peter criteria as part of the updated Targoff classification (94). Notably, the Targoff criteria from 1997 allowed the incorporation of abnormal MRI in the context of normal CK (9, 95). Muscle MRI is however not part of the current European League Against Rheumatism/American College of Rheumatology (EULAR/ACR) 2017 classification criteria for myositis (4). These are the currently widely accepted myositis classification criteria. An Australian-validated study of the EULAR/ACR 2017 myositis classification criteria showed that adding MRI as a covariate would improve the probability of IIM diagnosis and should be considered as part of a future revision of these criteria (96). However, MRI has also been used to target the best muscle sample for biopsy and to help avoid missing pathological support for the diagnosis (97, 98). In patients with IMNM muscle, MRI is a sensitive biomarker for monitoring disease activity and therapy response. Patients with higher STIR changes at the baseline were more prone to fatty replacement (99). In addition to its use as a guidance tool, some have suggested that imaging should be considered as an alternative to muscle biopsy. This is not a widely accepted approach due to the lack of specificity of signal changes as indicated earlier. In a study comparing muscle biopsy findings with MRI images, it was shown that there was a statistically significant association between the inflammatory infiltrate and both muscle and fascial edema, suggesting that key MRI findings correlate with the main features of DM muscle biopsy making them a potential surrogate marker of disease activity (100). While not as specific for IIM as a muscle biopsy, MRI does have a positive predictive value equivalent to that of biopsy (97 vs. 100%) and a better negative predictive value (64 vs. 38%) (13). As MRI has been shown to be able to assess treatment response, it is intuitive that MRI may guide therapeutic decisions and can be used to determine refractory diseases. However, such a role of MRI is yet to be established and will require a comparison with the commonly employed traditional tools of disease severity scale and clinical assessments.
Limitations of MRI
While MRI is a very useful imaging biomarker of IIM, it has some limitations (Table 1). First, prolonged supine positioning holding a steady position without any extremity movement can be difficult for some patients. Some muscles may be difficult to be quantitively imaged such as the deep finger flexors. Similarly, patients with claustrophobia find MRI unpleasant and often require pre-medication to endure the procedure. Some patients may have implanted devices that are not compatible with MRI. MRI is usually available in the developed countries, but availability can be limited in many parts of the world and the cost of MRI can be significant. Furthermore, we must consider the cumulative cost of serial MRIs to assess disease progression or treatment response in IIMs. Apart from the logistic considerations, one major limitation of MRI is the lack of a widely validated objective scale to assess the extent of muscle disease. Quantification of muscle disease by MRI is challenging due to the variable intensity of characteristic muscle signal changes. Currently, no universally accepted scoring systems for the evaluation of muscle MRI findings exist (59, 63). Newer technologies, such as the three point-Dixon method to quantify fat deposition in muscle is valuable, but such technologies are still used only for research purposes and not widely available for clinicians. Furthermore, these methods depend on specific software-based analysis, and their reproducibility from different scanners is yet to be established. There have been limited attempts of using computer analysis of MRI image pixel values to quantify the degree of disease; however, it was shown that neither the computer algorithm nor visual analysis method was able to separate moderate disease from severe disease. A standardized, validated method for quantifying MRI findings in IIM may help with efficient diagnosis, accurate interpretation of research data, and valid comparisons across studies (17, 63). Machine learning, particularly the use of artificial intelligence with deep learning technology, has shown promising results in IIMs and other muscle disorders and has the potential to address some of the limitations of MRI (101–103).
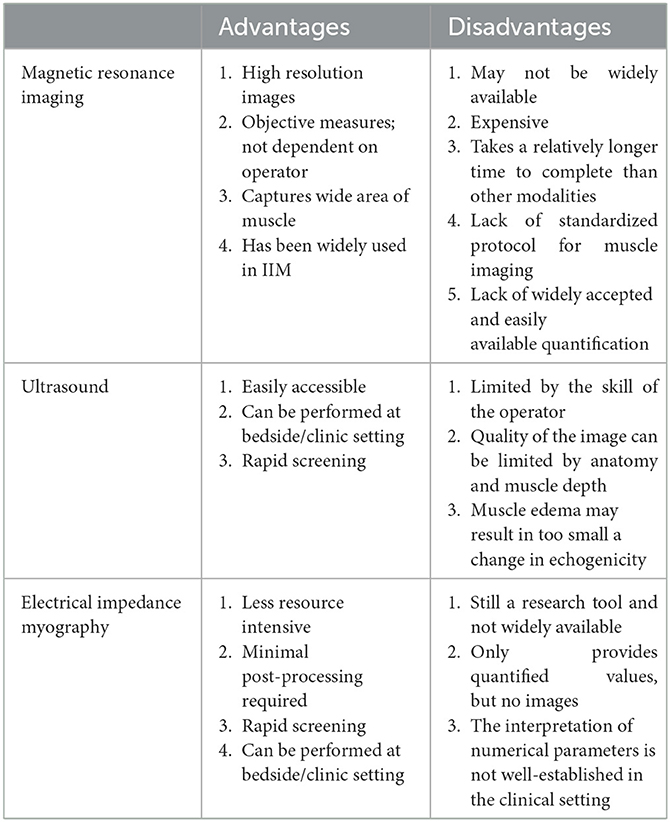
Table 1. Advantages and disadvantages of different imaging technologies.
Ultrasound
Ultrasound imaging of the muscle tissue is becoming an important tool in neuromuscular medicine given its non-invasive nature, ease of use, and improved resolution for soft tissue structures (104–107). Ultrasound was the first imaging technique available for the evaluation of muscle disease. Normal muscle fascicles appear hypoechoic and are separated by echogenic fibro-adipose or perimysial connective tissue. Connective tissue and fat replacement in muscles is seen as increased echogenicity (108–111). Quantitative muscle ultrasound by assessing the gray-scale level (GSL) and quantified back-scatter analysis (QBA) has been found to correlate with functional status and worsening disease (112, 113). Muscle ultrasound is about 80% sensitive in diagnosing IIMs with a positive predictive value of 95% (114, 115).
Different IIMs have typical but non-specific ultrasound features (116, 117). In DM/PM muscle, inflammation and edema indicating disease activity are not well-discriminated by a simple assessment of muscle echo intensity. Muscle edema can lead to low echogenicity, but the change is too small to make a definite diagnosis of edema (118). In general, acute myositis accompanies normal or slightly swollen muscle size with relatively low intensity. However, in juvenile DM, muscle echo intensity has been surprisingly reported to first increase and then normalize in 6/7 successfully treated cases, but the seventh case had echogenicity persistently increased suggesting early fibrosis (119). In chronic stages of myositis where there is fat replacement and fibrosis, higher echo-intensities and decreased muscle thickness are apparent.
IBM has been studied with quantitative muscle ultrasound. Affected muscles show an increased echogenicity on the ultrasound image which indicates the replacement of muscle with fat and fibrosis (120–123). IBM has a specific pattern of muscle involvement that can be used to help distinguish it from other diseases. Increased echogenicity within flexor digitorum profundus (FDP) and medial gastrocnemius is highly supportive of IBM (121, 124). The FDP to flexor carpi ulnaris (FCU) echogenicity contrast, a pattern of higher echo intensity in the FDP than in the FCU, can help in discriminating IBM from DM and amyotrophic lateral sclerosis. Similarly, gastrocnemius echo intensity is significantly different from soleus echo intensity in IBM when compared to DM (121, 125).
Ultrasound has also been used to assess diaphragm thickness in myositis and allows for the assessment of anatomy and function (126). Respiratory muscle involvement is reported in IIMs (127); in IBM, data are limited about prevalence and impact on functional capacity partly due to limited methods of assessing diaphragmatic involvement (128). Ultrasound has been shown to be effective in screening patients with IBM and has shown that diaphragm involvement in IBM is related to disease duration and has detrimental effects on exercise capacity and lung function (128). More recently, studies have also shown utility in the use of ultrasound to assess diaphragm involvement in patients with immune checkpoint inhibitor-related myositis (129).
Musculoskeletal power Doppler ultrasonography (PDUS) has been used to diagnose and measure vascularity in inflammatory disorders. PDUS allows simultaneous assessment of disease activity at more sites than contrast-enhanced MRI (130). A PDUS study in patients with DM and PM showed that increased blood flow was associated with angiogenesis that accompanied fasciitis in patients with DM but not PM, possibly permitting earlier diagnosis of patients with DM (130).
Shear wave elastography (SWE) is an ultrasound-based technique that has been studied in tendinopathy, muscle spasticity, and Duchenne muscular dystrophy (131–135). SWE provides a quantitative measure of tissue stiffness by taking advantage of differences in the relative hardness of soft tissues when an external force is applied to a tissue boundary. Thigh muscle stiffness as measured by SWE was shown in one study to be lower in active IIM patients as compared to healthy controls, and the reduced muscle stiffness was likely associated with muscle weakness and MRI signs of edema and atrophy (136). Recent studies have shown evidence that SWE can have utility as an imaging biomarker that can lend support to IIM diagnosis (137, 138).
Machine learning has been studied on ultrasound in patients with myositis; one study showed that the deep learning approach performed better than conventional machine learning and required no user intervention (118). Newer models are being tested which show promise in the utilization of advanced machine learning processes to help accurately make diagnoses (139).
One additional utility is the use of ultrasound to conduct guided biopsies. Ultrasound can provide images in real time as well as identify abnormal muscle morphology, making it well-suited to target muscle biopsies with improved tissue diagnostic yield. A disadvantage of using ultrasound-guided needle muscle biopsy can be under-sampling when compared to an open biopsy resulting in an inadequate amount of specimens or non-diagnostic tissues.
The are several advantages to muscle ultrasound. It can be performed quickly at the patient bedside and does not require prolonged maintenance of a posture. It is less expensive than muscle MRI. However, despite its convenience and portability, it cannot replace MRI in assessing disease activity in the IIMs at the present state. Part of the issue with ultrasound is that it is limited in its ability to identify edema in comparison to other modalities (26, 140, 141) (Table 1).
Electrical impedance myography
Electrical impedance myography (EIM) is a non-invasive technique that uses subthreshold electrical current to measure the obstruction to current flow (142). It involves the application of a high frequency, low-intensity alternating electrical current via two surface electrodes attached to the skin, and the resultant voltage is measured using a second set of electrodes (143), and usually reactance, resistance, and the phase angle are the measured parameters (142, 144). Changes in the underlying structure and composition of the muscle caused by the progressive disease change alters these parameters (145, 146). Resistance is the measure of the difficulty of passing an electrical current through a tissue and provides a measure of water content. Fat replacement results in higher values. Reactance measures the capacitive nature of myofibers and is diminished with worsening disease severity. Finally, the phase angle (arctan of reactance/resistance) decreases with worsening disease conditions. EIM is less resource intensive than clinical testing modalities; in that, it requires minimal time and training of staff as well as no volitional effort of the patient, and there is little postprocessing required (147).
An animal study of intra-muscular EIM to assess muscle inflammation showed that changes in low-frequency EIM parameters are sensitive to the presence of inflammatory infiltrates and have the potential to serve as a simple means of quantifying the presence and extent of inflammation without the need for biopsy (147). In facioscapulohumeral muscular dystrophy (FSHD), EIM was compared with MRI Dixon and was noted to have a strong correlation with structural MRI features lending to EIM being a potentially useful biomarker in FSHD trials (142). Other human studies in an array of disease states including Duchenne muscular dystrophy, amyotrophic lateral sclerosis (ALS), and spinal muscular atrophy (SMA) have shown that localized impedance measurements over specific muscles can result in clinically valuable data (148–150). Additionally, incorporating measurements of muscle anisotropy, another EIM parameter, can improve the reproducibility of the EIM technique as well as help distinguish myopathic and neurogenic diseases (151, 152). Technological improvements have also assisted in advancing EIM including the creation of a portable system for the assessment of neuromuscular diseases. Studies have indicated that the system was able to obtain measurements of the complex impedance of the muscle tissue rapidly and accurately (143). EIM has been shown to capture muscle inflammation in patients with inflammatory myopathy. EIM phase values from thigh muscles of affected individuals were lower and correlated with muscle strength (153). EIM has also been recently studied in IBM and was shown to detect changes in the muscle health of patients and to correlate with standard functional outcome scales. To complement this cross-sectional study, longitudinal studies are needed to validate EIM as a potential biomarker of IBM.
EIM provides information on muscle health but does not provide information on patient's function and statistical significance does not always clearly translate to clinical significance. EIM has not been used as the sole primary outcome measure in clinical trials but has been used as an exploratory outcome measure in a natural history study of SMA (154, 155). EIM has some advantages over MRI including rapid acquisition and the ability to complete in an outpatient setting. Additionally, it is less expensive than MRI and can be adapted to any muscle allowing for a tailored assessment of disease progression and medication response.
Positron emission tomography
Fluorine-18 (18F)-labeled fluorodeoxyglucose positron emission tomography (FDG PET) is generally used for detecting malignancies; however, FDG also accumulates in inflammatory lesions where glucose-consuming inflammatory cells infiltrate. There have been a few studies looking into the utility of FDG PET in myositis (156). A study of 24 patients with PM/DM demonstrated increased FDG uptake in proximal muscles as compared to controls (33 vs. 2%) (157). Another study looked at the maximum standardized uptake value (SUVmax) in the proximal muscles of all four limbs in patients with PM/DM and showed that the proximal muscle SUV ratio was higher in patients with PM/DM than controls (158). A follow-up study of 33 patients with PM/DM compared with 22 patients with ALS showed that visually-identified FDG (vFDG)-positive regions correlated strongly with mean SUVmax and that when compared to patients with ALS, the mean SUVmax was significantly higher in patients with PM/DM (159).
Amyloid positron emission tomography (amyloid-PET) has been investigated as a diagnostic tool for IBM and differentiates it from other IIMs such as PM (160–162). These studies have used a relatively small number of patients so far. Different amyloid tracers have been employed in these studies; Pittsburgh Compound B ([11C]PIB) and [18F] florbetapir. Lilleker et al. (160) performed the largest PET study to date (10 IBM patients and six PM patients) with [18F] florbetapir tracer. SUV ratios were significantly higher in all regions assessed in IBM patients compared to PM. Amyloid PET tracer uptake has not been shown to be associated with clinical severity in these studies (160, 162).
In patients with DM, FDG PET is also used to screen for malignancy (163). Thus, it can be used to monitor the disease activity while searching for any underlying malignancy. Notably, the role of PET scans in diagnosing and measuring disease activity in patients with interstitial lung disease has yet to be assessed (164).
Discussion
Over the course of the last few years, there have been significant imaging advances which have allowed improved diagnosis as well as better monitoring of treatment response in IIMs. These imaging techniques complement currently available outcome measures and may play a critically important role in future clinical trials.
MRI is the most studied imaging technology in IIMs. It may be used to support a clinically suspected diagnosis when other standard measures are not helpful. Once validated, it can possibly be used longitudinally to assess disease activity and muscle damage more rigorously. While initially only the T1 and T2 weighted sequences were used for assessment, more recent advances have allowed for the development of newer sequences that provide additional information, and there is potential to capture the early stages of myositis prior to the development of lab abnormalities. MRI is sensitive in showing muscle edema and active myositis (16, 17, 28). Quantitative techniques, such as Dixon fat-water imaging (quantifies tissue fat on a scale of 0%−100%) can be more precise and reliable than traditional visual radiographic methods.
Arguments against the use of MR imaging include the fact that it is expensive, may take a long time to complete, and requires prolonged immobility in potentially uncomfortable positions. Over the past few decades, the cost of obtaining MR imaging has decreased significantly, and the availability of MR is more widespread. Additionally, new techniques are offering faster imaging while preserving quality. However, at the present state, MRI may not be sufficient enough to make a diagnosis of IIM. While MRI captures muscle pathology, particularly muscle edema and fat infiltration, as mentioned earlier, none of these changes are specific for muscle inflammation, and similar findings can also be seen in some muscular dystrophies and hereditary myopathies such as Pompe disease (165–167). Today, the most common uses of MR imaging are to help target biopsy sites and to possibly aid in diagnosis in difficult cases. MR imaging has the potential to enable clinicians and researchers to better track disease management and progression. However, the required frequency of MRI images to adequately capture disease progression or the time interval necessary to satisfactorily determine the impact of an intervention remains undetermined. Similarly, whole-body MRI is becoming popular, particularly in the pediatric age group, but whether whole-body MRI has a diagnostic or prognostic advantage over standard MRIs of specific muscles (for example, commonly employed thigh muscles) is yet to be answered. Furthermore, standardization of methods for research use remains a major challenge.
Another tool that is becoming an important part of the myositis specialist arsenal is muscle ultrasound (115). Neuromuscular ultrasound is non-invasive, easy to use, and rapid. It is roughly 80% sensitive in confirming muscle involvement and supporting the clinical diagnosis of an IIM. Neuromuscular ultrasound allows for rapid screening of a good number of muscles in suspected IIM cases in addition to needle electromyography during clinic visits though comparative studies are not available. Additionally, ultrasound can identify abnormal muscle morphology making it well-suited for use in targeting muscle biopsy and possibly enhancing its diagnostic yield. It is also more cost-effective than MR imaging.
Many other technologies, including EIM and PET, have shown promise in the imaging of muscle tissues, and studies are ongoing. Eventually, some of these new technologies will be integrated into the management and tracking of patients with IIMs after further validation as disease biomarkers. We believe that these imaging modalities may result in a paradigm shift in future in the diagnosis and management of the IIMs. Optimized imaging technologies may add another dimension to the tracking of treatment response during the treatment of IIMs. The use of these new technologies may lead to the design of more efficient screening clinical trials with smaller sample sizes and shorter duration which will be invaluable for the treatment of rare diseases like the IIMs.
MRI is the most widely studied imaging technology in IIM, and despite its limitation, it has major advantages over US or EIM (Table 1). Only limited studies have examined the use of US or EIM in myositis, and more data are warranted to define their role in the management of myositis. Both US and EIM are easy to use and cost-effective. They can be regularly employed in the office setting to track disease progression and may also provide complementary information to MRI findings. However, none of them are self-sufficient biomarkers of IIM. A head-to-head comparison study between the imaging technologies is lacking is much warranted.
Conclusion
There have been significant advances in imaging technologies in the past two decades that have impacted the clinical practice and management of patients with IIMs. These evolving technologies have the potential to provide an objective assessment of muscle health once their utility is confirmed in large-scale prospective studies. Eventually, we anticipate that these technologies will be incorporated into a validated paraclinical assessment system that allows for more sensitive tracking of disease activity and treatment response to therapeutic interventions both in the clinic and in the context of therapeutic clinical studies.
Author contributions
AZ reviewed all the abstracts from the initial search results and identified the articles. SS provided some of the imaging used in these manuscripts and contributed to the MRI section of the manuscript writing. MD critically reviewed this manuscript and also updated several sections of the manuscript and developed the table used in this manuscript. BR designed and developed the original draft along with AZ. PM critically reviewed the manuscript and added some sections on MRI imaging and updated the manuscript as needed. All authors contributed to the article and approved the submitted version.
Acknowledgments
The authors would like to thank to Melissa C. Funaro from Harvey Cushing/John Hay Whitney Medical Library, Yale University, for helping us with the search of relevant articles for this manuscript and Dr. Didier Laurent for providing Figure 2.
Conflict of interest
PM has received consulting/speaker's fees from Abbvie, BMS, Celgene, Eli Lilly, Galapagos, Janssen, MSD, Novartis, Orphazyme, Pfizer, Roche, and UCB. MD serves or recently served as a consultant for Abcuro, Amazentis, ArgenX, Astellas, Catalyst, Cello, Covance/Labcorp, CSL-Behring, EcoR1, Janssen, Kezar, MDA, Medlink, Momenta, NuFactor, Octapharma, Priovant, RaPharma/UCB, Roivant Sciences Inc., Sanofi Genzyme, Shire Takeda, Scholar Rock, Spark Therapeutics, Abata/Third Rock, UCB Biopharma, and UpToDate. MD received research grants or contracts or educational grants from Alexion, Alnylam Pharmaceuticals, Amicus, Biomarin, BristolMyers Squibb, Catalyst, Corbus, CSL-Behring, FDA/OOPD, GlaxoSmithKline, Genentech, Grifols, Kezar, Mitsubishi Tanabe Pharma, MDA, NIH, Novartis, Octapharma, Orphazyme, Ra Pharma/UCB, Sanofi Genzyme, Sarepta Therapeutics, Shire Takeda, Spark Therapeutics, The Myositis Association, UCB Biopharma/RaPharma, Viromed/Healixmith, and TMA. BR has served as a consultant for Alexion Pharmaceuticals (now part of AstraZeneca), Takeda Pharmaceuticals, and argenx.
The remaining authors declare that the research was conducted in the absence of any commercial or financial relationships that could be construed as a potential conflict of interest.
Publisher's note
All claims expressed in this article are solely those of the authors and do not necessarily represent those of their affiliated organizations, or those of the publisher, the editors and the reviewers. Any product that may be evaluated in this article, or claim that may be made by its manufacturer, is not guaranteed or endorsed by the publisher.
Supplementary material
The Supplementary Material for this article can be found online at: https://www.frontiersin.org/articles/10.3389/fneur.2023.1146015/full#supplementary-material
Supplementary Figure 1. Literature review and search strategy.
References
1. Carstens PO, Schmidt J. Diagnosis, pathogenesis and treatment of myositis: recent advances. Clin Exp Immunol. (2014) 175:349–58. doi: 10.1111/cei.12194
2. Dalakas MC. Inflammatory muscle diseases. N Engl J Med. (2015) 373:393–4. doi: 10.1056/NEJMc1506827
3. Dimachkie MM, Barohn RJ, Amato AA. Idiopathic inflammatory myopathies. Neurol Clin. (2014) 32:595–628. vii. doi: 10.1016/j.ncl.2014.04.007
4. Lundberg IE, Tjärnlund A, Bottai M, Werth VP, Pilkington C, de Visser M, et al. 2017 European league against rheumatism/american college of rheumatology classification criteria for adult and juvenile idiopathic inflammatory myopathies and their major subgroups. Arthritis Rheumatol. (2017) 69:2271–82. doi: 10.1002/art.40320
5. Lundberg IE, Miller FW, Tjarnlund A, Bottai M. Diagnosis and classification of idiopathic inflammatory myopathies. J Intern Med. (2016) 280:39–51. doi: 10.1111/joim.12524
6. Mariampillai K, Granger B, Amelin D, Guiguet M, Hachulla E, Maurier F, et al. Development of a new classification system for idiopathic inflammatory myopathies based on clinical manifestations and myositis-specific autoantibodies. JAMA Neurol. (2018) 75:1528–37. doi: 10.1001/jamaneurol.2018.2598
7. Dimachkie MM, Barohn RJ. Inclusion body myositis. Neurol Clin. (2014) 32:629–46. vii. doi: 10.1016/j.ncl.2014.04.001
8. Naddaf E, Barohn RJ, Dimachkie MM. Inclusion body myositis: update on pathogenesis and treatment. Neurotherapeutics. (2018) 15:995–1005. doi: 10.1007/s13311-018-0658-8
9. Day J, Patel S, Limaye V. The role of magnetic resonance imaging techniques in evaluation and management of the idiopathic inflammatory myopathies. Semin Arthritis Rheum. (2017) 46:642–9. doi: 10.1016/j.semarthrit.2016.11.001
10. Lassche S, Janssen BH, IJzermans T, Fütterer JJ, Voermans NC, Heerschap A, et al. MRI-guided biopsy as a tool for diagnosis and research of muscle disorders. J Neuromuscul Dis. (2018) 5:315–9. doi: 10.3233/JND-180318
11. May DA, Disler DG, Jones EA, Balkissoon AA, Manaster BJ. Abnormal signal intensity in skeletal muscle at MR imaging: patterns, pearls, and pitfalls. Radiographics. (2000) 20(Spec No):S295–315. doi: 10.1148/radiographics.20.suppl_1.g00oc18s295
12. Kubinova K, Dejthevaporn R, Mann H, Machado PM, Vencovsky J. The role of imaging in evaluating patients with idiopathic inflammatory myopathies. Clin Exp Rheumatol. (2018) 36(Suppl 114):74–81.
13. Fraser DD, Frank JA, Dalakas M, Miller FW, Hicks JE, Plotz P. Magnetic resonance imaging in the idiopathic inflammatory myopathies. J Rheumatol. (1991) 18:1693–700.
14. Paramalingam S, Counsel P, Mastaglia FL, Keen H, Needham M. Imaging in the diagnosis of idiopathic inflammatory myopathies; indications and utility. Expert Rev Neurother. (2019) 19:173–84. doi: 10.1080/14737175.2019.1572507
15. Hernandez RJ, Keim DR, Chenevert TL, Sullivan DB, Aisen AM. Fat-suppressed MR imaging of myositis. Radiology. (1992) 182:217–9. doi: 10.1148/radiology.182.1.1727285
16. Morrow JM, Sinclair CDJ, Fischmann A, Machado PM, Reilly MM, Yousry TA, et al. MRI biomarker assessment of neuromuscular disease progression: a prospective observational cohort study. Lancet Neurol. (2016) 15:65–77. doi: 10.1016/S1474-4422(15)00242-2
17. Pipitone N. Value of MRI in diagnostics and evaluation of myositis. Curr Opin Rheumatol. (2016) 28:625–30. doi: 10.1097/BOR.0000000000000326
18. Kaufman LD, Gruber BL, Gerstman DP, Kaell AT. Preliminary observations on the role of magnetic resonance imaging for polymyositis and dermatomyositis. Ann Rheum Dis. (1987) 46:569–72. doi: 10.1136/ard.46.8.569
19. Malattia C, Damasio MB, Madeo A, Pistorio A, Providenti A, Pederzoli S, et al. Whole-body MRI in the assessment of disease activity in juvenile dermatomyositis. Ann Rheum Dis. (2014) 73:1083–90. doi: 10.1136/annrheumdis-2012-202915
20. Maurer B, Walker UA. Role of MRI in diagnosis and management of idiopathic inflammatory myopathies. Curr Rheumatol Rep. (2015) 17:67. doi: 10.1007/s11926-015-0544-x
21. McCann LJ, Juggins AD, Maillard SM, Wedderburn LR, Davidson JE, Murray KJ, et al. The juvenile dermatomyositis national registry and repository (UK and Ireland)–clinical characteristics of children recruited within the first 5 yr. Rheumatology. (2006) 45:1255–60. doi: 10.1093/rheumatology/kel099
22. Van De Vlekkert J, Maas M, Hoogendijk JE, De Visser M, Van Schaik IN. Combining MRI and muscle biopsy improves diagnostic accuracy in subacute-onset idiopathic inflammatory myopathy. Muscle Nerve. (2015) 51:253–8. doi: 10.1002/mus.24307
23. Kimball AB, Summers RM, Turner M, Dugan EM, Hicks J, Miller FW, et al. Magnetic resonance imaging detection of occult skin and subcutaneous abnormalities in juvenile dermatomyositis. Implications for diagnosis and therapy. Arthritis Rheum. (2000) 43:1866–73. doi: 10.1002/1529-0131(200008)43:8<1866::AID-ANR24>3.0.CO;2-6
24. Zhang W, Zheng Y, Wang Y, Xiong H, Que C, Zhang X, et al. Thigh MRI in antisynthetase syndrome, and comparisons with dermatomyositis and immune-mediated necrotizing myopathy. Rheumatology. (2022) 62:310–20. doi: 10.1093/rheumatology/keac269
25. Malartre S, Bachasson D, Mercy G, Sarkis E, Anquetil C, Benveniste O, et al. MRI and muscle imaging for idiopathic inflammatory myopathies. Brain Pathol. (2021) 31:e12954. doi: 10.1111/bpa.12954
26. Albayda J, Demonceau G, Carlier PG. Muscle imaging in myositis: MRI, US, and PET. Best Pract Res Clin Rheumatol. (2022) 36:101765. doi: 10.1016/j.berh.2022.101765
27. Pilania K, Jankharia B. Role of MRI in idiopathic inflammatory myopathies: a review article. Acta Radiol. (2022) 63:200–13. doi: 10.1177/0284185121990305
28. Dion E, Cherin P, Payan C, Fournet J-C, Papo T, Maisonobe T, et al. Magnetic resonance imaging criteria for distinguishing between inclusion body myositis and polymyositis. J Rheumatol. (2002) 29:1897–906.
29. Zheng Y, Liu L, Wang L, Xiao J, Wang Z, Lv H, et al. Magnetic resonance imaging changes of thigh muscles in myopathy with antibodies to signal recognition particle. Rheumatology. (2015) 54:1017–24. doi: 10.1093/rheumatology/keu422
30. Dahlbom K, Geijer M, Oldfors A, Lindberg C. Association between muscle strength, histopathology, and magnetic resonance imaging in sporadic inclusion body myositis. Acta Neurol Scand. (2019) 139:177–82. doi: 10.1111/ane.13040
31. Guimaraes JB, Zanoteli E, Link TM, de Camargo LV, Facchetti L, Nardo L, et al. Sporadic inclusion body myositis: MRI findings and correlation with clinical and functional parameters. AJR Am J Roentgenol. (2017) 209:1340–7. doi: 10.2214/AJR.17.17849
32. Ansari B, Salort-Campana E, Ogier A, PhD ALT, Marie BD, Guye M, et al. Quantitative muscle MRI study of patients with sporadic inclusion body myositis. Muscle Nerve. (2020) 61:496–503. doi: 10.1002/mus.26813
33. Day JA, Bajic N, Gentili S, Patel S, Limaye V. Radiographic patterns of muscle involvement in the idiopathic inflammatory myopathies. Muscle Nerve. (2019) 60:549–57. doi: 10.1002/mus.26660
34. Faruch M, Garcia AI, Del Amo M, Pomes J, Isern J, González SP, et al. Diffusion-weighted magnetic resonance imaging is useful for assessing inflammatory myopathies. Muscle Nerve. (2019) 59:555–60. doi: 10.1002/mus.26438
35. Meyer H-J, Ziemann O, Kornhuber M, Emmer A, Quäschling U, Schob S, et al. Apparent diffusion coefficient (ADC) does not correlate with different serological parameters in myositis and myopathy. Acta Radiol. (2018) 59:694–9. doi: 10.1177/0284185117731448
36. Fornasa F. Diffusion-weighted magnetic resonance imaging: what makes water run fast or slow? J Clin Imaging Sci. (2011) 1:27. doi: 10.4103/2156-7514.81294
37. Qi J, Olsen NJ, Price RR, Winston JA, Park JH. Diffusion-weighted imaging of inflammatory myopathies: polymyositis and dermatomyositis. J Magn Reson Imaging. (2008) 27:212–7. doi: 10.1002/jmri.21209
38. Ran J, Liu Y, Sun D, Morelli J, Zhang P, Wu G, et al. The diagnostic value of biexponential apparent diffusion coefficients in myopathy. J Neurol. (2016) 263:1296–302. doi: 10.1007/s00415-016-8139-7
39. Ten Dam L, van der Kooi AJ, Verhamme C, Wattjes MP, de Visser M. Muscle imaging in inherited and acquired muscle diseases. Eur J Neurol. (2016) 23:688–703. doi: 10.1111/ene.12984
40. Adams EM, Chow CK, Premkumar A, Plotz PH. The idiopathic inflammatory myopathies: spectrum of MR imaging findings. Radiographics. (1995) 15:563–74. doi: 10.1148/radiographics.15.3.7624563
41. Schedel H, Reimers CD, Vogl T, Witt TN. Muscle edema in MR imaging of neuromuscular diseases. Acta Radiol. (1995) 36:228–32. doi: 10.1177/028418519503600303
42. Kriss A, Jenkins T. Muscle MRI in motor neuron diseases: a systematic review. Amyotroph Lateral Scler Frontotemporal Degener. (2022) 23:161–75. doi: 10.1080/21678421.2021.1936062
43. Klickovic U, Zampedri L, Sinclair CDJ, Wastling SJ, Trimmel K, Howard RS, et al. Skeletal muscle MRI differentiates SBMA and ALS and correlates with disease severity. Neurology. (2019) 93:e895–907. doi: 10.1212/WNL.0000000000008009
44. Cha CH, Patten BM. Amyotrophic lateral sclerosis: abnormalities of the tongue on magnetic resonance imaging. Ann Neurol. (1989) 25:468–72. doi: 10.1002/ana.410250508
45. Mercuri E, Clements E, Offiah A, Pichiecchio A, Vasco G, Bianco F, et al. Muscle magnetic resonance imaging involvement in muscular dystrophies with rigidity of the spine. Ann Neurol. (2010) 67:201–8. doi: 10.1002/ana.21846
46. Astrea G, Morrow JM, Manzur A, Gunny R, Battini R, Mercuri E, et al. Muscle “islands”: an MRI signature distinguishing neurogenic from myopathic causes of early onset distal weakness. Neuromuscul Disord. (2022) 32:142–9. doi: 10.1016/j.nmd.2021.11.003
47. Wang F, Wu C, Sun C, Liu D, Sun Y, Wang Q, et al. Simultaneous multislice accelerated diffusion tensor imaging of thigh muscles in myositis. AJR Am J Roentgenol. (2018) 211:861–6. doi: 10.2214/AJR.17.19318
48. Longwei X. Clinical application of diffusion tensor magnetic resonance imaging in skeletal muscle. Muscles Ligaments Tendons J. (2012) 2:19–24.
49. Damon BM, Buck AK, Ding Z. Diffusion-tensor MRI based skeletal muscle fiber tracking. Imaging Med. (2011) 3:675–87. doi: 10.2217/iim.11.60
50. Sigmund EE, Baete SH, Luo T, Patel K, Wang D, Rossi I, et al. assessment of the thigh musculature in dermatomyositis and healthy subjects using diffusion tensor imaging, intravoxel incoherent motion and dynamic DTI. Eur Radiol. (2018) 28:5304–15. doi: 10.1007/s00330-018-5458-3
51. Barth M, Breuer F, Koopmans PJ, Norris DG, Poser BA. Simultaneous multislice (SMS) imaging techniques. Magn Reson Med. (2016) 75:63–81. doi: 10.1002/mrm.25897
52. Wang F, Zhang H, Wu C, Wang Q, Hou B, Sun Y, et al. Quantitative T2 mapping accelerated by GRAPPATINI for evaluation of muscles in patients with myositis. Br J Radiol. (2019) 92:20190109. doi: 10.1259/bjr.20190109
53. Kim HK, Laor T, Horn PS, Racadio JM, Wong B, Dardzinski BJ. T2 mapping in Duchenne muscular dystrophy: distribution of disease activity and correlation with clinical assessments. Radiology. (2010) 255:899–908. doi: 10.1148/radiol.10091547
54. Griswold MA, Jakob PM, Heidemann RM, Nittka M, Jellus V, Wang J, et al. Generalized autocalibrating partially parallel acquisitions (GRAPPA). Magn Reson Med. (2002) 47:1202–10. doi: 10.1002/mrm.10171
55. Sumpf TJ, Uecker M, Boretius S, Frahm J. Model-based nonlinear inverse reconstruction for T2 mapping using highly undersampled spin-echo MRI. J Magn Reson Imaging. (2011) 34:420–8. doi: 10.1002/jmri.22634
56. Block KT, Uecker M, Frahm J. Model-based iterative reconstruction for radial fast spin-echo MRI. IEEE Trans Med Imaging. (2009) 28:1759–69. doi: 10.1109/TMI.2009.2023119
57. Hilbert T, Sumpf TJ, Weiland E, Frahm J, Thiran J-P, Meuli R, et al. Accelerated T2 mapping combining parallel MRI and model-based reconstruction: GRAPPATINI. J Magn Reson Imaging. (2018) 48:359–68. doi: 10.1002/jmri.25972
58. Gaeta M, Scribano E, Mileto A, Mazziotti S, Rodolico C, Toscano A, et al. Muscle fat fraction in neuromuscular disorders: dual-echo dual-flip-angle spoiled gradient-recalled MR imaging technique for quantification–a feasibility study. Radiology. (2011) 259:487–94. doi: 10.1148/radiol.10101108
59. Kubínová K, Mann H, Vrána J, Vencovský J. How imaging can assist with diagnosis and monitoring of disease in myositis. Curr Rheumatol Rep. (2020) 22:62. doi: 10.1007/s11926-020-00939-y
60. Mercuri E, Jungbluth H, Muntoni F. Muscle imaging in clinical practice: diagnostic value of muscle magnetic resonance imaging in inherited neuromuscular disorders. Curr Opin Neurol. (2005) 18:526–37. doi: 10.1097/01.wco.0000183947.01362.fe
61. Mercuri E, Pichiecchio A, Allsop J, Messina S, Pane M, Muntoni F. Muscle MRI in inherited neuromuscular disorders: past, present, and future. J Magn Reson Imaging. (2007) 25:433–40. doi: 10.1002/jmri.20804
62. Mercuri E, Pichiecchio A, Counsell S, Allsop J, Cini C, Jungbluth H, et al. A short protocol for muscle MRI in children with muscular dystrophies. Eur J Paediatr Neurol. (2002) 6:305–7. doi: 10.1053/ejpn.2002.0617
63. Kubinova K, Mann H, Vencovsky J. MRI scoring methods used in evaluation of muscle involvement in patients with idiopathic inflammatory myopathies. Curr Opin Rheumatol. (2017) 29:623–31. doi: 10.1097/BOR.0000000000000435
64. Glover GH, Schneider E. Three-point Dixon technique for true water/fat decomposition with B0 inhomogeneity correction. Magn Reson Med. (1991) 18:371–83. doi: 10.1002/mrm.1910180211
65. Hiba B, Richard N, Hébert LJ, Coté C, Nejjari M, Vial C, et al. Quantitative assessment of skeletal muscle degeneration in patients with myotonic dystrophy type 1 using MRI. J Magn Reson Imaging. (2012) 35:678–85. doi: 10.1002/jmri.22849
66. Gloor M, Fasler S, Fischmann A, Haas T, Bieri O, Heinimann K, et al. Quantification of fat infiltration in oculopharyngeal muscular dystrophy: comparison of three MR imaging methods. J Magn Reson Imaging. (2011) 33:203–10. doi: 10.1002/jmri.22431
67. Willis TA, Hollingsworth KG, Coombs A, Sveen M-L, Andersen S, Stojkovic T, et al. Quantitative muscle MRI as an assessment tool for monitoring disease progression in LGMD2I: a multicentre longitudinal study. PLoS ONE. (2013) 8:e70993. doi: 10.1371/journal.pone.0070993
68. Wokke BH, Bos C, Reijnierse M, van Rijswijk CS, Eggers H, Webb A, et al. Comparison of dixon and T1-weighted MR methods to assess the degree of fat infiltration in duchenne muscular dystrophy patients. J Magn Reson Imaging. (2013) 38:619–24. doi: 10.1002/jmri.23998
69. Sinclair CDJ, Morrow JM, Miranda MA, Davagnanam I, Cowley PC, Mehta H, et al. Skeletal muscle MRI magnetisation transfer ratio reflects clinical severity in peripheral neuropathies. J Neurol Neurosurg Psychiatry. (2012) 83:29–32. doi: 10.1136/jnnp.2011.246116
70. Laurent D, Riek J, Sinclair CDJ, Houston P, Roubenoff R, Papanicolaou DA, et al. Longitudinal changes in MRI muscle morphometry and composition in people with inclusion body myositis. Neurology. (2022) 99:e865–76. doi: 10.1212/WNL.0000000000200776
71. Carlier PG. Global T2 versus water T2 in NMR imaging of fatty infiltrated muscles: different methodology, different information and different implications. Neuromuscul Disord. (2014) 24:390–2. doi: 10.1016/j.nmd.2014.02.009
72. Azzabou N, Carlier PG. Fat quantification and T2 measurement. Pediatr Radiol. (2014) 44:1620–1. doi: 10.1007/s00247-014-3038-5
73. Yao L, Yip AL, Shrader JA, Mesdaghinia S, Volochayev R, Jansen AV, et al. Magnetic resonance measurement of muscle T2, fat-corrected T2 and fat fraction in the assessment of idiopathic inflammatory myopathies. Rheumatology. (2016) 55:441–9. doi: 10.1093/rheumatology/kev344
74. Gold GE, Han E, Stainsby J, Wright G, Brittain J. Beaulieu C. Musculoskeletal MRI at 30 T: relaxation times and image contrast. AJR Am J Roentgenol. (2004) 183:343–51. doi: 10.2214/ajr.183.2.1830343
75. Poon CS, Szumowski J, Plewes DB, Ashby P, Henkelman RM. Fat/water quantitation and differential relaxation time measurement using chemical shift imaging technique. Magn Reson Imaging. (1989) 7:369–82. doi: 10.1016/0730-725X(89)90486-4
76. de Bazelaire CM, Duhamel GD, Rofsky NM. Alsop DC. MR imaging relaxation times of abdominal and pelvic tissues measured in vivo at 30 T: preliminary results. Radiology. (2004) 230:652–9. doi: 10.1148/radiol.2303021331
77. Maillard SM, Jones R, Owens C, Pilkington C, Woo P, Wedderburn LR, et al. Quantitative assessment of MRI T2 relaxation time of thigh muscles in juvenile dermatomyositis. Rheumatology. (2004) 43:603–8. doi: 10.1093/rheumatology/keh130
78. Hilario MO, Yamashita H, Lutti D, Len C, Terreri MT, Lederman H. Juvenile idiopathic inflammatory myopathies: the value of magnetic resonance imaging in the detection of muscle involvement. São Paulo Med J. (2000) 118:35–40. doi: 10.1590/S1516-31802000000200002
79. Summers RM, Brune AM, Choyke PL, Chow CK, Patronas NJ, Miller FW, et al. Juvenile idiopathic inflammatory myopathy: exercise-induced changes in muscle at short inversion time inversion-recovery MR imaging. Radiology. (1998) 209:191–6. doi: 10.1148/radiology.209.1.9769831
80. Cea G, Bendahan D, Manners D, Hilton-Jones D, Lodi R, Styles P, et al. Reduced oxidative phosphorylation and proton efflux suggest reduced capillary blood supply in skeletal muscle of patients with dermatomyositis and polymyositis: a quantitative 31P-magnetic resonance spectroscopy and MRI study. Brain. (2002) 125(Pt 7):1635–45. doi: 10.1093/brain/awf163
81. Park JH, Niermann KJ, Ryder NM, Nelson AE, Das A, Lawton AR, et al. Muscle abnormalities in juvenile dermatomyositis patients: P-31 magnetic resonance spectroscopy studies. Arthritis Rheum. (2000) 43:2359–67. doi: 10.1002/1529-0131(200010)43:10<2359::AID-ANR25>3.0.CO;2-D
82. Okuma H, Kurita D, Ohnuki T, Haida M, Shinohara Y. Muscle metabolism in patients with polymyositis simultaneously evaluated by using 31P-magnetic resonance spectroscopy and near-infrared spectroscopy. Int J Clin Pract. (2007) 61:684–9. doi: 10.1111/j.1742-1241.2006.00968.x
83. Park JH, Kari S, King LE Jr, Olsen NJ. Analysis of 31P MR spectroscopy data using artificial neural networks for longitudinal evaluation of muscle diseases: dermatomyositis. NMR Biomed. (1998) 11:245–56. doi: 10.1002/(SICI)1099-1492(199806/08)11:4/5<245::AID-NBM513>3.0.CO;2-4
84. Lodi R, Taylor DJ, Tabrizi SJ, Hilton-Jones D, Squier MV, Seller A, et al. Normal in vivo skeletal muscle oxidative metabolism in sporadic inclusion body myositis assessed by 31P-magnetic resonance spectroscopy. Brain. (1998) 121:2119–26. doi: 10.1093/brain/121.11.2119
85. Domire ZJ, McCullough MB, Chen Q, An KN. Feasibility of using magnetic resonance elastography to study the effect of aging on shear modulus of skeletal muscle. J Appl Biomech. (2009) 25:93–7. doi: 10.1123/jab.25.1.93
86. Bensamoun SF, Ringleb SI, Chen Q, Ehman RL, An KN, Brennan M. Thigh muscle stiffness assessed with magnetic resonance elastography in hyperthyroid patients before and after medical treatment. J Magn Reson Imaging. (2007) 26:708–13. doi: 10.1002/jmri.21073
87. McCullough MB, Domire ZJ, Reed AM, Amin S, Ytterberg SR, Chen Q, et al. Evaluation of muscles affected by myositis using magnetic resonance elastography. Muscle Nerve. (2011) 43:585–90. doi: 10.1002/mus.21923
88. Matsuda N, Kobayashi S, Hasegawa O, Yoshida K, Kubo H, Ugawa Y, et al. Subclinical involvement of the trunk muscles in idiopathic inflammatory myopathies. Acta radiologica open. (2022) 11:20584601221075796. doi: 10.1177/20584601221075796
89. Huang Z-G, Gao B-X, Chen H, Yang M-X, Chen X-L, Yan R, et al. An efficacy analysis of whole-body magnetic resonance imaging in the diagnosis and follow-up of polymyositis and dermatomyositis. PLoS ONE. (2017) 12:e0181069. doi: 10.1371/journal.pone.0181069
90. Tomas X, Milisenda JC, Garcia-Diez AI, Prieto-Gonzalez S, Faruch M, Pomes J, et al. Whole-body MRI and pathological findings in adult patients with myopathies. Skeletal Radiol. (2019) 48:653–76. doi: 10.1007/s00256-018-3107-1
91. Tiniakou E, Mammen AL. Idiopathic inflammatory myopathies and malignancy: a comprehensive review. Clin Rev Allergy Immunol. (2017) 52:20–33. doi: 10.1007/s12016-015-8511-x
92. Limaye V, Luke C, Tucker G, Hill C, Lester S, Blumbergs P, et al. The incidence and associations of malignancy in a large cohort of patients with biopsy-determined idiopathic inflammatory myositis. Rheumatol Int. (2013) 33:965–71. doi: 10.1007/s00296-012-2489-y
93. Oldroyd AGS, Allard AB, Callen JP, Chinoy H, Chung L, Fiorentino D, et al. A systematic review and meta-analysis to inform cancer screening guidelines in idiopathic inflammatory myopathies. Rheumatology. (2021) 60:2615–28. doi: 10.1093/rheumatology/keab166
94. Dobloug C, Garen T, Bitter H, Stjärne J, Stenseth G, Grøvle L, et al. Prevalence and clinical characteristics of adult polymyositis and dermatomyositis; data from a large and unselected Norwegian cohort. Ann Rheum Dis. (2015) 74:1551–6. doi: 10.1136/annrheumdis-2013-205127
95. Targoff IN, Miller FW, Medsger TA Jr, Oddis CV. Classification criteria for the idiopathic inflammatory myopathies. Curr Opin Rheumatol. (1997) 9:527–35. doi: 10.1097/00002281-199711000-00008
96. Luu Q, Day J, Hall A, Limaye V, Major G. External validation and evaluation of adding MRI or extended myositis antibody panel to the 2017 EULAR/ACR myositis classification criteria. ACR Open Rheumatol. (2019) 1:462–8. doi: 10.1002/acr2.11061
97. Bugiardini E, Morrow JM, Shah S, Wood CL, Lynch DS, Pitmann AM, et al. The diagnostic value of MRI pattern recognition in distal myopathies. Front Neurol. (2018) 9:456. doi: 10.3389/fneur.2018.00456
98. Pitt AM, Fleckenstein JL, Greenlee RG Jr, Burns DK, Bryan WW, Haller R. MRI-guided biopsy in inflammatory myopathy: initial results. Magn Reson Imaging. (1993) 11:1093–9. doi: 10.1016/0730-725X(93)90236-7
99. Fionda L, Lauletta A, Leonardi L, Perez JA, Morino S, Merlonghi G, et al. Muscle MRI in immune-mediated necrotizing myopathy (IMNM): implications for clinical management and treatment strategies. J Neurol. (2023) 270:960–74. doi: 10.1007/s00415-022-11447-7
100. Milisenda JC, Collado MV, Pinal-Fernandez I, Jaramillo AH, Bilfeld MF, Cano MD, et al. Correlation between quantitative and semiquantitative magnetic resonance imaging and histopathology findings in dermatomyositis. Clin Exp Rheumatol. (2019) 37:633–40.
101. Monforte M, Bortolani S, Torchia E, Cristiano L, Laschena F, Tartaglione T, et al. Diagnostic magnetic resonance imaging biomarkers for facioscapulohumeral muscular dystrophy identified by machine learning. J Neurol. (2022) 269:2055–63. doi: 10.1007/s00415-021-10786-1
102. Wang F, Zhou S, Hou B, Santini F, Yuan L, Guo Y, et al. Assessment of idiopathic inflammatory myopathy using a deep learning method for muscle T2 mapping segmentation. Eur Radiol. (2022) 33:2350–7. doi: 10.1007/s00330-022-09254-9
103. Zhang L, Guo Z, Zhang H, van der Plas E, Koscik TR, Nopoulos PC, et al. Assisted annotation in deep LOGISMOS: simultaneous multi-compartment 3D MRI segmentation of calf muscles. Med Phys. (2023). doi: 10.1002/mp.16284 [Epub ahead of print].
104. Zaidman CM, van Alfen N. Ultrasound in the assessment of myopathic disorders. J Clin Neurophysiol. (2016) 33:103–11. doi: 10.1097/WNP.0000000000000245
105. Pillen S, Verrips A, van Alfen N, Arts IM, Sie LT, Zwarts MJ. Quantitative skeletal muscle ultrasound: diagnostic value in childhood neuromuscular disease. Neuromuscul Disord. (2007) 17:509–16. doi: 10.1016/j.nmd.2007.03.008
106. Pillen S, Boon A, Van Alfen N. Muscle ultrasound. Handb Clin Neurol. (2016) 136:843–53. doi: 10.1016/B978-0-444-53486-6.00042-9
107. Goyal NA, Mozaffar T, Dimachkie MM. Imaging beyond muscle magnetic resonance imaging in inclusion body myositis. Clin Exp Rheumatol. (2023) 41:386–92. doi: 10.55563/clinexprheumatol/uimkey
108. Weber M-A. Ultrasound in the inflammatory myopathies. Ann N Y Acad Sci. (2009) 1154:159–70. doi: 10.1111/j.1749-6632.2009.04390.x
109. Wu JS, Darras BT, Rutkove SB. Assessing spinal muscular atrophy with quantitative ultrasound. Neurology. (2010) 75:526–31. doi: 10.1212/WNL.0b013e3181eccf8f
110. Pillen S, Arts IM, Zwarts MJ. Muscle ultrasound in neuromuscular disorders. Muscle Nerve. (2008) 37:679–93. doi: 10.1002/mus.21015
111. Brandsma R, Verbeek RJ, Maurits NM, van der Hoeven JH, Brouwer OF, den Dunnen WFA, et al. Visual screening of muscle ultrasound images in children. Ultrasound Med Biol. (2014) 40:2345–51. doi: 10.1016/j.ultrasmedbio.2014.03.027
112. Zaidman CM, Wu JS, Kapur K, Pasternak A, Madabusi L, Yim S, et al. Quantitative muscle ultrasound detects disease progression in Duchenne muscular dystrophy. Ann Neurol. (2017) 81:633–40. doi: 10.1002/ana.24904
113. Jansen M, van Alfen N, Nijhuis van der Sanden MW, van Dijk JP, Pillen S, de Groot IJ. Quantitative muscle ultrasound is a promising longitudinal follow-up tool in Duchenne muscular dystrophy. Neuromuscul Disord. (2012) 22:306–17. doi: 10.1016/j.nmd.2011.10.020
114. Gazeley DJ, Cronin ME. Diagnosis and treatment of the idiopathic inflammatory myopathies. Ther Adv Musculoskelet Dis. (2011) 3:315–24. doi: 10.1177/1759720X11415306
115. Reimers CD, Fleckenstein JL, Witt TN, Müller-Felber W, Pongratz DE. Muscular ultrasound in idiopathic inflammatory myopathies of adults. J Neurol Sci. (1993) 116:82–92. doi: 10.1016/0022-510X(93)90093-E
116. Albayda J, van Alfen N. Diagnostic value of muscle ultrasound for myopathies and myositis. Curr Rheumatol Rep. (2020) 22:82. doi: 10.1007/s11926-020-00947-y
117. Campbell SE, Adler R, Sofka CM. Ultrasound of muscle abnormalities. Ultrasound Q. (2005) 21:87–94. quiz 150, 153–4.
118. Burlina P, Billings S, Joshi N, Albayda J. Automated diagnosis of myositis from muscle ultrasound: exploring the use of machine learning and deep learning methods. PLoS One. (2017) 12:e0184059. doi: 10.1371/journal.pone.0184059
119. Habers GEA, Van Brussel M, Bhansing KJ, Hoppenreijs EP, Janssen AJWM, Van Royen-Kerkhof A, et al. Quantitative muscle ultrasonography in the follow-up of juvenile dermatomyositis. Muscle Nerve. (2015) 52:540–6. doi: 10.1002/mus.24564
120. Vu Q, Cartwright M. Neuromuscular ultrasound in the evaluation of inclusion body myositis. BMJ Case Rep. (2016) 2016. doi: 10.1136/bcr-2016-217440
121. Noto Y-I, Shiga K, Tsuji Y, Kondo M, Tokuda T, Mizuno T, et al. Contrasting echogenicity in flexor digitorum profundus-flexor carpi ulnaris: a diagnostic ultrasound pattern in sporadic inclusion body myositis. Muscle Nerve. (2014) 49:745–8. doi: 10.1002/mus.24056
122. Nodera H, Takamatsu N, Matsui N, Mori A, Terasawa Y, Shimatani Y, et al. Intramuscular dissociation of echogenicity in the triceps surae characterizes sporadic inclusion body myositis. Eur J Neurol. (2016) 23:588–96. doi: 10.1111/ene.12899
123. Abdelnaby R, Mohamed KA, Elgenidy A, Sonbol YT, Bedewy MM, Aboutaleb AM, et al. Muscle sonography in inclusion body myositis: a systematic review and meta-analysis of 944 measurements. Cells. (2022) 11:600. doi: 10.3390/cells11040600
124. Albayda J, Christopher-Stine L, Bingham Iii CO, Paik JJ, Tiniakou E, Billings S, et al. Pattern of muscle involvement in inclusion body myositis: a sonographic study. Clin Exp Rheumatol. (2018) 36:996–1002.
125. Leeuwenberg KE, van Alfen N, Christopher-Stine L, Paik JJ, Tiniakou E, Mecoli C, et al. Ultrasound can differentiate inclusion body myositis from disease mimics. Muscle Nerve. (2020) 61:783–8. doi: 10.1002/mus.26875
126. Fayssoil A, Behin A, Ogna A, Mompoint D, Amthor H, Clair B, et al. Diaphragm: pathophysiology and ultrasound imaging in neuromuscular disorders. J Neuromuscul Dis. (2018) 5:1–10. doi: 10.3233/JND-170276
127. Teixeira A, Cherin P, Demoule A, Levy-Soussan M, Straus C, Verin E, et al. Diaphragmatic dysfunction in patients with idiopathic inflammatory myopathies. Neuromuscul Disord. (2005) 15:32–9. doi: 10.1016/j.nmd.2004.09.006
128. Lelièvre MH, Hudson M, Botez SA, Dubé BP. Determinants and functional impacts of diaphragmatic involvement in patients with inclusion body myositis. Muscle Nerve. (2021) 63:497–505. doi: 10.1002/mus.27170
129. Sekiguchi K, Hashimoto R, Noda Y, Tachibana H, Otsuka Y, Chihara N, et al. Diaphragm involvement in immune checkpoint inhibitor-related myositis. Muscle Nerve. (2019) 60:E23–5. doi: 10.1002/mus.26640
130. Yoshida K, Nishioka M, Matsushima S, Joh K, Oto Y, Yoshiga M, et al. Brief Report: power doppler ultrasonography for detection of increased vascularity in the fascia: a potential early diagnostic tool in fasciitis of dermatomyositis. Arthritis Rheumatol. (2016) 68:2986–91. doi: 10.1002/art.39798
131. Domenichini R, Pialat JB, Podda A, Aubry S. Ultrasound elastography in tendon pathology: state of the art. Skeletal Radiol. (2017) 46:1643–55. doi: 10.1007/s00256-017-2726-2
132. Dirrichs T, Quack V, Gatz M, Tingart M, Kuhl CK, Schrading S. Shear wave elastography (SWE) for the evaluation of patients with tendinopathies. Acad Radiol. (2016) 23:1204–13. doi: 10.1016/j.acra.2016.05.012
133. Mathevon L, Michel F, Aubry S, Testa R, Lapole T, Arnaudeau LF, et al. Two-dimensional and shear wave elastography ultrasound: a reliable method to analyse spastic muscles? Muscle Nerve. (2018) 57:222–8. doi: 10.1002/mus.25716
134. Wu CH, Ho YC, Hsiao MY, Chen WS, Wang TG. Evaluation of post-stroke spastic muscle stiffness using shear wave ultrasound elastography. Ultrasound Med Biol. (2017) 43:1105–11. doi: 10.1016/j.ultrasmedbio.2016.12.008
135. Pichiecchio A, Alessandrino F, Bortolotto C, Cerica A, Rosti C, Raciti MV, et al. Muscle ultrasound elastography and MRI in preschool children with Duchenne muscular dystrophy. Neuromuscul Disord. (2018) 28:476–83. doi: 10.1016/j.nmd.2018.02.007
136. Alfuraih AM, O'Connor P, Tan AL, Hensor EMA, Ladas A, Emery P, et al. Muscle shear wave elastography in idiopathic inflammatory myopathies: a case-control study with MRI correlation. Skeletal Radiol. (2019) 48:1209–19. doi: 10.1007/s00256-019-03175-3
137. Paramalingam S, Needham M, Harris S, O'Hanlon S, Mastaglia F, Keen H. Muscle B mode ultrasound and shear-wave elastography in idiopathic inflammatory myopathies (SWIM): criterion validation against MRI and muscle biopsy findings in an incident patient cohort. BMC Rheumatol. (2022) 6:47. doi: 10.1186/s41927-022-00276-w
138. Li M, Guo R, Tang X, Huang S, Qiu L. Quantitative assessment of muscle properties in polymyositis and dermatomyositis using high-frequency ultrasound and shear wave elastography. Quant Imaging Med Surg. (2023) 13:428–40. doi: 10.21037/qims-22-423
139. Uçar E. Classification of myositis from muscle ultrasound images using deep learning. Biomed Signal Process Control. (2022) 71:103277. doi: 10.1016/j.bspc.2021.103277
140. Wijntjes J, van der Hoeven J, Saris CGJ, Doorduin J, van Alfen N. Visual versus quantitative analysis of muscle ultrasound in neuromuscular disease. Muscle Nerve. (2022) 66:253–61. doi: 10.1002/mus.27669
141. Walter AW, Lim J, Raaphorst J, Smithuis FF, den Harder JM, Eftimov F, et al. Ultrasound and MR muscle imaging in new onset idiopathic inflammatory myopathies at diagnosis and after treatment: a comparative pilot study. Rheumatology. (2022) 62:300–9. doi: 10.1093/rheumatology/keac263
142. Hamel J, Lee P, Glenn MD, Burka T, Choi I-Y, Friedman SD, et al. Magnetic resonance imaging correlates with electrical impedance myography in facioscapulohumeral muscular dystrophy. Muscle Nerve. (2020) 61:644–9. doi: 10.1002/mus.26792
143. Ogunnika OT, Rutkove SB, Ma H, Fogerson PM, Scharfstein M, Cooper RC, et al. A portable system for the assessment of neuromuscular diseases with electrical impedance myography. J Med Eng Technol. (2010) 34:377–85. doi: 10.3109/03091902.2010.500347
144. Rutkove SB. Electrical impedance myography: background, current state, and future directions. Muscle Nerve. (2009) 40:936–46. doi: 10.1002/mus.21362
145. Rutkove SB. Electrical impedance myography: MRI-like data without the need for MRI. Muscle Nerve. (2020) 61:554–6. doi: 10.1002/mus.26832
146. Rutkove SB, Sanchez B. Electrical impedance methods in neuromuscular assessment: an overview. Cold Spring Harb Perspect Med. (2019) 9:a034405. doi: 10.1101/cshperspect.a034405
147. Mortreux M, Semple C, Riveros D, Nagy JA, Rutkove SB. Electrical impedance myography for the detection of muscle inflammation induced by lambda-carrageenan. PLoS ONE. (2019) 14:e0223265. doi: 10.1371/journal.pone.0223265
148. Rutkove SB, Aaron R, Shiffman CA. Localized bioimpedance analysis in the evaluation of neuromuscular disease. Muscle Nerve. (2002) 25:390–7. doi: 10.1002/mus.10048
149. Chin AB, Garmirian LP, Nie R, Rutkove SB. Optimizing measurement of the electrical anisotropy of muscle. Muscle Nerve. (2008) 37:560–5. doi: 10.1002/mus.20981
150. Esper GJ, Shiffman CA, Aaron R, Lee KS, Rutkove SB. Assessing neuromuscular disease with multifrequency electrical impedance myography. Muscle Nerve. (2006) 34:595–602. doi: 10.1002/mus.20626
151. Aaron R, Huang M, Shiffman CA. Anisotropy of human muscle via non-invasive impedance measurements. Phys Med Biol. (1997) 42:1245–62. doi: 10.1088/0031-9155/42/7/002
152. Shiffman CA, Aaron R. Angular dependence of resistance in non-invasive electrical measurements of human muscle: the tensor model. Phys Med Biol. (1998) 43:1317–23. doi: 10.1088/0031-9155/43/5/019
153. Tarulli A, Esper GJ, Lee KS, Aaron R, Shiffman CA, Rutkove SB. Electrical impedance myography in the bedside assessment of inflammatory myopathy. Neurology. (2005) 65:451–2. doi: 10.1212/01.wnl.0000172338.95064.cb
154. Roy B, Rutkove SB, Nowak RJ. Electrical impedance myography as a biomarker of inclusion body myositis: a cross-sectional study. Clin Neurophysiol. (2020) 131:368–71. doi: 10.1016/j.clinph.2019.10.030
155. Kolb SJ, Coffey CS, Yankey JW, Krosschell K, Arnold WD, Rutkove SB, et al. Baseline results of the NeuroNEXT spinal muscular atrophy infant biomarker study. Ann Clin Transl Neurol. (2016) 3:132–45. doi: 10.1002/acn3.283
156. Bentick G, Fairley J, Nadesapillai S, Wicks I, Day J. Defining the clinical utility of PET or PET-CT in idiopathic inflammatory myopathies: a systematic literature review. Semin Arthritis Rheum. (2022) 57:152107. doi: 10.1016/j.semarthrit.2022.152107
157. Owada T, Maezawa R, Kurasawa K, Okada H, Arai S, Fukuda T. Detection of inflammatory lesions by f-18 fluorodeoxyglucose positron emission tomography in patients with polymyositis and dermatomyositis. J Rheumatol. (2012) 39:1659–65. doi: 10.3899/jrheum.111597
158. Pipitone N, Versari A, Zuccoli G, Levrini G, Macchioni P, Bajocchi G, et al. 18F-Fluorodeoxyglucose positron emission tomography for the assessment of myositis: a case series. Clin Exp Rheumatol. (2012) 30:570−3.
159. Tateyama M, Fujihara K, Misu T, Arai A, Kaneta T, Aoki M. Clinical values of FDG PET in polymyositis and dermatomyositis syndromes: imaging of skeletal muscle inflammation. BMJ Open. (2015) 5:e006763. doi: 10.1136/bmjopen-2014-006763
160. Lilleker JB, Hodgson R, Roberts M, Herholz K, Howard J, Hinz R, et al. [18F]Florbetapir positron emission tomography: identification of muscle amyloid in inclusion body myositis and differentiation from polymyositis. Ann Rheum Dis. (2019) 78:657–62. doi: 10.1136/annrheumdis-2018-214644
161. Maetzler W, Reimold M, Schittenhelm J, Vorgerd M, Bornemann A, Kötter I, et al. Increased [11C]PIB-PET levels in inclusion body myositis are indicative of amyloid β deposition. J Neurol Neurosurg Psychiatry. (2011) 82:1060–2. doi: 10.1136/jnnp.2009.197640
162. Noto Y-I, Kondo M, Tsuji Y, Matsushima S, Mizuno T, Tokuda T, et al. Diagnostic value of muscle [(11)C] PIB-PET in inclusion body myositis. Front Neurol. (2019) 10:1386. doi: 10.3389/fneur.2019.01386
163. Motegi SI, Fujiwara C, Sekiguchi A, Hara K, Yamaguchi K, Maeno T, et al. Clinical value of (18) F-fluorodeoxyglucose positron emission tomography/computed tomography for interstitial lung disease and myositis in patients with dermatomyositis. J Dermatol. (2019) 46:213–8. doi: 10.1111/1346-8138.14758
164. Selva-O'Callaghan A, Gil-Vila A, Simó-Perdigó M, Trallero-Araguás E, Alvarado-Cárdenas M, Pinal-Fernandez I. PET scan: nuclear medicine imaging in myositis. Curr Rheumatol Rep. (2019) 21:64. doi: 10.1007/s11926-019-0864-3
165. Díaz-Manera J, Walter G, Straub V. Skeletal muscle magnetic resonance imaging in Pompe disease. Muscle Nerve. (2021) 63:640–50. doi: 10.1002/mus.27099
166. Bardakov SN, Tsargush VA, Carlier PG, Nikitin SS, Kurbatov SA, Titova AA, et al. Magnetic resonance imaging pattern variability in dysferlinopathy. Acta Myol. (2021) 40:158–71. doi: 10.36185/2532-1900-059
Keywords: myositis—diagnosis, imaging, MRI, inclusion body myositis (IBM), electrical impedance myography, muscle ultrasound
Citation: Zubair AS, Salam S, Dimachkie MM, Machado PM and Roy B (2023) Imaging biomarkers in the idiopathic inflammatory myopathies. Front. Neurol. 14:1146015. doi: 10.3389/fneur.2023.1146015
Received: 16 January 2023; Accepted: 03 April 2023;
Published: 25 April 2023.
Edited by:
Merrilee Needham, Fiona Stanley Hospital, AustraliaReviewed by:
Yuwei Da, Capital Medical University, ChinaFederica Montagnese, LMU Munich University Hospital, Germany
Copyright © 2023 Zubair, Salam, Dimachkie, Machado and Roy. This is an open-access article distributed under the terms of the Creative Commons Attribution License (CC BY). The use, distribution or reproduction in other forums is permitted, provided the original author(s) and the copyright owner(s) are credited and that the original publication in this journal is cited, in accordance with accepted academic practice. No use, distribution or reproduction is permitted which does not comply with these terms.
*Correspondence: Bhaskar Roy, Ymhhc2thci5yb3lAeWFsZS5lZHU=
†These authors share senior authorship