 Luis A. Sierra1*
 Clementina J. Ullman1
 Clara Baselga-Garriga2
 Sarbesh R. Pandeya1
 Samuel A. Frank1,2
 Simon Laganiere1,2
- 1Department of Neurology, Beth Israel Deaconess Medical Center, Boston, MA, United States
- 2Harvard Medical School, Boston, MA, United States
Background: Cognitive decline in Huntington’s disease (HD) begins early in the disease course, however the reported prevalence and severity of cognitive impairment varies based on diagnostic approach. A Movement Disorders Society Task Force recently endorsed the use of standardized DSM-5-based criteria to diagnose neurocognitive disorder (NCD) in Huntington’s disease.
Objectives: To determine the prevalence and severity of cognitive impairment across different stages of HD by applying NCD criteria (mild and major) to participant data from the Enroll-HD database.
Methods: Enroll-HD participants were triaged into either premanifest (preHD), manifest or control groups. PreHD was further dichotomized into preHD near or preHD far based on predicted time to diagnosis using the scaled CAG-age product score (CAPs). Embedded cognitive performance and functional independence measures were used to determine prevalence of NCD (mild and major) for all groups.
Results: Prevalence of NCD-mild was 25.2%–38.4% for manifest HD, 22.8%–47.3% for preHD near, 11.5%–25.1% for preHD far, and 8.8%–19.1% for controls. Prevalence of NCD-major was 21.1%–57.7% for manifest HD, 0.5%–16.3% for preHD near, 0.0%–4.5% for preHD far, and 0.0%–3.0% for controls.
Conclusion: The prevalence of NCD in HD is elevated in preHD and demonstrates a sharp rise prior to diagnosis. In manifest HD, the vast majority of participants meet criteria for NCD. These findings are important for optimizing clinical care and/or anticipating the need for supportive services.
Introduction
Huntington’s disease (HD) is a progressive disease characterized by a triad of symptoms, including movement abnormalities, cognitive impairment, and behavioral disturbances. While all three domains are typically involved, the diagnosis of manifest HD is confirmed by the presence of unequivocal motor signs. Although motor signs can be striking, cognitive impairment typically exerts a larger functional impact (1–3), appears earlier (4), and correlates with both early job termination (5) and impaired driving ability (6). Despite numerous studies demonstrating cognitive decline in both pre-motor manifest stage (preHD) and manifest HD (4), there is currently no standard approach for diagnosing cognitive impairment in this disease. As a result, the prevalence of cognitive impairment across different HD stages remains unclear. The lack of specific and standardized diagnostic criteria may obscure current or upcoming patient needs and has important implications for patients seeking workplace accommodations or disability (7).
In an effort to quantify cognitive impairment in HD, prior studies used the MCI model (8). Studies analyzing the PREDICT-HD database, for example, reported an MCI prevalence of 40% in preHD and 54% in prodromal participants (9). However, this framework was originally tailored to identify early symptoms of Alzheimer’s, prioritizing episodic memory loss and subjective decline (8). In contrast, HD patients often exhibit early deficits in executive functioning and are frequently unaware of their condition (i.e., anosognosia) (10–12). While the definition and use of the term of MCI has broadened since its original inception, and can include deficits in other domains, the definition of MCI in HD is not currently anchored to a single authoritative source. In recognition of potential limitation regarding terminology and criteria, the Movement Disorder Society Task Force for diagnostic classifications of HD (13) recently recommended using DSM-5-based criteria to classify HD-related cognitive impairment as either neurocognitive disorder mild (NCD-mild) or major (NCD-major) (Supplementary Figure S1) (14).
The primary potential benefits of using this framework are manifold: (1) it moves away from terminology that might still be associated primarily with Alzheimer’s disease, (2) it establishes a consistent standard across a variety of disciplines, including neurology, psychiatry, and neuropsychology, allowing for the synchronization and standardization of practices, (3) it encourages the use of quantitative thresholds, norms, and standard deviations to gauge the stage of impairment more accurately and (4) by linking the terminology and criteria to the DSM, this framework facilitates swift and substantial updates to current practices, ensuring that the field stays up-to-date with the latest definitions. Criteria for NCD-mild and NCD-major outline specific functional and cognitive performance thresholds for both diagnoses. NCD-mild is defined as a “modest” deviation from normative values (between 1–2 SD) and NCD-major requires both “substantial” deviation from the norm (>2 SD below the norm) as well as interference with independence in everyday activities in the absence of delirium. Although the prevalence of MCI has been reported across stages of HD, to our knowledge DSM-5-based criteria for NCD have not yet been applied to characterize this disease.
In this brief report, we used DSM-5 criteria for neurocognitive disorder to obtain an estimate of NCD prevalence in preHD (both near and far from predicted diagnosis) and manifest HD using Enroll-HD, the largest observational research platform in HD.1 We started by using the cognitive performance values and functional independence measures already present in the database but omitted MMSE and Trail Making Test due to concerns regarding floor/ceiling effects and non-normal distributions in the Enroll-HD dataset (15). It is important to emphasize that the cognitive assessments employed in this study are limited in their ability to fully capture all the cognitive impairments resulting from HD. Therefore, the results presented herein should be interpreted as a conservative estimate of NCD prevalence in this disease.
Methods
Participants
All participants analyzed in this study were selected from the Enroll-HD database and gave written consent to voluntarily participate in a yearly assessment as approved by local IRBs. Enroll-HD Periodic dataset (profile and enroll visit based specifically) was obtained through a data use agreement with cure Huntington’s disease initiative. Data included assessments of HD participants and healthy controls at their baseline and follow up visits between 2012–2022 (data cut 03/17/2022) across multiple approved US sites.2
Data analysis
The Enroll-HD periodic dataset (PDS) obtained initially included 8,016 participants. Due to regulatory concerns related to General Data Protection Regulation (GDPR), only US-based data was transferred and analyzed. We applied category label filters of premanifest, manifest and controls. PreHD participants in the Enroll-HD database were defined, per protocol, as individuals without clinical features of manifest HD, as assessed and labeled by individual site investigators. Inclusion criteria for HD were: confirmed genetic diagnosis of mHTT with CAG repeats ≥36, age between 18 and 78. Inclusion criteria for controls were: a label of either gene negative or family control and age between 18–78. The upper age cutoff of 78 was imposed by the age limit when converting to scaled scores (see below).
Each participant’s baseline visit was assessed along four dimensions of the Unified Huntington’s Disease Rating Scale (UHDRS™): functional independence (Independence Scale, IS); motor signs (UHDRS™ Total Motor Score, TMS), cognition (SCWT, SDMT, and FAS) and diagnostic confidence level (DCL). To prevent the influence of erroneous entries or outliers, we excluded data with implausible values based on score parameters. The following ranges (which represent minimal-maximal scores) were used for all cohorts: IS (0–100), TMS (0–124), and DCL (0–4). The range for cognitive testing on all participants was between 0 and maximal possible test score or set to a threshold that was above the highest observed performance in the dataset. Therefore, the ranges were the following: SDMT (0–110 correct responses), FAS (0–100 total words), and SWRT (0–149 correct responses for each subtest). The preHD cohort was further dichotomized into either preHD near or preHD far using a CAG-age product scaled (CAPs) score (CAPs = Age0 × (CAG − 33.66)/ 432.3326) of 0.85, which is equivalent to 7.59 years from predicted onset (16). In other words, preHD participants with CAPs >0.85 were included in the preHD near subgroup.
Neuropsychological/functional assessments
Each participant’s cognition was assessed using SCWT (17), SDMT (18), and FAS (8). Performance on each cognitive test was converted from raw scores to scaled scores based on a combination of age and education per the following normative manuals: SCWT (19), FAS (20), SDMT (21). We then calculated the number of individuals impaired on each cognitive test using their scaled scores and a range of 1–2 standard deviations (SD) below the mean for NCD-mild, as recommended by DSM-5 (14). For NCD-major, participants needed to demonstrate “substantial” cognitive deficits that interfered with independence in everyday activities. Fortunately, the Enroll-HD database also includes the UHDRS™ Independence scale, which ranges from 0 to 100 with higher scores indicating better functioning. A score of 80 is defined as “pre-disease level of employment changes or ends; cannot perform household chores to pre-disease level, and may need help with finance” (22). Therefore, participants with both ≥2 SD below the mean on cognitive testing and (IS) ≤80 were classified as having NCD-major. Participants that met only 1 of 2 criteria for NCD-major were classified as NCD-mild.
Statistical analysis
All of our results, including the assessment of group means and standard deviations, data filtration and exclusion, were managed in R 4.2.1 (R Foundation for Statistical Computing, Vienna, Austria). To calculate the prevalence of NCD, we determined the number of participants in each subgroup (near, far, manifest and controls) who met criteria for NCD-mild and NCD-major (using performance on each cognitive assessment) and divided that number by each subgroup total. This resulted in a prevalence of NCD for each cognitive assessment (Figure 1). In other words, impairment on any one cognitive test implies impairment in at least one cognitive domain targeted by that test, which fulfills the requirement for NCD, as outlined by DSM-5 and MDS. NCD prevalence is therefore shown as a range, depending on the cognitive assessment used. Since the criteria can be fulfilled with an impairment in any one cognitive area, and it is impossible to cover all domains with the limited test battery, the prevalence of NCD is at least as high as the upper end of the reported range. Unpaired T-tests were used for all group comparisons except for sex, which was compared using 𝛸2 (Table 1).
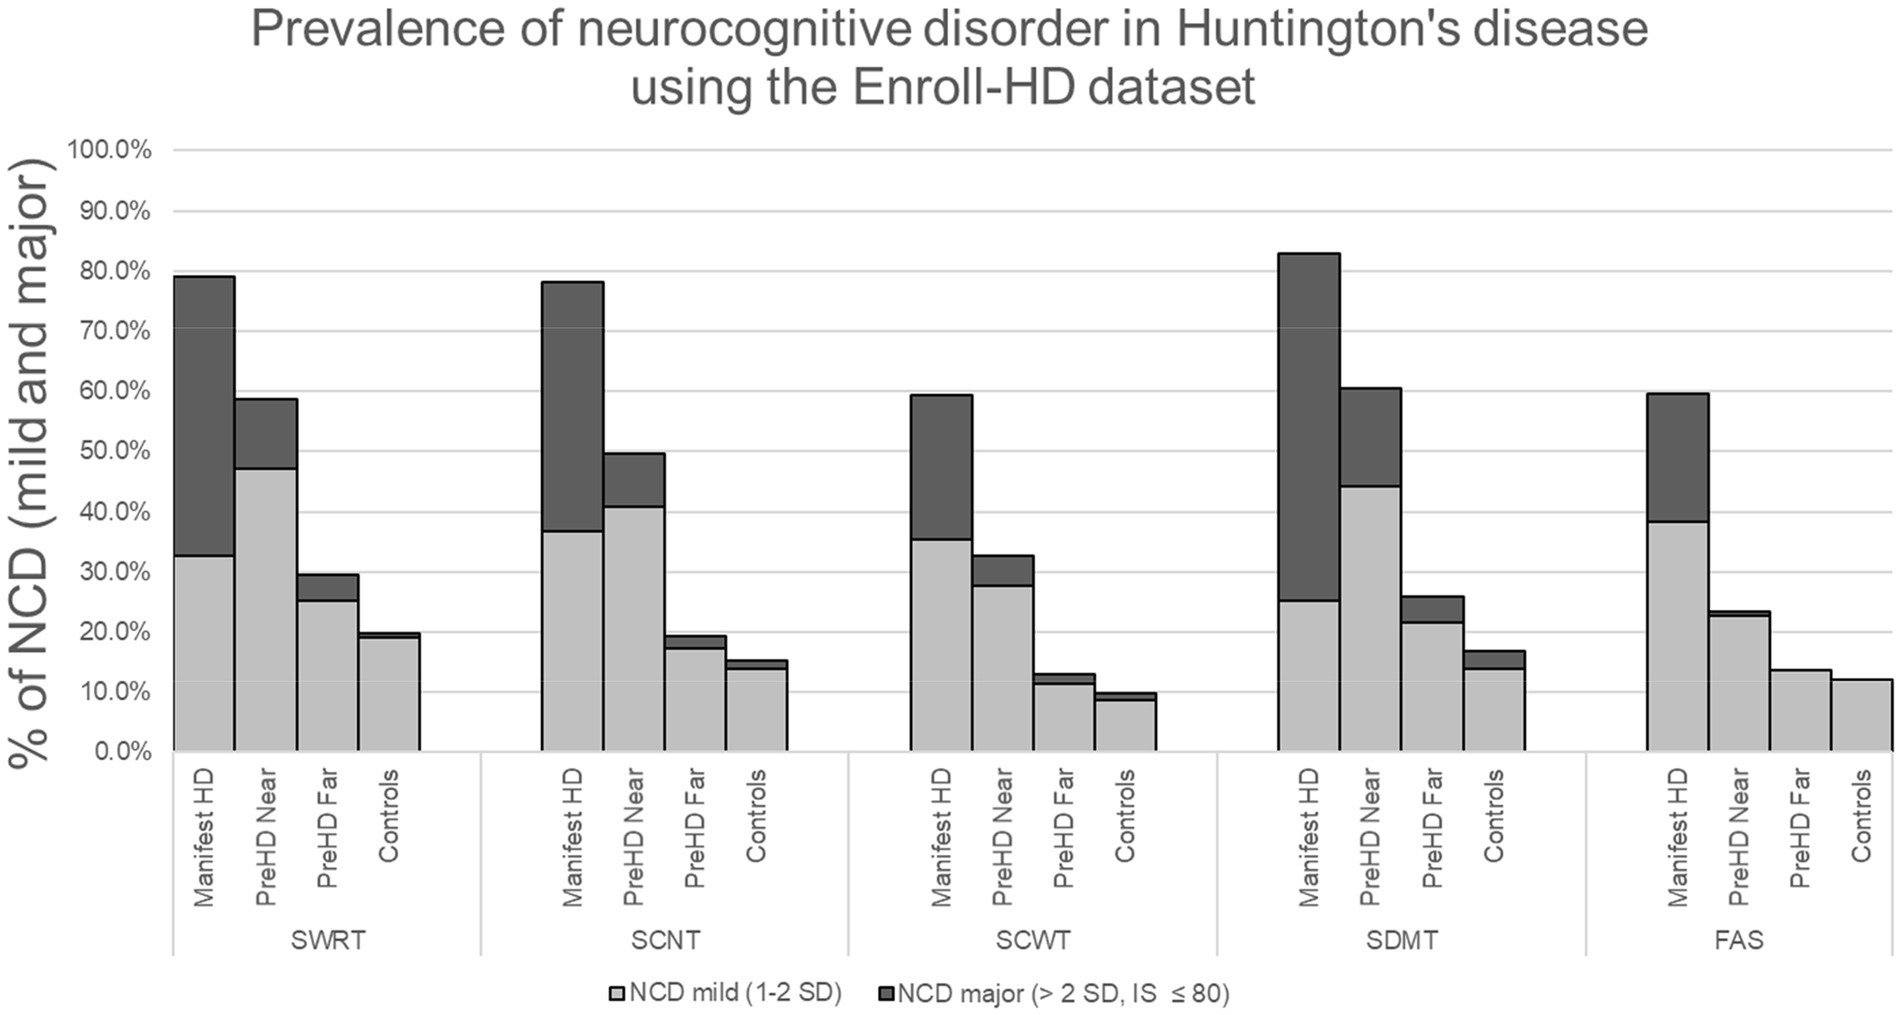
Figure 1. *Stroop word reading test (SWRT), Stroop color naming test (SCNT), Stroop color-word test, symbol digit modalities test (SDMT), verbal fluency (FAS), neurocognitive disorder (NCD).

Table 1. Demographics and cognitive testing.
Results
To maintain consistent sample size and simplify the analysis across all variables we removed any participant if they had any erroneous entry codes such as (9,998 or 9,997), blanks or outliers for any variable and then applied inclusion–exclusion criteria as noted in the methods. 2,409 participants were removed from the analysis (1,117 were removed because of erroneous entries or outliers and 1,292 due to exclusion criteria). This left a cohort of 5,610 participants that included 1,967 labeled as manifest HD, 601 as preHD near, 1,070 as preHD far, and 1,969 controls. The mean ± SD for age, education (International Standard Classification of Education, ISCED), sex, CAG, TMS, TFC, and IS can be seen on Table 1. Prevalence of NCD-mild exhibited a range, depending on cognitive assessment, of 25.2%–38.4% for manifest HD, 22.8%–47.3% for preHD near, 11.5%–25.1% for preHD far, and 8.8%–19.1% for controls. Prevalence of NCD-major was 21.1%–57.7% for manifest HD, 0.5%–16.3% for preHD near, 0.0%–4.5% for preHD far, and 0.0%–3.0% for controls. The total prevalence of NCD (mild + major) in HD had the following ranges: manifest HD: 59.4%–82.9%; preHD near: 23.3%–60.6%; preHD far: 13.0%–29.5% and controls: 9.9%–19.9%. Table 1 shows the mean scores ± SD for each cognitive test. The number and percent of participants with both NCD-mild and NCD-major is shown on Table 2 and Figure 1. Group comparisons are shown on Table 1.

Table 2. Cognitive testing performance.
Discussion
In this study, we investigated the prevalence of neurocognitive disorder at various stages of Huntington’s disease using Enroll-HD, the largest publicly available HD database. Using an approach recommended by both the Movement Disorder Society and DSM-5, a conservative estimate for the prevalence of NCD in HD is 82.9% for manifest HD, 60.6% for preHD (<7.6 years from diagnosis), 29.5% for preHD far (>7.6 years from diagnosis), and 19.9% for control. These data demonstrate an elevated rate of NCD across many stages of HD and underline the acceleration of cognitive decline as preHD participants approach the manifest stage (13). These results are consistent with reports of MCI in preHD of between 40%–54% (8, 9) and extend these findings using the largest available HD research platform.
The high prevalence of cognitive impairment using NCD criteria on tests already embedded within the Enroll-HD study highlights important issues. First, NCD is likely under-recognized and/or underreported in clinical settings, especially in premanifest stages. As a result, opportunities for documenting NCD early in the disease course may be overlooked, which can lead to difficulty establishing a timeline for disability (23). Second, given the high incidence of symptom denial or anosognosia in HD (10–12), a diagnosis of NCD-mild, in particular, could alert the physician, patient or family to the presence of early deficits, which could accelerate the implementation of important safety measures (e.g., driving recommendations) or workplace accommodations.
There are some limitations to our study. The data acquired from Enroll-HD was limited to participants in the United States and excluded participants without genetic testing. These factors could have affected the overall generalizability of our results. Investigators across numerous different sites were responsible for labeling each HD participant as either pre-manifest and manifest. The theoretical use of varied or idiosyncratic thresholds or definitions for these labels could have influenced the result. Reassuringly, however, the rates of NCD-major are relatively small in the preHD far group; they also progressively increase with each stage. Overall, variability in participant labeling was likely minimized by the large sample size. DSM-5 criteria use the terms “modest” and “substantial” to describe the severity of cognitive impairment associated with mild and major NCD, respectively (14). These terms are associated with inherently arbitrary cutoffs. We used a performance cutoff of >1 SD for modest and >2 SD for substantial impairment, which is consistent with prior literature (24) and DSM-5 guidelines (14). The manifest HD group was, on average, older, included more males and had slightly fewer years of education than the other groups. These three factors could have led to slightly worse performance on cognitive testing and increased NCD prevalence in the manifest group. At the same time, these confounding effects should have been minimized by the use of scores that were scaled by age and education. Variables unaccounted for in the analysis, such as depression, anxiety, medication effects, testing environment or the presence of other preexisting developmental or neurological comorbidities could have influenced cognitive performance, future studies investigating the reliability of these results using longitudinal analyses of NCD in Enroll-HD would mitigate some of these concerns. The Enroll-HD cognitive tests used in this analysis are admittedly limited and likely insufficient to characterize the full spectrum of neurocognitive dysfunction in HD. In this regard, however, our results likely represent an underestimate, rather than an overestimate, of the actual prevalence of NCD at various stages of HD. Further research should continue to evaluate the sensitivity of other cognitive assessments for capturing cognitive decline in HD.
In conclusion, this report assessed the prevalence of neurocognitive disorder (mild and major) in premanifest HD (both near and far from predicted diagnosis) and manifest HD by applying DSM-5 criteria to cognitive performance measures embedded in the Enroll-HD database. NCD prevalence is elevated early in the disease course and appears to accelerate in the premanifest stage prior to predicted diagnosis. By the manifest stage, the vast majority of patients meet criteria for NCD. These findings have important research and clinical implications for the HD community.
Data availability statement
Publicly available datasets were analyzed in this study. This data can be found at: https://www.enroll-hd.org/for-researchers/pds-data-explorer/.
Ethics statement
The studies involving human participants were reviewed and approved by BIDMC Institutional Review Board. The patients/participants provided their written informed consent to participate in this study.
Author contributions
LS and SL: conception, organization, execution, writing of the first draft, and review and critique. CU: conception, organization, execution, and review and critique. CB-G: writing of the first draft and review and critique. SP: design and execution. SF: conception, organization, and review and critique. All authors contributed to the article and approved the submitted version.
Acknowledgments
The authors thank Allison Bartlett, Esq. Senior Manager of Disability Programs at the Huntington’s Disease Society of America (HDSA) for professional implications on plausible legal outcomes for those with Huntington’s disease.
Conflict of interest
The authors declare that the research was conducted in the absence of any commercial or financial relationships that could be construed as a potential conflict of interest.
Publisher’s note
All claims expressed in this article are solely those of the authors and do not necessarily represent those of their affiliated organizations, or those of the publisher, the editors and the reviewers. Any product that may be evaluated in this article, or claim that may be made by its manufacturer, is not guaranteed or endorsed by the publisher.
Supplementary material
The Supplementary material for this article can be found online at: https://www.frontiersin.org/articles/10.3389/fneur.2023.1198145/full#supplementary-material
Footnotes
References
1. Schumacher-Kuiper, MM, van Loon, AM, Peeters, CFW, Ekkel, MR, Hertogh, CMPM, and Veenhuizen, RB. Is there a relation between caregiver burden and cognitive dysfunction in Huntington’s disease? J Psychosoc Rehabil Ment Health. (2021) 8:61–71. doi: 10.1007/s40737-020-00202-8
2. Domaradzki, J. The impact of Huntington disease on family carers: a literature overview. Psychiatr Pol. (2015) 49:931–44. doi: 10.12740/PP/34496
3. Simpson, JA, Lovecky, D, Kogan, J, Vetter, LA, and Yohrling, GJ. Survey of the Huntington’s disease patient and caregiver community reveals most impactful symptoms and treatment needs. J Huntingtons Dis. (2016) 5:395–403. doi: 10.3233/JHD-160228
4. Paulsen, JS, Langbehn, DR, Stout, JC, Aylward, E, Ross, CA, Nance, M, et al. Detection of Huntington’s disease decades before diagnosis: the predict-HD study. J Neurol Neurosurg Psychiatry. (2008) 79:874–80. doi: 10.1136/jnnp.2007.128728
5. Watkins, K, Purks, J, Kumar, A, Sokas, RK, Heller, H, and Anderson, KE. Huntington’s disease and employment: the relative contributions of cognitive and motor decline to the decision to leave work. J Huntingtons Dis. (2018) 7:367–77. doi: 10.3233/JHD-180296
6. Biglan, KM, Zhang, Y, Long, JD, Geschwind, M, Kang, GA, Killoran, A, et al. Refining the diagnosis of Huntington’s disease: the PREDICT-HD study. Front Aging Neurosci. (2013) 5:12. doi: 10.3389/fnagi.2013.00012
7. Goh, AMY, You, E, Perin, S, Clay, FJ, Loi, S, Ellis, K, et al. Predictors of workplace disability in a premanifest Huntington’s disease cohort. J Neuropsychiatry Clin Neurosci. (2018) 30:115–21. doi: 10.1176/appi.neuropsych.17040086
8. Rosen, WG. Verbal fluency in aging and dementia. J Clin Neuropsychol. (1980) 2:135–46. doi: 10.1080/01688638008403788
10. Considine, CM, Hughes, S, Sellers Gibson, J, Isaacs, D, McDonell, K, Darby, RR, et al. Anosognosia and memory encoding in Huntington disease. Cogn Behav Neurol. (2022) 35:40–8. doi: 10.1097/WNN.0000000000000293
11. Wibawa, P, Zombor, R, Dragovic, M, Hayhow, B, Lee, J, Panegyres, PK, et al. Anosognosia is associated with greater caregiver burden and poorer executive function in Huntington disease. J Geriatr Psychiatry Neurol. (2020) 33:52–8. doi: 10.1177/0891988719856697
12. Sitek, EJ, Thompson, JC, Craufurd, D, and Snowden, JS. Unawareness of deficits in Huntington’s disease. J Huntingtons Dis. (2014) 3:125–35. doi: 10.3233/JHD-140109
13. Ross, CA, Reilmann, R, Cardoso, F, McCusker, EA, Testa, CM, Stout, JC, et al. Movement Disorder Society task force viewpoint: Huntington’s disease diagnostic categories. Mov Disord Clin Pract. (2019) 6:541–6. doi: 10.1002/mdc3.12808
14. Stroop, JR. Studies of interference in serial verbal reactions. J Exp Psychol. (1985) 18:643–62. doi: 10.1037/h0054651
15. American Psychiatric Association. Neurocognitive disorders. Diagnostic and statistical manual of mental disorders. Washington, DC: American Psychiatric Publishing. (5). (2013) 591–643.
16. Abreu, D, Ware, J, Georgiou-Karistianis, N, Leavitt, BR, Fitzer-Attas, CJ, Lobo, R, et al. Utility of Huntington's disease assessments by disease stage: floor/ceiling effects. Front Neurol. (2021) 12:595679. doi: 10.3389/fneur.2021.595679
17. Duff, K, Paulsen, J, Mills, J, Beglinger, LJ, Moser, DJ, Smith, MM, et al. Mild cognitive impairment in pre-diagnosed Huntington disease. Neurology. (2010) 75:500–7. doi: 10.1212/WNL.0b013e3181eccfa2
18. Zhang, Y, Long, JD, Mills, JA, Warner, JH, Lu, W, Paulsen, JS, et al. PREDICT-HD Investigators and Coordinators of the Huntington Study Group. Indexing disease progression at study entry with individuals at-risk for Huntington’s disease. Am J Med Genet B Neuropsychiatr Genet. (2011) 156B:751–63. doi: 10.1002/ajmg.b.31232
20. Golden, CJ, and Freshwater, SM. The stroop color and word test: a manual for clinical and experimental uses. Chicago, IL: Stoelting (2002).
21. Kieburtz, K, Penney, JB, Como, P, Ranen, N, Feigin, A, Abwender, D, et al. Unified Huntington's disease rating scale: reliability and consistency. Mov Disord. (1996) 11:136–42. doi: 10.1002/mds.870110204
22. Tombaugh, TN, Kozak, J, and Rees, L. Normative data stratified by age and education for two measures of verbal fluency: FAS and animal naming. Arch Clin Neuropsychol. (1999) 14:167–77.
23. Brossman, B, Williams, JK, Downing, N, Mills, JA, and Paulsen, JS, PREDICT-HD Investigators and Coordinators of the Huntington Study Group. Development of the Huntington disease work function scale. J Occup Environ Med. (2012) 54:1300–8. doi: 10.1097/JOM.0b013e31825f30ab
Keywords: Huntington’s disease, cognition, neurocognitive disorders (NCD), pre-motor manifest, DSM-5
Citation: Sierra LA, Ullman CJ, Baselga-Garriga C, Pandeya SR, Frank SA and Laganiere S (2023) Prevalence of neurocognitive disorder in Huntington’s disease using the Enroll-HD dataset. Front. Neurol. 14:1198145. doi: 10.3389/fneur.2023.1198145
Edited by:
Mattia Siciliano, University of Campania Luigi Vanvitelli, ItalyReviewed by:
Noa Bregman, Tel Aviv Sourasky Medical Center, IsraelJane Paulsen, University of Wisconsin-Madison, United States
Copyright © 2023 Sierra, Ullman, Baselga-Garriga, Pandeya, Frank and Laganiere. This is an open-access article distributed under the terms of the Creative Commons Attribution License (CC BY). The use, distribution or reproduction in other forums is permitted, provided the original author(s) and the copyright owner(s) are credited and that the original publication in this journal is cited, in accordance with accepted academic practice. No use, distribution or reproduction is permitted which does not comply with these terms.
*Correspondence: Luis A. Sierra, THNpZXJyYTFAYmlkbWMuaGFydmFyZC5lZHU=